Bacillus velezensis HBXN2020 alleviates Salmonella Typhimurium infection in mice by improving intestinal barrier integrity and reducing inflammation
- National Key Laboratory of Agricultural Microbiology, Hubei Hongshan Laboratory, Huazhong Agricultural University, China
- College of Veterinary Medicine, Huazhong Agricultural University, China
- Key Laboratory of Preventive Veterinary Medicine in Hubei Province, the Cooperative Innovation Center for Sustainable Pig Production, China
Figures
Figure 1 with 1 supplement
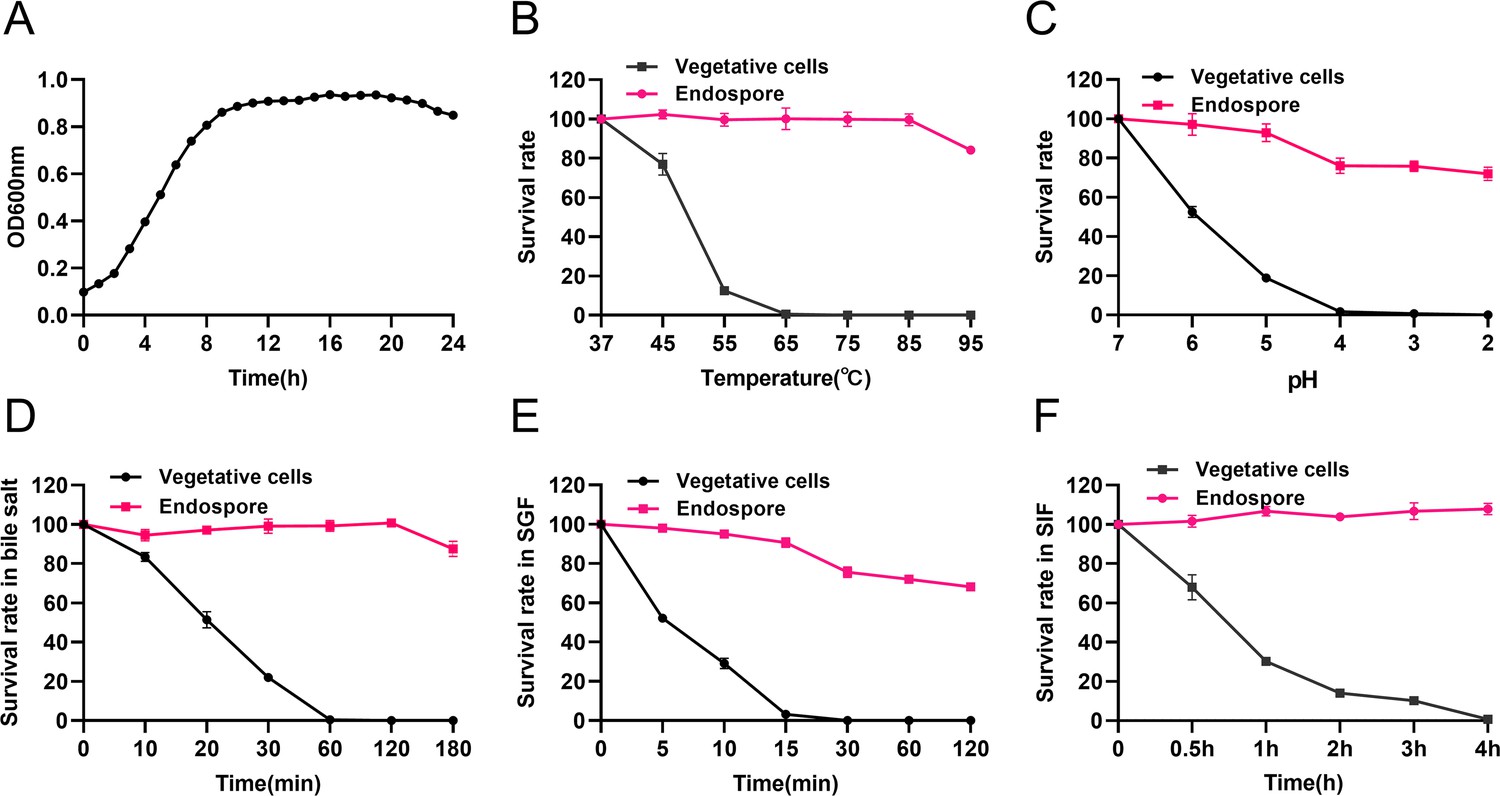
Growth curve of B. velezensis HBXN2020 and its in vitro resistance against environmental assaults.
(A) Growth curves of B. velezensis HBXN2020 cultured in Luria-Bertani (LB) medium at 37°C, detection of OD600 values at 1 hr intervals in microplate reader. (B) Survival rate of endospore and vegetative cells of B. velezensis HBXN2020 after 30 min at different temperatures (37°C, 45°C, 55°C, 65°C, 75°C, 85°C, or 95°C). Equal amounts of endospore and vegetative cells of HBXN2020 were exposed to the following: (C) acid solution (pH 2–7), (D) 0.3% bile salts, (E) simulated gastric fluid (SGF) (pH 1.2) supplemented with pepsin, and (F) simulated intestinal fluid (SIF) (pH 6.8) containing trypsin at 37°C. At predetermined time points, 100 μL was taken from each sample, and 10-fold serially diluted with sterile PBS (pH 7.2), and then spread on LB agar plates and cultured at 37°C for 12 hr before bacterial counting. Each group was repeated three times (n=3).
-
Figure 1—source data 1
Raw data values for Figure 1A–F.
- https://cdn.elifesciences.org/articles/93423/elife-93423-fig1-data1-v1.xlsx
Figure 1—figure supplement 1
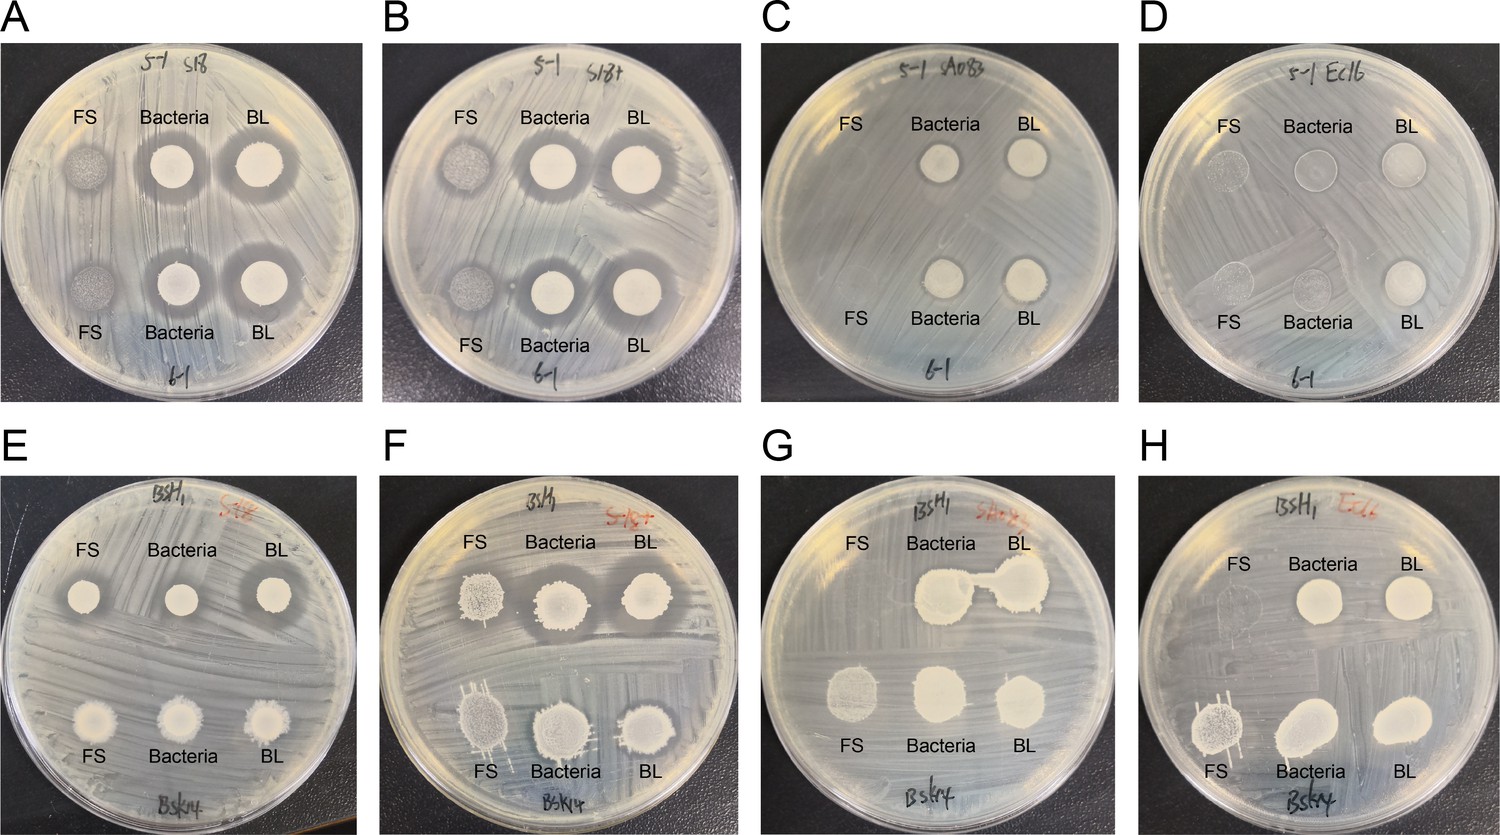
Spot-on-plate assay of Bacillus.
(A) and (E) indicator bacteria are Staphylococcus aureus S18; (B) and (F) indicator bacteria are S. aureus S18+; (C) and (G) indicator bacteria are Salmonella SA083 (S. Enteritidis SE006); (D) and (H) indicator bacteria are Escherichia coli EC16 (E. coli EC016). FS: fermentation supernatant; BL: bacteria liquid.
-
Figure 1—figure supplement 1—source data 1
PDF file containing original Bacillus antibacterial screening images for Figure 1—figure supplement 1.
- https://cdn.elifesciences.org/articles/93423/elife-93423-fig1-figsupp1-data1-v1.zip
-
Figure 1—figure supplement 1—source data 2
Original files for antibacterial screening of Bacillus displayed in Figure 1—figure supplement 1.
- https://cdn.elifesciences.org/articles/93423/elife-93423-fig1-figsupp1-data2-v1.zip
Figure 2 with 1 supplement
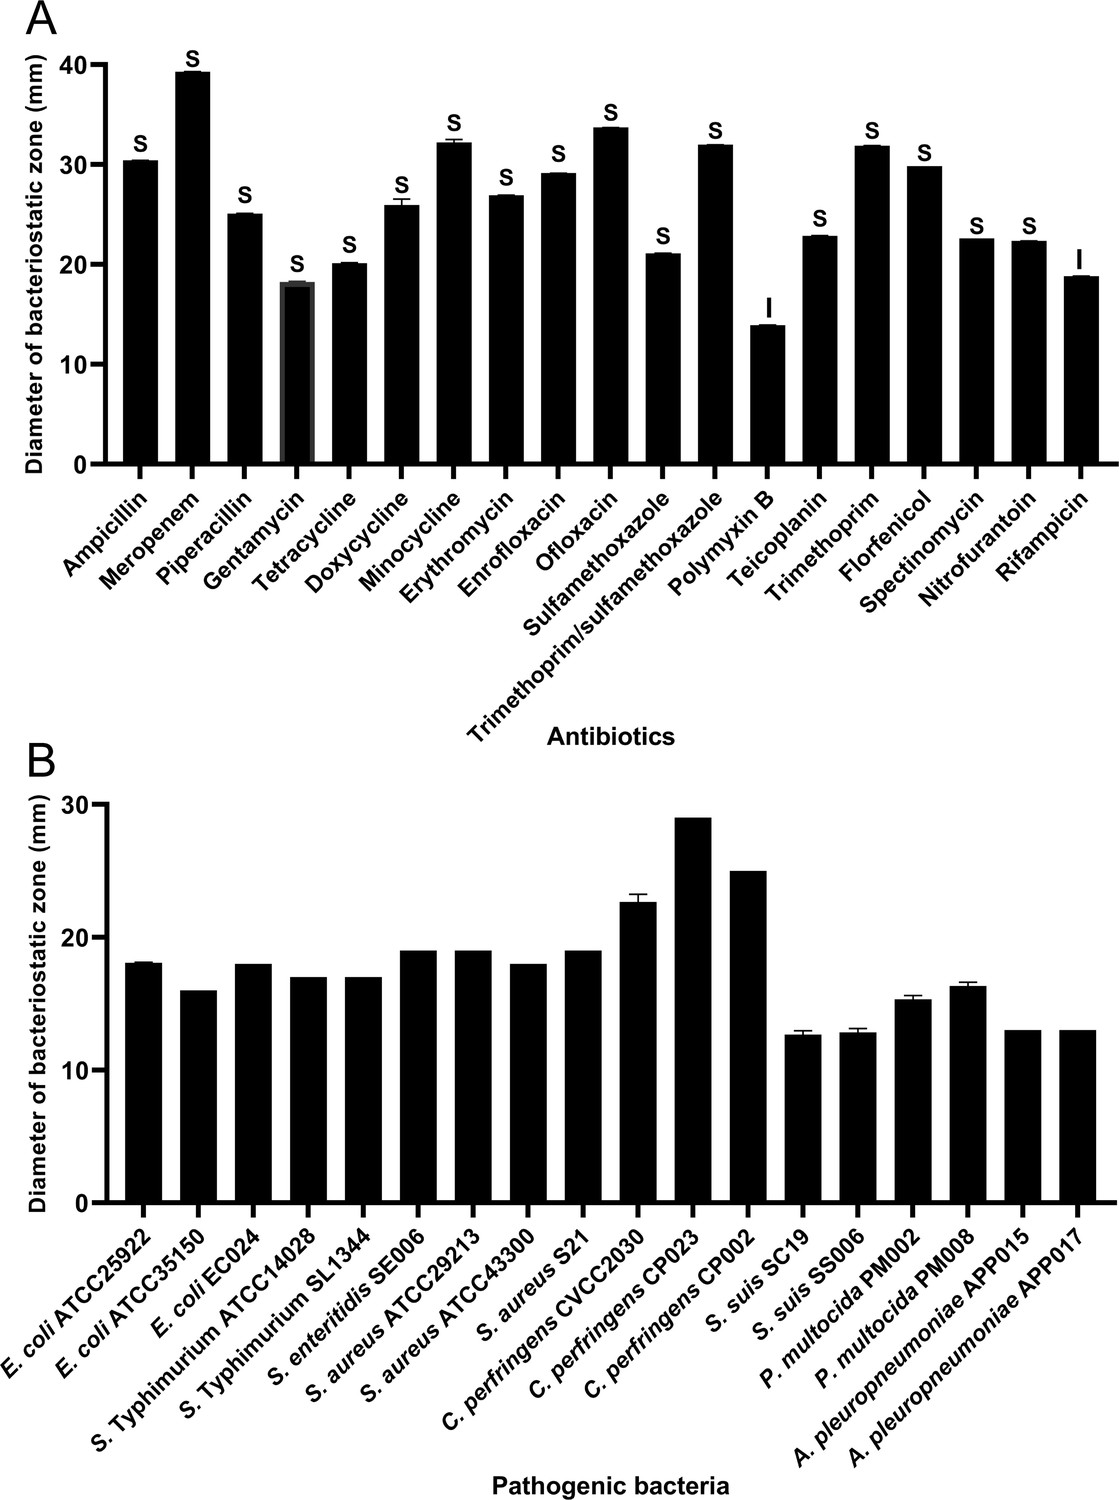
Antibiotic susceptibility of B. velezensis HBXN2020 and bacteriostasis assay in vitro.
(A) The diameter of the antibacterial zone indicates the extent of sensitivity to antibiotics. (B) The diameter of the antibacterial zone indicates the extent of inhibition against pathogenic bacteria. The diameter of the antibacterial zone was measured with vernier caliper. Each group was repeated three times (n=3). R, resistant; I, moderately sensitive; S, sensitive.
-
Figure 2—source data 1
Raw data values for Figure 2A and B.
- https://cdn.elifesciences.org/articles/93423/elife-93423-fig2-data1-v1.xlsx
Figure 2—figure supplement 1
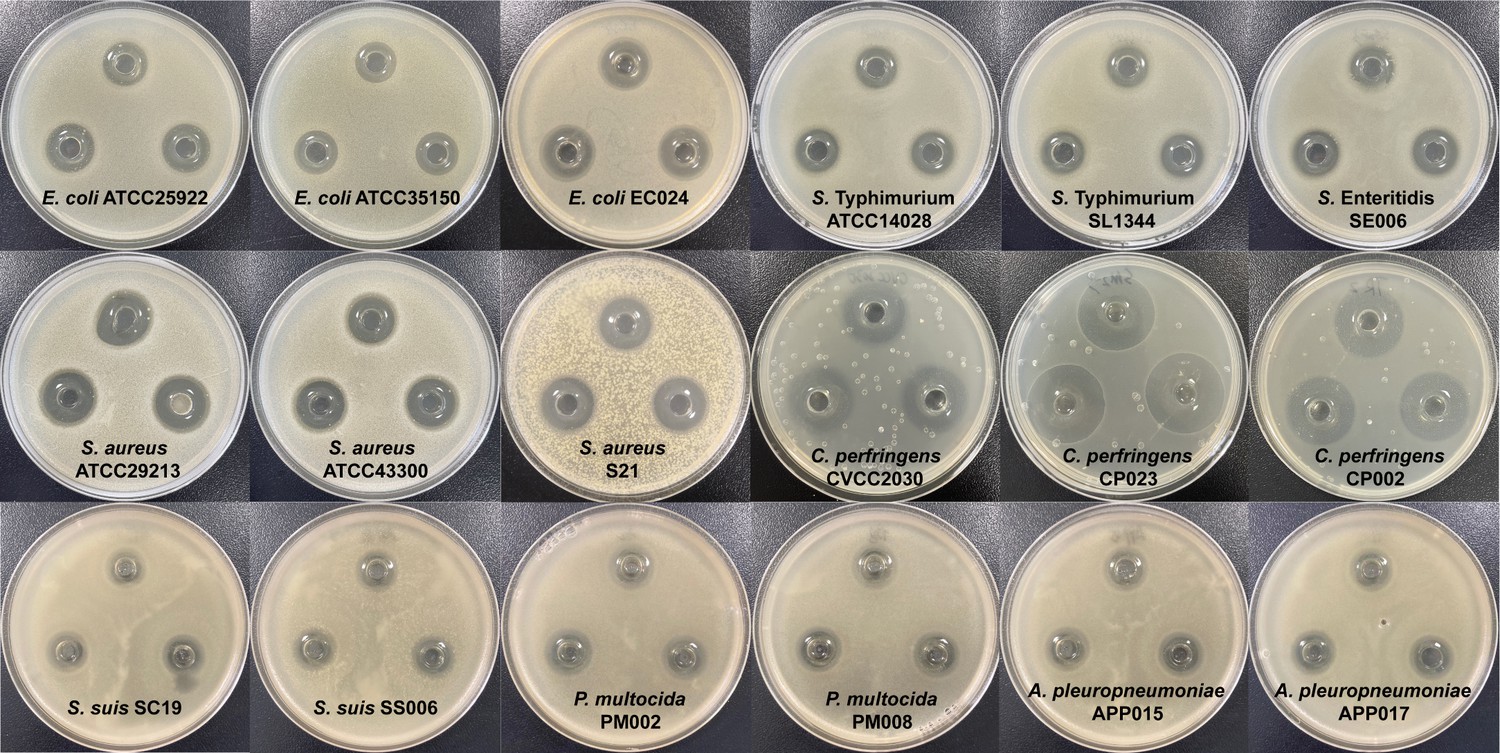
In vitro antibacterial test of B. velezensis HBXN2020.
The in vitro antagonistic activity of B. velezensis HBXN2020 against 18 indicator strains (pathogens) was tested using agar well-diffusion method. The fermentation supernatant of B. velezensis HBXN2020 was filtered with a 0.22 μm filter and add it to different Oxford cups. All plates were cultured at 37°C for 16 hr before observing the inhibition zone, and the diameter of the inhibition zone was measured by vernier caliper. The clear zone was expressed the antagonistic activity.
-
Figure 2—figure supplement 1—source data 1
PDF file containing original B. velezensis HBXN2020 cell-free supernatant (CFS) antibacterial images for Figure 2—figure supplement 1.
- https://cdn.elifesciences.org/articles/93423/elife-93423-fig2-figsupp1-data1-v1.zip
-
Figure 2—figure supplement 1—source data 2
Original files for B. velezensis HBXN2020 cell-free supernatant (CFS) antibacterial images displayed in Figure 2—figure supplement 1.
- https://cdn.elifesciences.org/articles/93423/elife-93423-fig2-figsupp1-data2-v1.zip
Figure 3 with 1 supplement
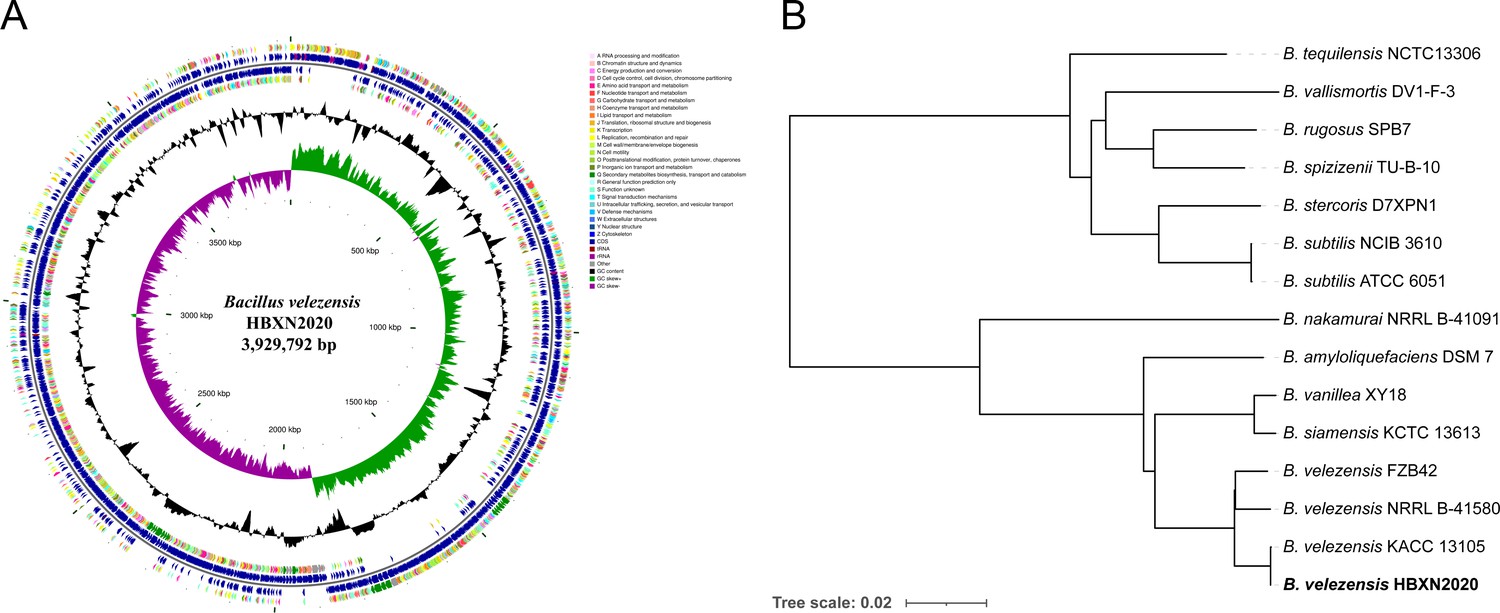
Genomic characteristics and phylogenetic relationships of B. velezensis HBXN2020.
(A) The whole-genome map of B. velezensis HBXN2020 with its genomic features. The map consists of six circles. From the inner circle to the outer circle: (1) GC-skew, (2) GC content, (3) reverse protein-coding genes, different colors represent different COG functional classifications, (4) genes transcribed in reverse direction, (5) genes transcribed in forward direction, (6) forward protein-coding genes, different colors represent different COG functional classifications. (B) The whole-genome phylogenetic tree was constructed based on genome-wide data from 14 Bacillus strains. B. velezensis HBXN2020 are indicated in bold.
Figure 3—figure supplement 1
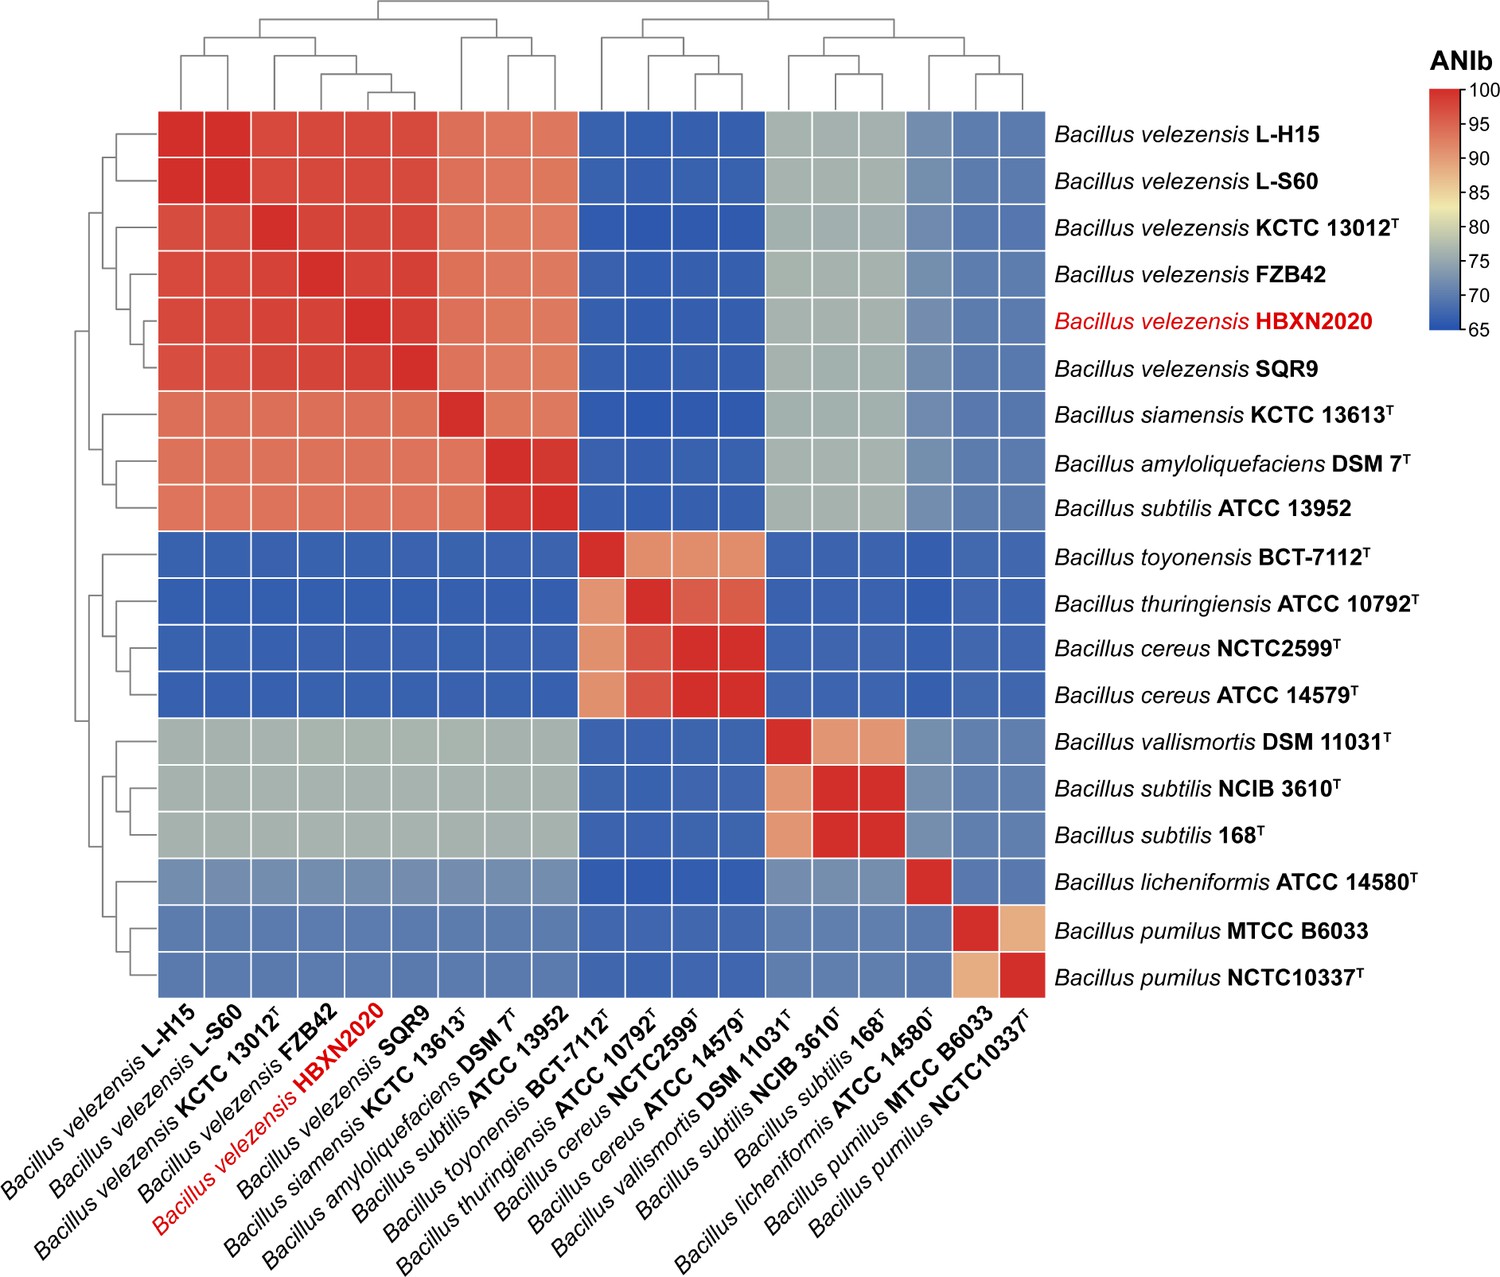
B. velezensis HBXN2020 genome average nucleotide identity (ANI) analysis.
The heatmap based on the ANI based on the BLAST (ANIb) value of strain HBXN2020 and other Bacillus species. The B. velezensis HBXN2020 was labeled in red letters.
Figure 4 with 2 supplements
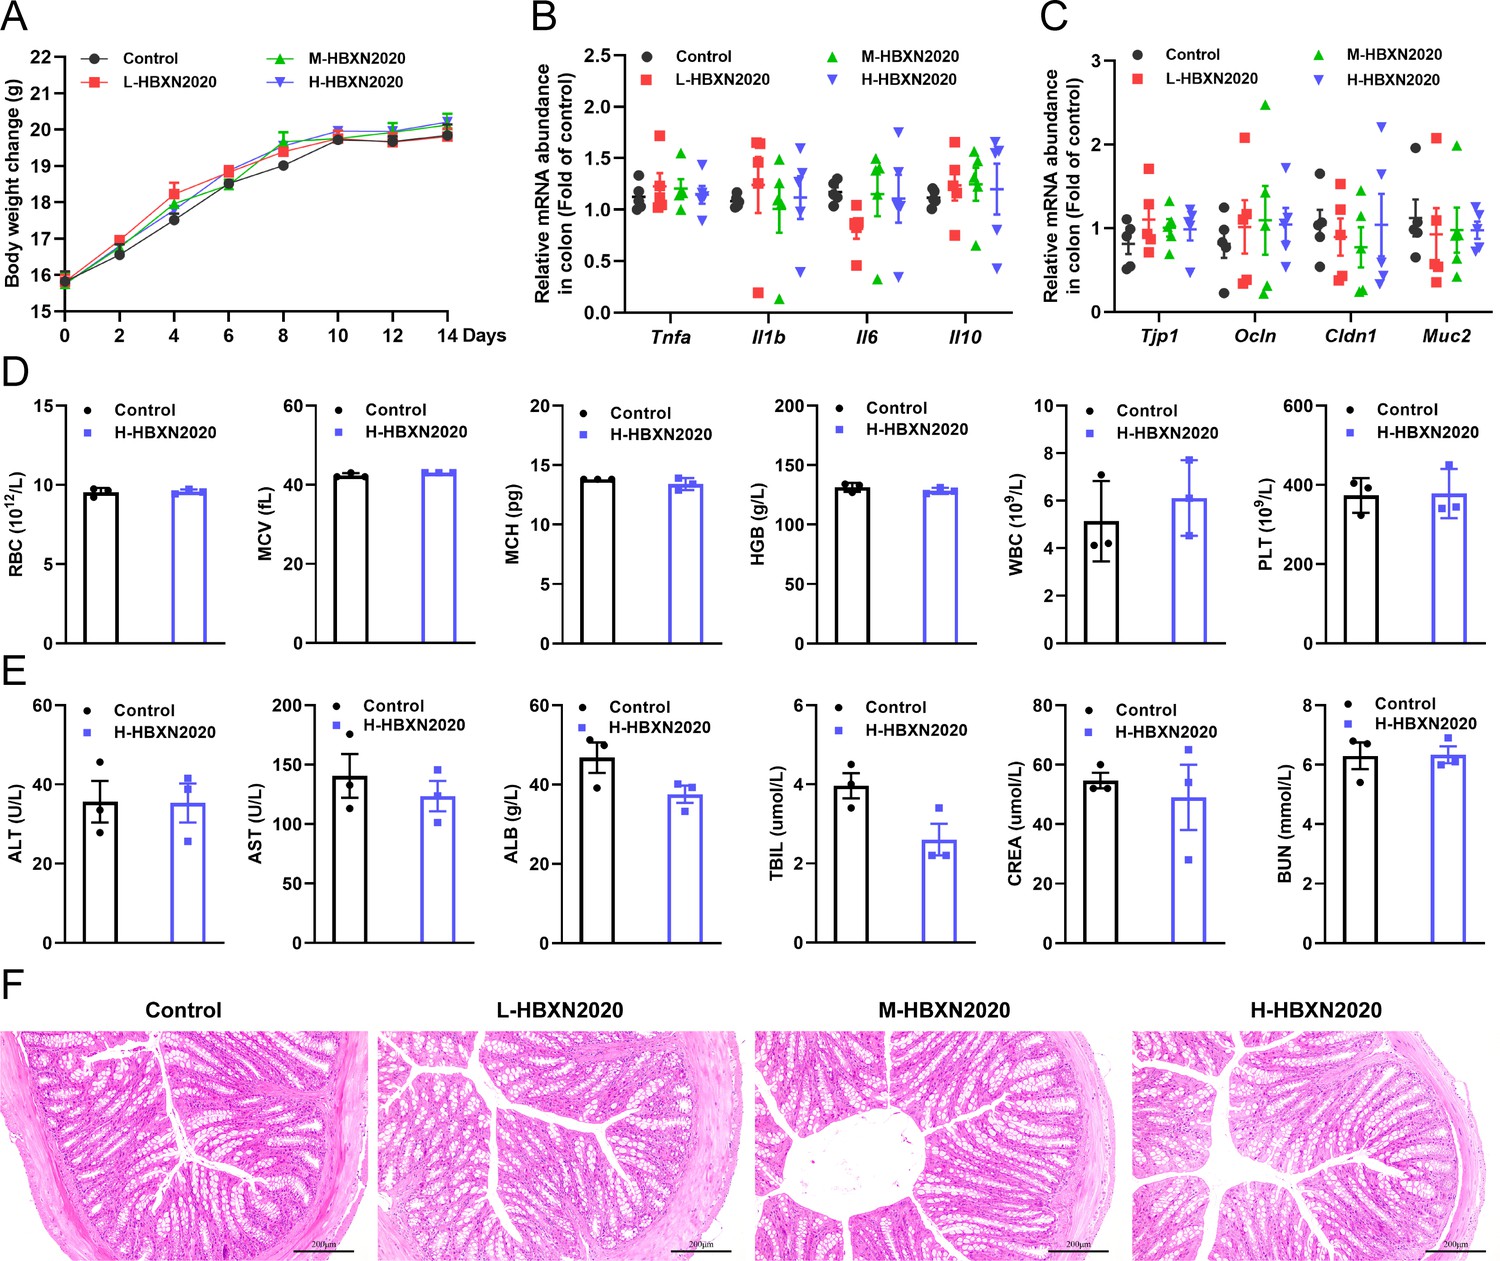
In vivo safety evaluation of B. velezensis HBXN2020 in a mouse model.
(A) Body weights changes of mice during gavage with B. velezensis HBXN2020 spores. Mice were treated with sterile PBS (control group) or low-dose (L-HBXN2020 group), medium dose (M-HBXN2020 group), and high-dose (H-HBXN2020 group) of B. velezensis HBXN2020 spores. Weighing and gavage were performed once every 2 days during the experimental period (15 days). Data were shown as mean values ± SEM (n=5). (B) The mRNA levels of inflammatory cytokines in the colon of mice measured by RT-qPCR. Data were shown as mean values ± SEM (n=5). (C) The mRNA levels of barrier protein Tjp1, Ocln, Cldn1, and Muc2 in the colon of mice measured by RT-qPCR. Data were shown as mean values ± SEM (n=5). (D) Major blood routine parameters and (E) serum biochemical parameters of mice in the control group and H-HBXN2020 group. Data were shown as mean values ± SEM (n=3). (F) Hematoxylin and eosin (H&E) stained colon sections in the different groups. Scale bar: 200 μm.
-
Figure 4—source data 1
Raw data values for Figure 4A–E.
- https://cdn.elifesciences.org/articles/93423/elife-93423-fig4-data1-v1.xlsx
Figure 4—figure supplement 1
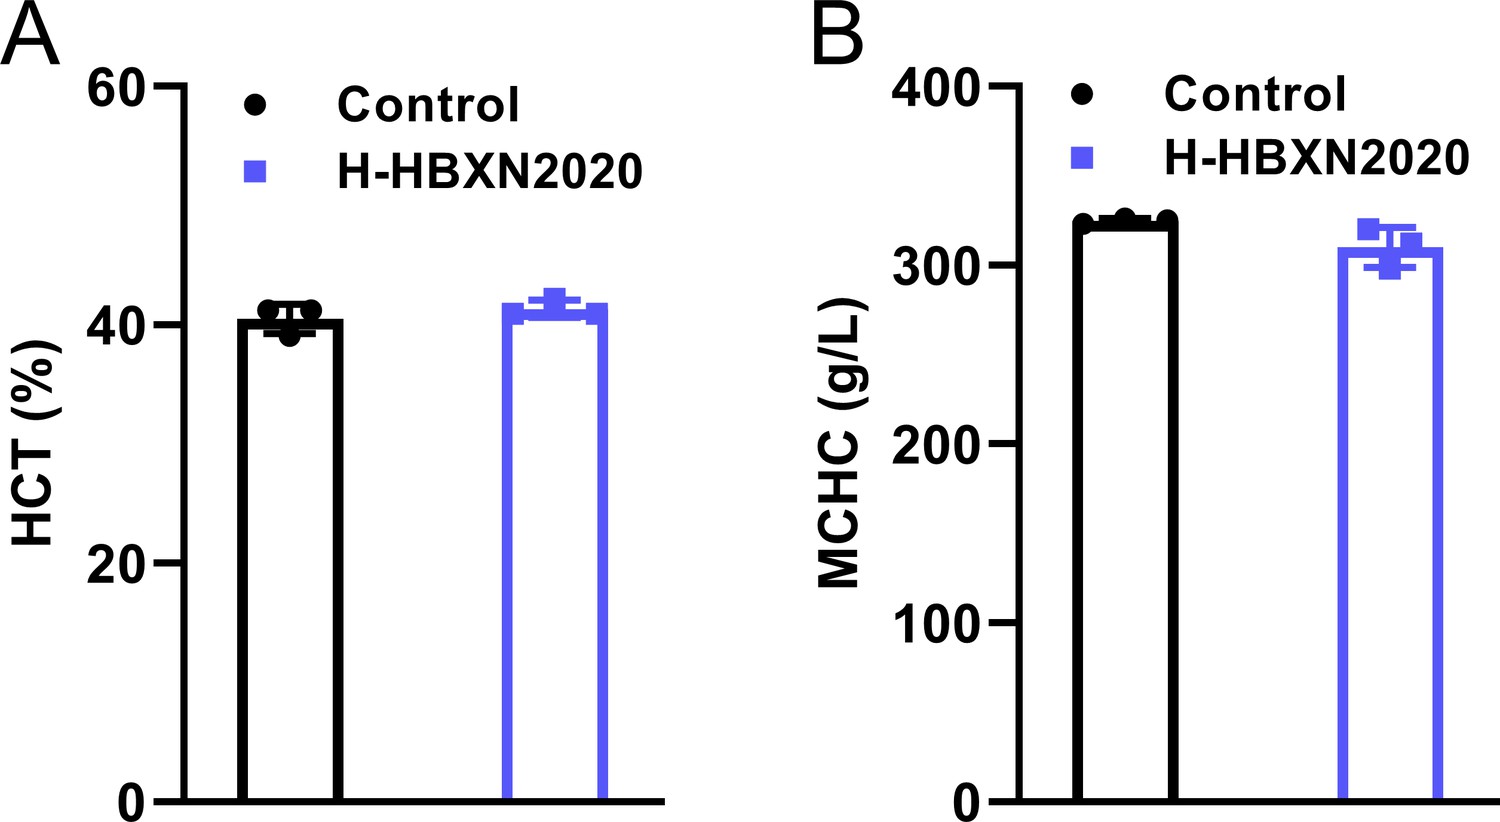
Hematological parameters.
Blood routine parameters of mice in the control group and high-dose B. velezensis HBXN2020 group. (A) Hematocrit (HCT), (B) mean corpuscular hemoglobin concentration (MCHC).
-
Figure 4—figure supplement 1—source data 1
Raw data values for Figure 4—figure supplement 1A and B.
- https://cdn.elifesciences.org/articles/93423/elife-93423-fig4-figsupp1-data1-v1.xlsx
Figure 4—figure supplement 2
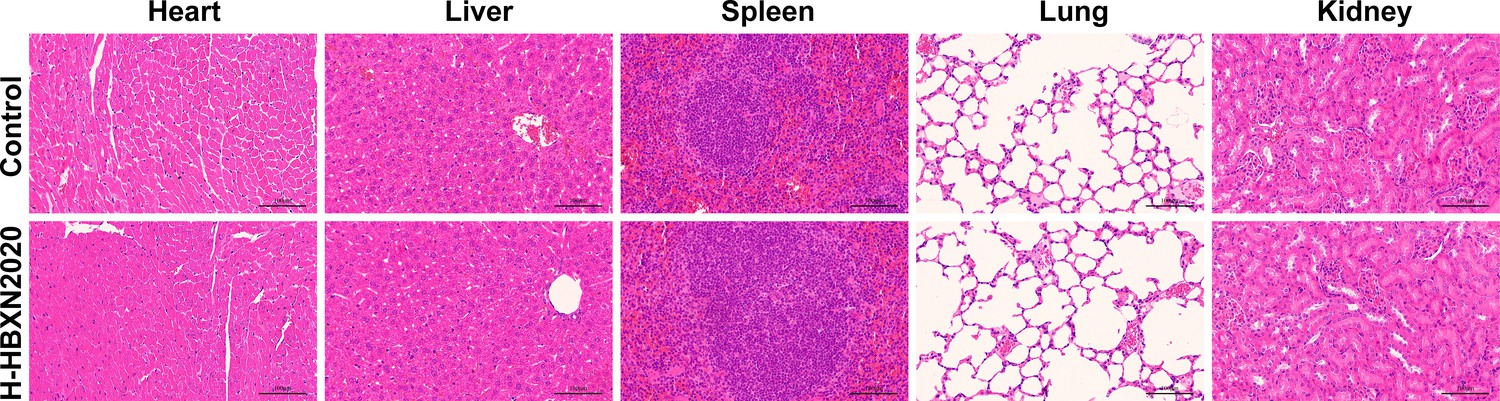
Hematoxylin and eosin (H&E) staining of the intestine, heart, liver, spleen, lung, and kidney.
Tissues were obtained from mice in the high-dose B. velezensis HBXN2020 group at 15 days. PBS was used as a control. Scale bars: 100 µm.
Figure 5 with 2 supplements
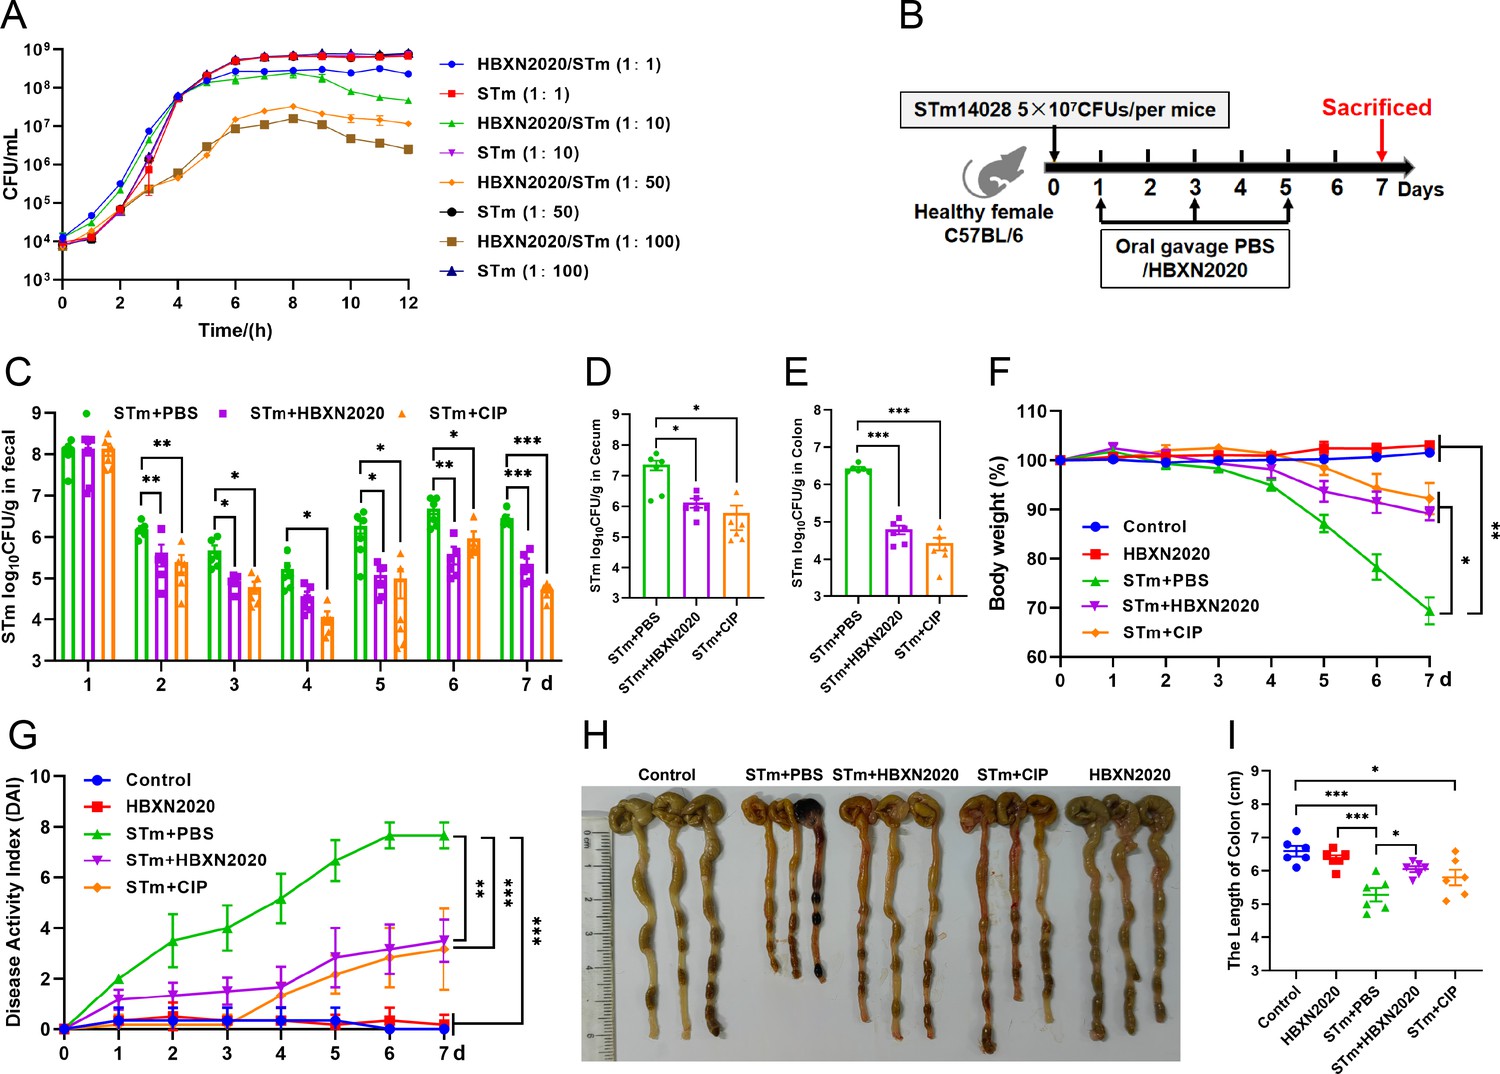
Oral B. velezensis HBXN2020 spores alleviated infection by S. Typhimurium.
(A) In vitro bacterial competition between STm and B. velezensis HBXN2020. STm were co-incubated with B. velezensis HBXN2020 at various ratios at 37°C with shaking. The growth of STm was reflected by bacterial counting per hour. (B) Experimental design for treatment in this study. Orally administrated with either sterile PBS, B. velezensis HBXN2020 spores or ciprofloxacin by gavage at days 1, 3, and 5 after STm (5×10⁷ CFU/mouse) infection, respectively. All mice were euthanized at day 7 after STm infection. (C) Bacterial count of STm in mouse feces. Fecal samples were collected per day after STm infection and resuspended in sterile PBS (0.1 g of fecal resuspended in 1 mL of sterile PBS). One hundred microliters of each sample performed a serial of 10-fold dilutions and spread on selective agar plates (50 µg/mL kanamycin) and incubated at 37°C for 12 hr before bacterial counting. The bacterial loads of STm in (D) cecum and (E) colon. The cecum and colon were harvested and then homogenized. Data were shown as mean values ± SEM (n=6). Statistical significance was evaluated using Student’s t-test (*, p<0.05, **, p<0.01, and ***, p<0.001). (F) Daily body weight changes and (G) daily disease activity index (DAI) scores of mice with different treatment groups. Data were shown as mean values ± SEM (n=6). Statistical significance was evaluated using one-way analysis of variance (ANOVA) with Tukey’s multiple comparisons test (*, p<0.05, **, p<0.01, and ***, p<0.001). (H) Colonic tissue images. (I) The length of the colon from per group (n=6). Statistical significance was evaluated using one-way ANOVA with Tukey’s multiple comparisons test (*, p<0.05, **, p<0.01, and ***, p<0.001).
-
Figure 5—source data 1
Raw data values for Figure 5A, C, D, E, F, G, I.
- https://cdn.elifesciences.org/articles/93423/elife-93423-fig5-data1-v1.xlsx
-
Figure 5—source data 2
PDF file containing original colonic tissue image for Figure 5H.
- https://cdn.elifesciences.org/articles/93423/elife-93423-fig5-data2-v1.zip
-
Figure 5—source data 3
Original files for colonic tissue image displayed in Figure 5H.
- https://cdn.elifesciences.org/articles/93423/elife-93423-fig5-data3-v1.zip
Figure 5—figure supplement 1
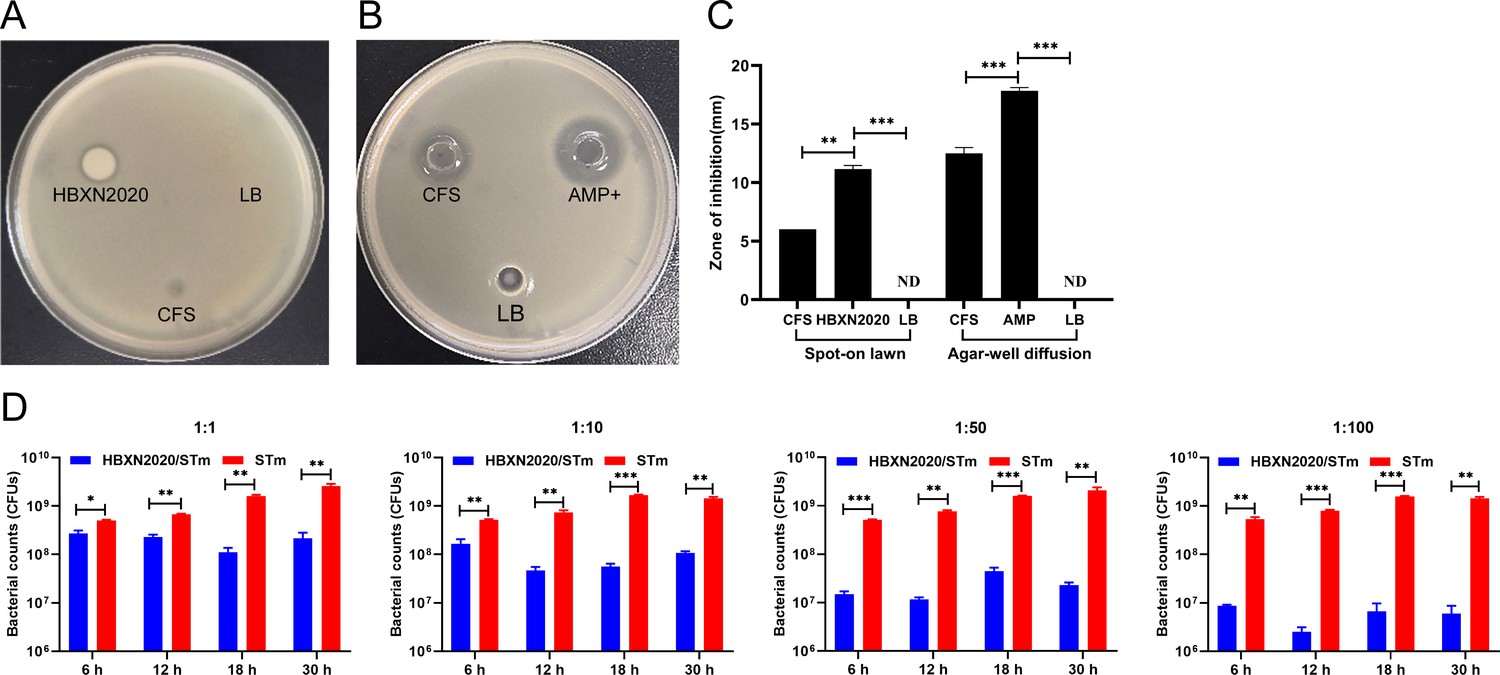
In vitro antagonistic activity of B. velezensis HBXN2020 against S. Typhimurium ATCC14028 in liquid and solid media.
The antagonistic Salmonella activities of HBXN2020 cell-free supernatant (CFS) were determined using spot-on lawn assay (A) and agar well-diffusion assay (B). (C) Diameter of inhibition zone in the spot-on lawn assay and agar well-diffusion assay. Data were shown as mean values ± SEM (n=3). Each group was repeated three times. AMP+, ampicillin as a positive control, LB medium as a negative control. ND, no detectable. (D) S. Typhimurium ATCC14028 (STm) were co-incubated with B. velezensis HBXN2020 in LB medium at various ratios at 37°C. The survivals of STm were examined at indicated time points by bacterial counting on selective agar plates. Data were shown as mean values ± SEM (n=3). Statistical significance was evaluated using Student’s t-test. *, p<0.05, **, p<0.01, and ***, p<0.001.
-
Figure 5—figure supplement 1—source data 1
Raw data values for Figure 5—figure supplement 1C and D.
- https://cdn.elifesciences.org/articles/93423/elife-93423-fig5-figsupp1-data1-v1.xlsx
-
Figure 5—figure supplement 1—source data 2
PDF file containing original B. velezensis HBXN2020 and its cell-free supernatant (CFS) inhibited STm images for Figure 5—figure supplement 1 and B.
- https://cdn.elifesciences.org/articles/93423/elife-93423-fig5-figsupp1-data2-v1.zip
-
Figure 5—figure supplement 1—source data 3
Original files for antibacterial images of B. velezensis HBXN2020 and its cell-free supernatant (CFS) against STm displayed in Figure 5—figure supplement 1A and B.
- https://cdn.elifesciences.org/articles/93423/elife-93423-fig5-figsupp1-data3-v1.zip
Figure 5—figure supplement 2
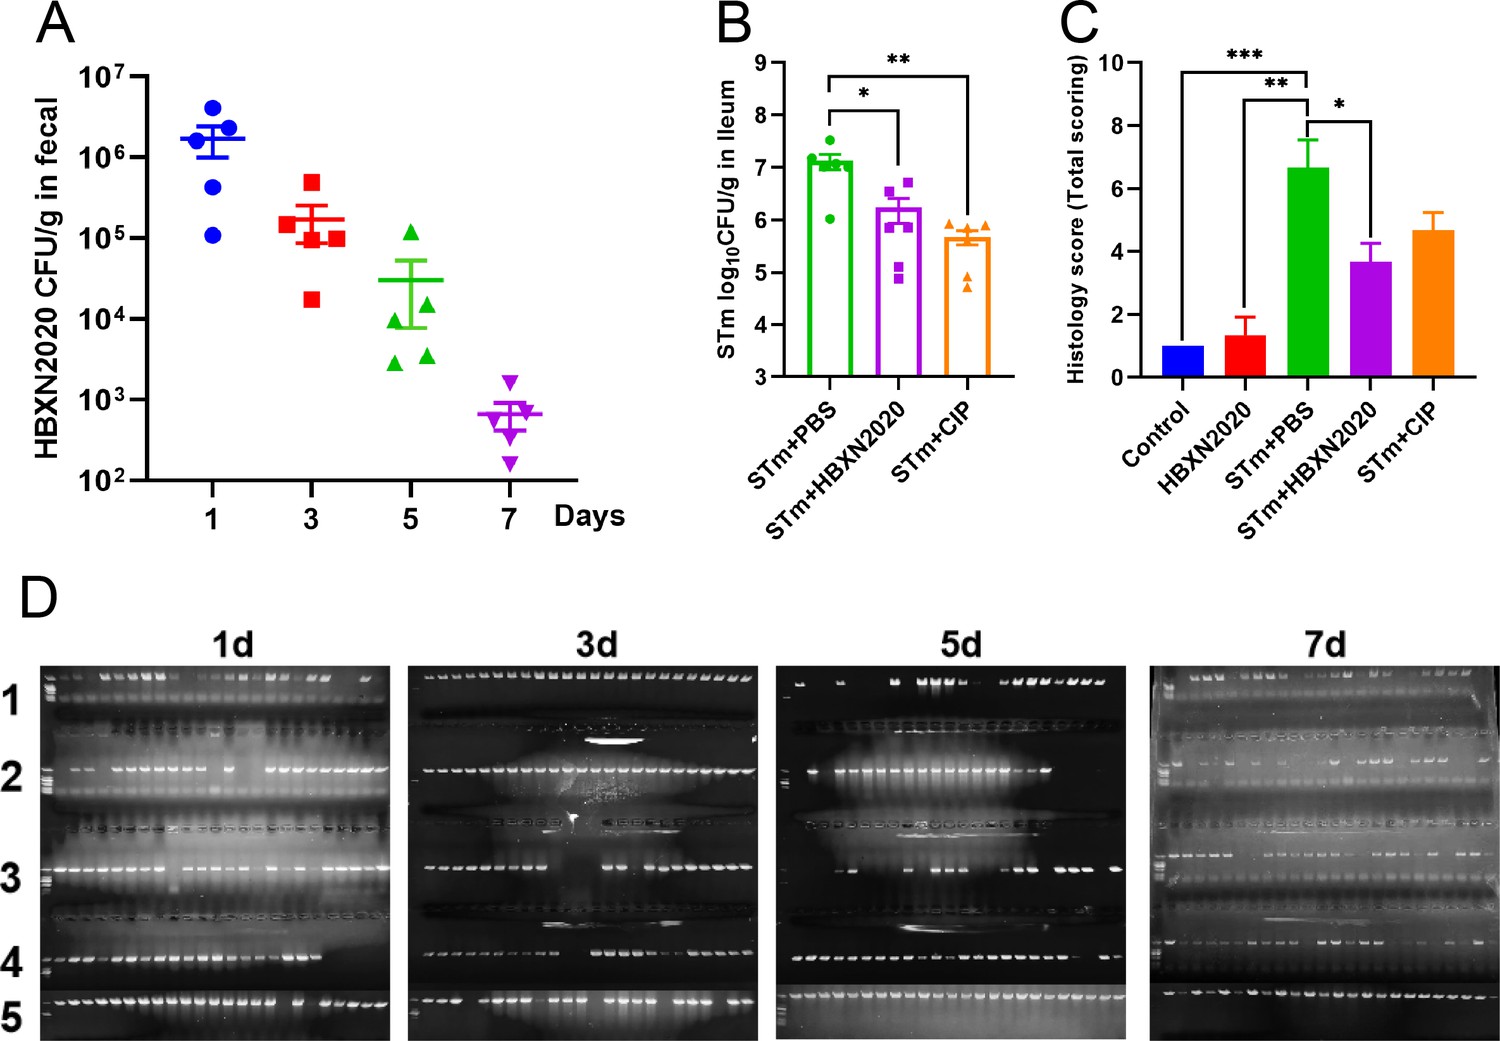
The effect of therapeutic B. velezensis HBXN2020 on the bacterial load in feces of mice and the histological score of the colons.
(A) The bacterial load of B. velezensis HBXN2020 in mouse feces. The quantity of B. velezensis HBXN2020 was identified by combining bacterial count and PCR (n=5). Data were shown as mean values ± SEM. (B) The bacterial loads of S. Typhimurium ATCC14028 in ileum. The ileum was harvested and then homogenized. One hundred microliters of each sample performed a serial of 10-fold dilutions and spread on selective agar plates and incubated at 37°C for 12 hr before bacterial counting. Data were shown as mean values ± SEM (n=6). Statistical significance was evaluated using Student’s t-test (*, p<0.05, **, p<0.01, and ***, p<0.001). (C) Histological scores of colons (n=3). (D) B. velezensis HBXN2020 single colony PCR identification results. Statistical significance was evaluated using one-way analysis of variance (ANOVA) with Tukey’s multiple comparisons test (*, p<0.05, **, p<0.01, and ***, p<0.001).
-
Figure 5—figure supplement 2—source data 1
Raw data values for Figure 5—figure supplement 2A–C.
- https://cdn.elifesciences.org/articles/93423/elife-93423-fig5-figsupp2-data1-v1.xlsx
Figure 6
Oral B. velezensis HBXN2020 spores attenuated colonic damage and inflammatory reaction.
(A) Hematoxylin and eosin (H&E) stained colon tissue sections. Scale bar: 50 μm. The mRNA levels of (B) Tnfa, (C) Il1b, (D) Il6, and (E) Il10 were detected by RT-qPCR. Data were shown as mean values ± SEM (n=5). The mRNA levels of (F) Tjp1, (G) Ocln, (H) Cldn1, and (I) Muc2 in colon tissue were detected by RT-qPCR. Data were shown as mean values ± SEM (n=5). Statistical significance was evaluated using one-way analysis of variance (ANOVA) with Tukey’s multiple comparisons test (*, p<0.05, **, p<0.01, and ***, p<0.001).
-
Figure 6—source data 1
Raw data values for Figure 6B–I.
- https://cdn.elifesciences.org/articles/93423/elife-93423-fig6-data1-v1.xlsx
Figure 7 with 1 supplement
Oral B. velezensis HBXN2020 spores regulated the composition of intestinal microbiota.
The alpha diversity of the gut microbiota, determined by the (A) Sobs, (B) Chao, (C) Shannon, and (D) Simpson index. Data were shown as mean values ± SEM (n=5). (E) The principal components analysis (PCA) plot showed the β diversity of the gut microbiota based on Bray-Curtis distance at the operational taxonomic unit (OTU) level. Heatmap of the community composition of colonic microbiota at the phylum (top 15 phyla) (F) and genus (top 30 genera) (G) level. Relative abundance of selected taxa (H) norank_f_Muribaculaceae, (I) Lactobacillus, (J) Akkermansia, and (K) Enterococcus. Data were shown as mean values ± SEM (n=5). (L) Analysis of differences in the microbial communities by LEfSe (linear discriminant analysis [LDA] effect size) (LDA score>2) among different groups. Significance was evaluated by one-way analysis of variance (ANOVA) with Tukey’s multiple comparisons test (*, p<0.05, **, p<0.01, and ***, p<0.001).
-
Figure 7—source data 1
Raw data values for Figure 7A–D and H–K.
- https://cdn.elifesciences.org/articles/93423/elife-93423-fig7-data1-v1.xlsx
Figure 7—figure supplement 1
Analysis of the community compositions of colonic microbiota.
(A) Community compositions analysis at the phylum level. This bar graph shows the 15 most abundant communities. (B) Community compositions analysis at the genus level. This bar graph shows the communities of the top 30 genera.
Figure 8 with 1 supplement
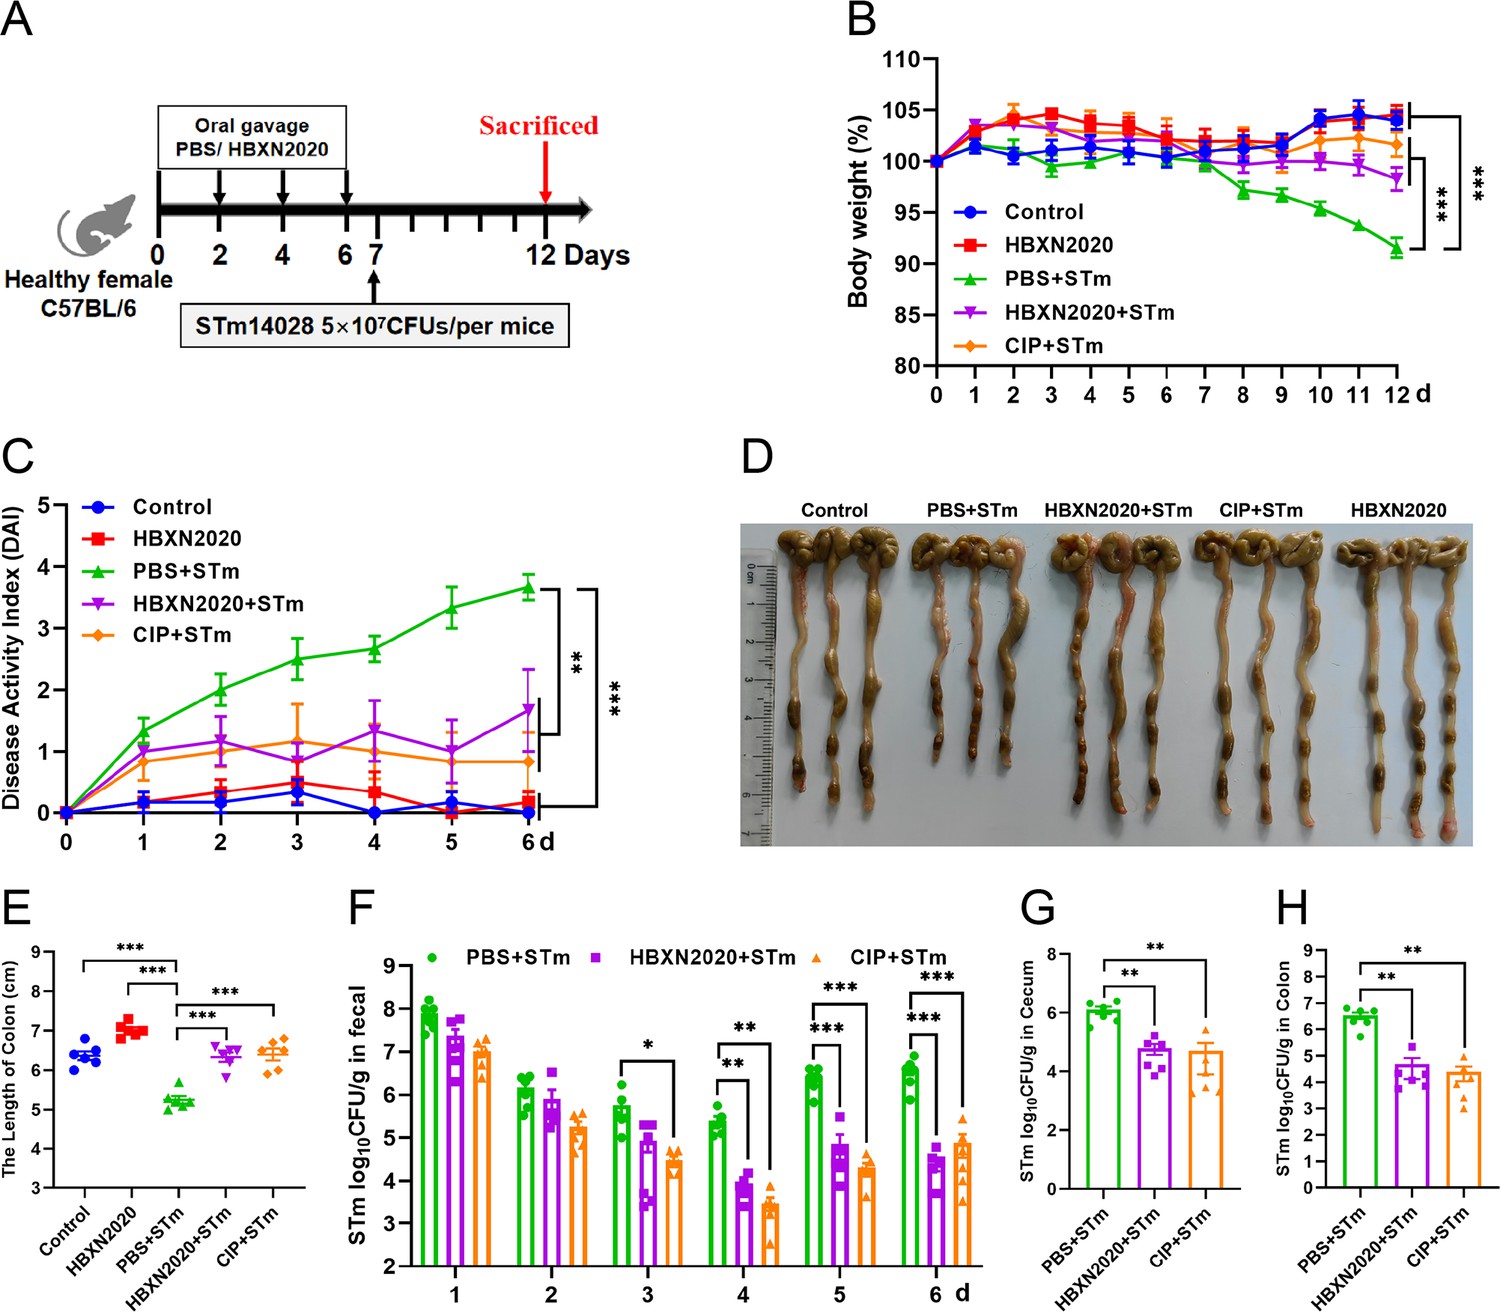
Prophylactic B. velezensis HBXN2020 spores attenuated the symptoms of S. Typhimurium-infected mouse.
(A) Experimental design for treatment in this study. At days 1, 3, 5, and 7, each mouse in the HBXN2020+STm group, CIP+STm group, and PBS+STm group were received 200 μL of B. velezensis HBXN2020 spores (1×10⁸ CFU/mouse), ciprofloxacin or sterile PBS by gavage, respectively. Then, mice in PBS+STm group, HBXN2020+STm group, and CIP+STm group were orally inoculated with 200 μL (5×10⁷ CFU/mouse) of STm on day 7, respectively. On day 12, all mice were euthanized. (B) Daily body weight changes and (C) daily disease activity index (DAI) scores of mice with different groups following STm treatment. Data were shown as mean values ± SEM (n=6). Statistical significance was evaluated using one-way analysis of variance (ANOVA) with Tukey’s multiple comparisons test (*, p<0.05, **, p<0.01, and ***, p<0.001). (D) Colonic tissue images. (E) The length of the colon from per group (n=6). (F) Bacterial count of STm in mouse feces. Fecal samples were collected every day after STm infection and resuspended in sterile PBS (0.1 g of fecal resuspended in 1 mL of sterile PBS) (n=6). One hundred microliters of each sample performed a serial of 10-fold dilutions and spread on selective agar plates (50 µg/mL kanamycin) and incubated at 37°C for 12 hr before bacterial counting. The bacterial loads of STm in (G) cecum and (H) colon (n=6). The cecum and colon were harvested and then homogenized. Statistical significance was evaluated using Student’s t-test (*, p<0.05, **, p<0.01, and ***, p<0.001).
-
Figure 8—source data 1
Raw numerical data for Figure 8B, C, and E–H.
- https://cdn.elifesciences.org/articles/93423/elife-93423-fig8-data1-v1.xlsx
-
Figure 8—source data 2
PDF file containing original colonic tissue image for Figure 8D.
- https://cdn.elifesciences.org/articles/93423/elife-93423-fig8-data2-v1.zip
-
Figure 8—source data 3
Original files for colonic tissue image displayed in Figure 8D.
- https://cdn.elifesciences.org/articles/93423/elife-93423-fig8-data3-v1.zip
Figure 8—figure supplement 1
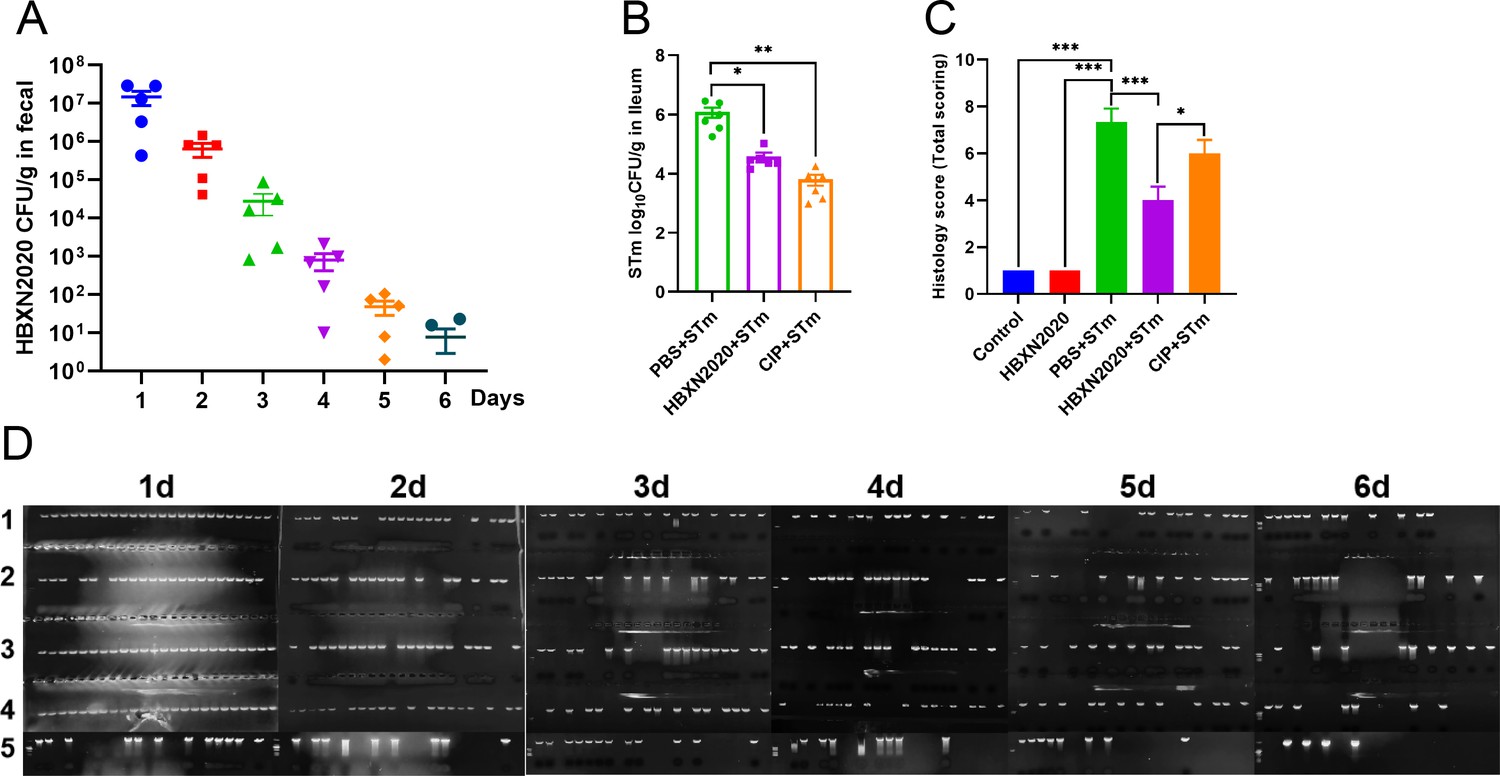
The effect of prophylactic B. velezensis HBXN2020 on the bacterial load in feces or ileum of mice and the histological score of the colons.
(A) The bacterial load of B. velezensis HBXN2020 in mouse feces. The quantity of B. velezensis HBXN2020 was identified by combining bacterial count and PCR (n=5). Data were shown as mean values ± SEM. (B) The bacterial loads of S. Typhimurium ATCC14028 in ileum. The ileum was harvested and then homogenized. One hundred microliters of each sample performed a serial of 10-fold dilutions and spread on selective agar plates and incubated at 37°C for 12 hr before bacterial counting. Data were shown as mean values ± SEM (n=6).Statistical significance was evaluated using Student’s t-test (*, p<0.05, **, p<0.01, and ***, p<0.001). (C) Histological scores of colons (n=3). (D) B. velezensis HBXN2020 single colony PCR identification results. Statistical significance was evaluated using one-way analysis of variance (ANOVA) with Tukey’s multiple comparisons test (*, p<0.05, **, p<0.01, and ***, p<0.001).
-
Figure 8—figure supplement 1—source data 1
Raw numerical data for Figure 8—figure supplement 1A–C.
- https://cdn.elifesciences.org/articles/93423/elife-93423-fig8-figsupp1-data1-v1.xlsx
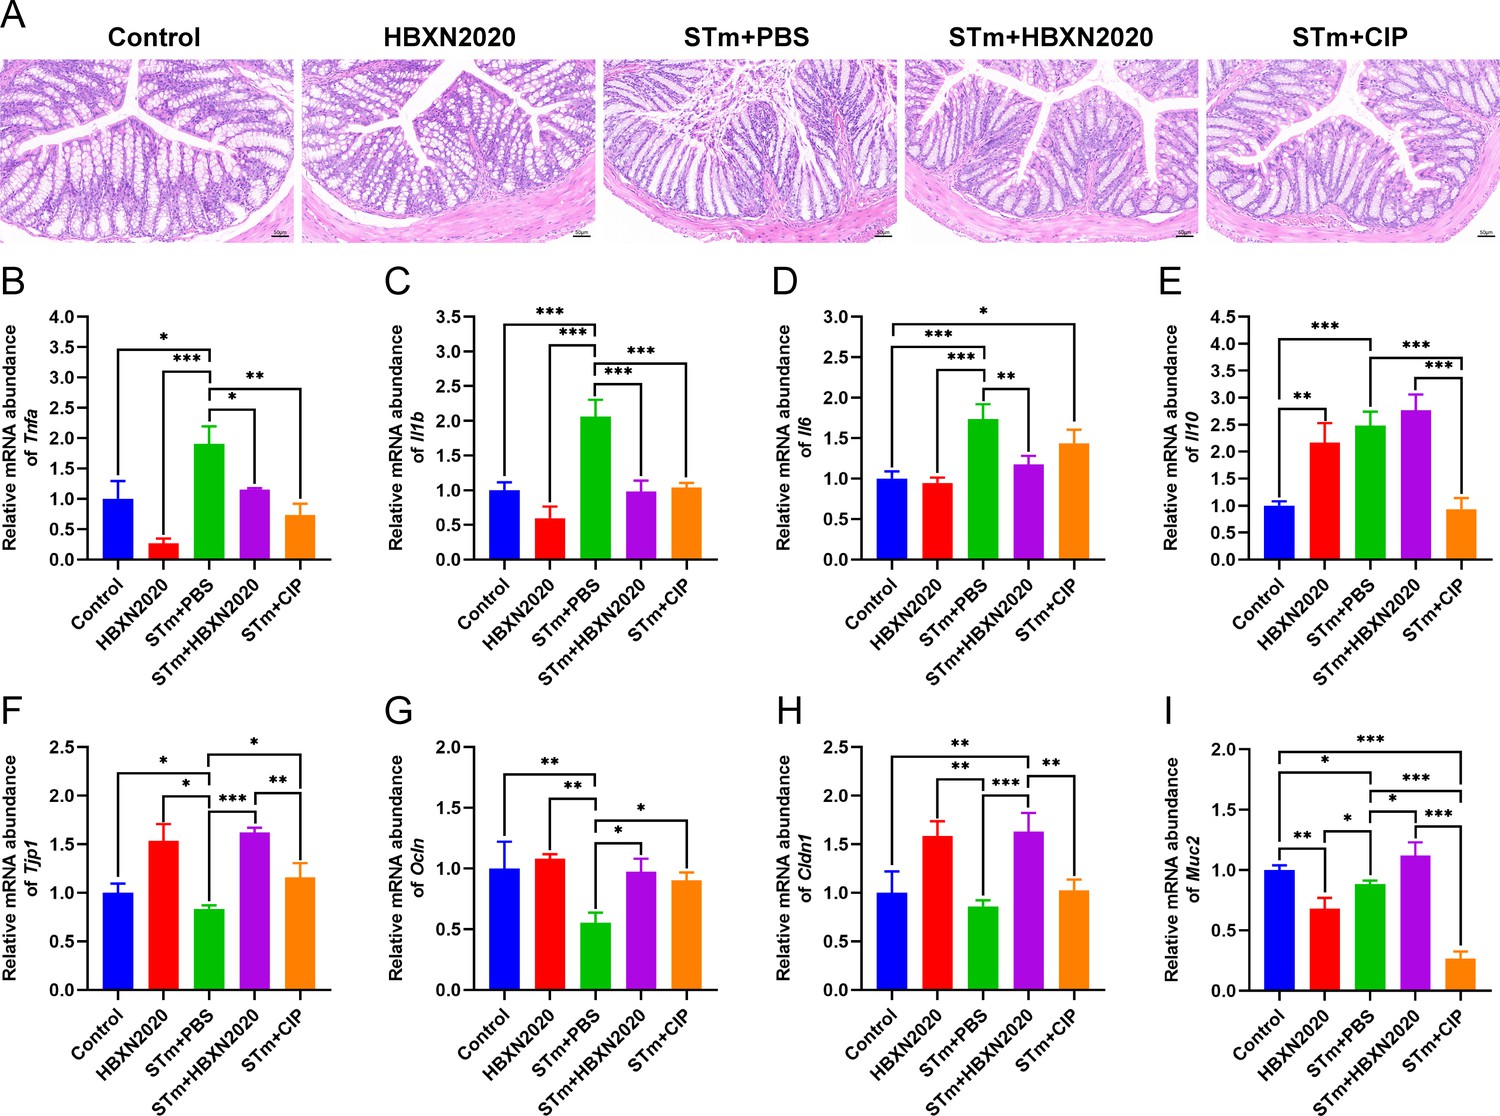
Figure 9
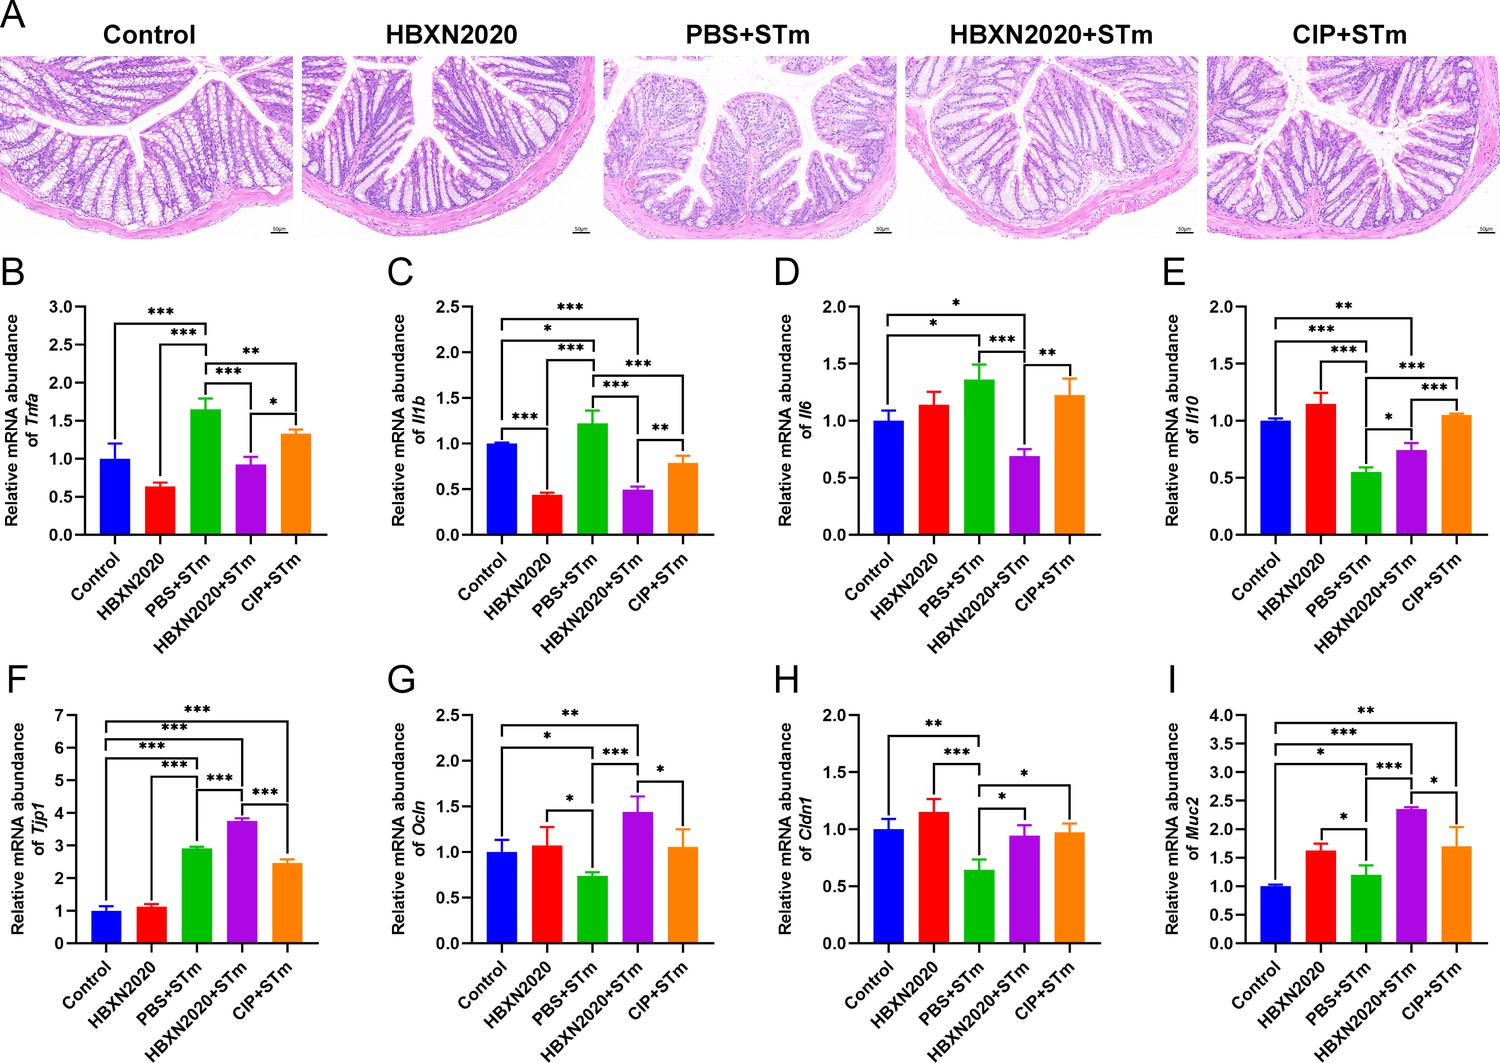
Prophylactic B. velezensis HBXN2020 spores attenuated colonic damage and inflammatory reaction.
(A) Hematoxylin and eosin (H&E) stained colon tissue sections. Scale bar: 50 μm. The mRNA levels of (B) Tnfa, (C) Il1b, (D) Il6, and (E) Il10 were detected by RT-qPCR. Data were shown as mean values ± SEM (n=5). The mRNA levels of (F) Tjp1, (G) Ocln, (H) Cldn1, and (I) Muc2 in colon tissue were detected by RT-qPCR. Data were shown as mean values ± SEM (n=5). Statistical significance was evaluated using one-way analysis of variance (ANOVA) with Tukey’s multiple comparisons test (*, p<0.05, **, p<0.01, and ***, p<0.001).
-
Figure 9—source data 1
Raw numerical data for Figure 9B–I.
- https://cdn.elifesciences.org/articles/93423/elife-93423-fig9-data1-v1.xlsx
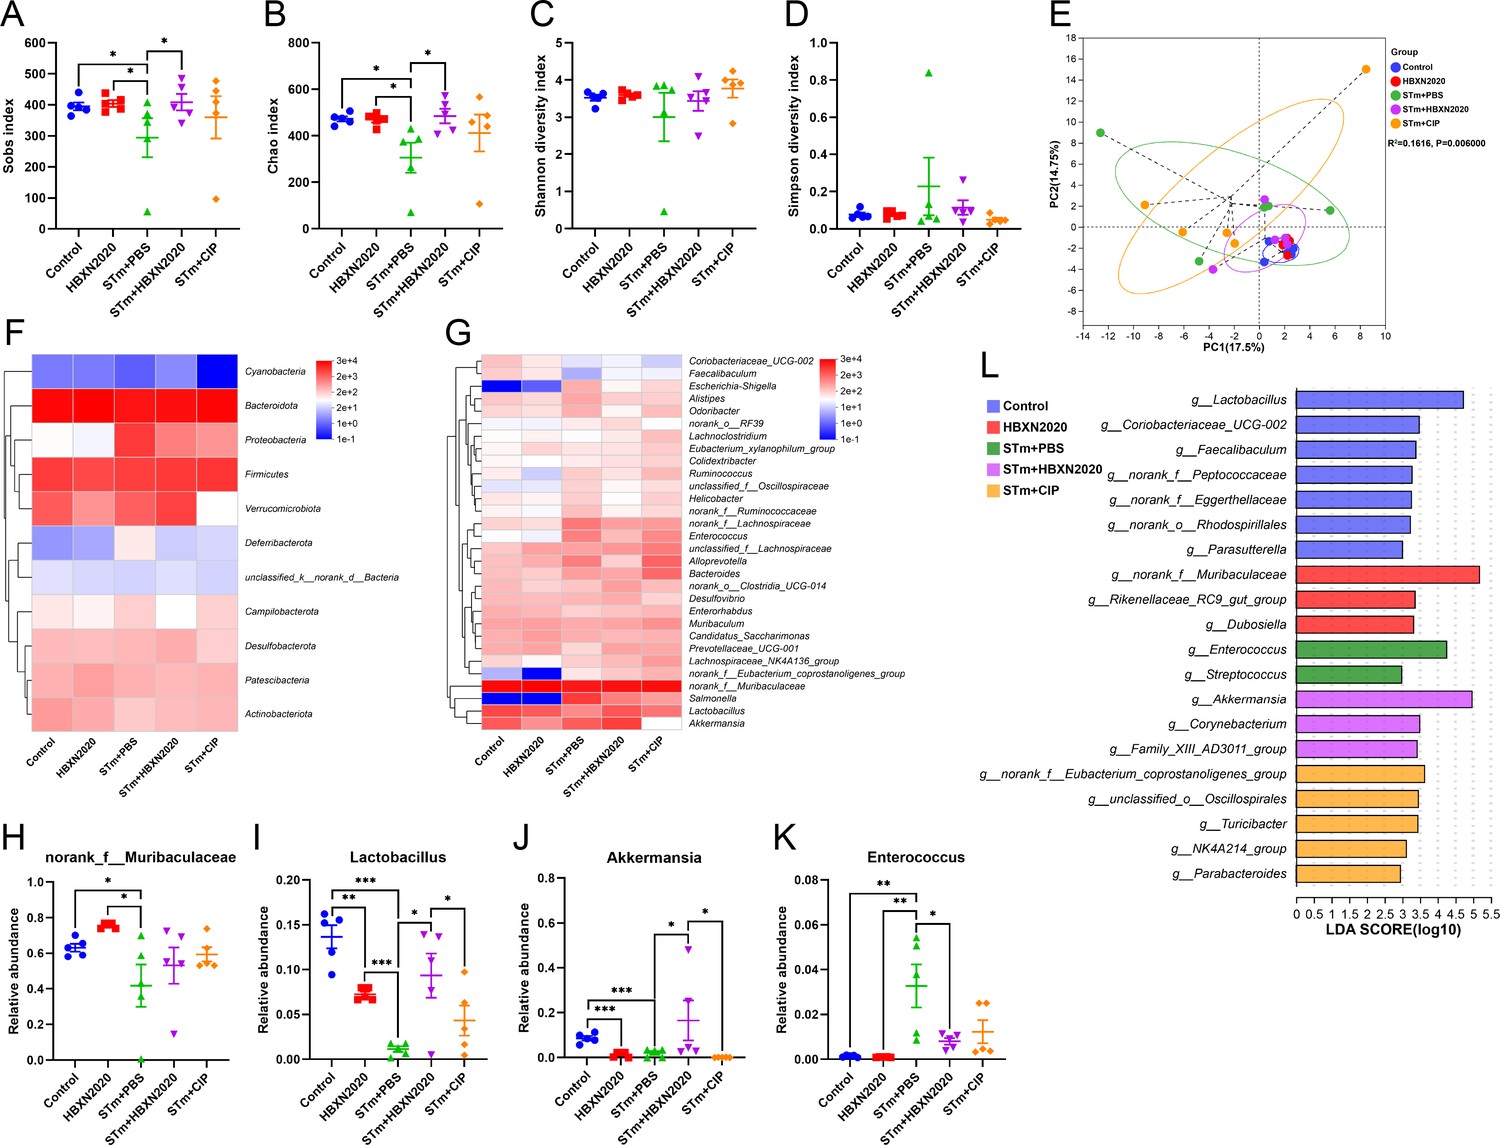
Figure 10 with 1 supplement
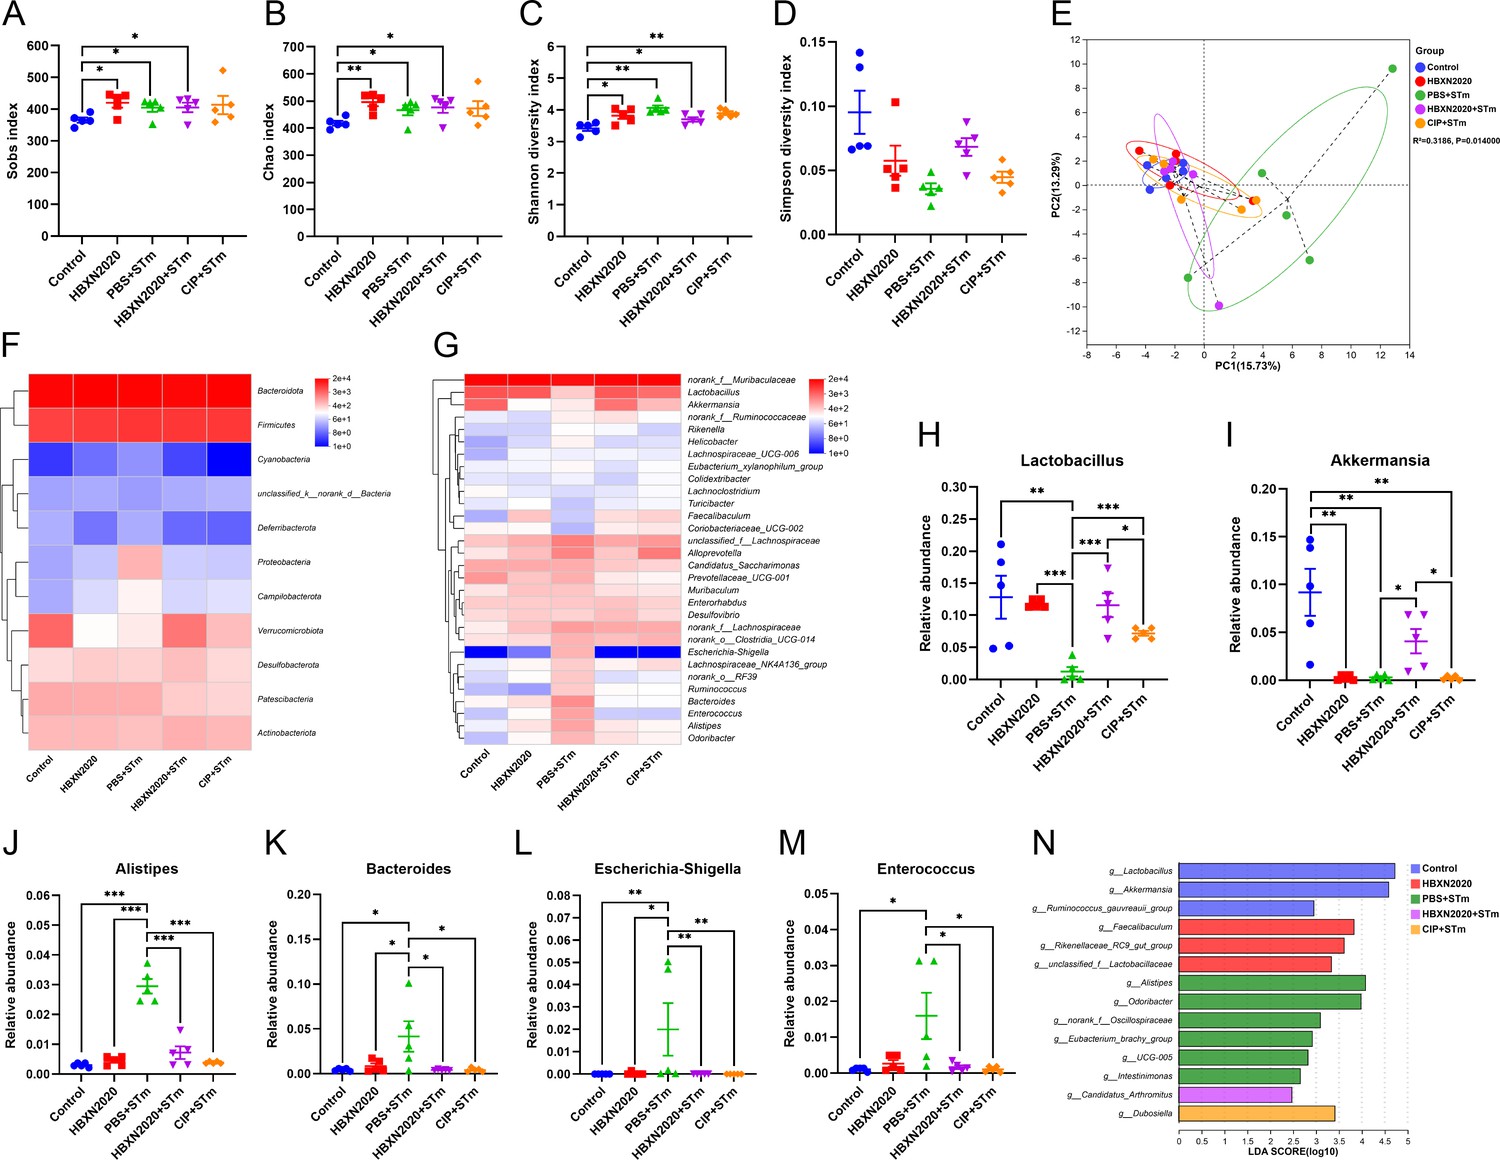
Prophylactic B. velezensis HBXN2020 spores regulated the composition of gut microbiota.
(A–D) Alpha diversity of the intestinal microbiota. Data were shown as mean values ± SEM (n=5). (E) The principal components analysis (PCA) plot showed the β diversity among different microbial community groups based on Bray-Curtis distance at the operational taxonomic unit (OTU) level. Heatmap of the community composition of colonic microbiota at the phylum (top 15 phyla) (F) and genus (top 30 genera) (G) level. Relative abundance of selected taxa (H) Lactobacillus, (I) Akkermansia, (J) Alistipes, (K) Bacteroides, (L) Escherichia-Shigella, and (M) Enterococcus. Data were shown as mean values ± SEM (n=5). (N) Analysis of differences in the microbial taxa by LEfSe (linear discriminant analysis [LDA] effect size) (LDA score>2) in different groups. Significance was evaluated by one-way analysis of variance (ANOVA) with Tukey’s multiple comparisons test (*, p<0.05, **, p<0.01, and ***, p<0.001).
-
Figure 10—source data 1
Raw numerical data for Figure 10A–D and H–M.
- https://cdn.elifesciences.org/articles/93423/elife-93423-fig10-data1-v1.xlsx
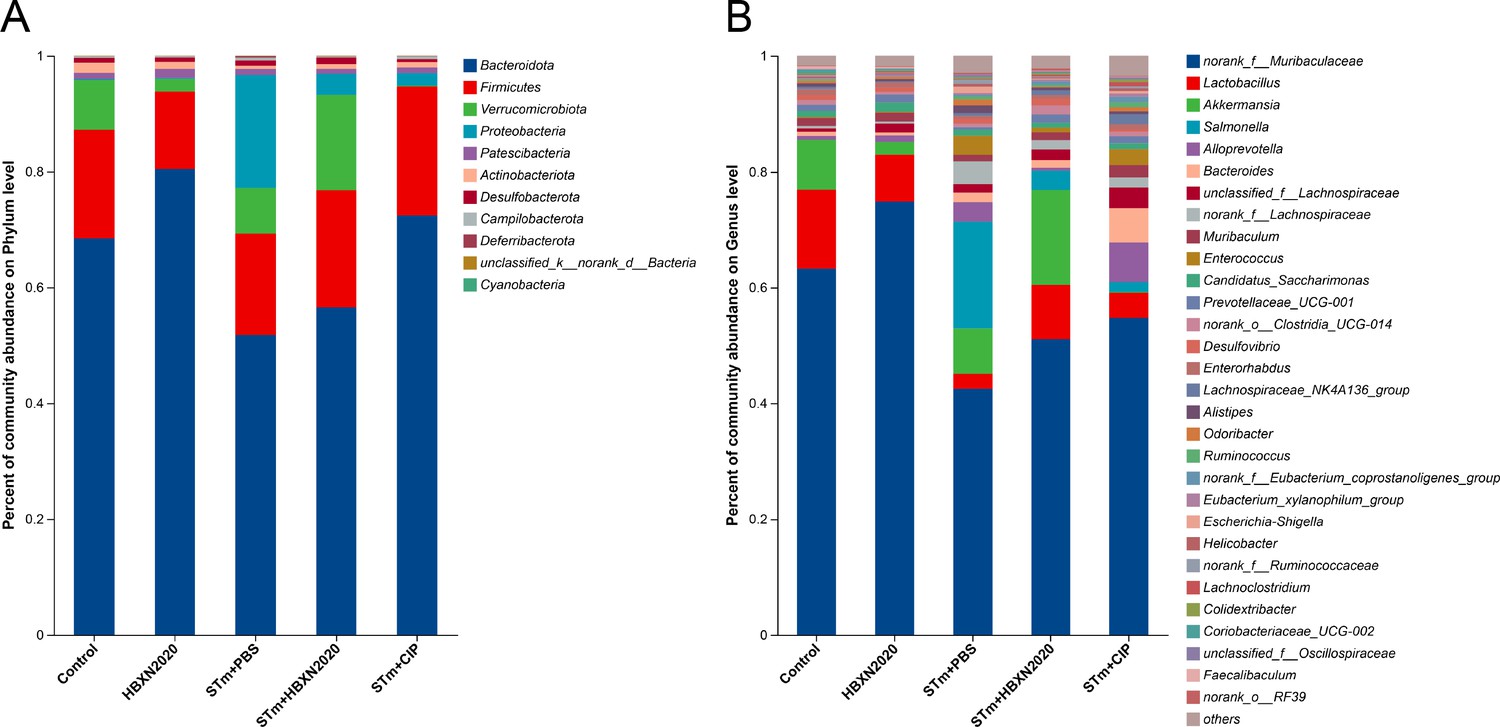
Figure 10—figure supplement 1
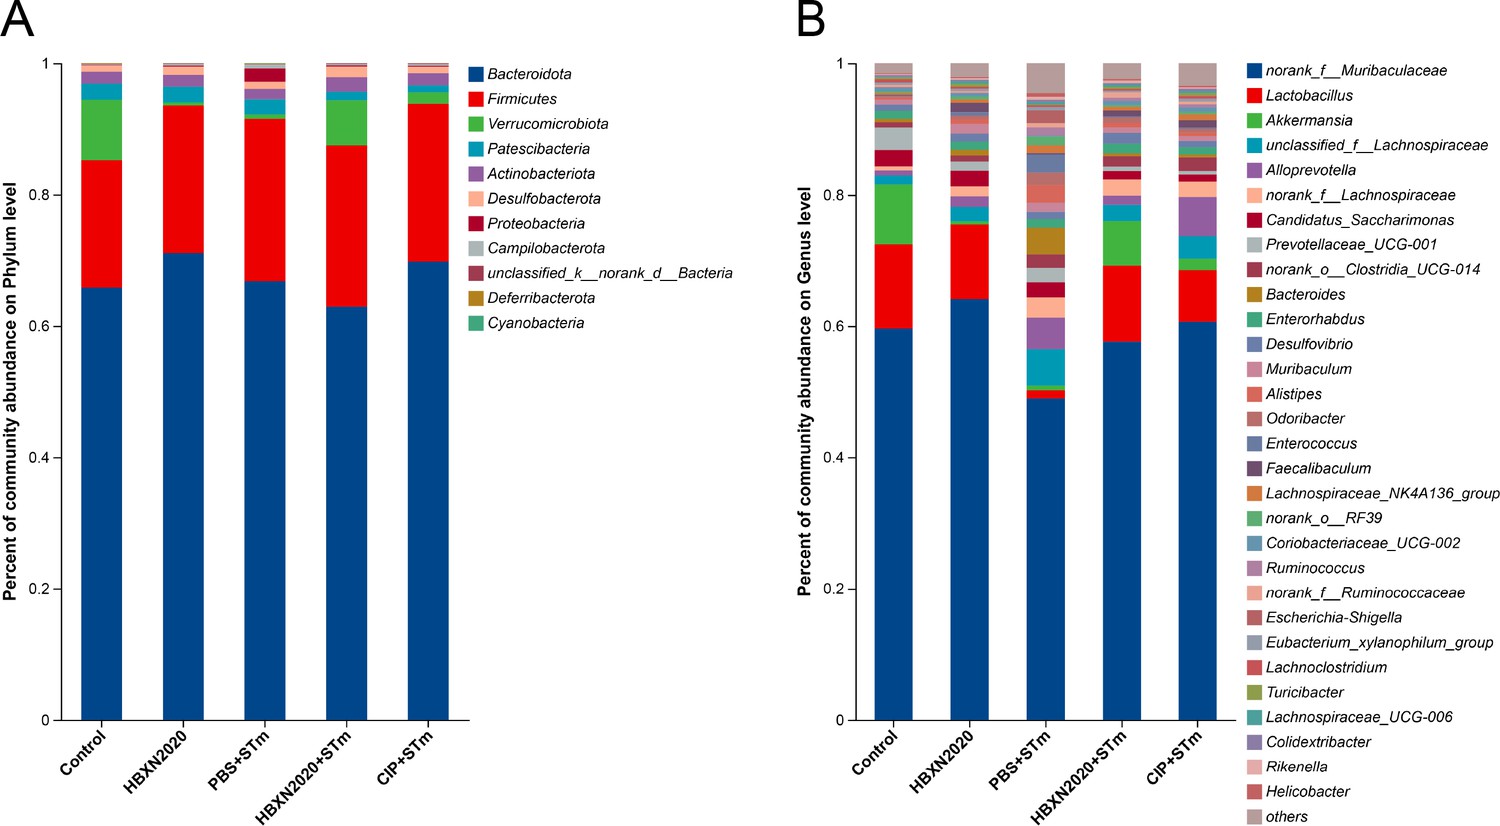
Analysis of the community compositions of colonic microbiota.
(A) Community compositions analysis at the phylum level. This bar graph shows the 15 most abundant communities. (B) Community compositions analysis at the genus level. This bar graph shows the communities of the top 30 genera.
Tables
Key resources table
| Reagent type (species) or resource | Designation | Source or reference | Identifiers | Additional information |
|---|---|---|---|---|
| Strain, strain background (Bacillus velezensis) | HBXN2020 | This paper | NCBI GenBank accession No: CP119399.1 | This strain is used in the entire text |
| Strain, strain background (Salmonella Typhimurium) | STm | ATCC | 14028 | |
| Strain, strain background (Escherichia coli) | 25922 | ATCC | 25922 | |
| Strain, strain background (E. coli) | 35150 | ATCC | 35150 | |
| Strain, strain background (E. coli) | EC024 | This paper | This strain is used in Figure 2B | |
| Strain, strain background (S. Typhimurium) | SL1344 | Gao et al., 2022 | ||
| Strain, strain background (S. Enteritidis) | SE006 | Gao et al., 2022 | ||
| Strain, strain background (Staphylococcus aureus) | 29213 | ATCC | 29213 | |
| Strain, strain background (S. aureus) | 43300 | ATCC | 43300 | |
| Strain, strain background (S. aureus) | S21 | This paper | This strain is used in Figure 2B | |
| Strain, strain background (Clostridium perfringens) | 2030 | CVCC | 2030 | |
| Strain, strain background (C. perfringens) | CP023 | This paper | This strain is used in Figure 2B | |
| Strain, strain background (C. perfringens) | CP002 | This paper | This strain is used in Figure 2B | |
| Strain, strain background (Streptococcus suis) | SC19 | Duan et al., 2023 | ||
| Strain, strain background (S. suis) | SS006 | This paper | This strain is used in Figure 2B | |
| Strain, strain background (Pasteurella multocida) | PM002 | This paper | This strain is used in Figure 2B | |
| Strain, strain background (P. multocida) | PM008 | This paper | This strain is used in Figure 2B | |
| Strain, strain background (Actinobacillus pleuropneumoniae) | APP015 | This paper | This strain is used in Figure 2B | |
| Strain, strain background (A. pleuropneumoniae) | APP017 | This paper | This strain is used in Figure 2B | |
| Sequence-based reagent | Tnfa-F | This paper | qPCR primers | CCACGCTCTTCTGTCTACTG |
| Sequence-based reagent | Tnfa-R | This paper | qPCR primers | ACTTGGTGGTTTGCTACGA |
| Sequence-based reagent | Il1b-F | This paper | qPCR primers | ACCTGTGTCTTTCCCGTGG |
| Sequence-based reagent | Il1b-R | This paper | qPCR primers | TCATCTCGGAGCCTGTAGTG |
| Sequence-based reagent | Il6-F | This paper | qPCR primers | GAGCCCACCAAGAACGATA |
| Sequence-based reagent | Il6-R | This paper | qPCR primers | TTGTCACCAGCATCAGTCC |
| Sequence-based reagent | Il10-F | This paper | qPCR primers | TGGACAACATACTGCTAACCG |
| Sequence-based reagent | Il10-R | This paper | qPCR primers | GGGCATCACTTCTACCAGGT |
| Sequence-based reagent | Tjp1-F | This paper | qPCR primers | CTGGTGAAGTCTCGGAAAAATG |
| Sequence-based reagent | Tjp1-R | This paper | qPCR primers | CATCTCTTGCTGCCAAACTATC |
| Sequence-based reagent | Ocln-F | This paper | qPCR primers | CAGGATGCCAATTACCATCAAG |
| Sequence-based reagent | Ocln-R | This paper | qPCR primers | GGGTTCACTCCCATTATGTACA |
| Sequence-based reagent | Cldn1-F | This paper | qPCR primers | AGATACAGTGCAAAGTCTTCGA |
| Sequence-based reagent | Cldn1-R | This paper | qPCR primers | CAGGATGCCAATTACCATCAAG |
| Sequence-based reagent | Muc2-F | This paper | qPCR primers | CGAGCACATCACCTACCACATCATC |
| Sequence-based reagent | Muc2-R | This paper | qPCR primers | TCCAGAATCCAGCCAGCCAGTC |
| Sequence-based reagent | β-actin-F | This paper | qPCR primers | GACCTCTATGCCAACACAGT |
| Sequence-based reagent | β-actin-R | This paper | qPCR primers | CACCAATCCACACAGAGTAC |
| Commercial assay or kit | HiScript III RT SuperMix | Vazyme Biotechnology Co., Ltd | #R323-01 | |
| Commercial assay or kit | qPCR SYBR Green Master Mix | Yeasen Biotechnology Co., Ltd | #11203ES08 | |
| Commercial assay or kit | E.Z-N.A Stool DNA Kit | Omega | #D4015-01 | |
| Chemical compound, drug | Kanamycin | Solarbio | #K8020 | |
| Chemical compound, drug | Ciprofloxacin | Solarbio | #C9710 | |
| Chemical compound, drug | Ampicillin | Hangzhou Binhe Microorganism Reagent Co., Ltd | #C002 | 10 µg/tablet |
| Chemical compound, drug | Meropenem | Hangzhou Binhe Microorganism Reagent Co., Ltd | #C102 | 10 µg/tablet |
| Chemical compound, drug | Piperacillin | Hangzhou Binhe Microorganism Reagent Co., Ltd | #C005 | 10 µg/tablet |
| Chemical compound, drug | Gentamycin | Hangzhou Binhe Microorganism Reagent Co., Ltd | #C017 | 10 µg/tablet |
| Chemical compound, drug | Tetracycline | Hangzhou Binhe Microorganism Reagent Co., Ltd | #C021 | 30 µg/tablet |
| Chemical compound, drug | Doxycycline | Hangzhou Binhe Microorganism Reagent Co., Ltd | #C032 | 30 µg/tablet |
| Chemical compound, drug | Minocycline | Hangzhou Binhe Microorganism Reagent Co., Ltd | #C046 | 30 µg/tablet |
| Chemical compound, drug | Erythromycin | Hangzhou Binhe Microorganism Reagent Co., Ltd | #C023 | 15 µg/tablet |
| Chemical compound, drug | Enrofloxacin | Shunyou Shanghai Biotechnology Co., Ltd | #CT0639B | 5 µg/tablet |
| Chemical compound, drug | Ofloxacin | Hangzhou Binhe Microorganism Reagent Co., Ltd | #C044 | 5 µg/tablet |
| Chemical compound, drug | Sulfamethoxazole | Shunyou Shanghai Biotechnology Co., Ltd | #CT0051B | 25 µg/tablet |
| Chemical compound, drug | Trimethoprim-sulfamethoxazole | Hangzhou Binhe Microorganism Reagent Co., Ltd | #C027 | 23.75 µg/tablet |
| Chemical compound, drug | Polymyxin B | Shunyou Shanghai Biotechnology Co., Ltd | #CT0044B | 300 U/tablet |
| Chemical compound, drug | Teicoplanin | Shunyou Shanghai Biotechnology Co., Ltd | #CT0647B | 30 µg/tablet |
| Chemical compound, drug | Trimethoprim | Shunyou Shanghai Biotechnology Co., Ltd | #CT0076B | 5 µg/tablet |
| Chemical compound, drug | Florfenicol | Shunyou Shanghai Biotechnology Co., Ltd | #CT1754B | 30 µg/tablet |
| Chemical compound, drug | Spectinomycin | Shunyou Shanghai Biotechnology Co., Ltd | #CT0046B | 10 µg/tablet |
| Chemical compound, drug | Nitrofurantoin | Shunyou Shanghai Biotechnology Co., Ltd | #CT0036B | 300 µg/tablet |
| Chemical compound, drug | Rifampicin | Hangzhou Binhe Microorganism Reagent Co., Ltd | #C013 | 5 µg/tablet |
Additional files
-
Supplementary file 1
Determination of antibacterial activity of different Bacillus.
- https://cdn.elifesciences.org/articles/93423/elife-93423-supp1-v1.docx
-
Supplementary file 2
HBXN2020 genome features and clusters of secondary metabolic synthesis genes.
(a) HBXN2020 genome features. (b) Clusters of secondary metabolic synthesis genes in HBXN2020.
- https://cdn.elifesciences.org/articles/93423/elife-93423-supp2-v1.docx
-
Supplementary file 3
The bacterial strains, RT-qPCR primers, and disease activity index scoring schemes in this study.
(a) The bacterial strains used in this study. (b) The primer sequences used for the RT-qPCR. (c) Disease activity index (DAI) parameters and their associated scoring schemes.
- https://cdn.elifesciences.org/articles/93423/elife-93423-supp3-v1.docx
-
MDAR checklist
- https://cdn.elifesciences.org/articles/93423/elife-93423-mdarchecklist1-v1.docx
Download links
A two-part list of links to download the article, or parts of the article, in various formats.
Downloads (link to download the article as PDF)
Open citations (links to open the citations from this article in various online reference manager services)
Cite this article (links to download the citations from this article in formats compatible with various reference manager tools)
Bacillus velezensis HBXN2020 alleviates Salmonella Typhimurium infection in mice by improving intestinal barrier integrity and reducing inflammation
eLife 13:RP93423.
https://doi.org/10.7554/eLife.93423.4


