Sperm induction of somatic cell-cell fusion as a novel functional test
- Department of Biology, Technion-Israel Institute of Technology, Israel
Figures
Figure 1 with 2 supplements
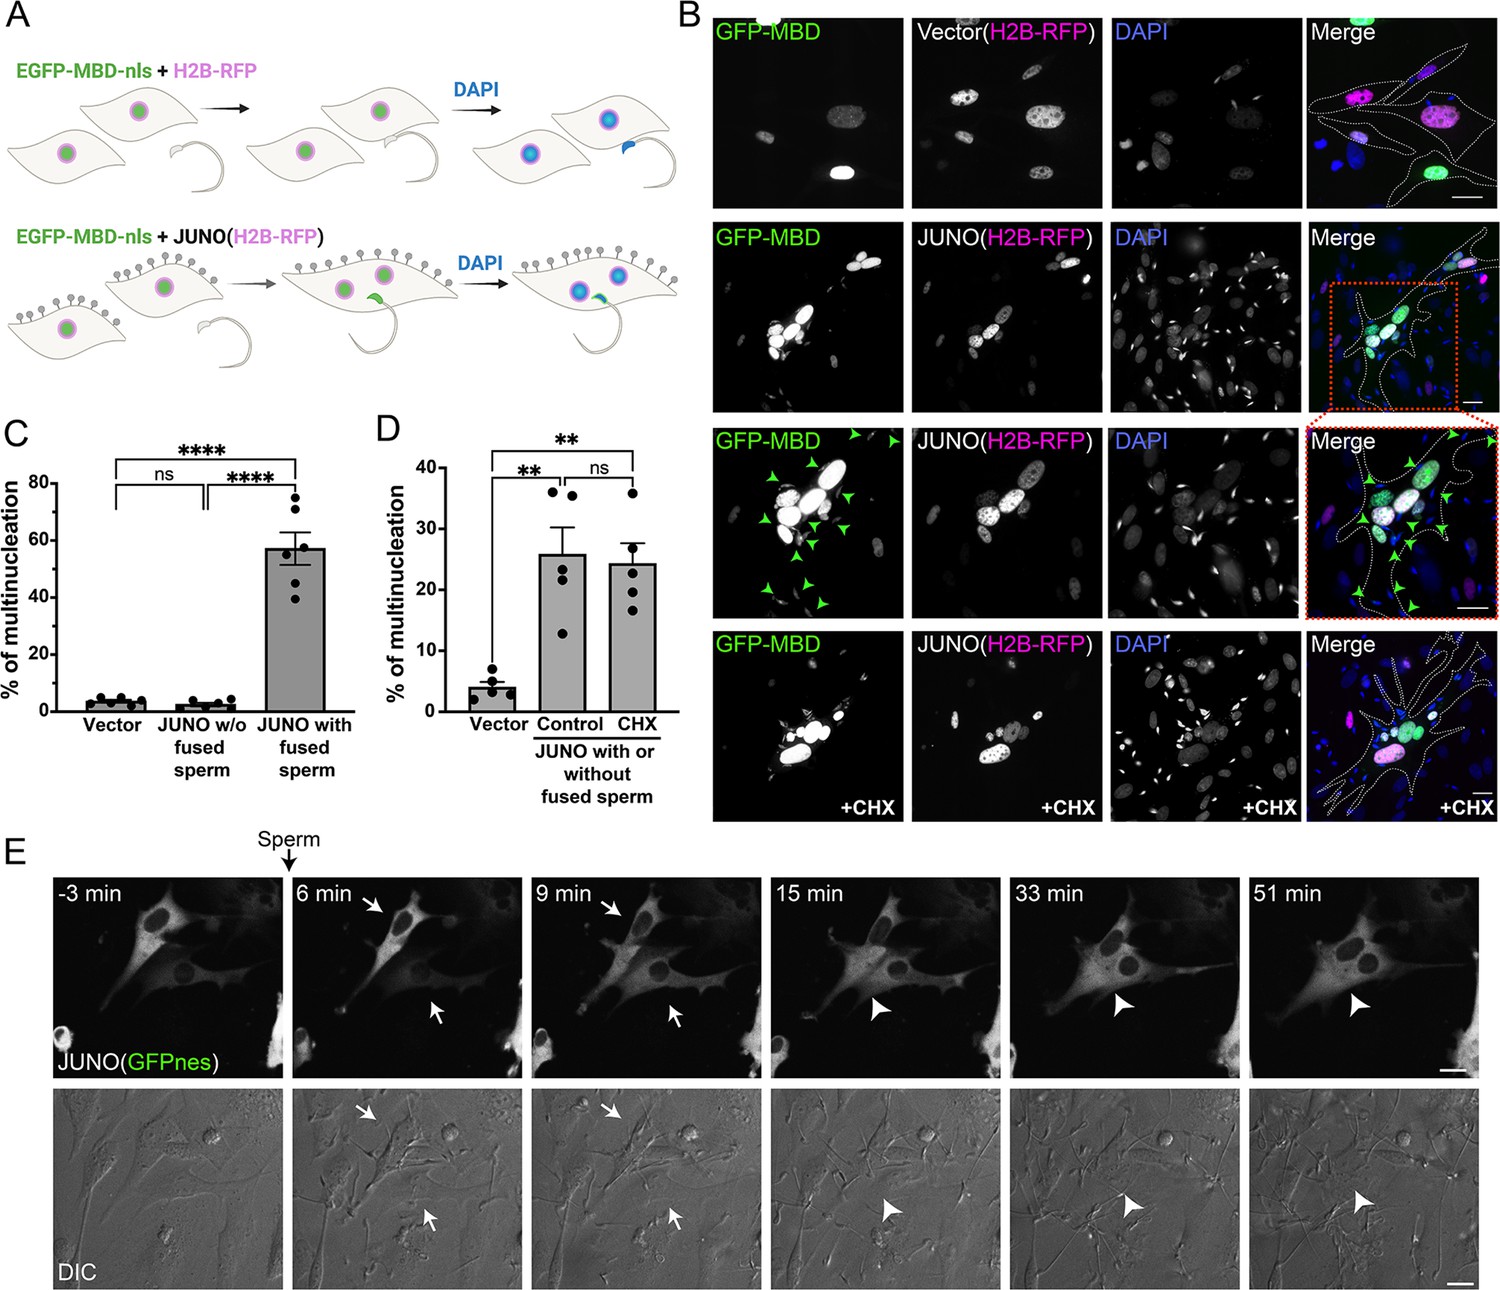
Sperm induce syncytia formation of fibroblasts.
(A) Scheme of experimental design: Baby hamster kidney (BHK) cells were transfected with either pCI::H2B-RFP or pCI::JUNO::H2B-RFP vectors and pcDNA3.1-EGFP-MBD-nls. Mouse sperm were obtained from the epididymis of adult mice and capacitated in HTF capacitating medium. Sperm cells were co-incubated with the BHK cells for 4 hr and then the cells were fixed, and stained with DAPI to detect the DNA. Gray lollipops represent JUNO molecules. (B) Representative images showing H2B-RFP (magenta), GFP-MBD (green), DAPI (blue) channels, and the merge. Dotted lines contour relevant cells. Green arrowheads point to fused sperm (GFP-positive). The presence of 200 µg/ml of cycloheximide is indicated (CHX). Scale bars, 20 µm. (C) The percentage of multinucleation was defined as the ratio between the nuclei in multinucleated cells (NuM) and the total number of nuclei in fluorescent cells (NuF), as follows: % of multinucleation = (NuM/NuF) × 100. We show individual data and means ± SEM of six independent experiments. The number of nuclei counted per experiment and per treatment was 500. For JUNO-transfected cells, multinucleation was counted separately for cells with and without sperm fused to them. Comparisons were made with one-way ANOVA followed by Tukey’s test. ns = non-significant, ****p<0.0001. (D) In another set of experiments, JUNO-transfected cells were treated with 200 µg/ml CXH to inhibit de novo synthesis of proteins. Multinucleation was quantified for the whole population of transfected cells. We show individual data and means ± SEM of five independent experiments. ns = non-significant, **p<0.01. (E) Time-lapse images from a movie showing sperm-induced cell-cell fusion. BHK cells were transfected with the pCI::JUNO::GFPnes plasmid and sperm were added at time = 0 min. Arrows and arrowheads indicate contacting and fused cells, respectively. The green channel (GFPnes) and the DIC images are shown (see also Video 1). Scale bars, 20 µm.
© 2024, Brukman et al. Figure 1 was created using BioRender, and is published under a CC BY-NC-ND 4.0 license. Further reproductions must adhere to the terms of this license.
Figure 1—figure supplement 1

Effect of sperm number on syncytia formation.
Baby hamster kidney (BHK) cells were transfected with pCI::JUNO::H2B-RFP vectors and pcDNA3.1-EGFP-MBD-nls co-incubated with capacitated sperm for 4 hr. (A) The distribution of BHK cells with 1, 2, 3, or 4 nuclei presenting different amounts of sperm fused to them. (B) Different amounts of sperm were added to the cells. The percentage of multinucleation was defined as the ratio between the nuclei in multinucleated cells (NuM) and the total number of nuclei in fluorescent cells (NuF), as follows: % of multinucleation = (NuM/NuF) × 100. We show individual data and means ± SEM of four independent experiments. The number of nuclei counted per experiment and per treatment was 1000. Comparisons were made with one-way ANOVA followed by Dunnett’s test against the control without sperm (0). ***p<0.001, ****p<0.0001.
Figure 1—figure supplement 2
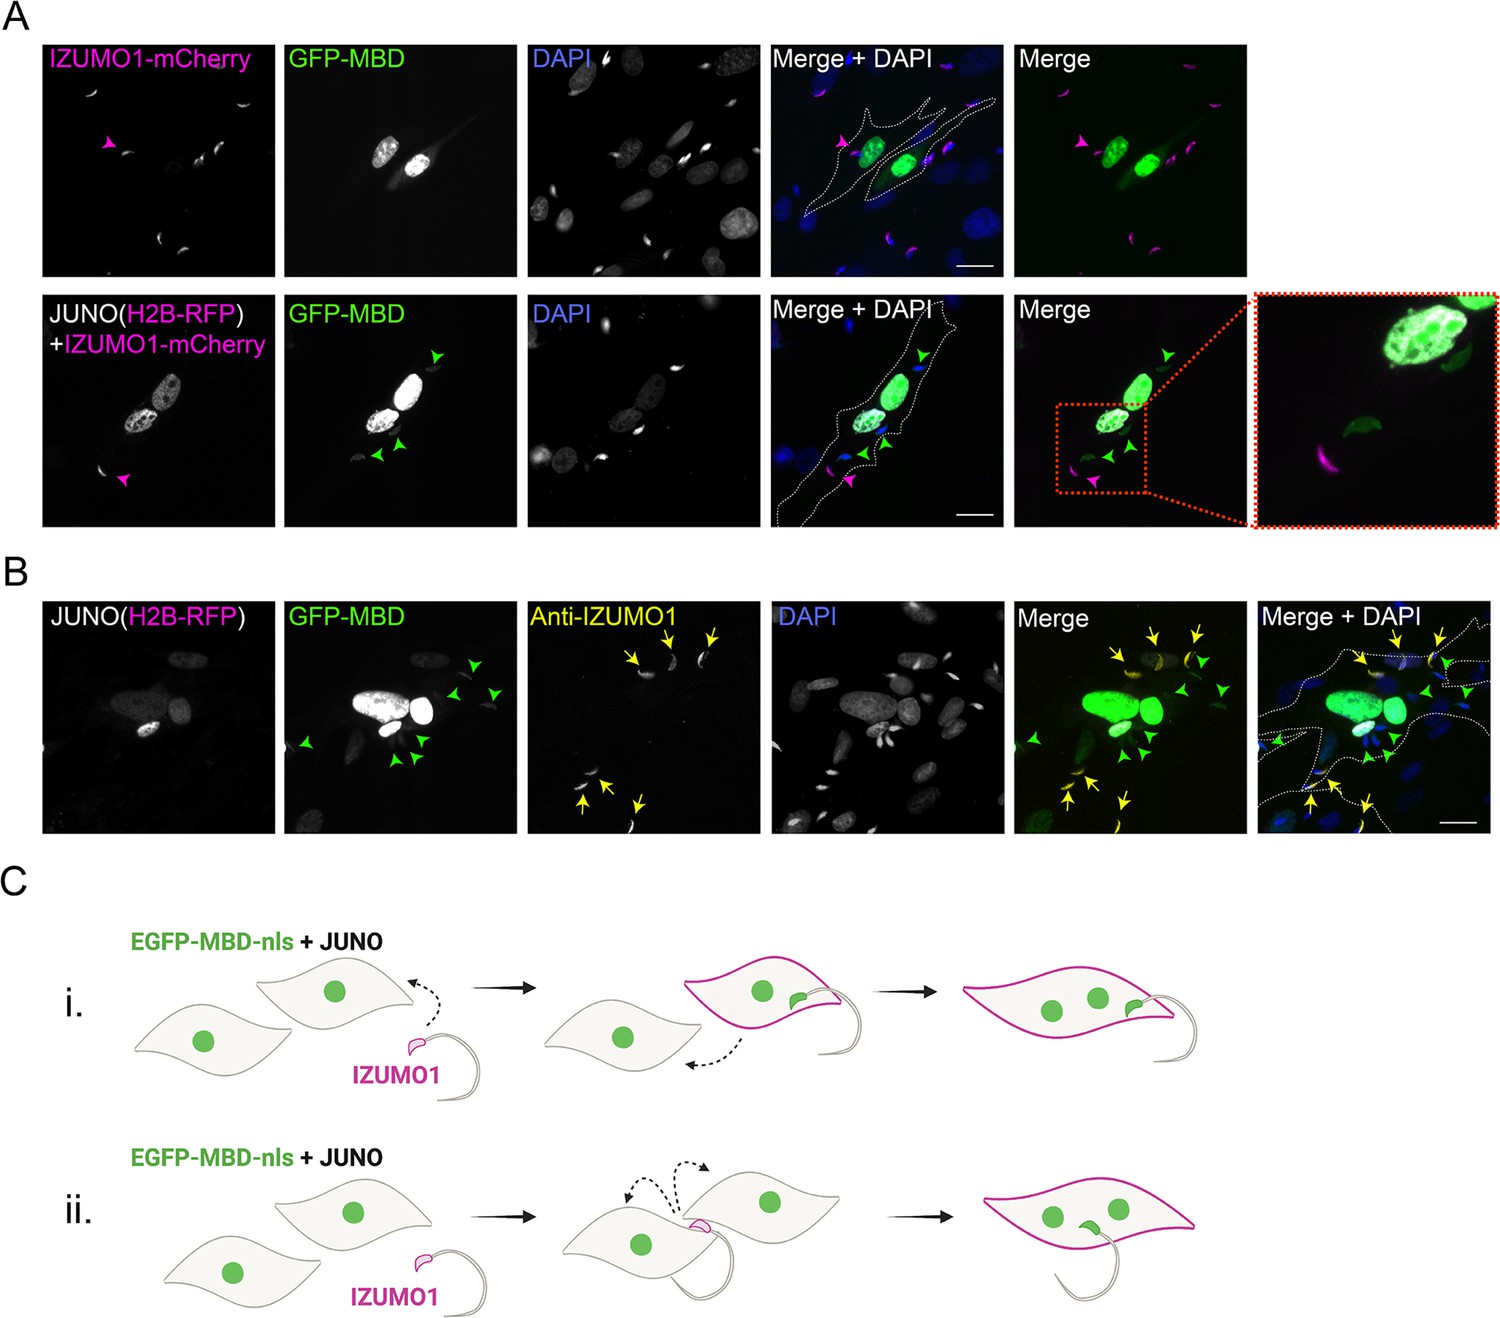
IZUMO1 diffuses into the target cell upon sperm fusion.
(A) Baby hamster kidney (BHK) cells were transfected with pcDNA3.1-EGFP-MBD-nls alone or together with pCI::JUNO::H2B-RFP and co-incubated with sperm obtained from transgenic mice expressing IZUMO1-mCherry. Representative images showing H2B-RFP and Izumo1-mCherry (magenta), GFP-MBD (green), DAPI (blue) channels, and the merge with and without DAPI. Dotted lines contour relevant cells. Scale bar, 20 µm. Magenta arrowheads point to unfused sperm (GFP-negative) presenting IZUMO1-mCherry signal while green arrowheads point to fused sperm (GFP-positive) without Izumo1-mCherry signal. (B) BHK cells were transfected with pcDNA3.1-EGFP-MBD-nls together with pCI::JUNO::H2B-RFP and co-incubated with wild-type mouse sperm. After fixation, an immunostaining against IZUMO1 was performed. Representative images showing H2B-RFP (magenta), GFP-MBD (green), IZUMO1 staining (yellow), DAPI (blue) channels, and the merge with and without DAPI. Dotted lines contour relevant cells. Scale bar, 20 µm. Yellow arrows point to unfused sperm (GFP-negative) presenting IZUMO1 signal while green arrowheads point to fused sperm (GFP-positive) without IZUMO1 signal. (C) Models for sperm-induced cell-cell fusion. In general, this phenomenon resembles the so-called ‘fusion from without’ in which viruses can induce the fusion of the target cells (Falke et al., 1985; Tang et al., 2021; Edwards and Brown, 1986). i- One sperm fuses with a BHK cell, IZUMO1 is transferred by diffusion and mediates the fusion to another cell. ii- One sperm fuses to two BHK cells bridging them and inducing the formation of a syncytium.
© 2024, Brukman et al. Figure 1—figure supplement 2 was created using BioRender, and is published under a CC BY-NC-ND 4.0 license. Further reproductions must adhere to the terms of this license.
Figure 2 with 1 supplement
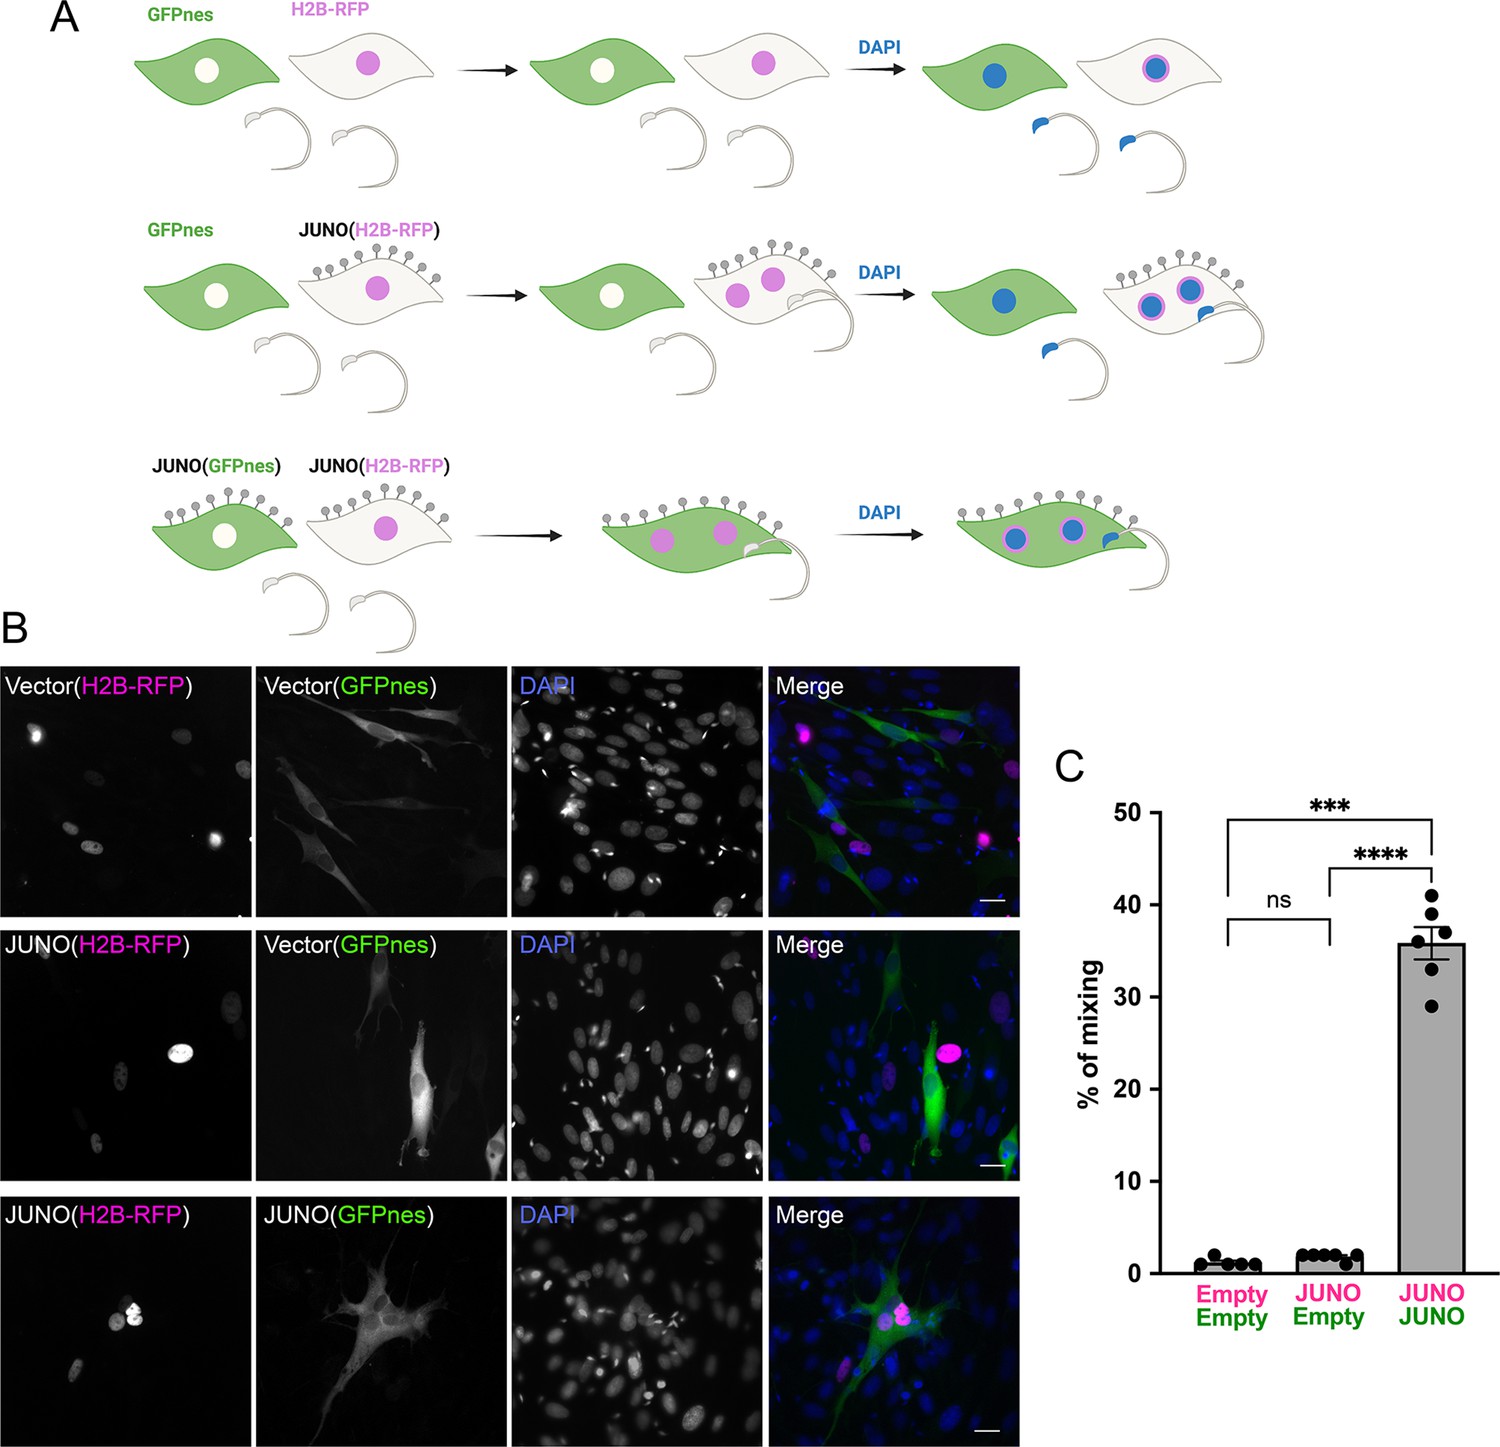
Sperm-induced fusion is dependent on JUNO.
(A) Scheme of experimental design. Baby hamster kidney (BHK) cells transfected with pCI::GFPnes or pCI::H2B-RFP empty vectors or containing the coding sequence for the expression of JUNO were mixed as indicated. Later, the cells were co-incubated with sperm for 4 hr, fixed, and stained with DAPI. (B) Representative images for each treatment. Each separate channel for GFPnes (green cytoplasm), H2B-RFP (magenta nuclei), and DAPI staining (blue) are shown. Scale bars, 20 µm. Fused, mixed cells contain both GFPnes and H2B-RFP staining. (C) Quantification of content mixing experiments. The percentage of mixing was defined as the ratio between the nuclei in mixed cells (NuM) and the total number of nuclei in mixed cells and fluorescent cells whose cell bodies are in contact that did not fuse (NuC), as follows: % of mixing = (NuM/[NuM +NuC]) × 100. Bar chart showing individual experiment values (each corresponding to 1000 nuclei) and means ± SEM of six independent experiments. Comparisons by one-way ANOVA followed by Tukey’s test. ns = non-significant, ***p<0.001, ****p<0.0001.
© 2024, Brukman et al. Figure 2 was created using BioRender, and is published under a CC BY-NC-ND 4.0 license. Further reproductions must adhere to the terms of this license.
Figure 2—figure supplement 1

The timing of sperm fusion to somatic cells is critical for content mixing.
(A) Scheme of experimental design. Baby hamster kidney (BHK) cells transfected with pCI::JUNO::GFPnes were incubated or not with sperm for 1 hr. When indicated the sperm were washed and cells previously transfected with pCI::H2B-RFP, pCI::JUNO::H2B-RFP, or pCI::VSV-G::H2B-RFP were added. After 18 hr, the cells were fixed, and stained with DAPI. To activate VSV-G a treatment with low pH was done. In parallel, the regular mixing assay was performed in which BHK cells transfected with pCI::JUNO::GFPnes or pCI::JUNO::H2B-RFP were previously mixed and then co-incubated (or not) with sperm for 4 hr, fixed, and stained with DAPI. (B) Quantification of content mixing experiments. The percentage of mixing was defined as the ratio between the nuclei in mixed cells (NuM) and the total number of nuclei in mixed cells and fluorescent cells whose cell bodies are in contact that did not fuse (NuC), as follows: % of mixing = (NuM/[NuM +NuC]) × 100. Bar chart showing individual experiment values (each corresponding to 1000 nuclei) and means ± SEM of four independent experiments. For the 18 hr mixing: comparisons by one-way ANOVA followed by Dunnett’s test against the negative control. For the 4 hr mixing: comparison by t-Student’s test. ns = non-significant, ***p<0.001, ****p<0.0001. (C) Multinucleation was quantified for the pCI::JUNO::GFPnes-transfected cells for the indicated conditions. We show individual data and means ± SEM of four independent experiments. Comparisons by one-way ANOVA followed by Tukey’s test. ns = non-significant, ****p<0.0001.
© 2024, Brukman et al. Figure 2—figure supplement 1. was created using BioRender, and is published under a CC BY-NC-ND 4.0 license. Further reproductions must adhere to the terms of this license.
Figure 3 with 1 supplement
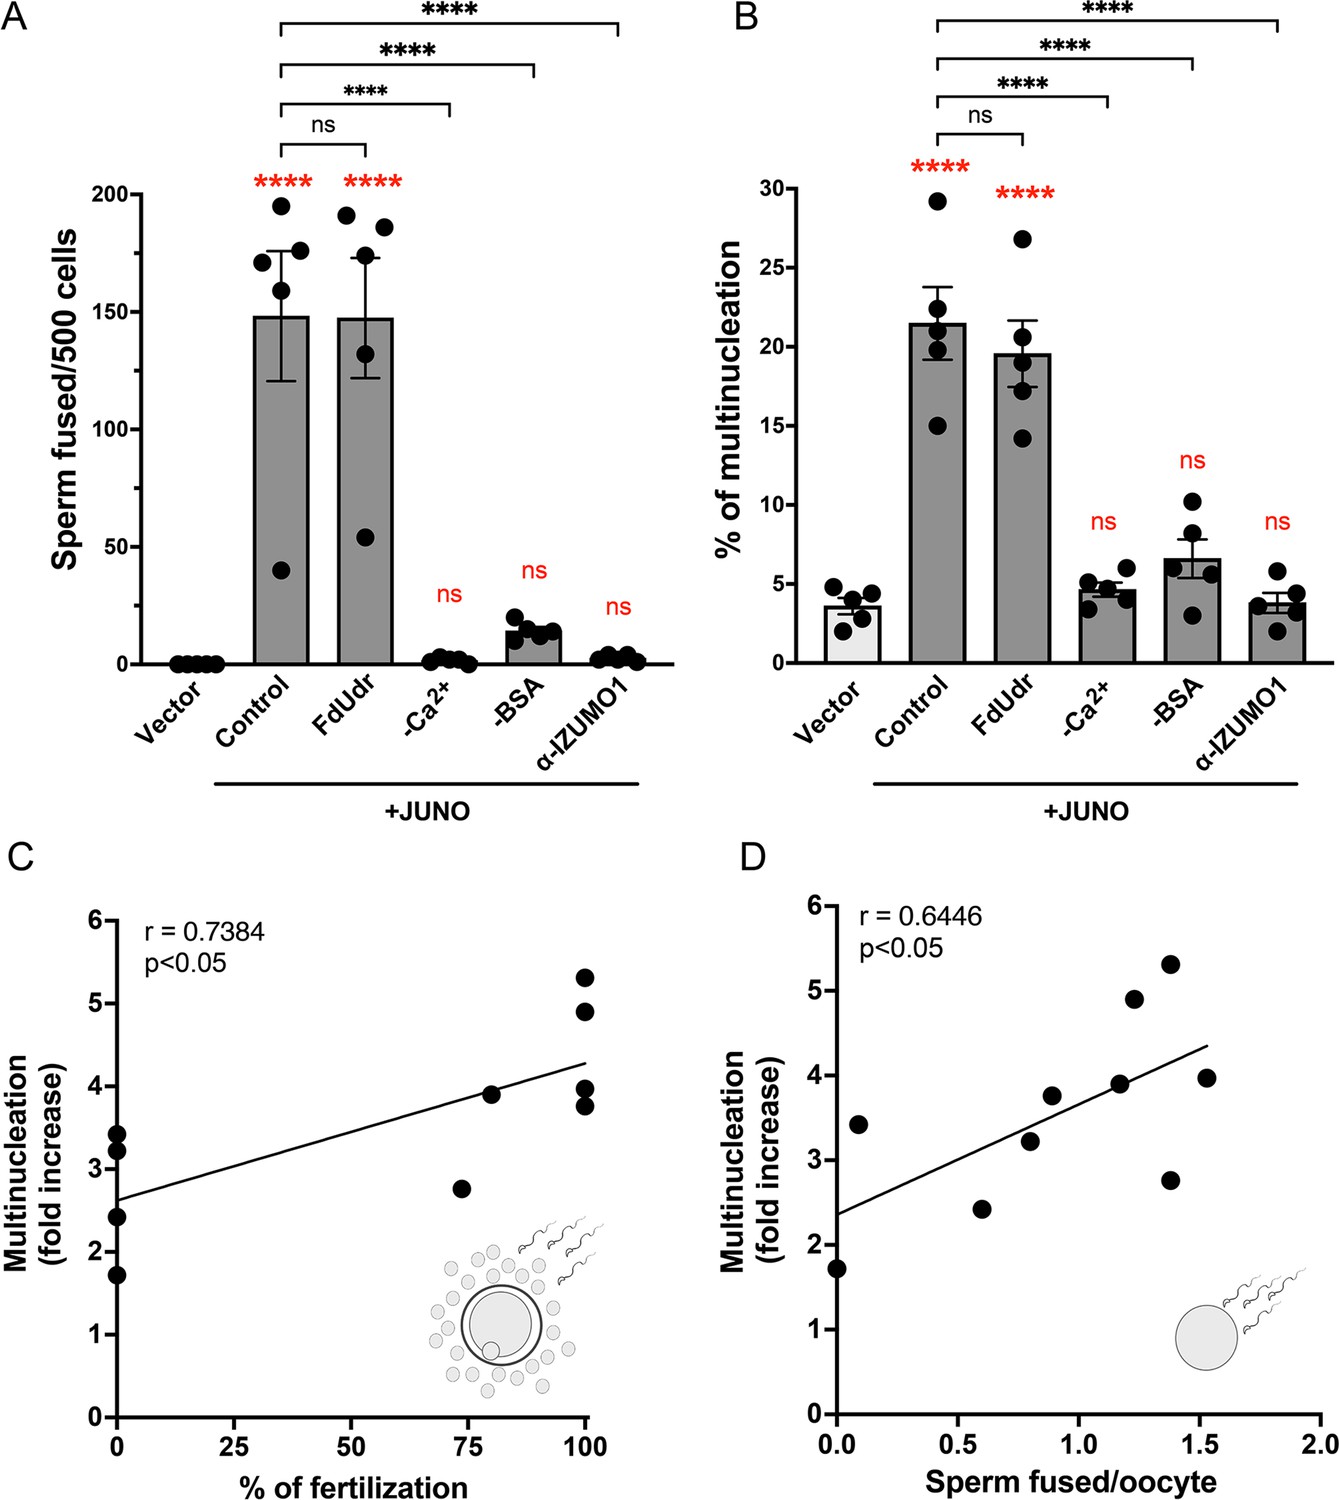
Syncytia formation requires a functional sperm, is dependent on IZUMO1 and is not affected by an inhibitor of cell division.
Baby hamster kidney (BHK) cells were transfected with pcDNA3.1-EGFP-MBD-nls together with pCI::H2B-RFP (empty vector) or pCI::JUNO::H2B-RFP and co-incubated with control sperm in the presence of 20 µM of the inhibitor of cell division FdUdr or of 1 µg/µl of anti-IZUMO1 antibody (clone Mab120). Alternatively, cells were mixed with sperm incubated in a medium lacking calcium (-Ca2+) or bovine serum albumin (-BSA); both conditions fail to support sperm capacitation. The number of sperm fused per 500 fluorescent cells (A) and the percentage of multinucleation (B) were determined. Bar charts showing individual experiment values and means ± SEM of five independent experiments. Comparisons by one-way ANOVA followed by Tukey’s test. In red are the comparisons against the empty vector. ns = non-significant, ***p<0.001, ****p<0.0001. (C–D) Multinucleation levels are relative to the control without sperm as a function of the percentage of fertilized eggs when cumulus-oocytes complexes were used (C), or as a function of the number of sperm fused per oocytes when ZP-free eggs were employed (D). Each dot corresponds to a different mouse. The Pearson’s coefficient ‘r’ and the significance are included in each panel.
© 2024, Brukman et al. Figure 3 was created using BioRender, and is published under a CC BY-NC-ND 4.0 license. Further reproductions must adhere to the terms of this license.
Figure 3—figure supplement 1
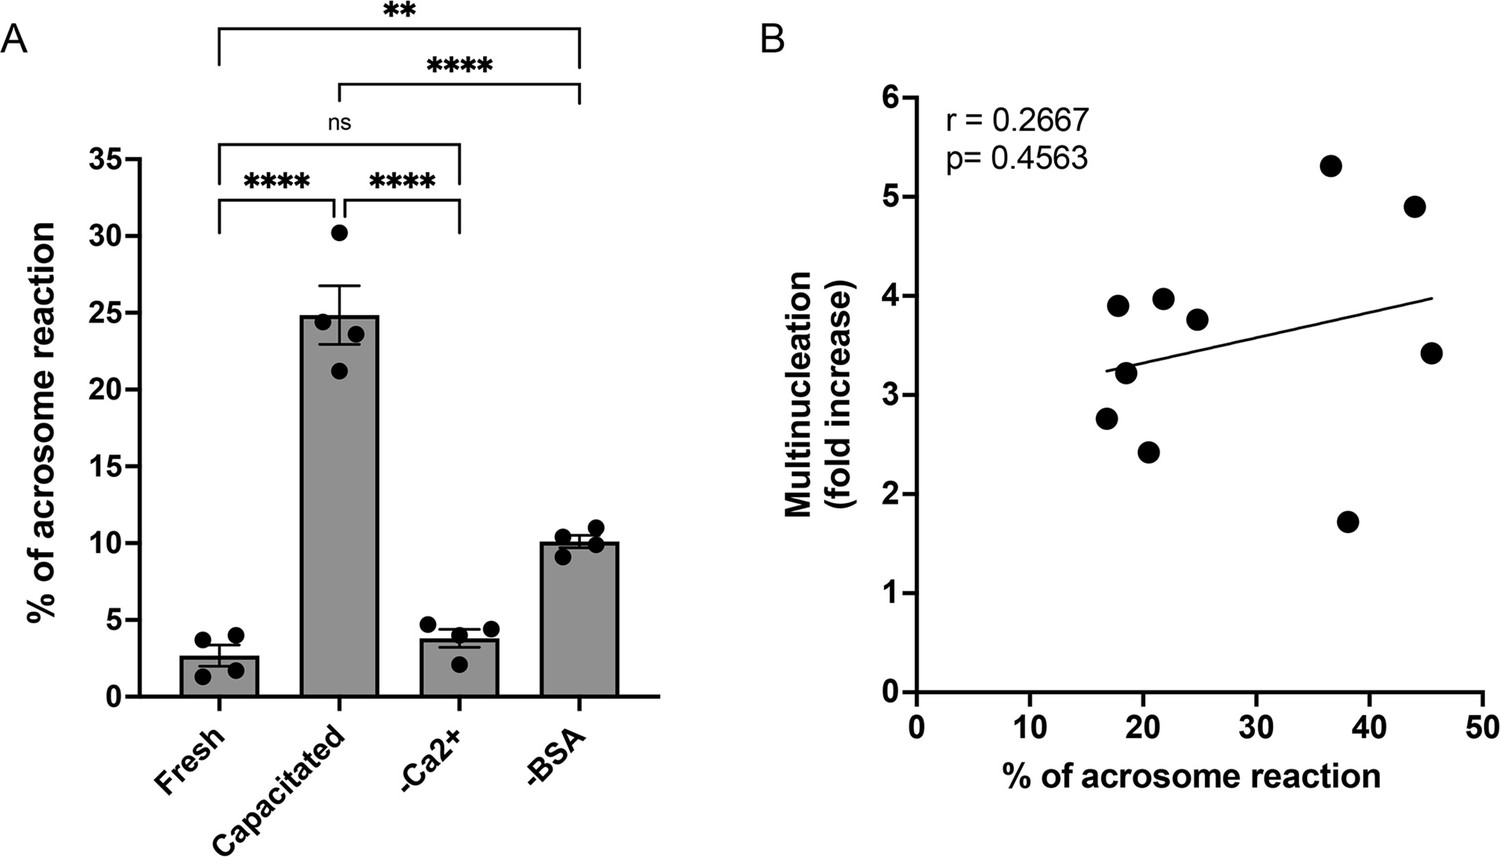
Acrosome reaction is reduced in non-capacitated sperm, but does not correlate with sperm-induced cell-cell fusion requiring JUNO (SPICER) levels in capacitated conditions.
(A) Percentage of acrosome reaction of fresh sperm, capacitated sperm, and sperm incubated in media lacking calcium (-Ca2+) or bovine serum albumin (-BSA). Comparisons by one-way ANOVA followed by Tukey’s test. ns = non-significant, **p<0.01, ****p<0.0001. (B) Multinucleation levels relative to the control without sperm as a function of the percentage of acrosome reaction after capacitation. Each dot corresponds to a different mouse. The Pearson’s coefficient ‘r’ and the significance are included.
Figure 4
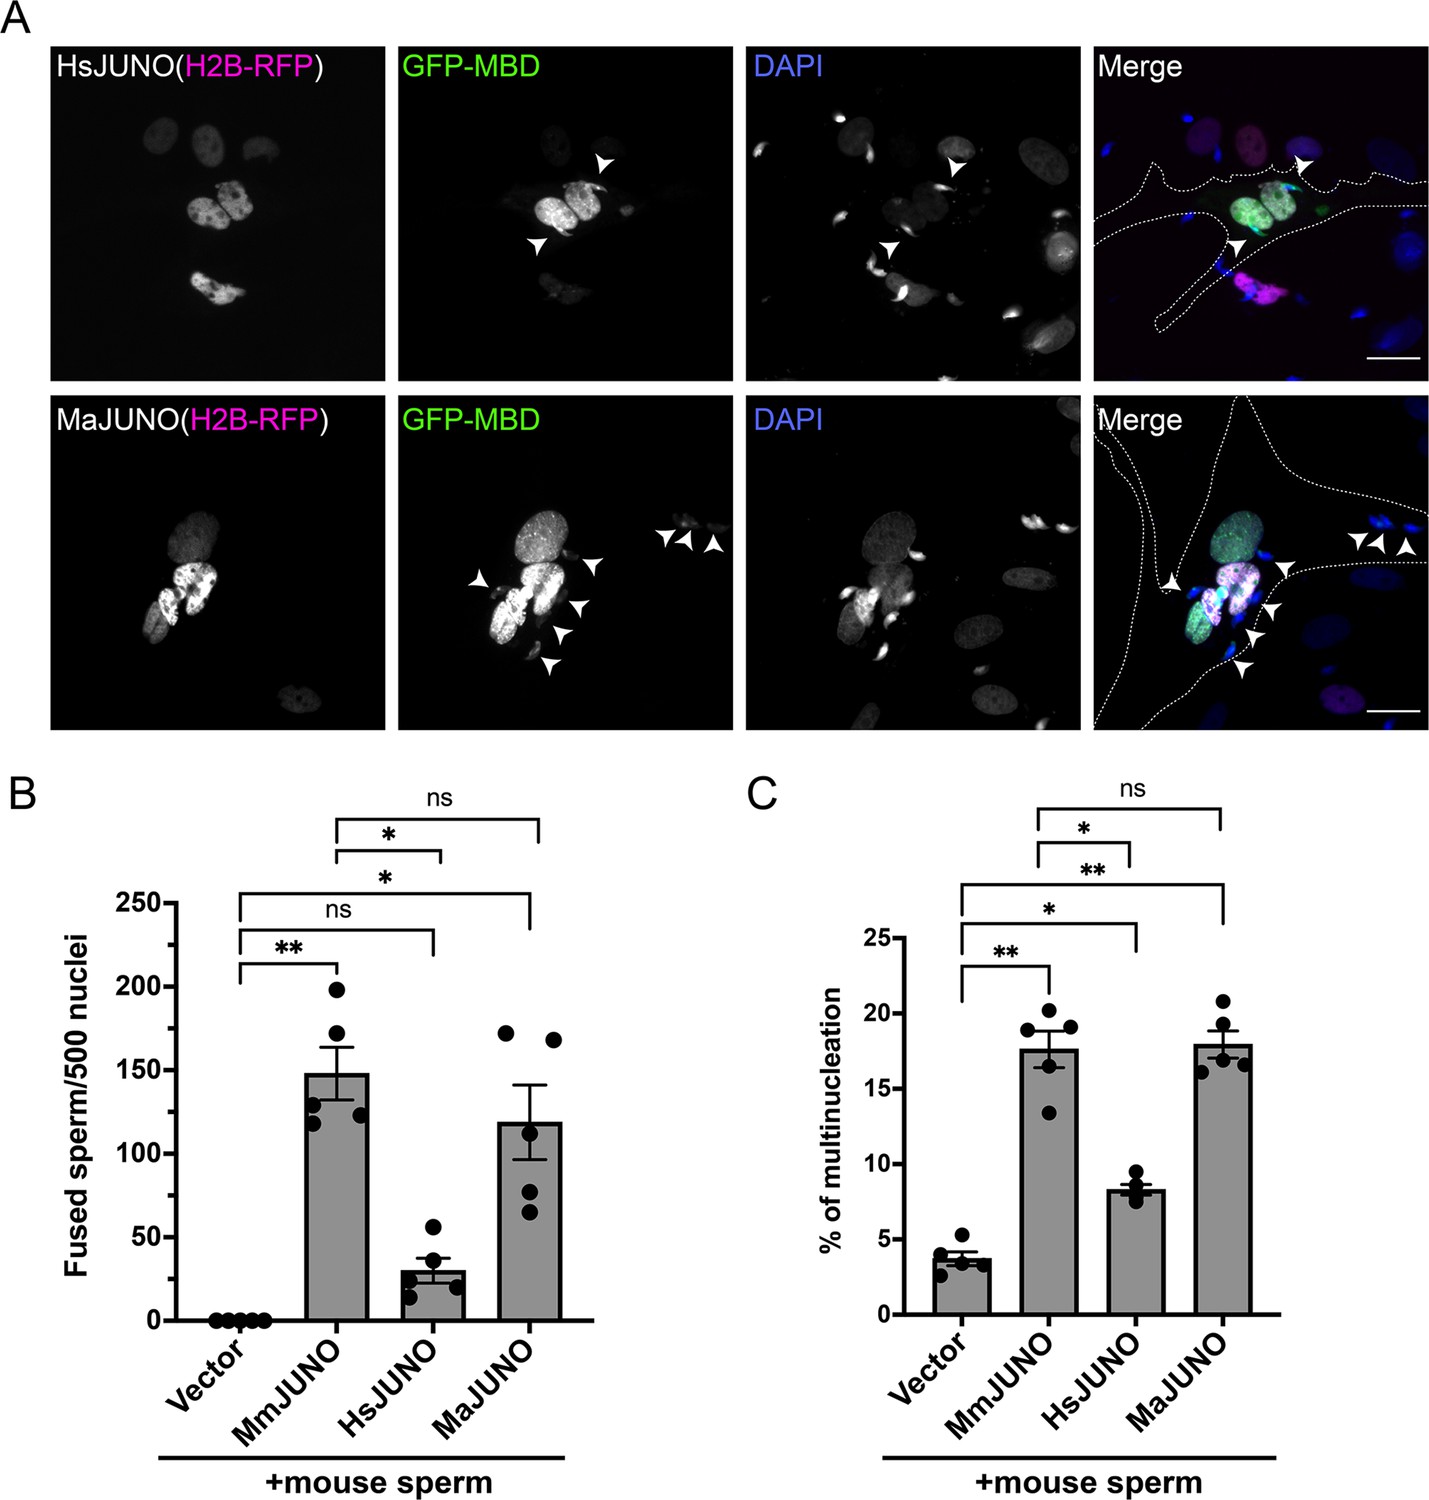
Sperm induce BHK-BHK cell fusion in a species-specific manner.
Baby hamster kidney (BHK) cells were transfected with pcDNA3.1-EGFP-MBD-nls together pCI::H2B-RFP (empty vector) or pCI::JUNO::H2B-RFP encoding for human JUNO (HsJUNO), mouse JUNO (MmJUNO) or hamster JUNO (MaJUNO), and co-incubated with capacitated mouse sperm. (A) Representative images showing H2B-RFP (magenta), GFP-MBD (green), DAPI (blue) channels, and the merge. Dotted lines contour a cell transfected with human or hamster JUNO with mouse sperm fused (arrowheads). Scale bar, 20 µm. The number of sperm fused per 500 fluorescent cells (B) and the percentage of multinucleation (C) were determined. Bar charts showing individual experiment values and means ± SEM of five independent experiments. Comparisons by one-way ANOVA followed by Tukey’s test. *p<0.05, **p<0.01, ***p<0.001.
Figure 5 with 1 supplement
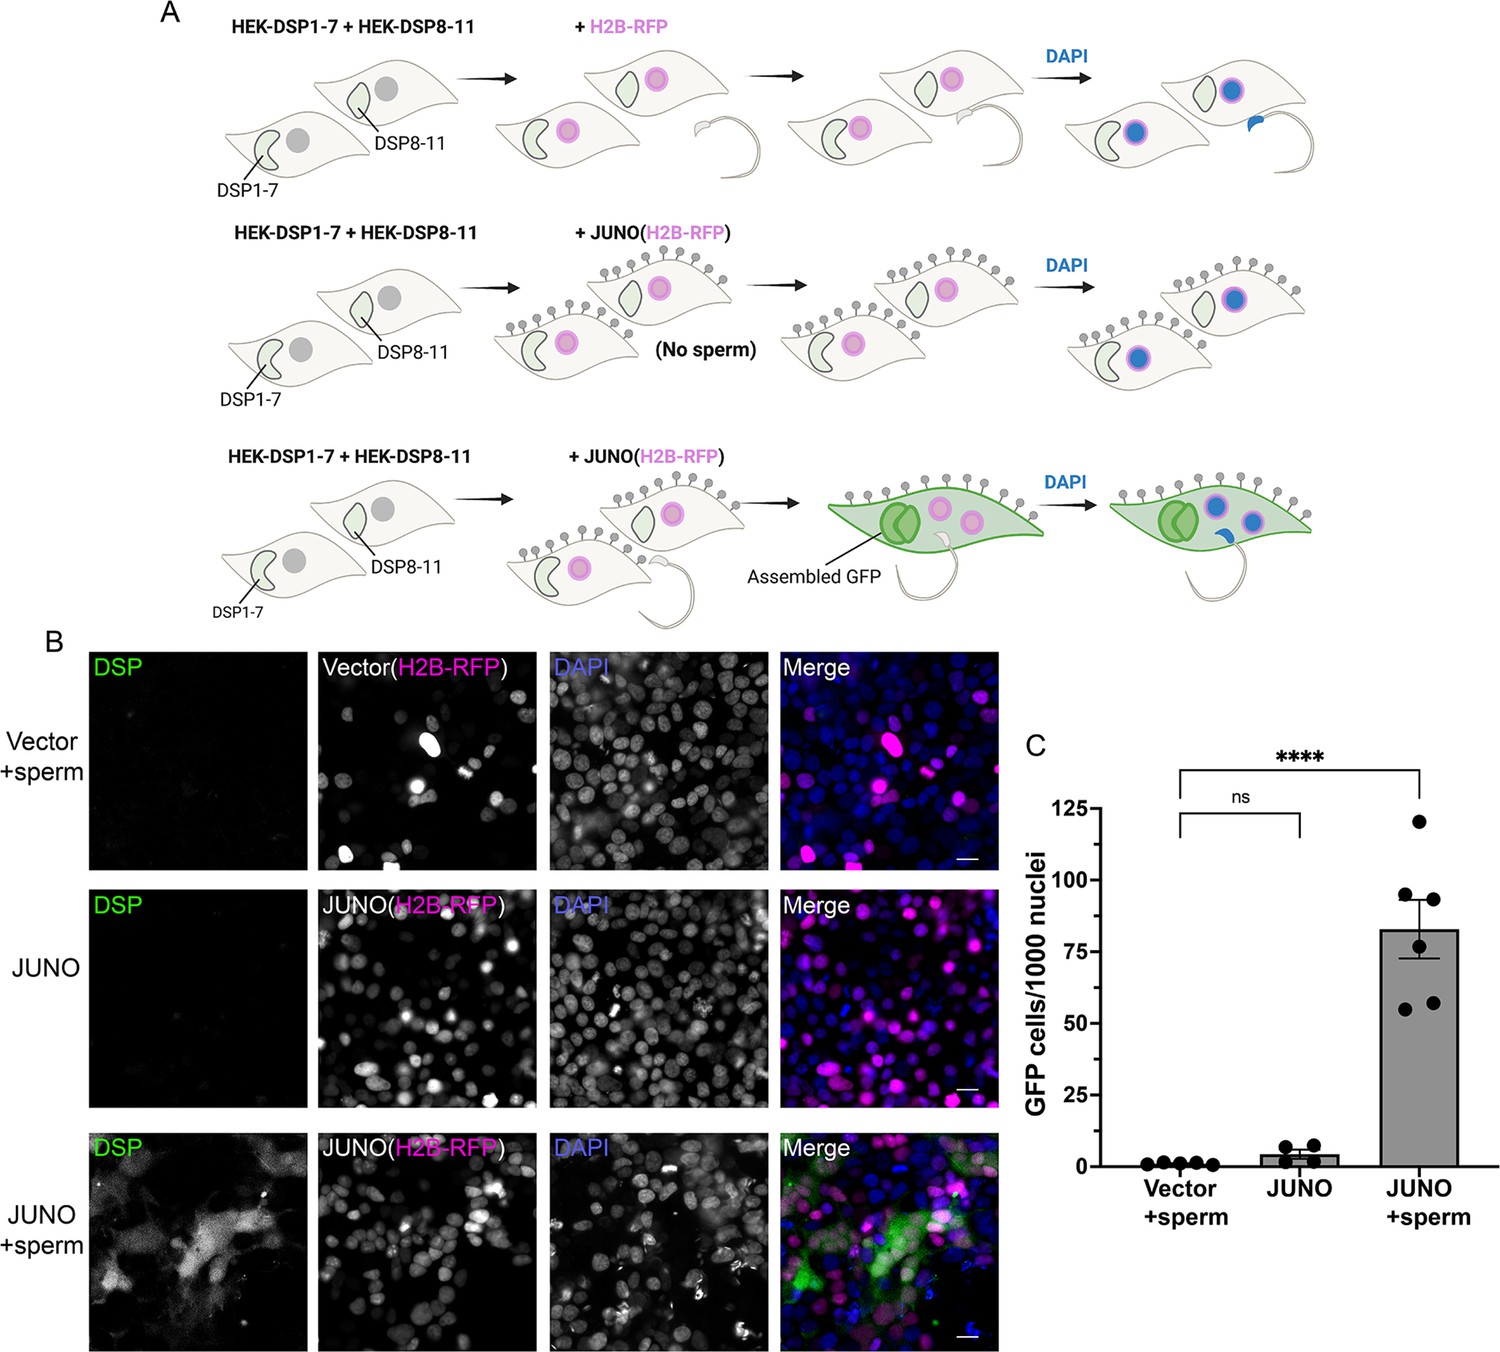
Sperm-induced fusion of human cells evaluated by dual split proteins (DSP).
(A) Scheme of experimental design. HEK293T cells stably expressing the split GFP (DSP1-7 or DSP8-11) were mixed and transfected with pCI::H2B-RFP or pCI::JUNO::H2B-RFP vectors. When indicated, the cells were later co-incubated with sperm for 4 hr, fixed, and stained with DAPI. (B) Representative images for each treatment. Each separate channel for GFP (assembled GFP in fused cells), H2B-RFP (magenta nuclei), and DAPI staining (blue) are shown. Scale bars, 20 µm. (C) Quantification of content mixing experiments. The extent of fusion was determined by counting the number of GFP-positive cells per 1000 nuclei. Bar chart showing individual experiment values (each corresponding to 1000–2000 nuclei) and means ± SEM of at least four independent experiments. Comparisons by one-way ANOVA followed by Tukey’s test. ns = non-significant, ****p<0.0001.
© 2024, Brukman et al. Figure 5 was created using BioRender, and is published under a CC BY-NC-ND 4.0 license. Further reproductions must adhere to the terms of this license.
Figure 5—figure supplement 1
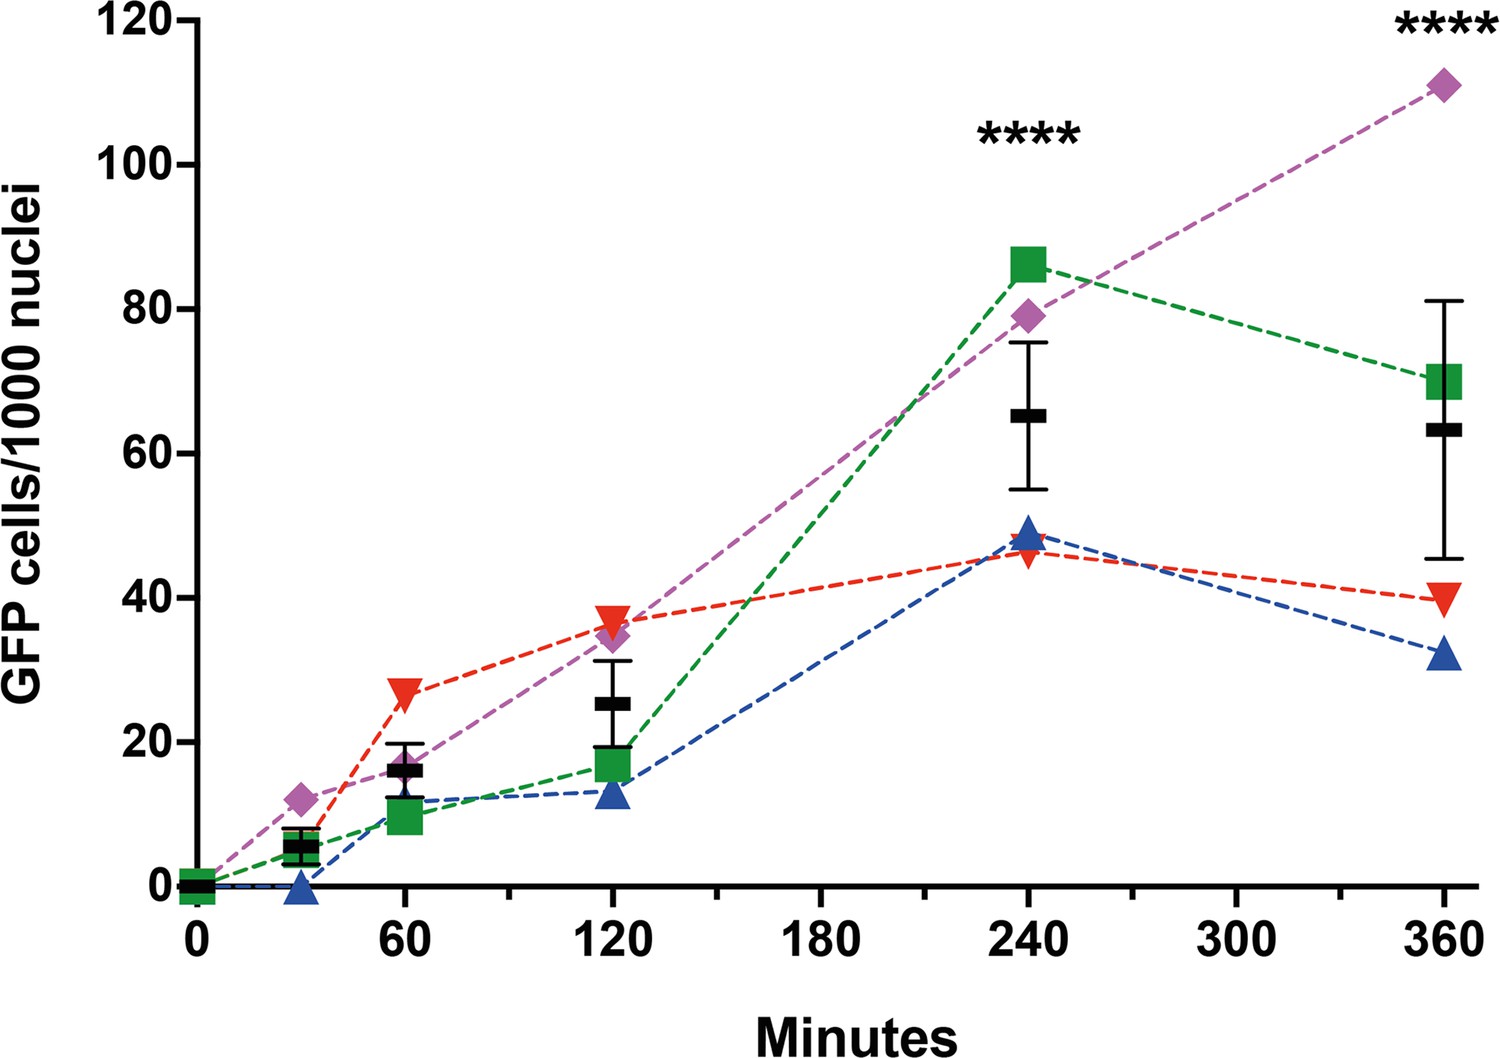
Time course of sperm-induced fusion of human cells evaluated by dual split proteins (DSP).
HEK293T cells stably expressing the split GFP (DSP1-7 or DSP8-11) were mixed and transfected with pCI::JUNO::H2B-RFP vectors. The cells were later co-incubated with capacitated sperm for 0, 30, 60, 120, 240, and 360 min, fixed, and stained with DAPI. The extent of fusion was determined by counting the number of GFP-positive cells per 1000 nuclei. Results from four different mice are plotted in different colors and symbols. The means ± SEM of the four independent experiments are shown in black. Comparisons by one-way ANOVA followed by Dunnett’s test against 0 min. ****p<0.0001.
Figure 6
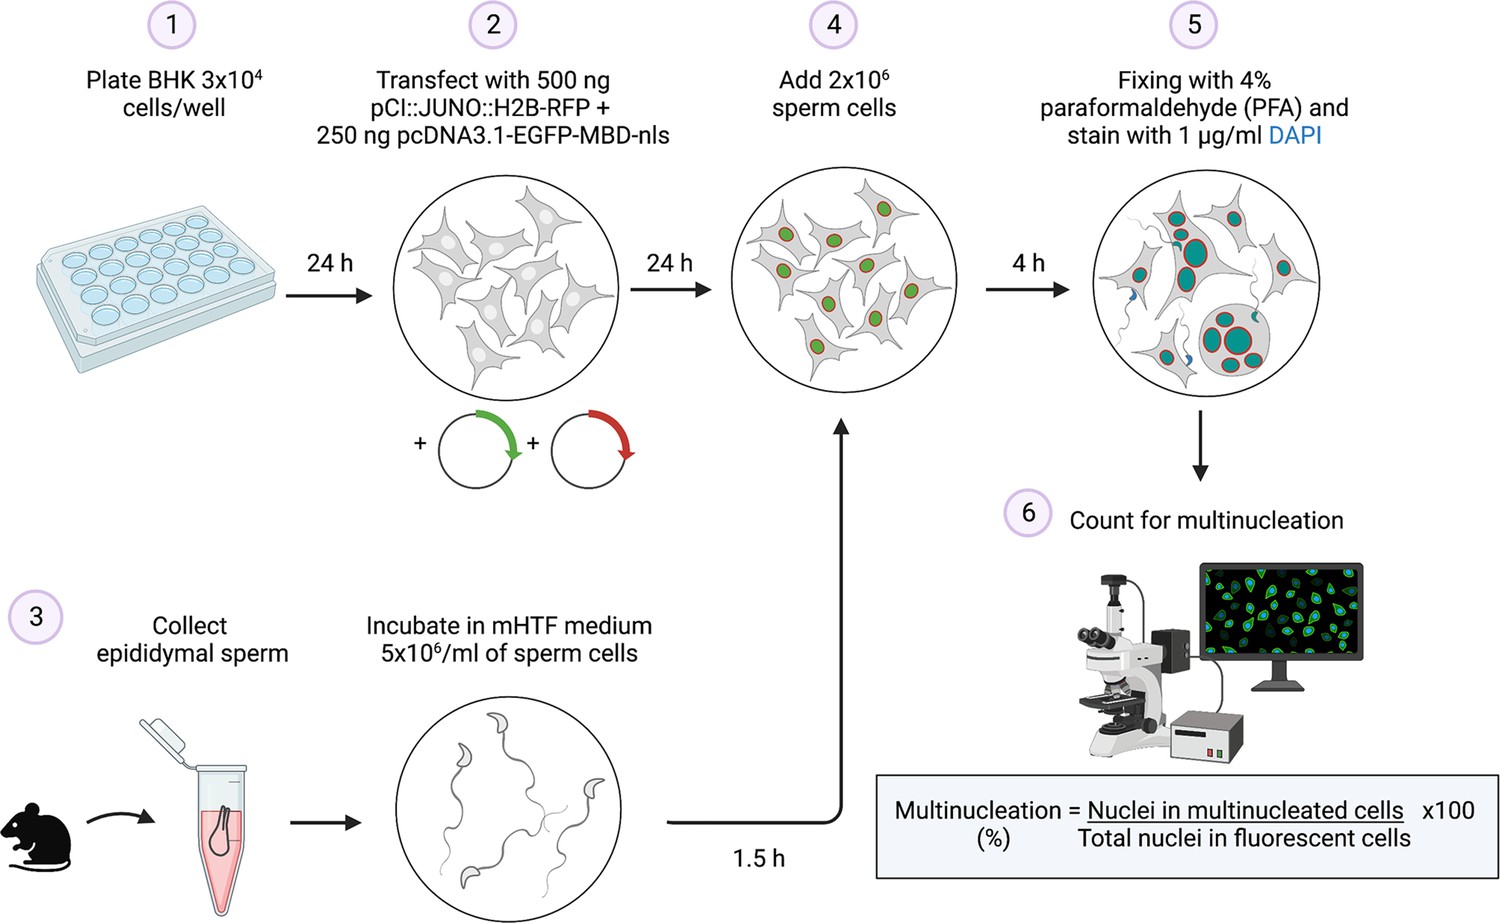
Summary of the sperm-induced cell-cell fusion requiring JUNO (SPICER) method.
Schematic representation of the multinucleation assay employed to determine the sperm fusogenic potential. (1) Baby hamster kidney (BHK) cells are seeded on a plate. (2) The cells are transfected with the plasmids encoding for JUNO and EGFP-MBD. (3) Mouse sperm cells are collected and capacitated. (4) The BHK and sperm cells are co-incubated. (5) The cells are washed, fixed, and stained with DAPI. (6) Multinucleation levels are quantified as indicated.
© 2024, Brukman et al. Figure 6 was created using BioRender, and is published under a CC BY-NC-ND 4.0 license. Further reproductions must adhere to the terms of this license.
Videos
Video 1
Time-lapse experiment using spinning disk confocal microscopy showing the fusion of two cells expressing JUNO and GFPnes after the addition of sperm at t=0 min.
Time in hours:minutes. Green and DIC channels are shown. Scale bars, 20 µm.
Tables
Key resources table
| Reagent type (species) or resource | Designation | Source or reference | Identifiers | Additional information |
|---|---|---|---|---|
| Antibody | Anti-IZUMO1 Mab120 monoclonal antibody | Merck Millipore | Cat# MABT1357 | 1:500 in PBS |
| Antibody | Anti-goat IgG secondary antibody, Alexa Fluor 647 | Thermo Fisher Scientific | Cat# A-21247, RRID: AB_141778 | 1:500 in PBS |
| Strain, strain background (Escherichia coli) | DH5α competent cells | Thermo Fisher Scientific | Cat# 18265017 | |
| Chemical compound, drug | jetPRIME transfection reagent | Polyplus Transfection | Cat# 101000046 | |
| Chemical compound, drug | FdUdr, 5-Fluoro-2’-deoxyuridine | Sigma | Cat# F0503, CAS: 50-91-9 | |
| Chemical compound, drug | BSA, bovine serum albumin | Sigma | Cat# A7906, CAS: 9048-46-8 | |
| Chemical compound, drug | Hyaluronidase | Sigma | Cat# H3506, CAS: 37326-33-3 | |
| Chemical compound, drug | Cycloheximide | Sigma | Cat# C7698, CAS: 66-81-9 | |
| Chemical compound, drug | Puromycin Dihydrochloride | GoldBio | Cat# P-600–100, CAS: 58-58-2 | |
| Chemical compound, drug | Poly-L-lysine hydrobromide | Sigma | Cat# P2636, CAS: 25988-63-0 | |
| Cell line (Mesocricetus auratus) | BHK-21, clone 13 | ATCC | Cat# CCL-10, RRID: CVCL_1915 | |
| Cell line (Homo sapiens) | HEK293T | ATCC | Cat# CRL-3216, RRID: CVCL_0063 | |
| Cell line (Homo sapiens) | HEK293T-DSP1-7 | This paper | See Materials and methods | |
| Cell line (Homo sapiens) | HEK293T-DSP8-11 | This paper | See Materials and methods | |
| Strain, strain background (Mus musculus) | B6D2-Tg(Izumo1-mCherry) mouse line | Satouh et al., 2012 | ||
| Strain, strain background (Mus musculus) | FVB/129sv/CF1 | This paper | See Materials and methods | |
| Sequence-based reagent | IZUMO1-mCherry F | Satouh et al., 2012 | PCR primers | For genotyping: CCTTCCTGCGGCTTGTTCTCT |
| Sequence-based reagent | IZUMO1-mCherry R | Satouh et al., 2012 | PCR primers | For genotyping:ATCAAGGTCTCAGAACTGTTCTCCCAAACC |
| Sequence-based reagent | NheI Human Juno F | This paper | PCR primers | For cloning into pCI::H2B-RFP: TTATCGCTAGCATGGCATGCTGGTGGCCGCTC |
| Sequence-based reagent | EcoRV Human Juno R | This paper | PCR primers | For cloning into pCI::H2B-RFP: CCAGGATATCTCAGGAAAGGAACGGCAGGAAC |
| Sequence-based reagent | NheI Hamster Juno F | This paper | PCR primers | For cloning into pCI::H2B-RFP: TTATCGCTAGCATGGCTCAGTGGTGGCAGATTCTG |
| Sequence-based reagent | SmaI Hamster Juno R | This paper | PCR primers | For cloning into pCI::H2B-RFP: GTCCCCCGGGTCAGGAGTGGAGCAGCAGGCACAGAGAGAAGGATGTGAGGGCGTAAGAAATCTCCCGTGGAGCAGATGCGCTATTGGCG |
| Recombinant DNA reagent | pCI::H2B-RFP | Williams et al., 2018 | RRID: Addgene #92398 | |
| Recombinant DNA reagent | pCI::GFPnes | Moi et al., 2022 | ||
| Recombinant DNA reagent | pCI::mJUNO::H2B-RFP | Brukman et al., 2023 | ||
| Recombinant DNA reagent | pCI::mJUNO::GFPnes | Brukman et al., 2023 | ||
| Recombinant DNA reagent | pcDNA3.1-EGFP-MBD-nls | Yamagata et al., 2005 | ||
| Recombinant DNA reagent | pCMV6-humanJUNO | Wood and Wright, 2019 | ||
| Recombinant DNA reagent | pCI::humanJUNO::H2B-RFP | This paper | Cloned with NheI and EcoRV | |
| Recombinant DNA reagent | p2988::hamsterJUNO ectodomain | Bianchi and Wright, 2015 | ||
| Recombinant DNA reagent | pCI::hamsterJUNO::H2B-RFP | This paper | Cloned with NheI and SmaI | |
| Recombinant DNA reagent | pIRESpuro3-DSP1–7 | Wang et al., 2014 | ||
| Recombinant DNA reagent | pIRESpuro3-DSP8-11 | Wang et al., 2014 | ||
| Recombinant DNA reagent | pCI::VSV-G::H2B-RFP | Moi et al., 2022 | ||
| Software, algorithm | GraphPad Prism 9 | GraphPad Prism | RRID:SCR_002798 | |
| Software, algorithm | FIJI (ImageJ 1.53 c) | Image J | RRID:SCR_002285 | |
| Software, algorithm | Photoshop CS6 | Adobe | RRID:SCR_014199 | |
| Software, algorithm | Illustrator CS6 | Adobe | RRID:SCR_010279 | |
| Software, algorithm | ZEN microscopy software 7.0.4.0 | ZEISS | RRID:SCR_013672 | |
| Software, algorithm | MetaMorph image analysis software 7.8.1.0 | Molecular Devices | RRID:SCR_002368 | |
| Software, algorithm | Biorender | Biorender | RRID:SCR_018361 |
Additional files
-
MDAR checklist
- https://cdn.elifesciences.org/articles/94228/elife-94228-mdarchecklist1-v2.docx
-
Source data 1
Table containing the raw data from correlation assays (see Figure 3).
- https://cdn.elifesciences.org/articles/94228/elife-94228-data1-v2.docx
-
Source data 2
Numerical data for all the graphs in:Figures 1—5, Figure 1—figure supplement 1, Figure 2—figure supplement 1, Figure 3—figure supplement 1, Figure 5—figure supplement 1.
- https://cdn.elifesciences.org/articles/94228/elife-94228-data2-v2.xlsx
-
Source data 3
Raw microscopy images in CZI and TIF formats.
- https://cdn.elifesciences.org/articles/94228/elife-94228-data3-v2.zip
Download links
A two-part list of links to download the article, or parts of the article, in various formats.
Downloads (link to download the article as PDF)
Open citations (links to open the citations from this article in various online reference manager services)
Cite this article (links to download the citations from this article in formats compatible with various reference manager tools)
Sperm induction of somatic cell-cell fusion as a novel functional test
eLife 13:e94228.
https://doi.org/10.7554/eLife.94228


