Tgfbr1 regulates lateral plate mesoderm and endoderm reorganization during the trunk to tail transition
- Instituto Gulbenkian de Ciência, Rua da Quinta Grande, Portugal
- Gulbenkian Institute for Molecular Medicine, Avenida Prof. Egas Moniz, Portugal
- Developmental Biology Program, Sloan Kettering Institute, Memorial Sloan Kettering Cancer Center, United States
Figures
Figure 1 with 1 supplement
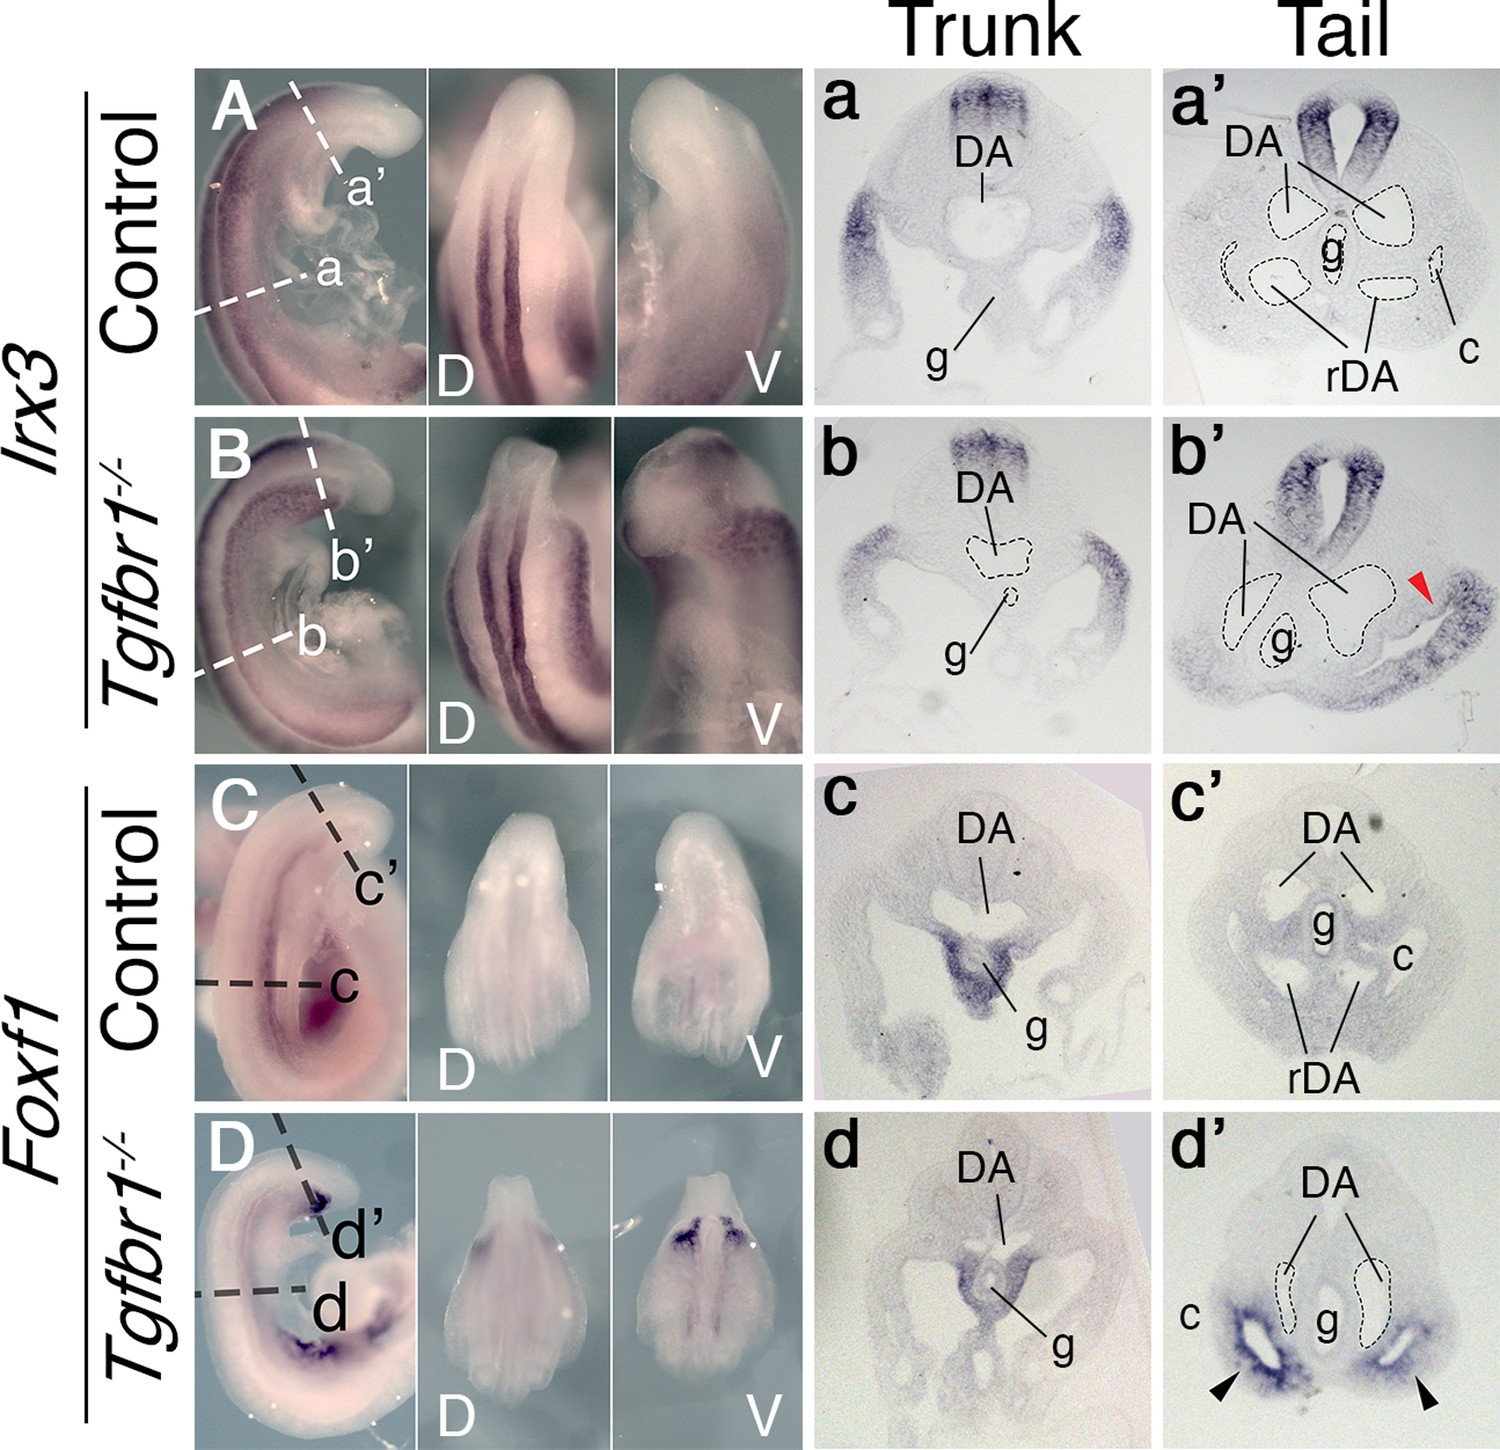
In situ hybridization showing expression patterns of the main mesodermal markers.
(A–d’) Expression of somatic lateral plate mesoderm (LPM) marker Irx3 (A, B) and splanchnic LPM marker Foxf1 (C, D) in control (A, C) and Tgfbr1−/− (B, D) E9.5 embryos. Next to the images of the whole-mount embryos shown transversal sections through trunk (a–d) and tail (a’–d’) regions. Red arrowhead indicates ectopic expression of Irx3 in splanchnic LPM, black arrowhead – ectopic expression of Foxf1 in somatic LPM. c – coelomic cavity, cl – cloaca, DA – dorsal aorta, g – gut, rDA – recurved dorsal aorta, V – ventral, D – dorsal.
Figure 1—figure supplement 1
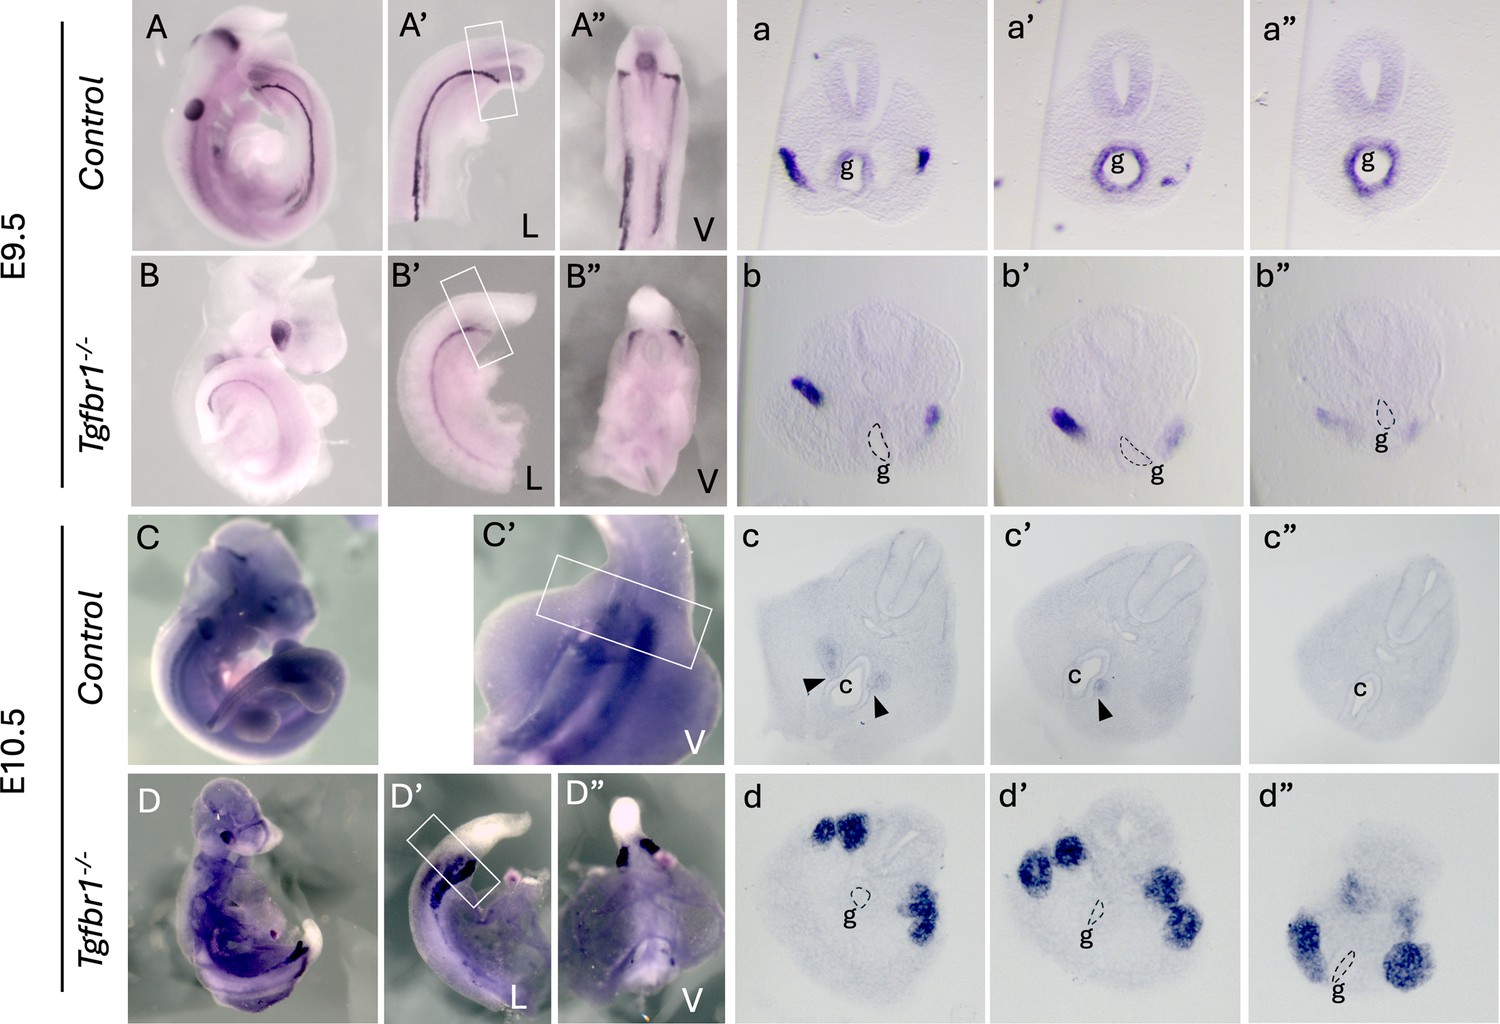
Expression of the intermediate mesoderm (IM) marker Pax2 in Tgdfr1−/− embryos.
(A–b”) Pax2 expression in E9.5 control (A–a”) and Tgfbr1−/− (B–b”) embryos. (a–a”) and (b–b”) show sections through the region marked by the rectangle in A’ and B’. (C–d”) Pax2 expression in E10.5 control (C–c”) and Tgfbr1−/− (D–d”) embryos. (c–c”) and (d–d”) show sections through the region marked by the rectangle in C’ and D’. At E10.5, the pronephric ducts merge with the cloaca in control embryos black arrowheads in (c, c’), but not in the mutants (d, d”). c – cloaca, g – gut, L – lateral, V – ventral.
Figure 2 with 1 supplement

Main vascular tree of the Tgfr1−/− embryos.
Whole-mount immunostaining for Pecam1 (red) labeling endothelial cells in E9.5 control (A, a) and mutant (C, c) embryos. Nuclei shown in cyan. Transversal sections through regions marked by the dashed lines in A and C are shown in (a1–5) and (c1–5). (B, b, D, d) 3D reconstruction of the main vascular tree (red) and the gut (cyan) of the immunostaining shown in (A, a, C, c). Connection between the umbilical artery (ua) and recurved dorsal aortae (rDA) is marked by the arrowhead. Turn of dorsal aortae (DA) where it is connected to rDA is labeled by the arrow. In the mutant this region is enlarged while rDA is short (compare A, a3, and B to C, c2–5, and D). D – dorsal, L – lateral, V – ventral, c – coelomic cavity, g – gut.
Figure 2—figure supplement 1
Pericloacal mesenchyme derives from the mesoderm adjacent to the allantois.
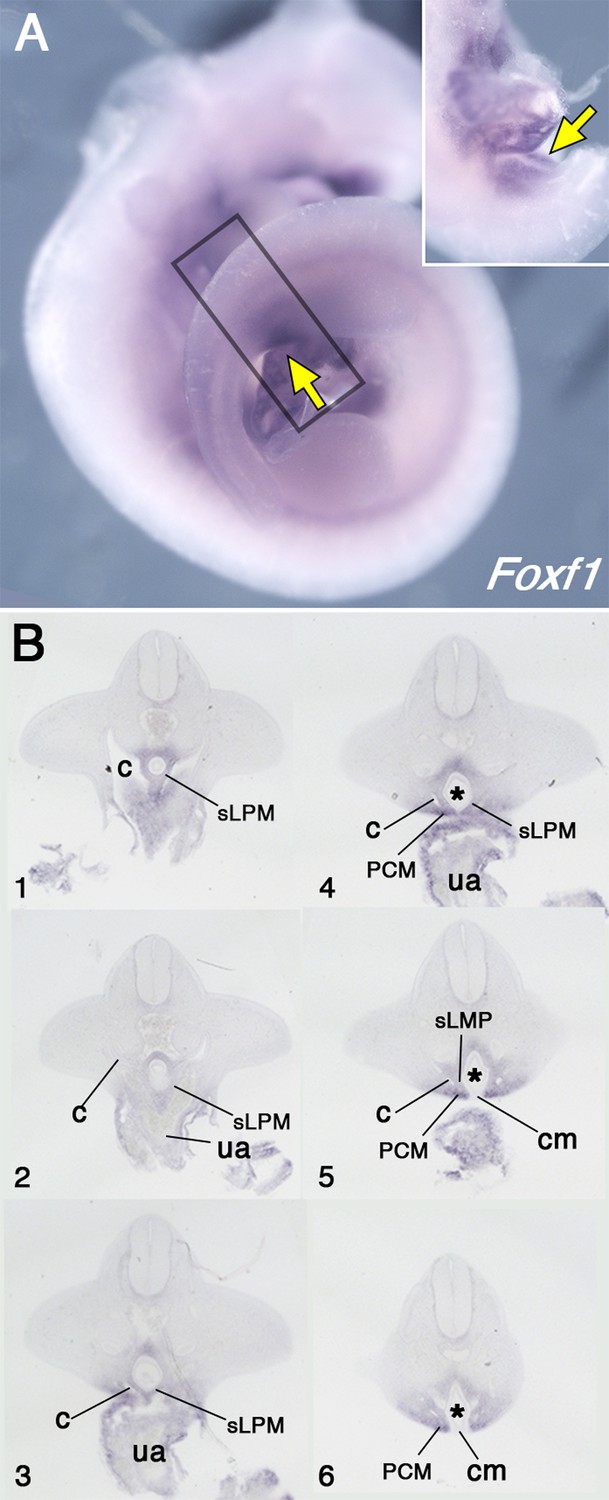
(A) Whole-mount in situ hybridization showing Foxf1 expression in E10.5 wild-type embryos. Yellow arrows show expression in the pericloacal mesenchyme. Inset shows a ventral view in the pericloacal mesenchyme. (B) Series of transversal sections through the region marked by the rectangle in A (1–6, from anterior to posterior). The splanchnic lateral plate mesoderm (sLPM) is separated from the pericloacal mesenchyme (PCM) by the coelomic cavity (c). Cloaca is labeled by asterisk, ua – umbilical artery, cm – cloaca membrane.
Figure 3 with 2 supplements
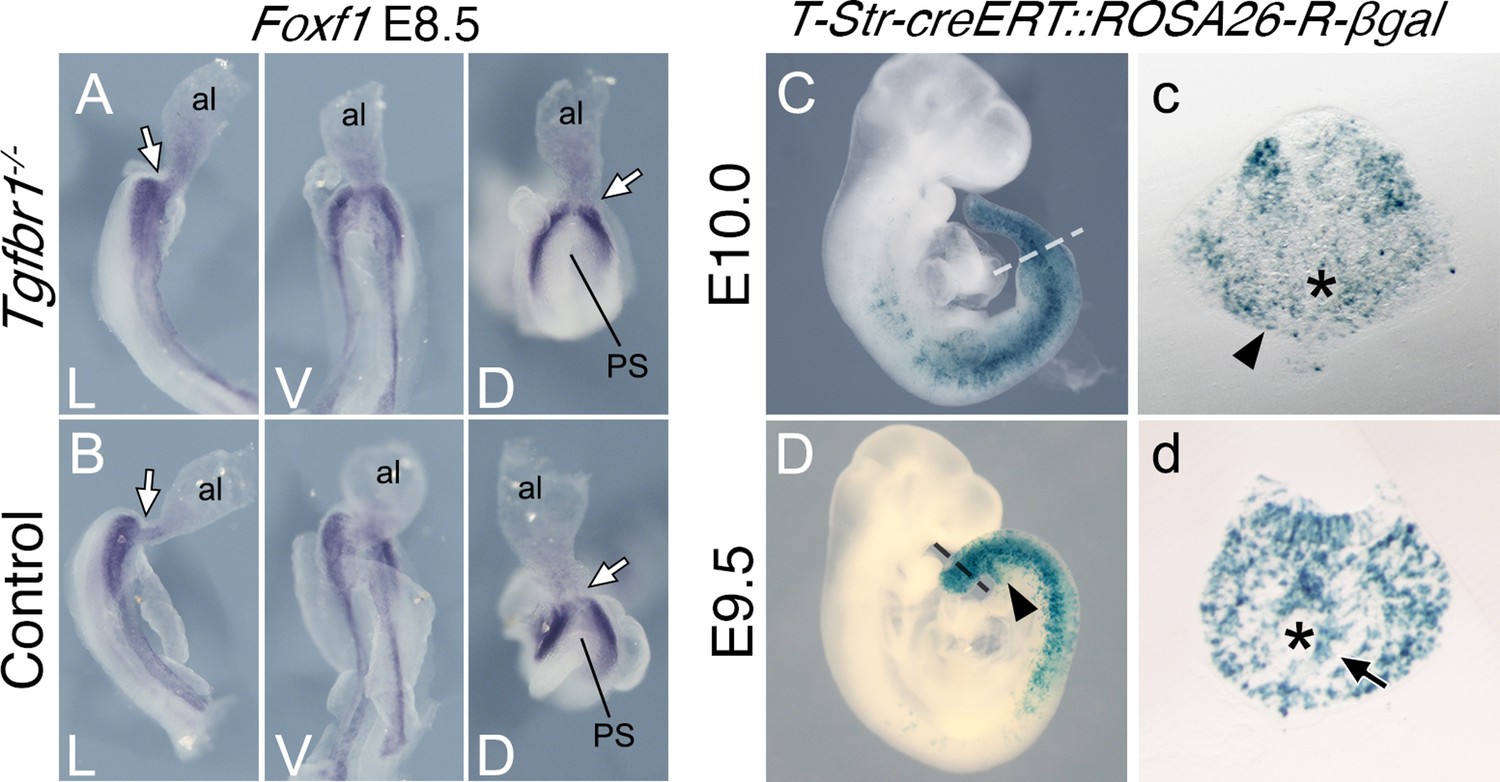
Posterior primitive streak contributes to the pericloacal mesenchyme and gut endoderm.
Whole-mount in situ hybridization showing expression of Foxf1 in E8.5 Tgfbr1−/− (A) and control (B) embryos. al – allantois, g – gut, PS – primitive streak, L – lateral view, V – ventral view, D – dorsal view. While arrow indicates PS/allantois junction. β-Galactosidase cell tracing showing descendance of the primitive streak in the E10.0 (C, c) and E9.5 (D, d) embryos. c and d show transversal sections through regions marked by the dashed lines in C and D. Black arrowhead shows β-galactosidase staining in the pericloacal mesenchyme. Black arrow in d shows β-galactosidase+ cells in the tail gut endoderm. The asterisk in c indicates the cloaca. The asterisk in d indicates the tail gut.
Figure 3—figure supplement 1
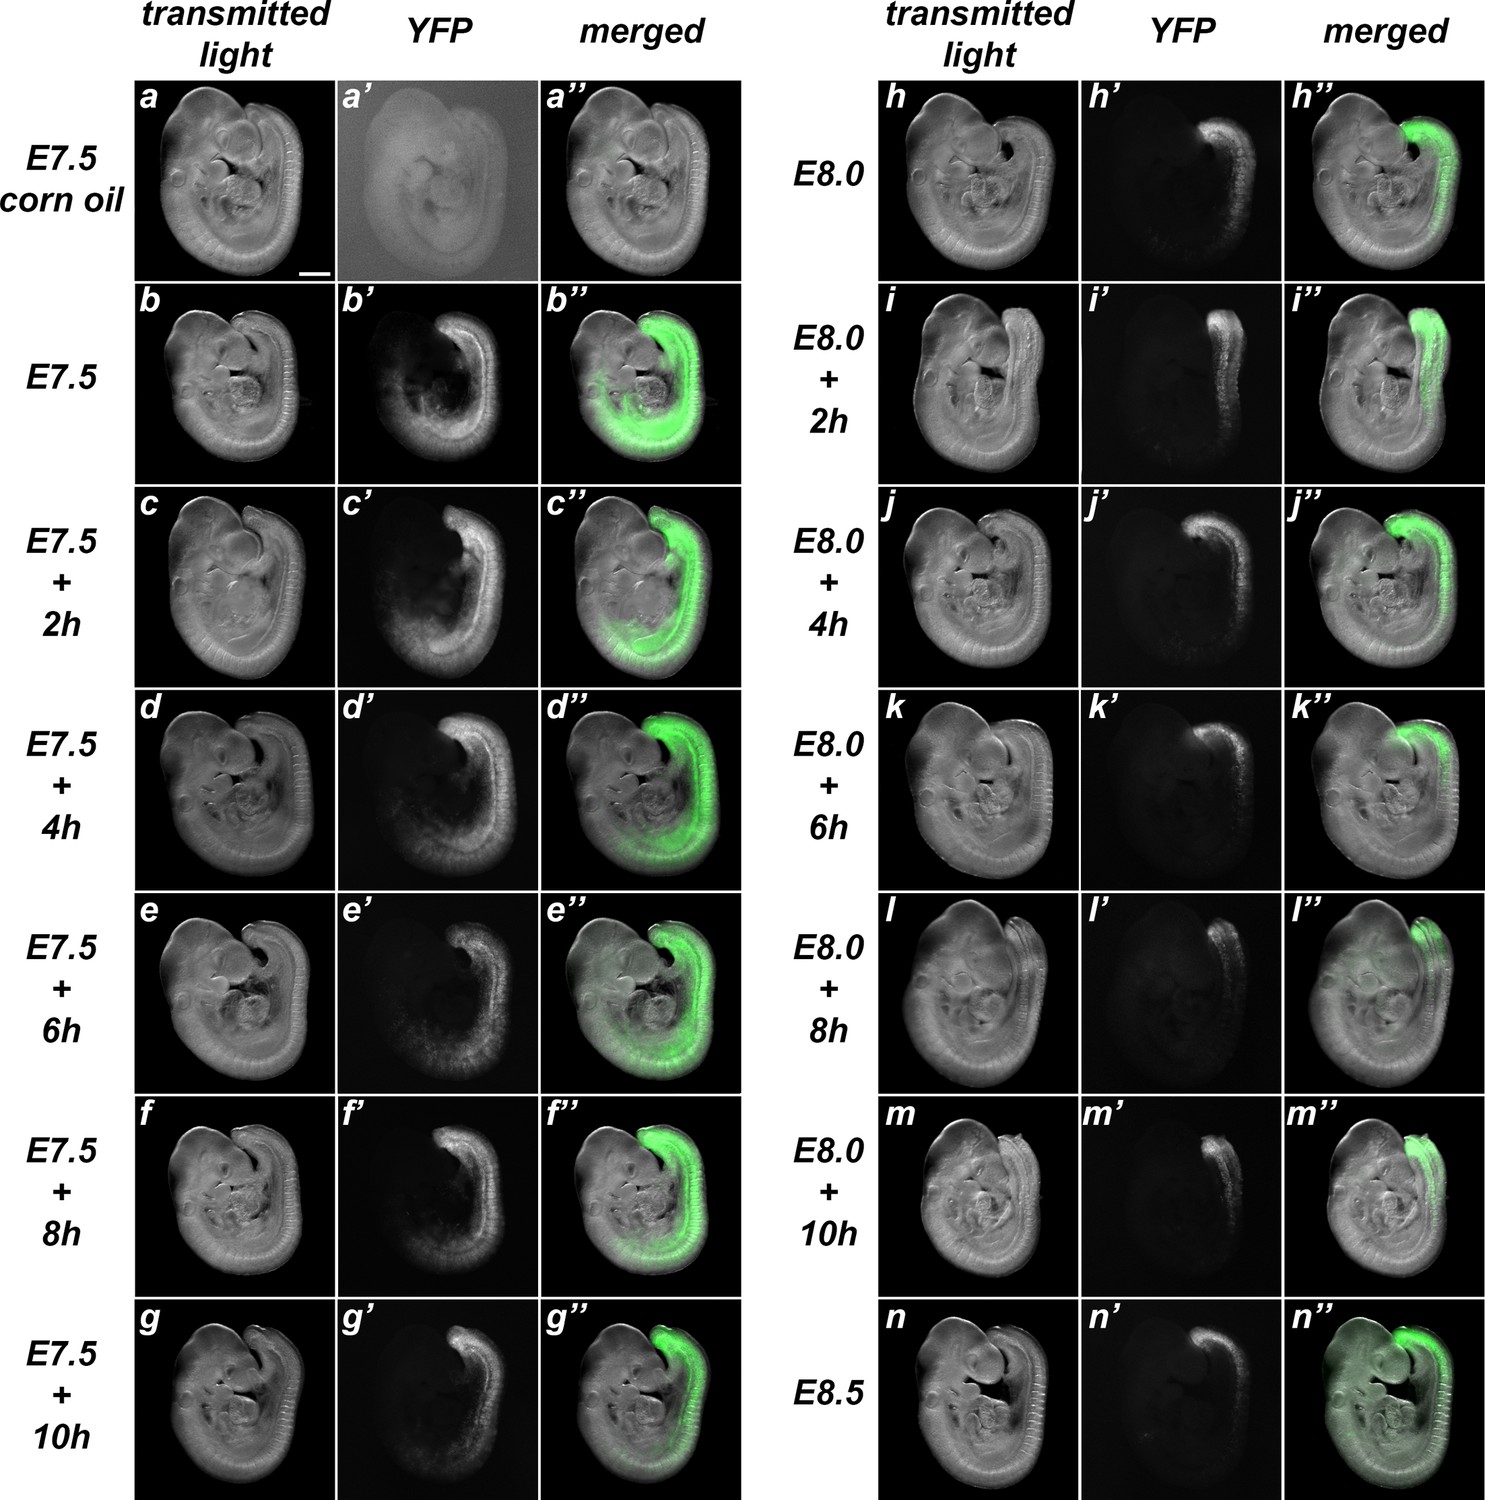
Characterization of the recombination activity of the Tstr-creERT transgenics.
These transgenics were analyzed by crossing them with ROSA26R-YFP mice. While non-treated embryos showed only rare events of spontaneous recombination (a), administration of tamoxifen at early stages induced extensive recombinant territories that became progressively restricted to the caudal region as tamoxifen was being administered at later time-points (b–n). Left rows adjacent to the images show the time of tamoxifen administration. Size bar: 200 μm.
Figure 3—figure supplement 2
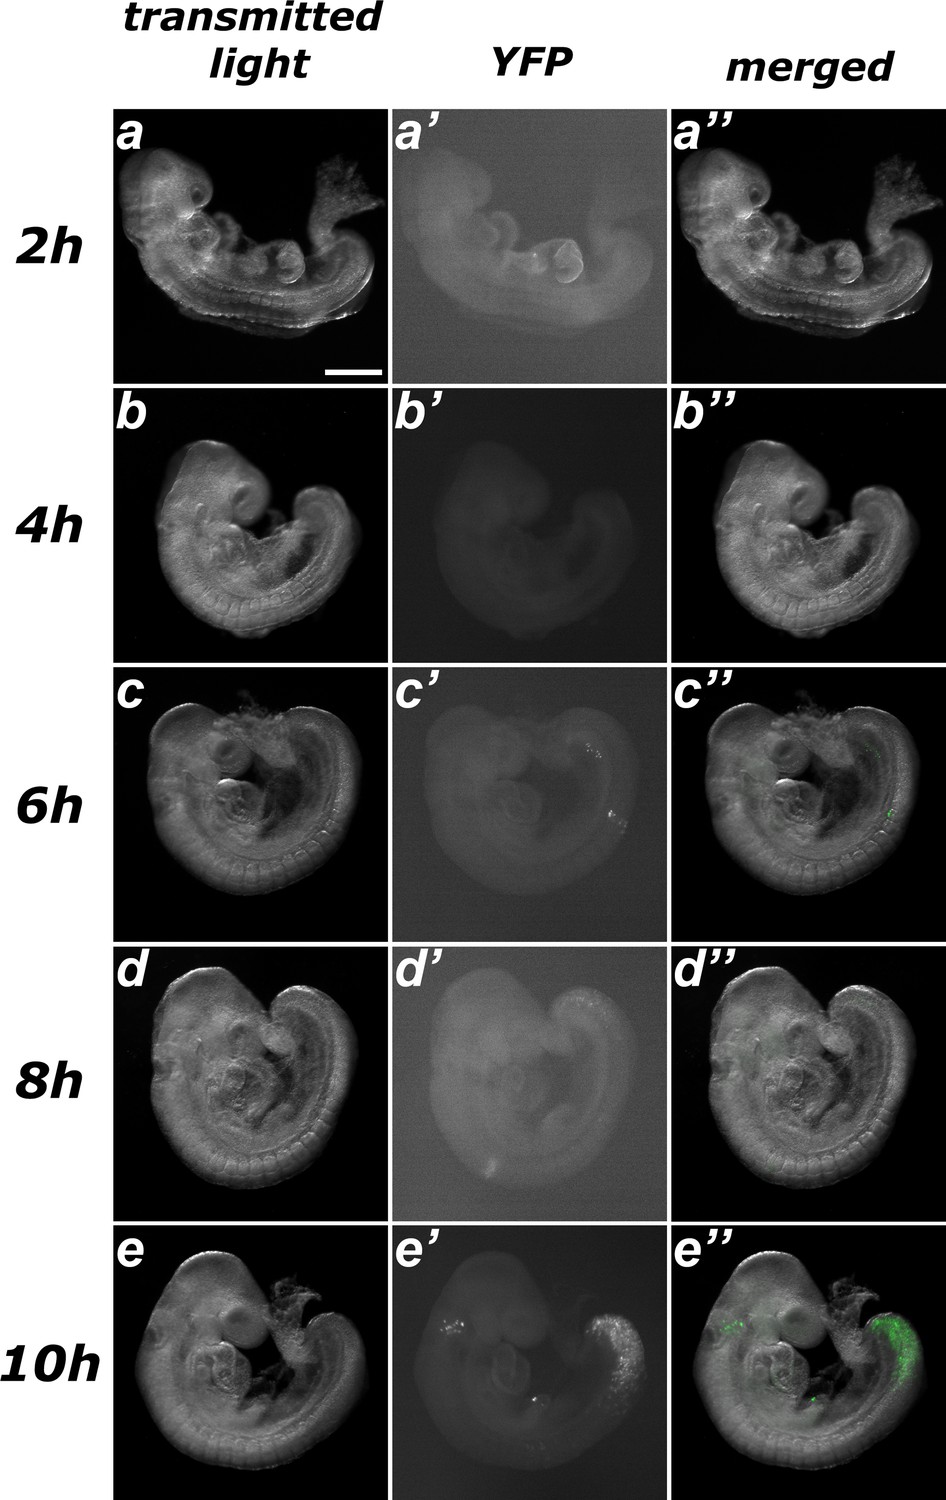
Estimating the time required for recombination after tamoxifen administration in Tstr-creERT::ROSA26R-YFP embryos.
No evident sign of recombination was observed after up to 6 hr of treatment (a–c), only a few scarce spontaneous events. Embryos harvested 8 hr after tamoxifen administration exhibited early signs of recombination (d) and clear induction was observed 10 hr after treatment (e). Size bar: 200 μm.
Figure 4
Effects of Tgfbr1 in the lateral plate mesoderm (LPM), but not in the tail bud, are mediated by Isl1.
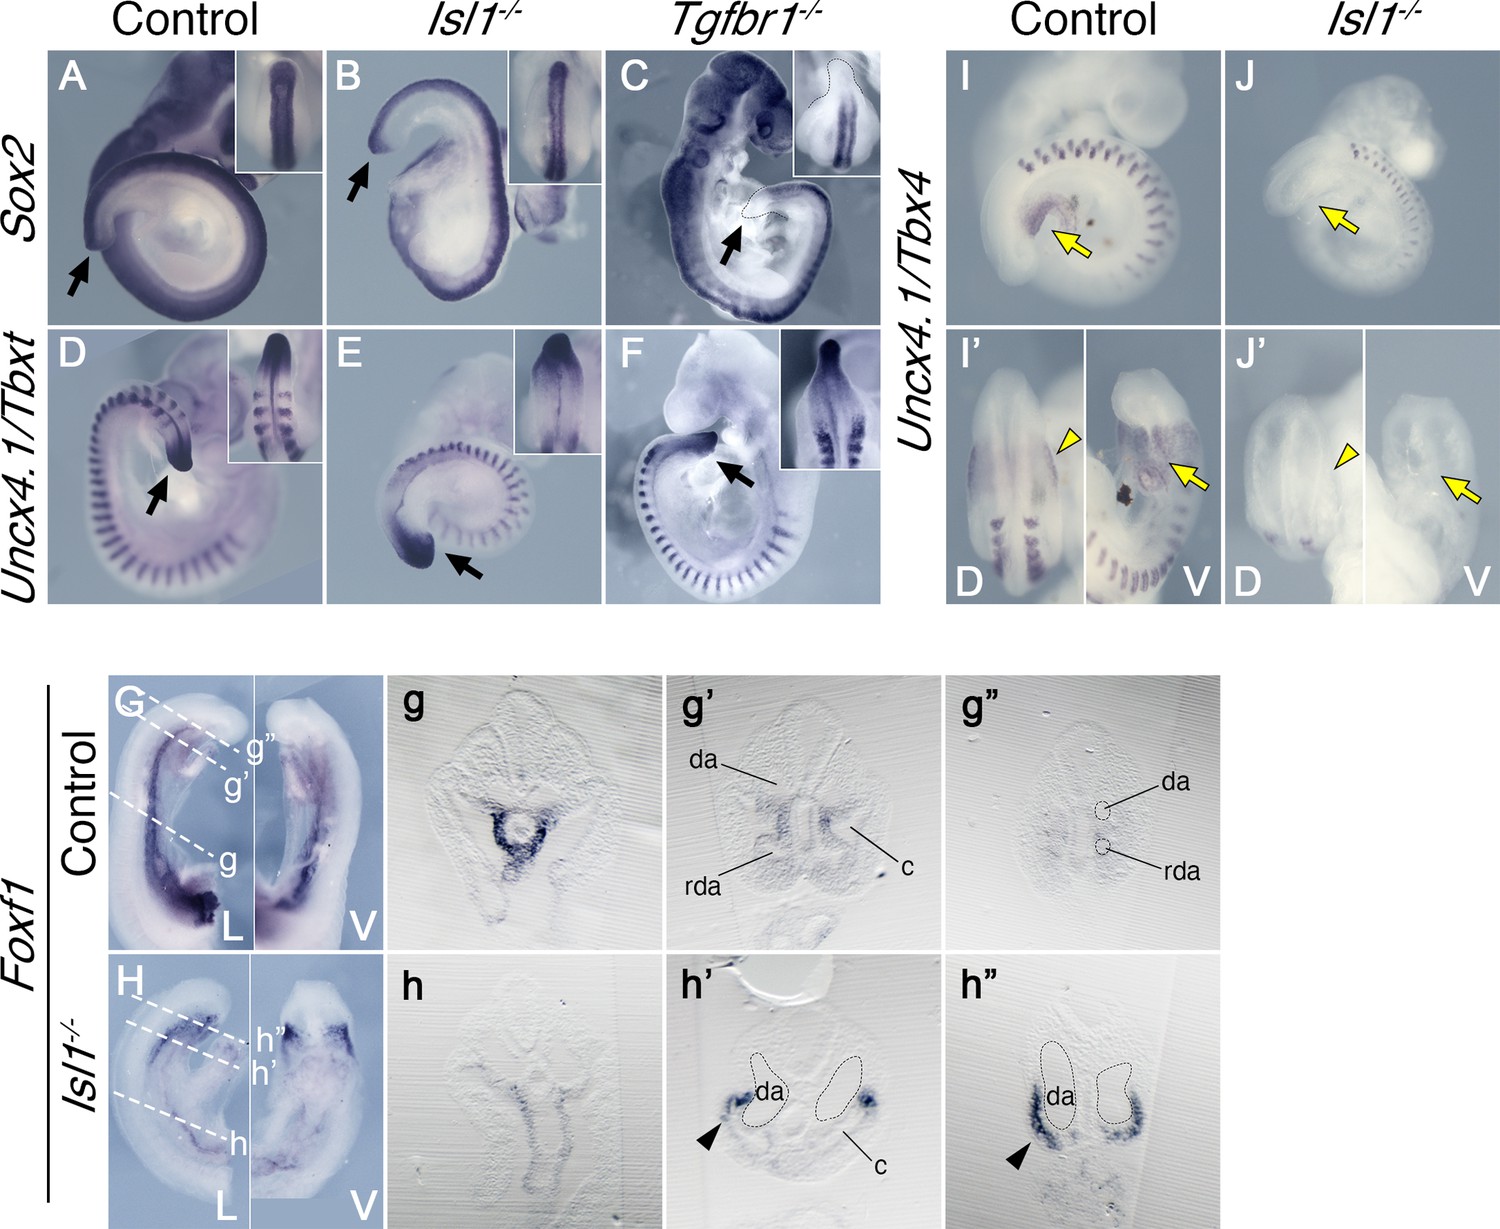
Whole-mount in situ hybridization showing expression of Sox2 (A–C) and Uncx4.1/Tbxt (D–F) in the E9.5 control (A, D), Isl1−/− (B, E), and Tgfbr1−/− (C, F) embryos. Isl1−/− embryos form tail bud (black arrows), unlike Tgfbr1−/− embryos. Insets in the right top corners show dorsal view of the tail bud region. (G, h”) Whole-mount in situ hybridization showing expression of Foxf1 in the E9.5 control (G) and Isl1−/− (H) embryos. g–g” and h–h” show transversal sections through the regions marked by the dashed line in G and H. Foxf1 is ectopically expressed in the splanchnopleure of the posterior region of the Isl1−/− (black arrowhead in h’ and h”). (I–J’) Whole-mount in situ hybridization showing expression of Uncx4.1/Tbx4 in E9,5 control (I, I’) and Isl1−/− (J, J’) embryos. Tbx4 is not expressed in pericloacal mesenchyme (yellow arow) and hindlimb buds (yellow arrowheads) of Isl1−/− mutants. da – dorsal aorta, rda – recurved dorsal aorta, c – coelomic cavity, D – dorsal, V – ventral.
Figure 5
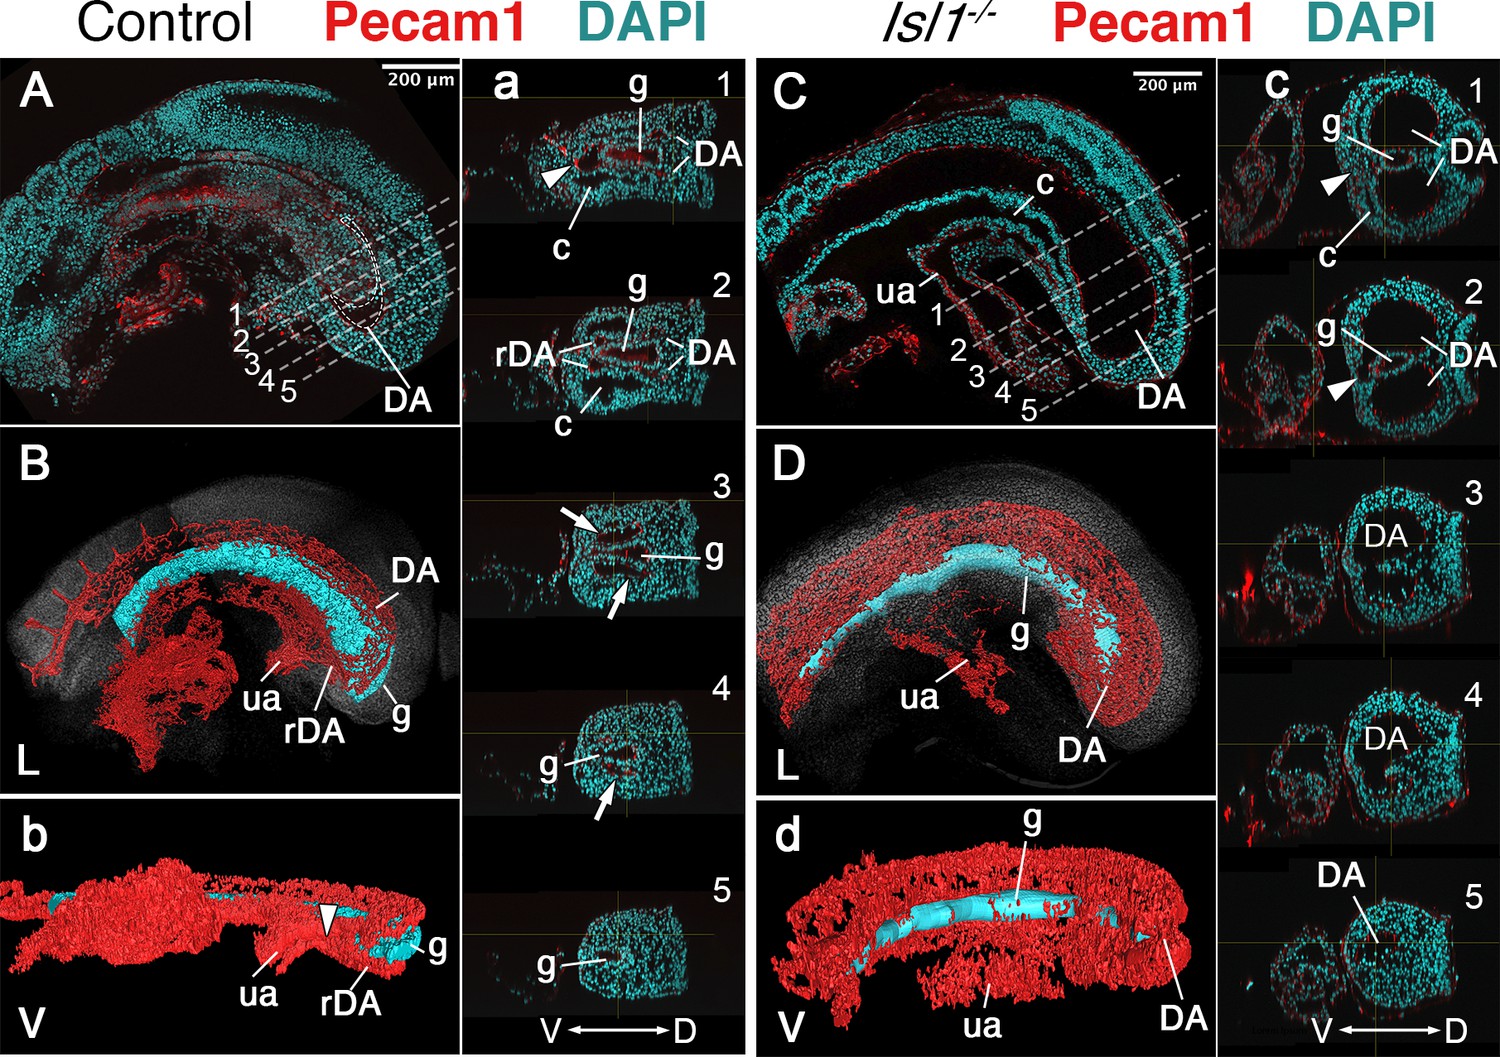
Main vascular tree of the Isl1−/− embryos.
Whole-mount immunostaining for Pecam1 (red) labeling endothelial cells in E9.5 control (A) and mutant (C) embryos. (a, c) Optical transversal sections through regions marked by the dashed lines in A and C. (B, b, D, d) 3D reconstruction of the main vascular tree (red) and the gut (cyan) of the immunostaining shown in (A, a, C, c). In the mutant recurved dorsal aorta (rDA) is underdeveloped and connection between dorsal aortae (DA) and the umbilical artery (ua) is established by a small vessel (white arrowhead in c1 and c2). Branches of DA are enlarged in the Isl1−/− and merge together at the posterior end and ventral to the gut c3–5, (d). D – dorsal, L – lateral, V – ventral, c – coelomic cavity, g – gut.
Figure 6 with 1 supplement
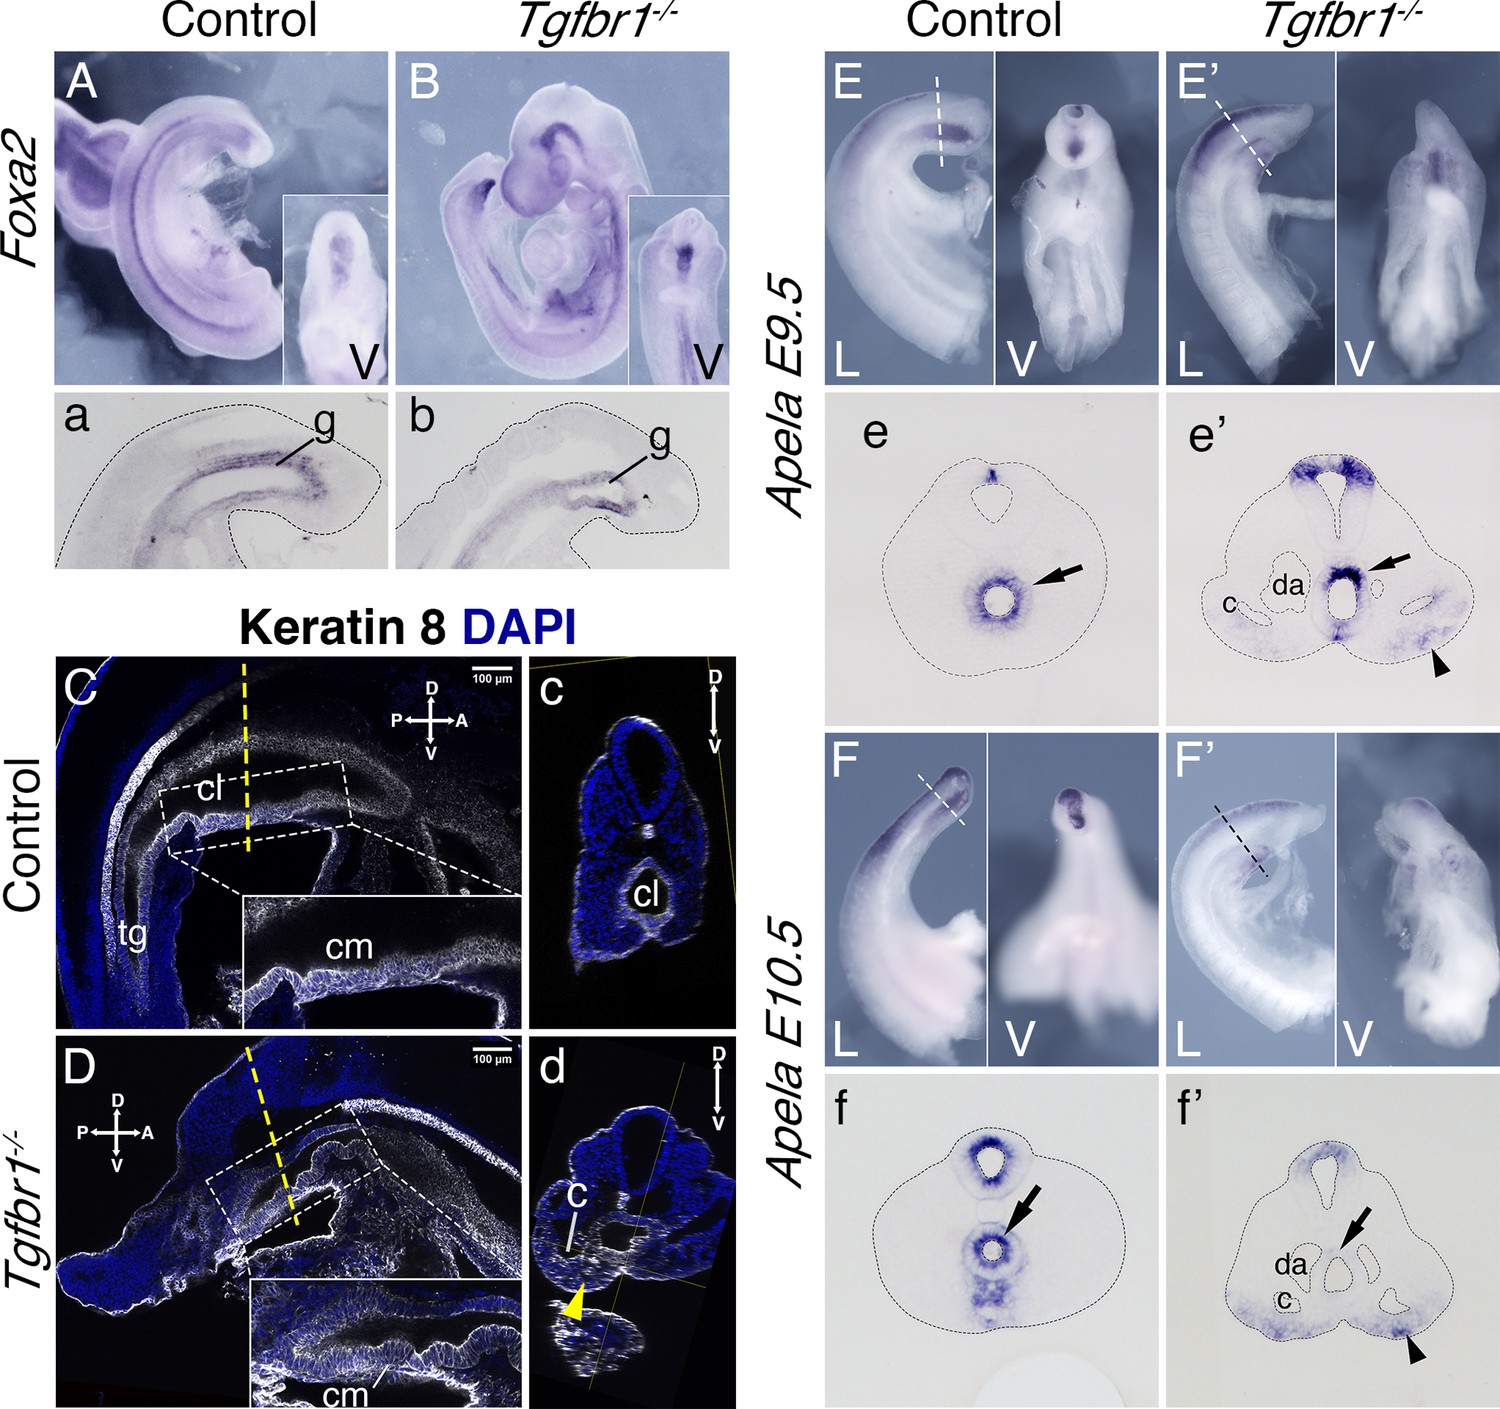
Endoderm of the Tgfbr1 KO.
Expression of Foxa2 in E9.5 control (A, a) and Tgfbr1 KO (B, b) embryos. a and b show sagittal sections though the tail region. Keratin 8 staining of the cloaca region in the control (C, c) and Tgfbr1−/− (D, d) E10.5 embryos. Tgfbr1−/− do not initiate enlargement of the cloacal cavity. Insets show higher magnification of the cloacal membrane (cm). c and d show transversal optical sections marked by the dashed line in C and D. Yellow arrowhead in d shows Keratin 8 staining in expanded lateral plate mesoderm (LPM) of the Tgfbr1 mutant embryo. Apela expression in the posterior region of the E9.5 control (E, e) and mutant (E’, e’) embryos. e and e’ show transversal sections of regions marked by the dashed line in E and E’. Apela expression in the posterior region of the E10.5 control (F, f) and mutant (F’, f’) embryos. f and f’ show transversal sections of regions marked by the dashed line in F and F’. Black arrow – gut endoderm, black arrowhead – Apela-expressing cells in LPM of the mutant embryo. V – ventral, L – lateral, cl – cloaca, c – coelomic cavity, da – dorsal aorta, g – gut, hg – hindgut.
Figure 6—figure supplement 1

Whole-mount in situ hybridization on E9.5 wild-type (A) and Tgfbr1−/− (B) embryos with a probe for Shh.
In wild-type embryos, the endoderm forms the cloaca at the level of the developing hindlimb (arrow) and extends into the emerging tail bud. In the mutant embryo, the endoderm finishes at the posterior embryonic end, merging into the ventral wall of the embryo (arrow).
Figure 7 with 1 supplement
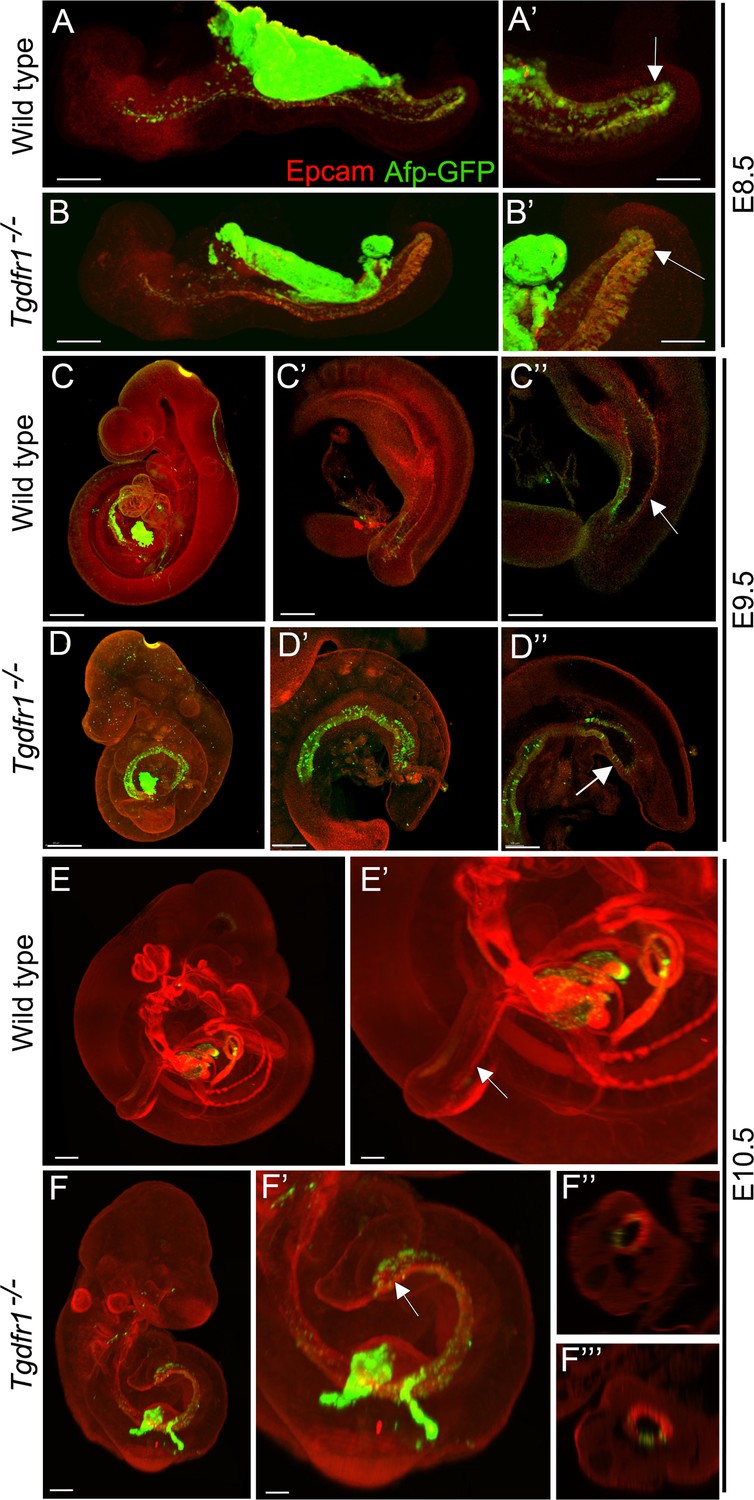
Analysis of the contribution of the visceral endoderm to the embryonic gut.
GFP expression from the Afp-GFP transgenics was analyzed at E8.5 (A–B’), E9.5 (C–D’’), or E10.5 (E–F’’’) in wild-type (A, A’, C–C’’, E, E’) or Tgfbr1−/− (B, B’, D–D’’, F–F’’’) embryos. (C’ and D’) show a 3D image of the embryo, and C’’ and D’’ show transversal sections. (F’ and F’’) show transversal sections through the caudal part of F’. The embryonic endoderm was labeled by immunofluorescence against Epcam. Arrows in A’, B’ indicate the hindgut; arrows in C’’ and E’ indicate the tail gut; arrows in D’’ and F’ indicate the cloacal membrane. Size bars: A, B: 200 μm; A’, B’: 100 μm; C, D: 300 μm; C’, D’: 200 μm; C’’, D’’: 150 μm; E: 300 μm; F: 200 μm; E’: 150 μm; F’: 100 μm.
Figure 7—figure supplement 1
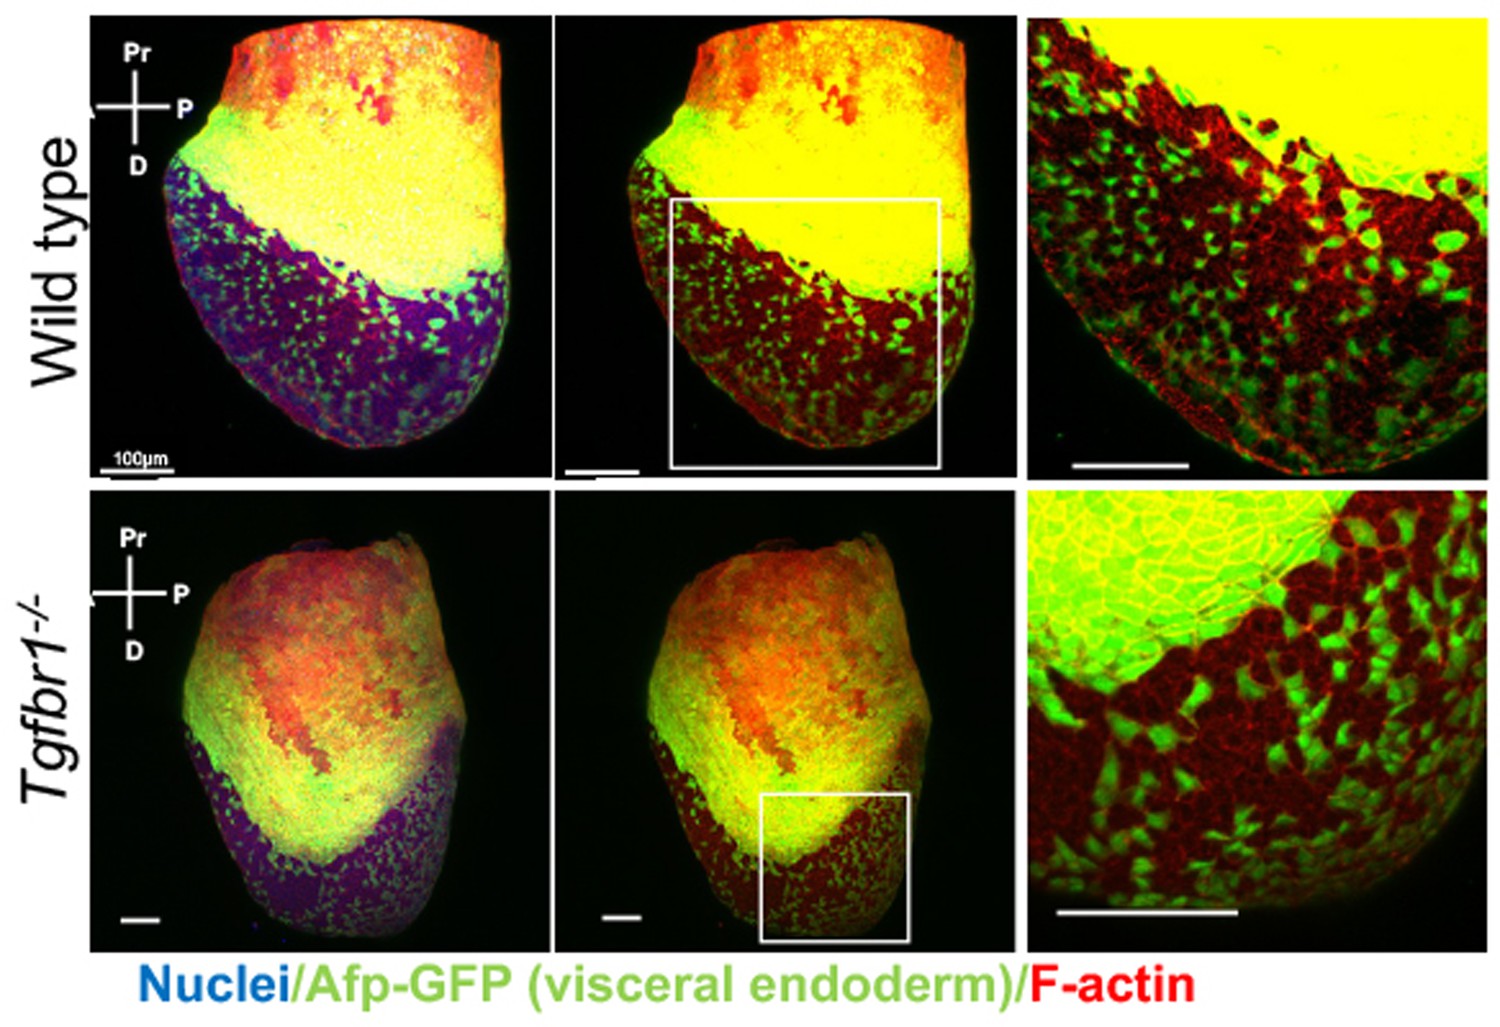
Analysis of visceral endoderm (VE) dispersal in wild-type and Tgfbr1 mutant E7.5 embryos.
No differences can be seen in the mutant embryo relative to the wild-type control.
Figure 8 with 2 supplements
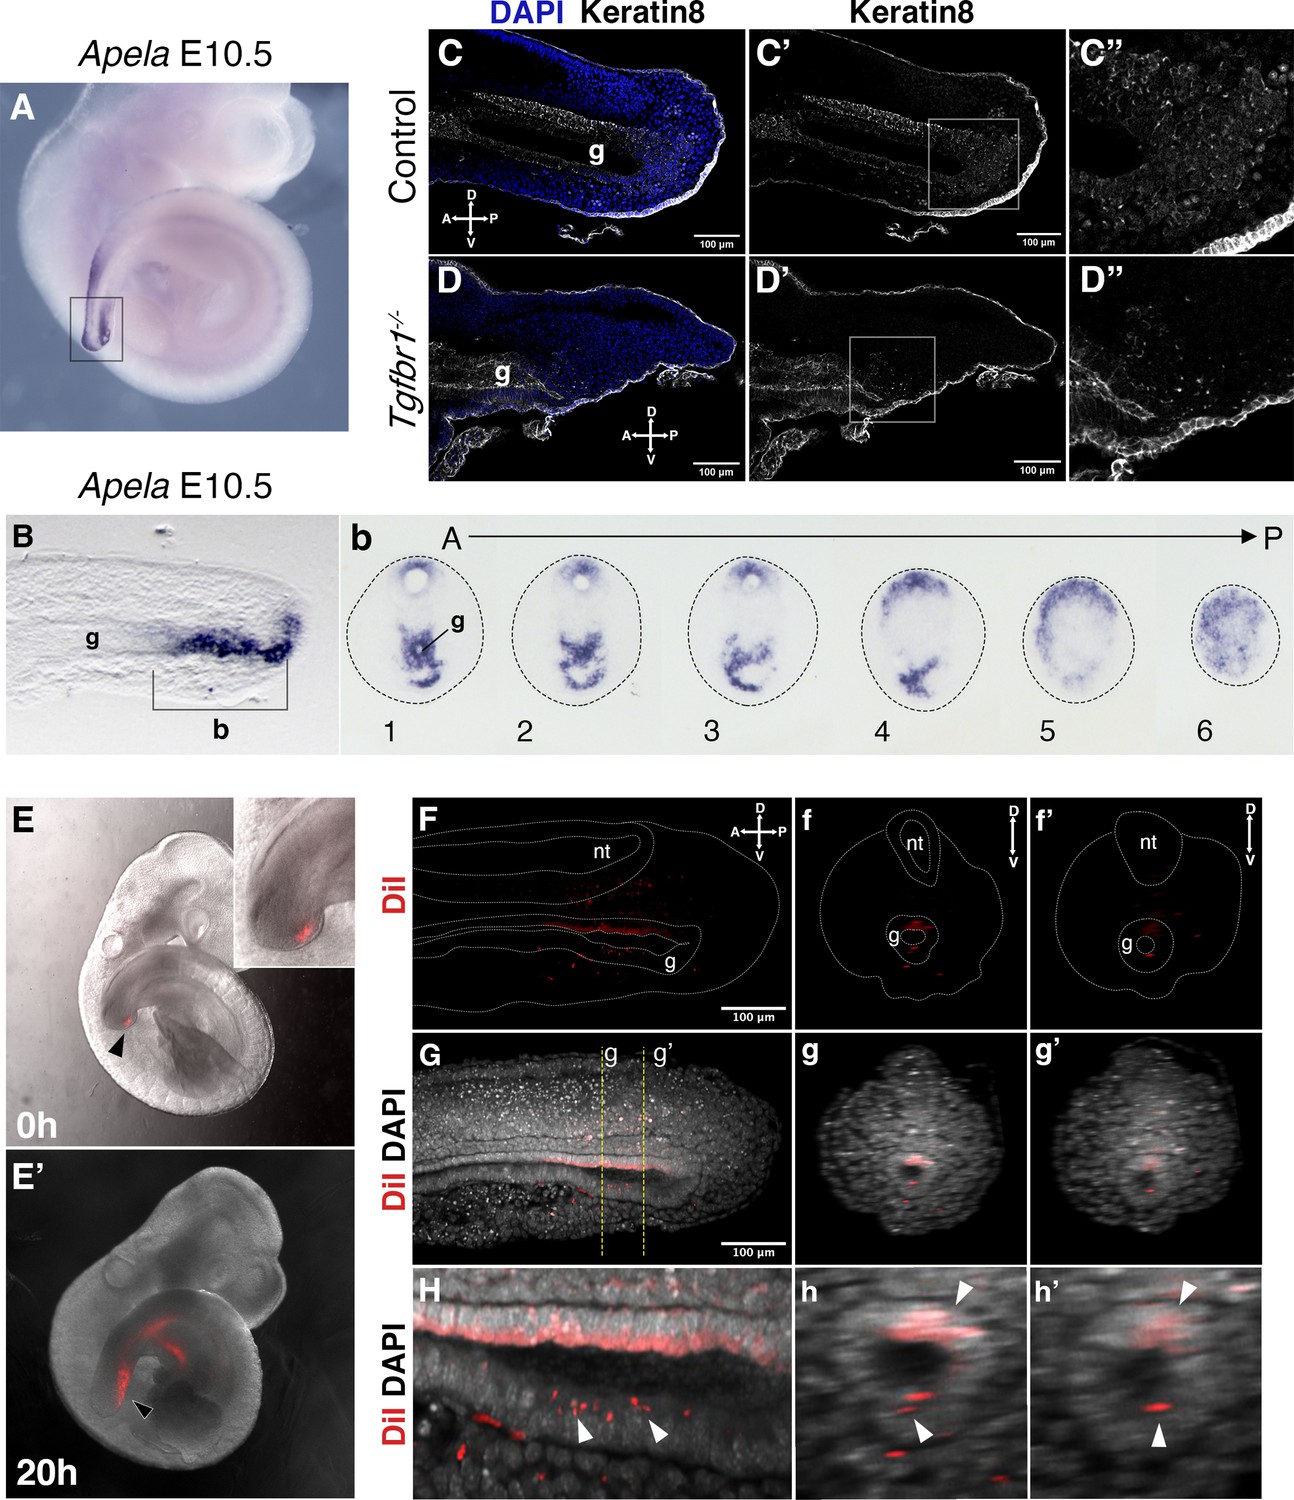
Tail gut endoderm has contribution from the posterior pool of tail bud cells.
(A) Whole-mount in situ hybridization showing expression of Apela in E10.5 wild-type embryo. (B) Sagittal section through the region marked by rectangle in A shows presence of Apela-stained structure posterior to tail gut endoderm. (b) Series of transversal sections though the Apela-expressing region posterior to the gut endoderm (marked by square bracket in B). (C–D”) Sagittal optical sections through the tail region of the whole-mount immunostaining for Keratin 8 (white) in E10.5 control (C–C”) and Tgfbr1−/− (D–D”) embryos. Nuclei are shown in blue. Squares in C’ and D’ show the pool of epithelial cells posterior to the tail gut tube. This region coincides with newly formed endodermal cells expressing Apela shown in B, b. C”. D” higher magnification of the region marked by square in C’ and D’. A – anterior, P – posterior, g – gut. (E, E’) Whole-mount images of embryos injected with DiI in the Apela-positive region of the tail bud posterior to the gut endoderm, just after injection (E) or after 20 hr of incubation (E’). The magnification of the tail bud in the inset shows the absence of label in the gut tube. (F–h’) Optical sections from two-photon images of the embryo in E’ to show the presence of DiI cells in the gut tube. (F–H) show sagittal sections; f–h’ show transverse sections. (F–f’’) show the DiI channel; tail, neural tube (nt) and gut (g) are outlined with a dashed line. (G–g’) show DiI and DAPI channels together. H–h’ show magnification of DiI labeling in the gut tube (white arrowheads).
Figure 8—figure supplement 1
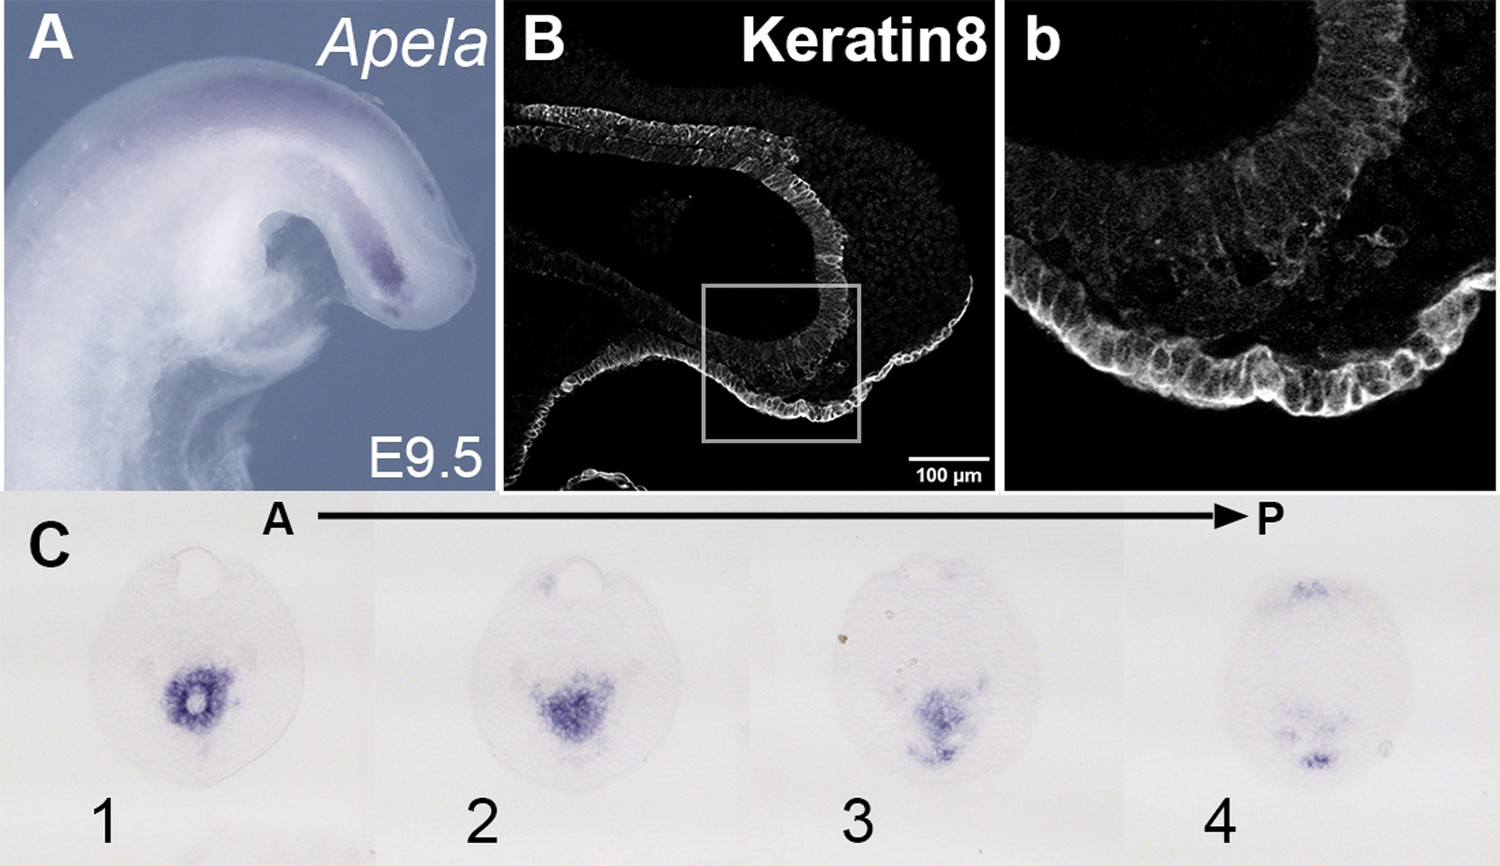
Tail gut of E9.5 wild-type embryo.
(A, C) Apela staining in the wild-type tail bud at E9.5. (C) shows a series of transversal sections through the Apela-positive region shown in the whole-mount image in A. (B, b) Keratin 8-stained cells ventrally and posteriorly to the tail gut endoderm. (b) Shows a magnified image of the region marked by the square in B.
Figure 8—figure supplement 2
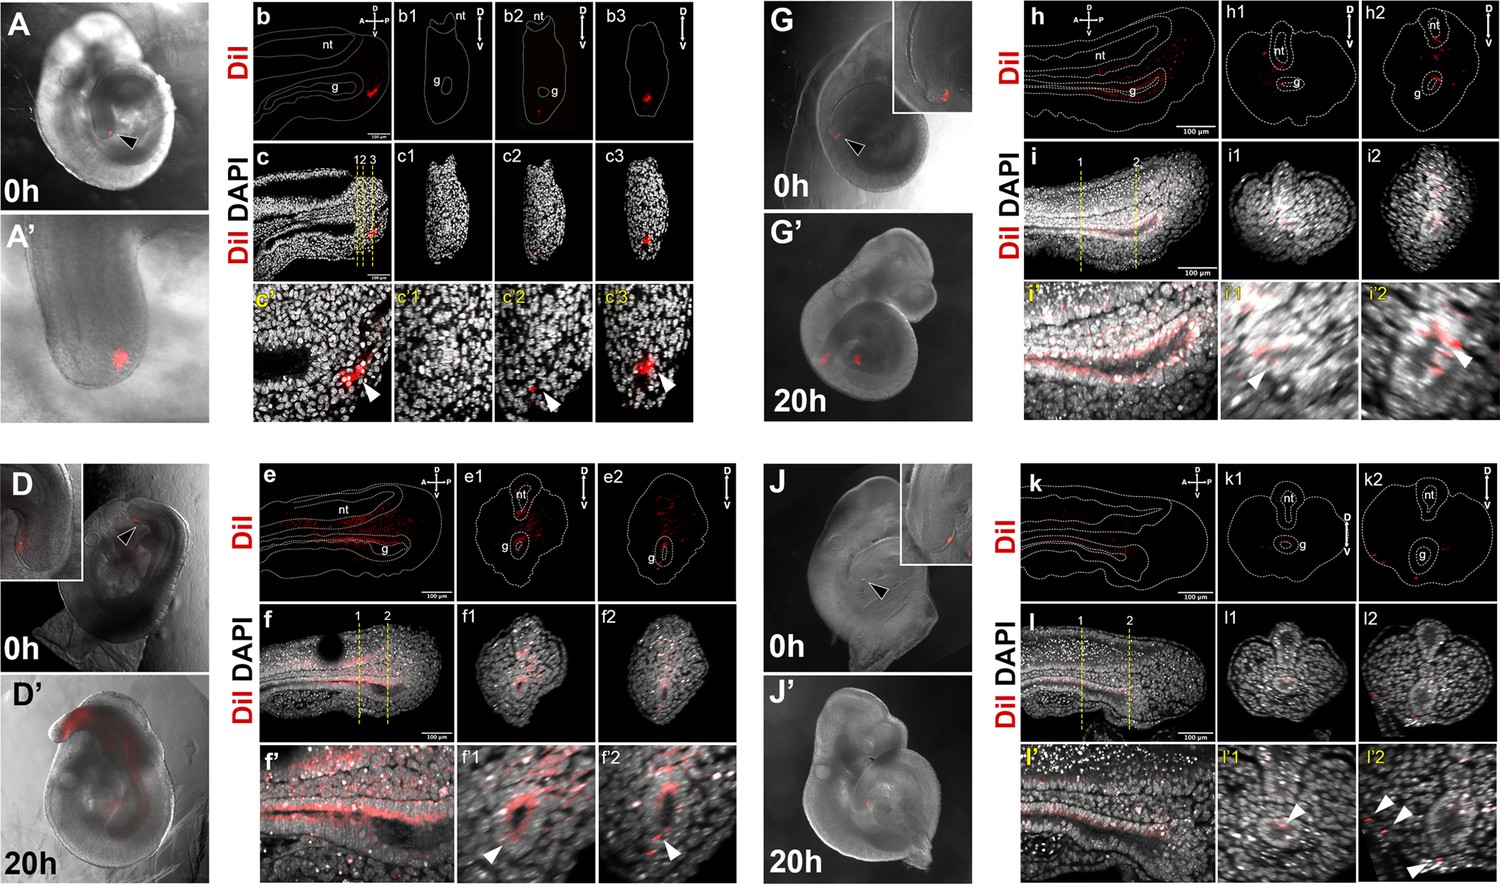
DiI labeling of the Apela-positive region in the E9.5 tail bud.
(A–c3) Control showing injected region prior to culture. Sagittal and transversal sections shown in b–c3 show absence of DiI label in the gut. (D–i’2) DiI labeling of E9.5 embryos. Embryos shown in D–i’2 were injected in the region specified in A–c’3. In J–l’2 DiI was injected in the tail bud ectoderm (black arrowhead). (D, D’, G, G’, J, and J’) show whole-mount images of embryos right after the injection (D, G, J) and after 20 hr in culture (D’, G’, J’). Insets in D and G show that the gut tube is negative for DiI staining. Inset in J shows staining in the ectoderm. e–f’2’, h–i’2, and k–l’2 show sagittal (e, f, f’, h, i, i’, k, l, l’) and transversal (e1–f’2, h1–i’2’, k1–l’2) optical sections though the tail regions of the cultured embryos shown in D’, G’, J’, respectively. e–e2, h–h2, and k–k2 DiI labeling, dashed line shows the outline if the tail, neural tube (nt) and tail gut endoderm (g). (f–f2, i–i2, and l–l2) show an overlay of DiI and DAPI channels; lower panels show magnification of stating in the gut. White arrowheads in f’–f’2, i’–i’2, and l’–l’2 show incorporation of Dil-stained cells into gut endoderm. White arrowheads in i’2 show that when ectoderm was injected DiI mainly labels ectoderm, with minor leaking into the dorsal gut (l’1).
Figure 9
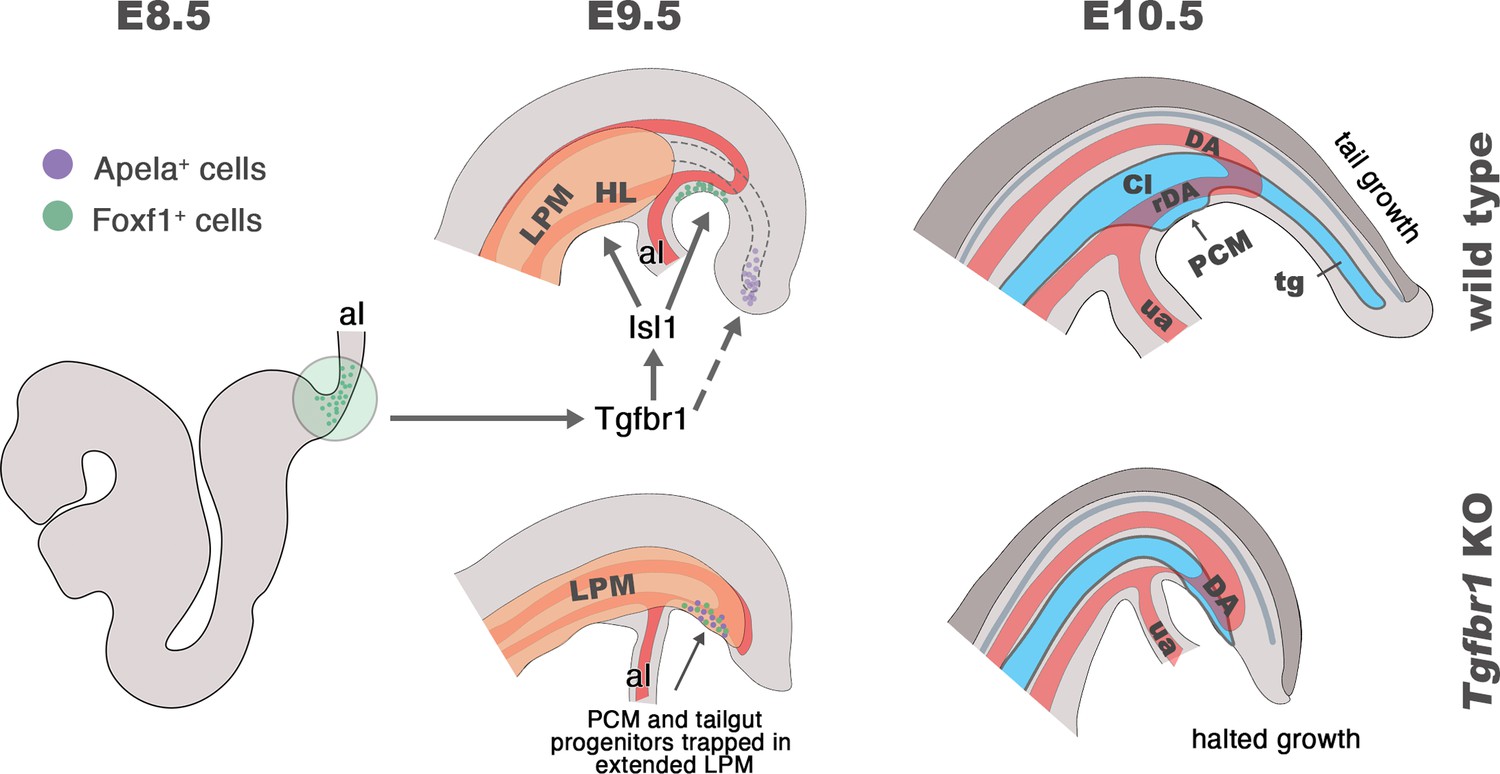
Schematic representation of Tgfbr1 activity on the posterior epiblast/primitive streak (PS) region during the trunk to tail transition.
At E8.5 embryo undergoes turning, associated with anterior relocation of the allantois along the ventral side of the embryo. In wild-type embryos (top panel), Tgfbr1 acts upstream of Isl1, which induces hindlimb (HL) formation from the somatic lateral plate mesoderm (LPM), marking the posterior limit of this mesodermal compartment. Additionally, Isl1 is involved in formation of the pericloacal mesenchyme (PCM), likely from the Foxf1+ in the posterior PS (shown in green), and in the development of the recurved dorsal aorta (rDA). Tail gut (tg) growth is, at least in part, supplied by the cells located in the tail bud (endodermal Apela+ cells are shown in purple). At E10.5 the trunk to tail transition is completed, resulting in the formation of the posterior trunk structures, including HL, cloaca (Cl), PCM, and the connection of embryonic/extraembryonic (umbilical artery – ua) blood circulation via rDA. Tail growth continues generating neural tube (dark gray), presomitic mesoderm (not shown), and tg (blue). In the absence of Tgfbr1 (bottom panel) Isl1 is not activated, hindlimbs are not induced from the LPM, which, instead, keeps extending posteriorly. PCM and tg progenitor cells are misrouted and trapped in the posteriorly extended LPM. The rDA is underdeveloped. Development of Tgfbr1 mutants is halted around E10.5.
Author response image 1

Image showing an example of an ISH procedure with a probe against Tgfbr1, showing widespread and low expression.
The lower picture shows a ventral view of a stained wild type E10.5 embryo.
Tables
Table 1
Genotyping primers.
| Genotyping primers | ||
|---|---|---|
| Tgfbr1 mutant allele | Forward | CTACTGTGTTTCAAATGGGAGGGC |
| Reverse | GGCCTGTCGGATCCTATCATC | |
| Tgfbr1 wild-type allele | Forward | CTACTGTGTTTCAAATGGGAGGGC |
| Reverse | ACATACAAATGGCCTGTCTCG | |
| Isl1 mutant allele | Forward | GCCACTATTTGCCACCTAGC |
| Reverse | AGGCAAATTTTGGTGTACGG | |
| Isl1 wild-type allele | Forward | GCCACTATTTGCCACCTAGC |
| Reverse | CAAATCCAAAGAGCCCTGTC | |
| Cre recombinase | Forward | CGAGTGATGAGGTTCGCAAG |
| Reverse | CCTGATCCTGGCAATTTCGGCT | |
Appendix 1—key resources table
| Reagent type (species) or resource | Designation | Source or reference | Identifiers | Additional information |
|---|---|---|---|---|
| Strain, strain background (M. musculus) | Isl1Cre | Jackson Labs | Stock # 024242 RRID:IMSR_JAX:024242 | Yang et al., 2006 |
| Strain, strain background (M. musculus) | ROSA26-R-gal | Jackson Labs | Stock #003474, RRID:IMSR_JAX:003474 | Soriano, 1999 |
| Strain, strain background (M. musculus) | ROSA26-R-EYFP | Jackson Labs | Stock #006148, RRID:IMSR_JAX:006148 | Srinivas et al., 2001 |
| Strain, strain background (M. musculus) | Tgfbr1+/− | Kwon et al., 2008 eLife 9, e56615 | ||
| Strain, strain background (M. musculus) | Alf-GFP | Kwon et al., 2008 Dev. Cell 15, 509–520 | ||
| Antibody | Pecam1 | Abcam | Cat #ab28364, RRID:AB_726362 | |
| Antibody | Keratin 8 | Developmental Studies Hybridoma Bank | Troma 1, RRID:AB_2891089 | |
| Antibody | Epcam | Biolegend | Cat #118202, RRID:AB_1089027 | |
| Antibody | GFP | Aveslabs | Cat #GFP-1020 | |
| Antibody | Sheep antidigoxigenin Fab fragments | Roche | Cat #11093274910, RRID:AB_514497 | AP-conjugated |
| Recombinant DNA reagent | T-Str-promoter | Clements et al., 1996 Mech. Dev. 56, 139–149 | Primitive streak specific promoter from Tbxt | |
| Recombinant DNA reagent | creERT | Jurberg et al., 2013 Dev. Cell 25, 451–462 | Tamoxifen-inducible cre recombinase | |
| Sequence-based reagent | Oligonucleotides | Table 1 | ||
| Commercial assay or kit | DIG RNA Labeling Mix | Roche | Cat #11277073910 | |
| Commercial assay or kit | NBT/BCIP solution | Roche | Cat #11681451001 | |
| Commercial assay or kit | Blocking reagent | Roche | Cat #11096176001 | |
| Chemical compound, drug | CellTracker CM-DiI | Life Technologies | Cat #C7000 | |
| Chemical compound, drug | Proteinase K | Roche | Cat #3115801001 | |
| Chemical compound, drug | Tamoxifen | Sigma | Cat #T5648 | |
| Chemical compound, drug | RapiClear | SUNJin lab | Cat #1.49 |
Additional files
Download links
A two-part list of links to download the article, or parts of the article, in various formats.
Downloads (link to download the article as PDF)
Open citations (links to open the citations from this article in various online reference manager services)
Cite this article (links to download the citations from this article in formats compatible with various reference manager tools)
Tgfbr1 regulates lateral plate mesoderm and endoderm reorganization during the trunk to tail transition
eLife 13:RP94290.
https://doi.org/10.7554/eLife.94290.3


