The T cell receptor β chain repertoire of tumor infiltrating lymphocytes improves neoantigen prediction and prioritization
- Medical Genetics Institute, Viet Nam
- University Medical Center Ho Chi Minh City, Viet Nam
Figures
Figure 1
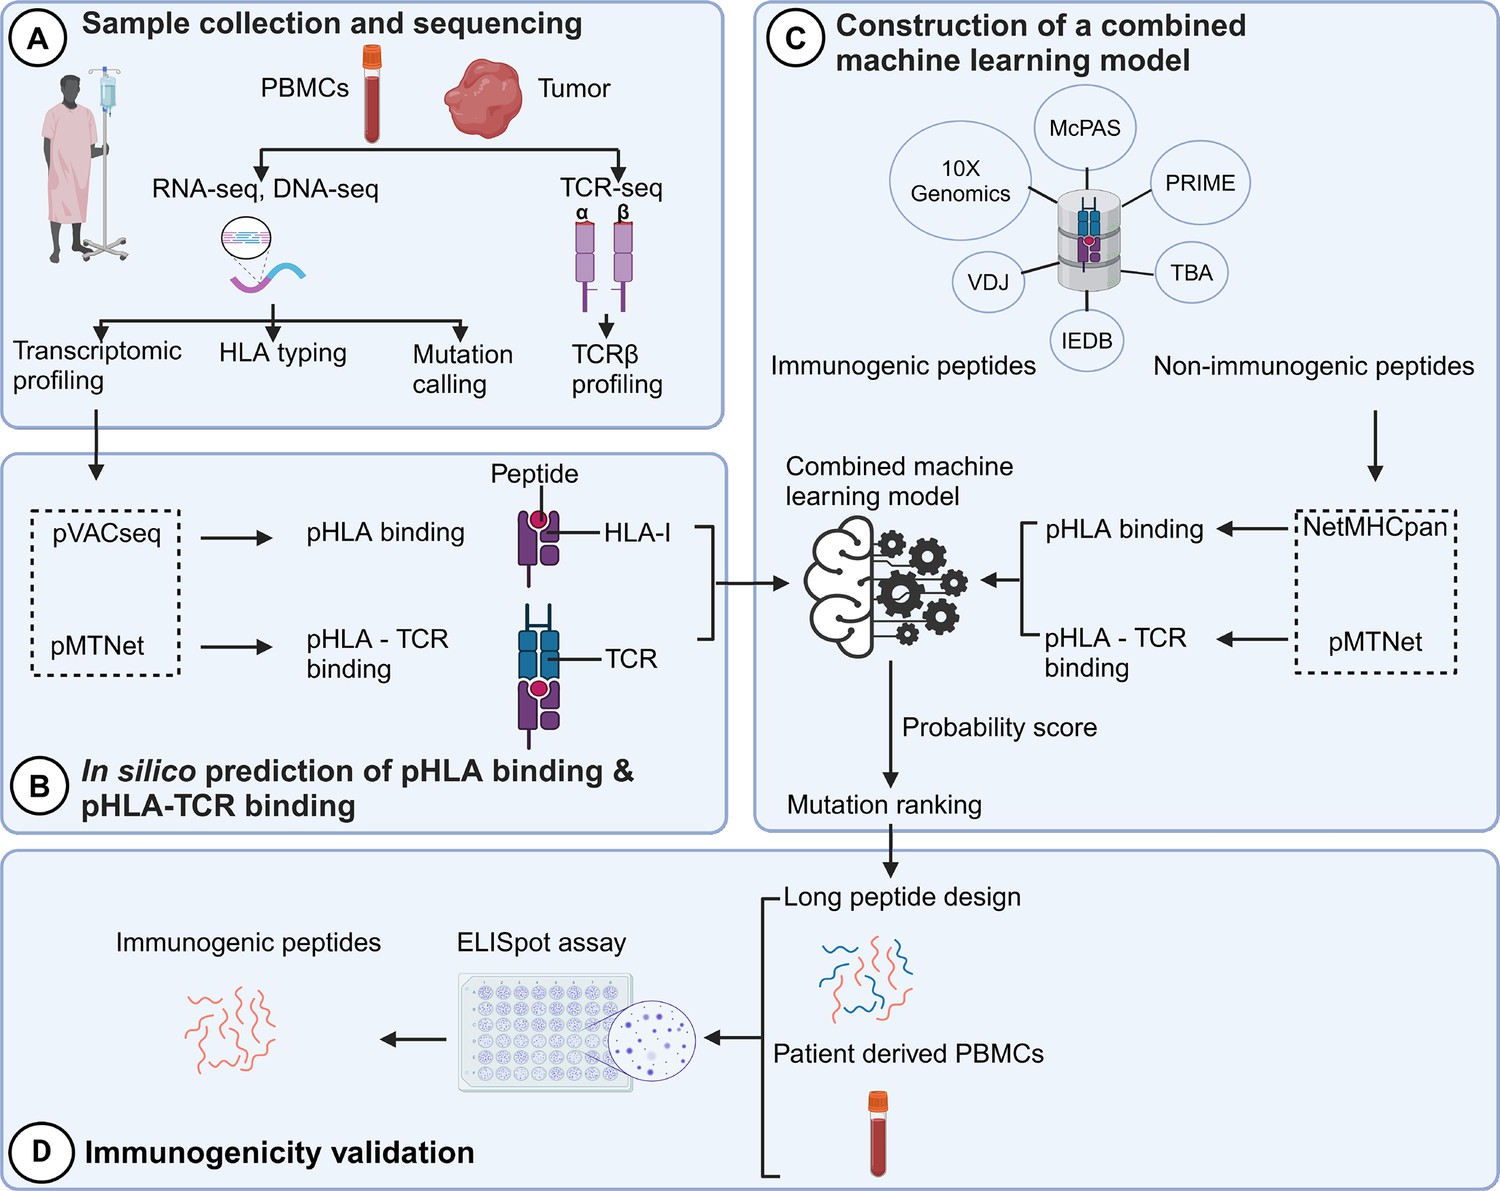
A novel workflow based on machine learning that integrates T cell receptor β (TCRβ) sequencing data for the identification and ranking of colorectal cancer (CRC) neoantigens.
(A) Tumor biopsies and peripheral blood from CRC patients were subjected to targeted DNA-seq, RNA-seq, and T cell receptor (TCR)-seq. (B) The prediction of peptide-human leukocyte antigen (HLA) binding and peptide-HLA-TCR binding by indicated tools using the DNA-seq, RNA-seq, and TCR-seq data was performed. (C) Machine learning models were subsequently constructed based on the analysis of the peptide-HLA binding and peptide-HLA-TCR binding features to distinguish immunogenic antigens from non-immunogenic peptides. (D) The immunogenicity of predicted neoantigen candidates prioritized by the model was validated by enzyme-linked immunospot (ELISpot) to evaluate the effectiveness of this approach.
Figure 2 with 3 supplements
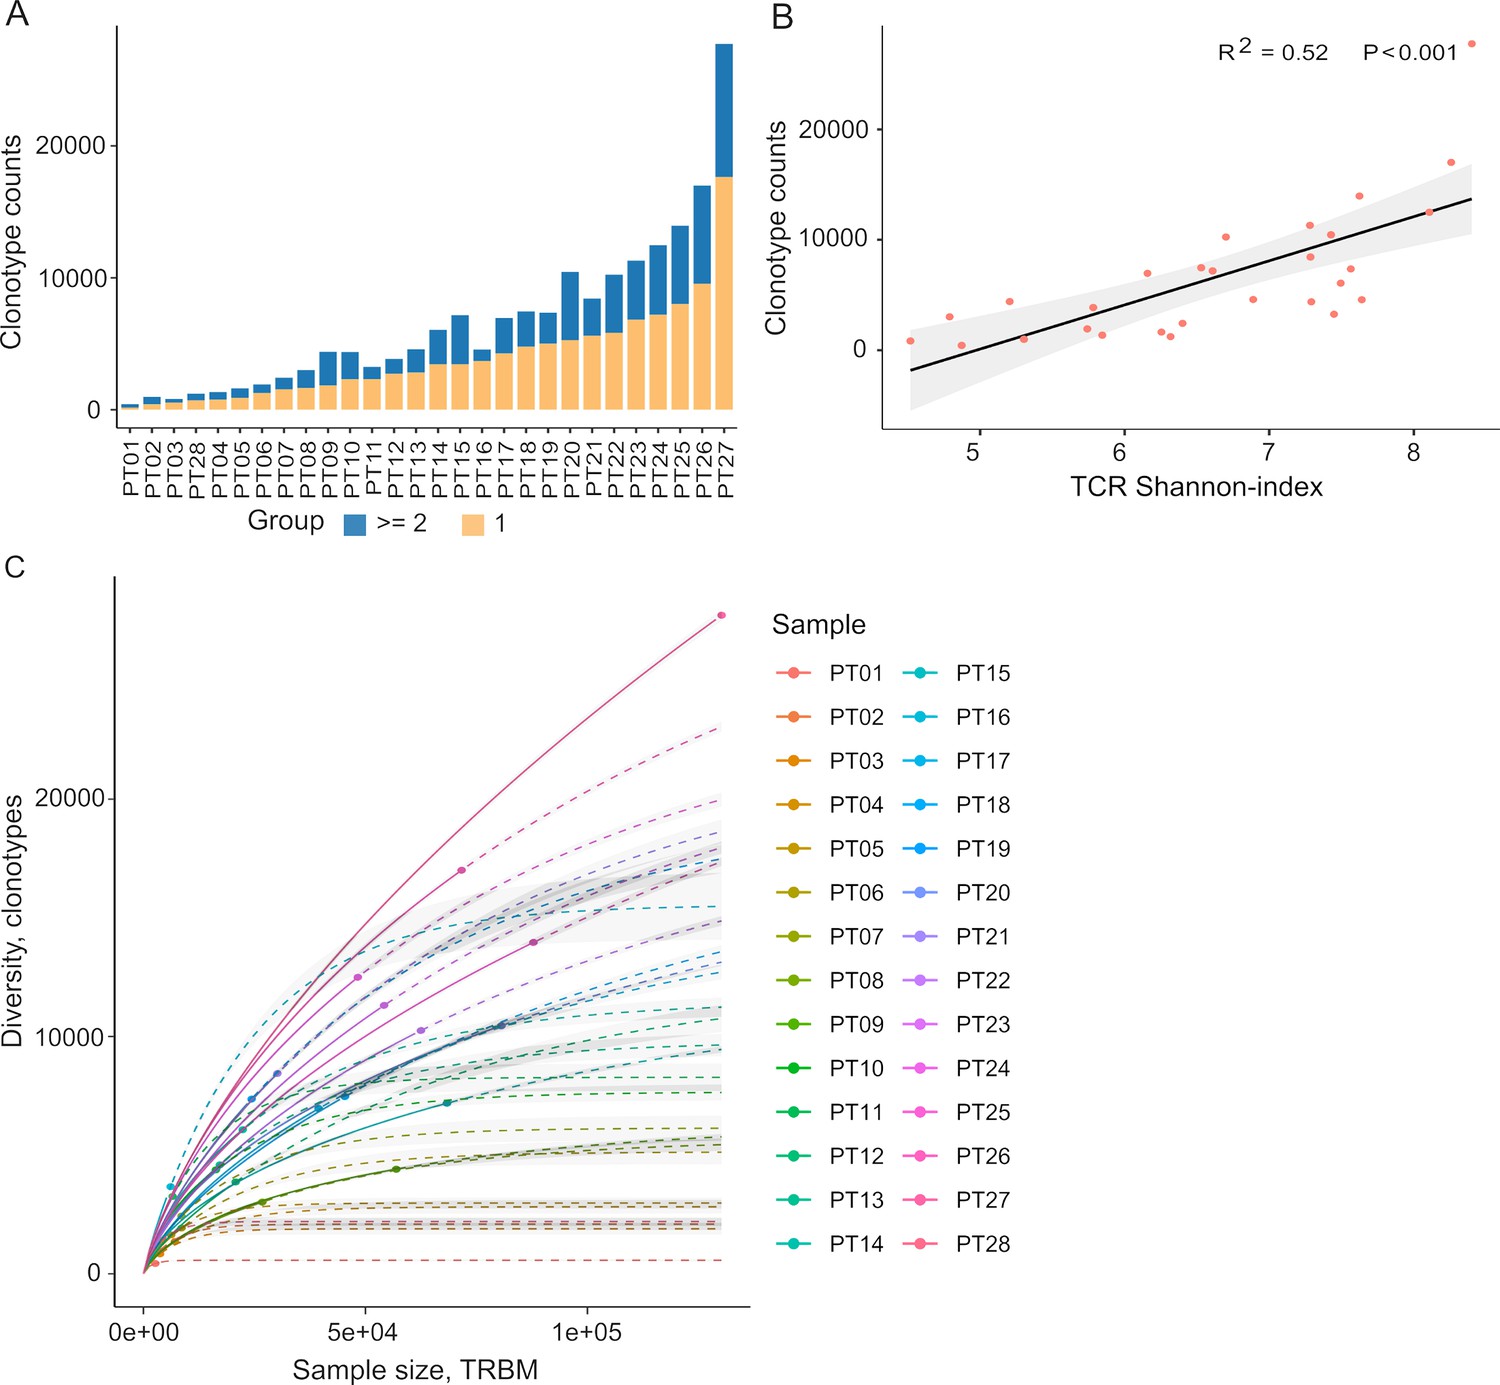
Tumor-infiltrating T cell receptor β (TCRβ) profiles in 28 colorectal cancer patients.
(A) A bar plot depicting the distribution of T cell receptor (TCR) clonotypes among 28 colorectal cancer (CRC) patients, categorized into two groups: those with a unique read count and those with read counts greater than or equal to 2 for each TCR clonotype. (B) The scatter plot illustrates the relationship between the Shannon-index and the number of TCR clones. (C) The rarefaction plot shows the variable between sample size and diversity among 28 CRC samples.
Figure 2—figure supplement 1
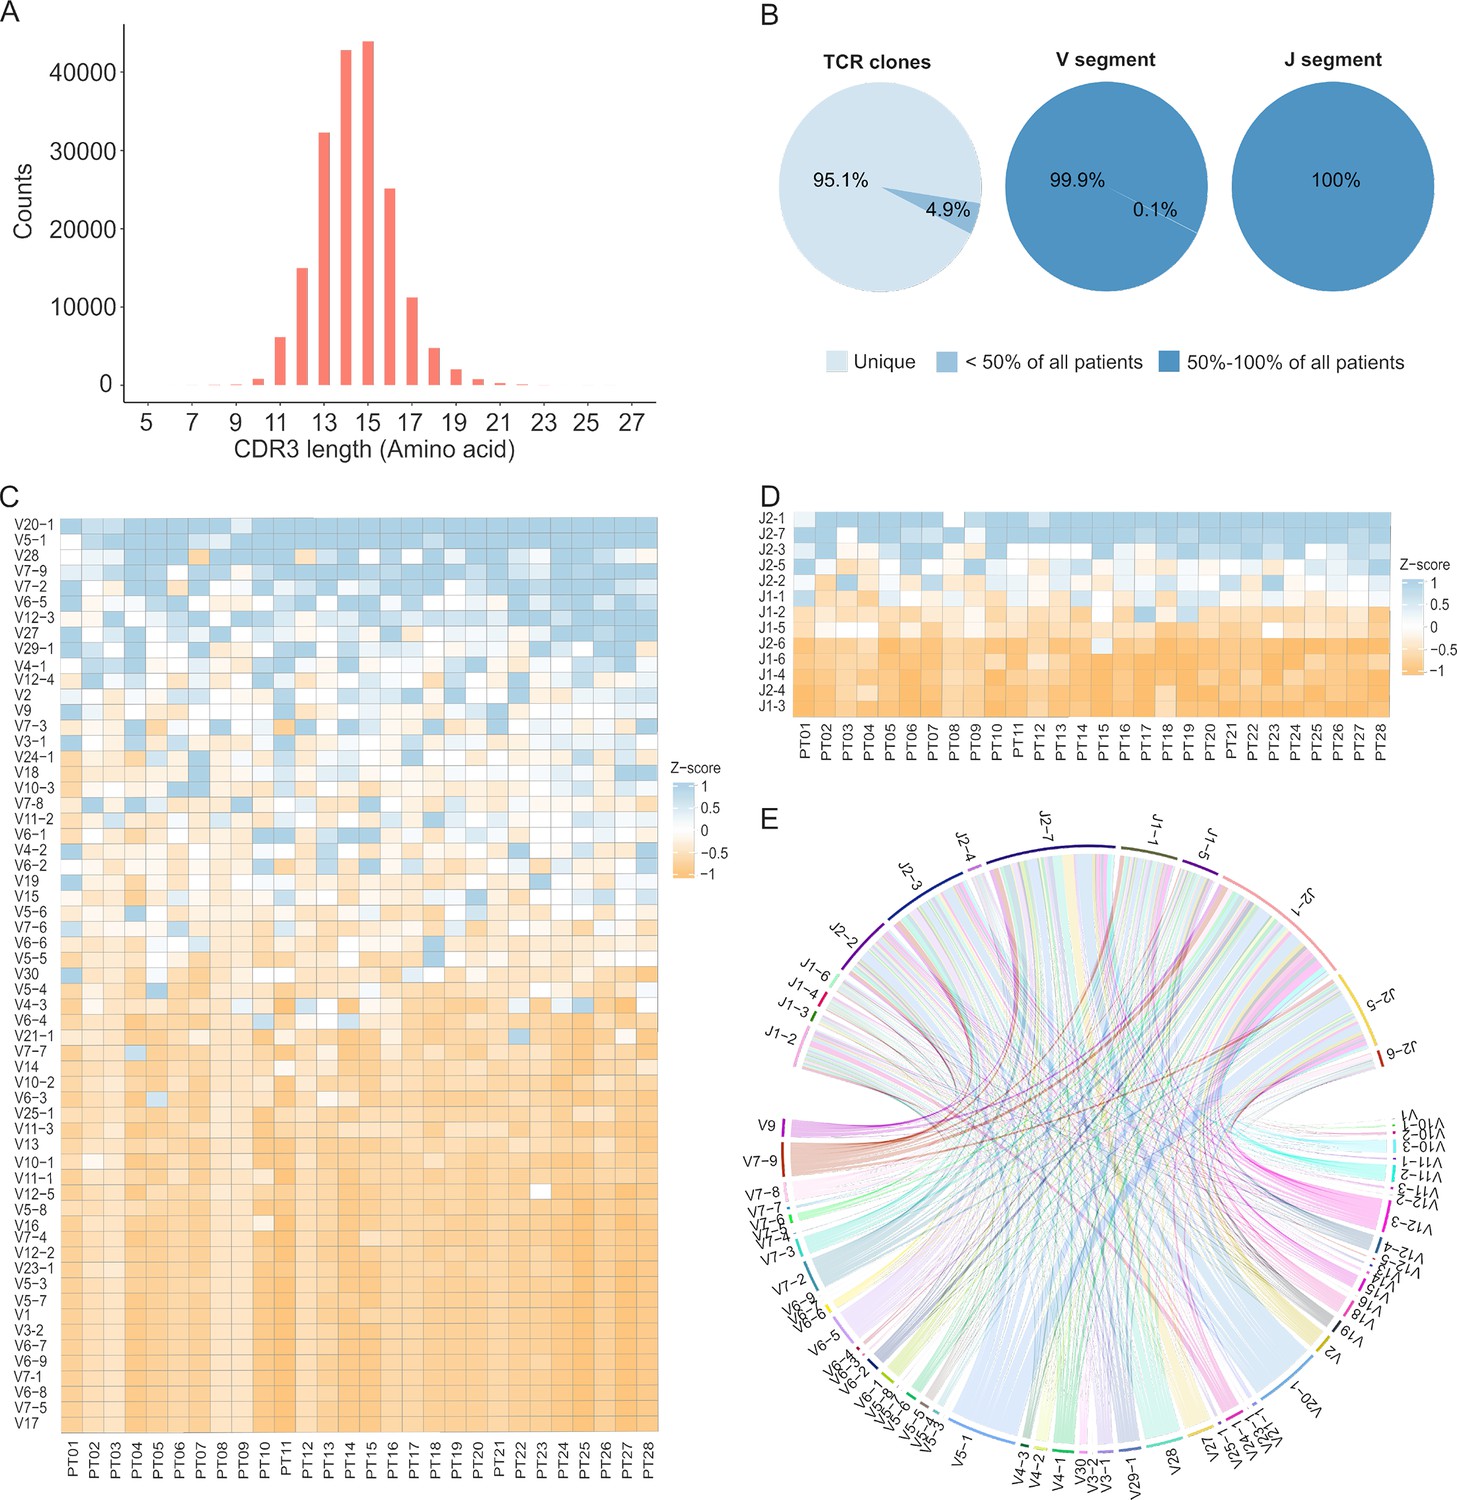
Quality control metrics for tumor-infiltrating lymphocyte (TIL) T cell receptor β (TCRβ) analysis.
(A) Distribution of CDR3β lengths in total T cell receptor (TCR) clones. (B) The pie chart displays the recurrence rates of TCR clones, variable (V) segments, and joining (J) segments when the read count of TCR clones exceeds 01. The graph illustrates the uniqueness of TCR clones and the shared presence of both V and J segments. (C) The heatmap depicts the Z-scored read counts of V segments or (D) J segments across 28 samples. Some V and J segments were found to be dominant in all samples. (E) The chord diagram illustrates the rearrangement of V and J segments, revealing random V and J combinations, with a few combinations exhibiting high frequencies.
Figure 2—figure supplement 2
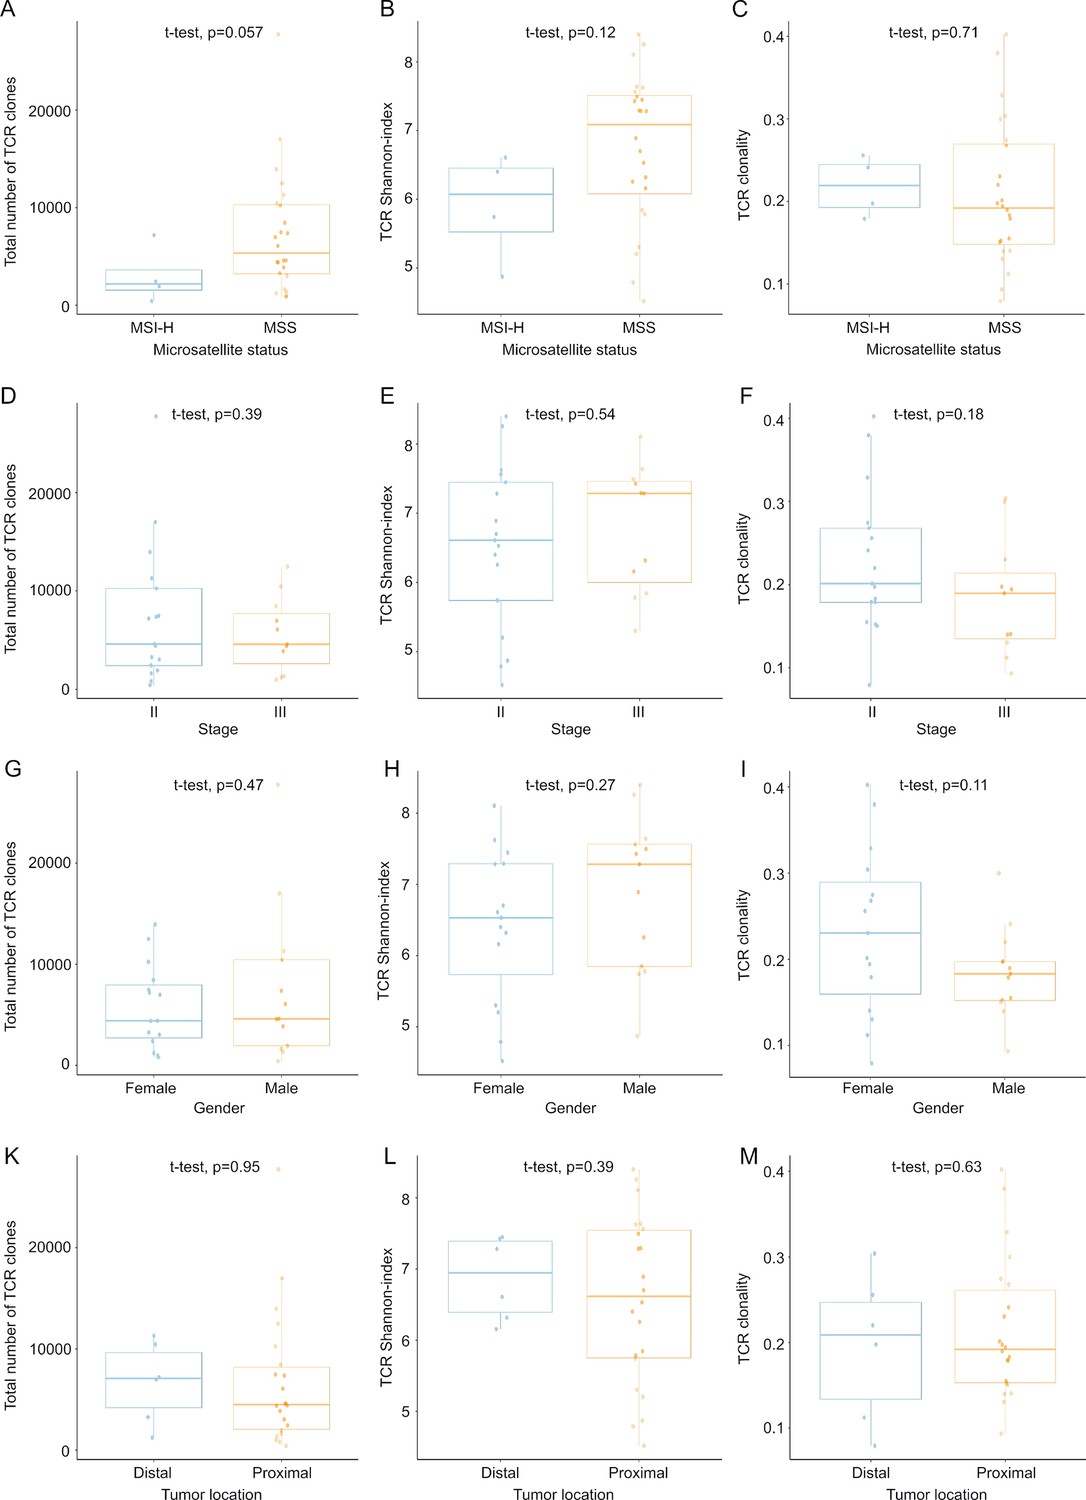
Association between tumor-infiltrating lymphocyte (TIL) T cell receptor β (TCRβ) profiles and patients' characteristics.
The bar plot and dot plot compare T cell receptor (TCR) clones, Shannon index, and clonality between high microsatellite instability (MSI-H) and microsatellite stability (MSS) (A, B, C), stage II and III (D, E, F), female and male gender (G, H, I), and distal and proximal tumor locations (K, L, M).
Figure 2—figure supplement 3
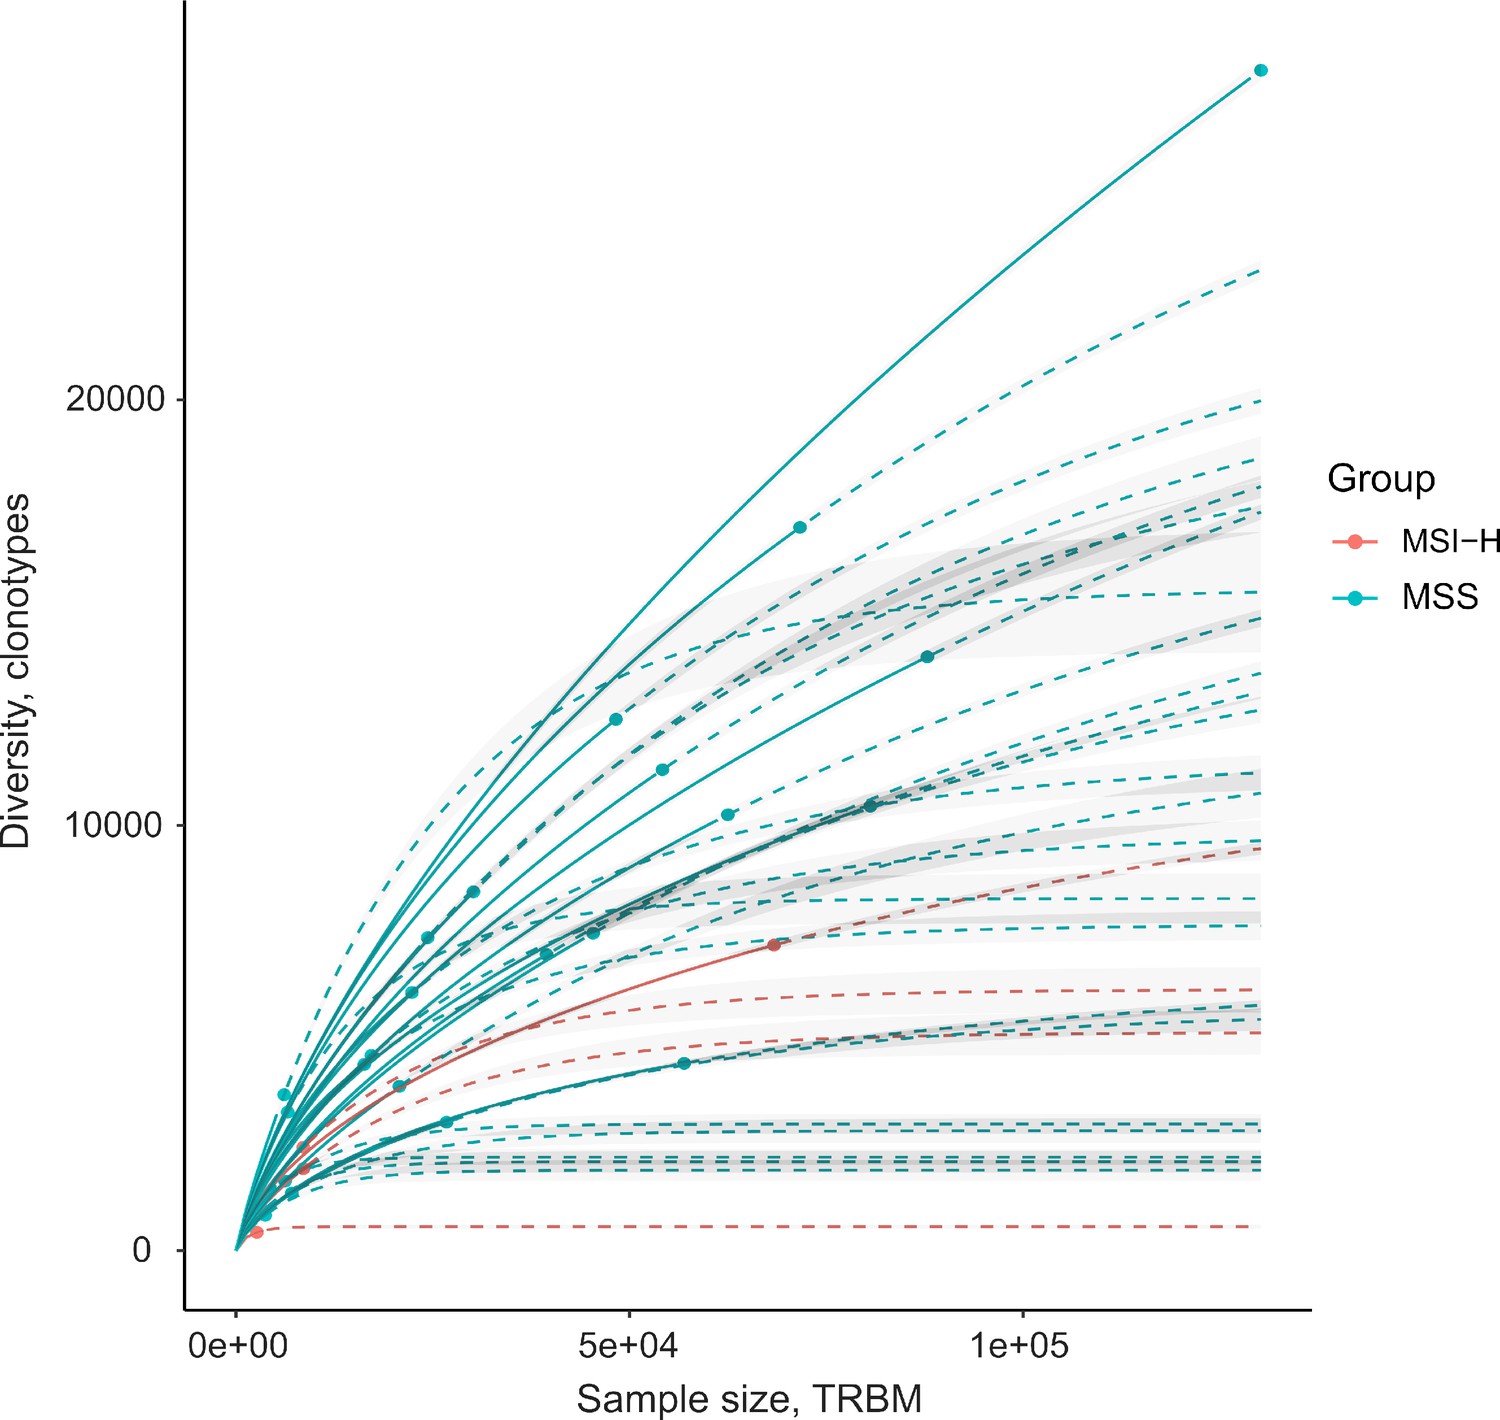
Rarefaction between microsatellite instability (MSI) and microsatellite stability (MSS) samples.
The rarefaction plot illustrates the sample size and diversity of samples in two groups: MSI and MSS.
Figure 3
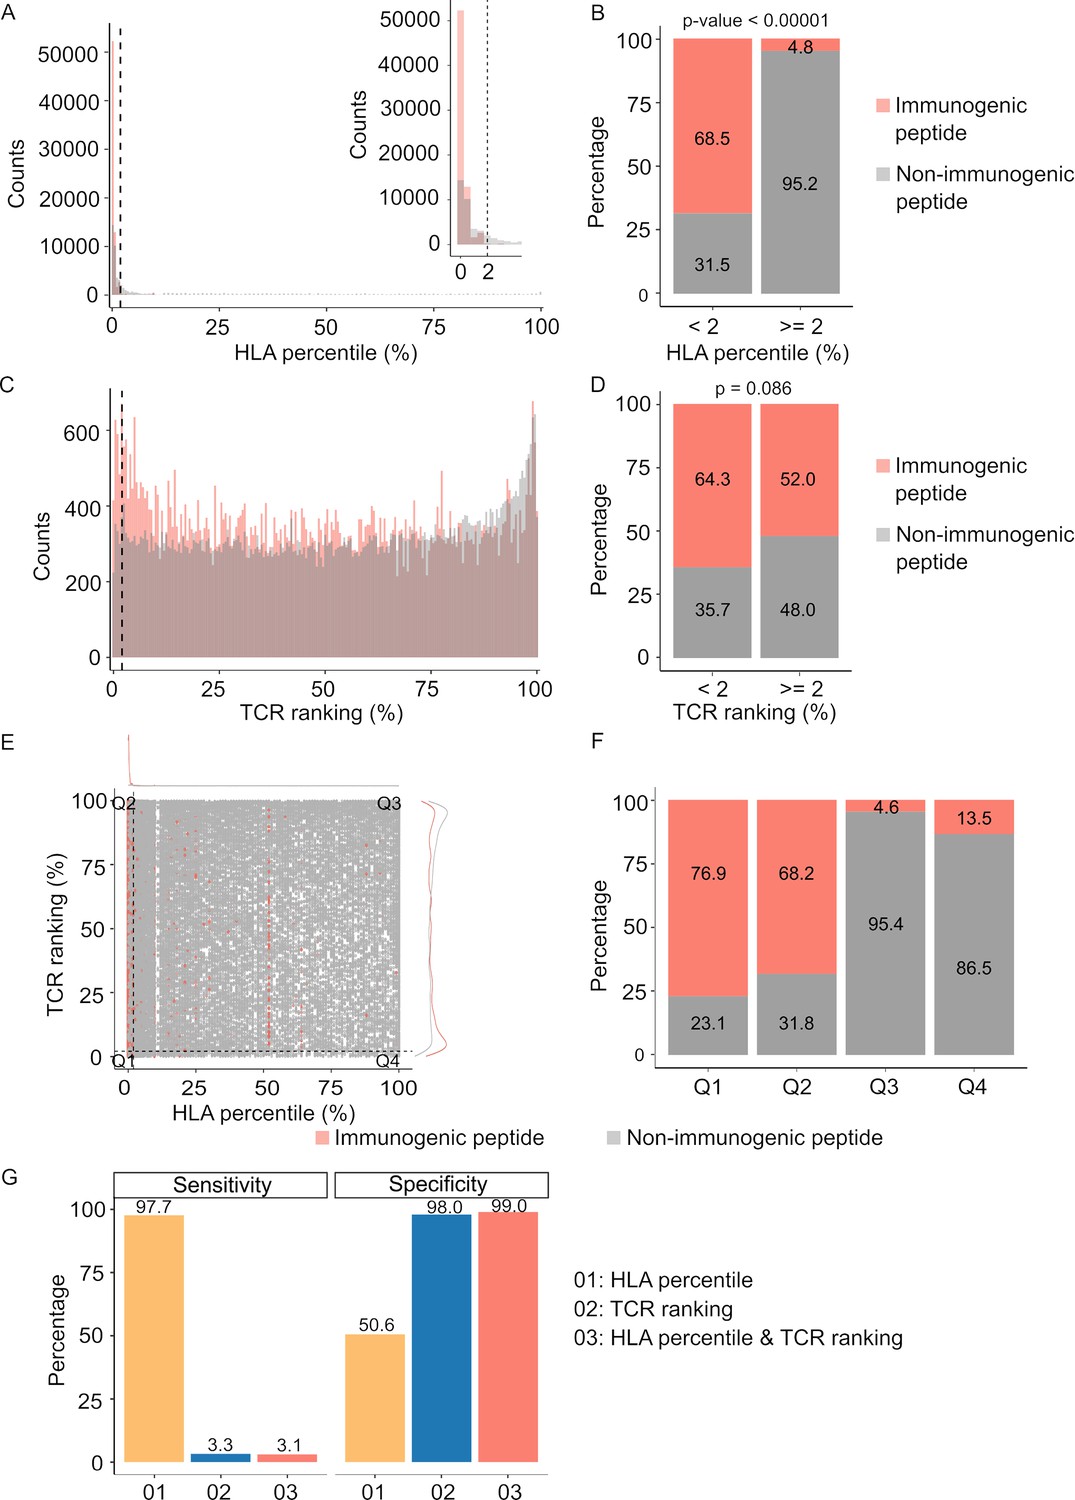
Peptide-T cell receptor (TCR) and peptide-human leukocyte antigen (HLA) interactions are two complementary determinants of neoantigen immunogenicity.
(A) The histogram displays the HLA percentile distribution of immunogenic antigens (red bar) and non-immunogenic peptides (gray bar). (B) The percentage of immunogenic antigens (red bar) and non-immunogenic peptides (gray bar) is compared between two groups based on HLA percentile:<2% and ≥ 2% (Chi-square test, p<0.00001). (C) The histogram displays the TCR ranking distribution of immunogenic antigens (red bar) and non-immunogenic peptides (gray bar). (D) The percentage of immunogenic antigens (red bar) and non-immunogenic peptides (gray bar) is compared between two groups based on TCR ranking:<2% and ≥ 2% (Chi-square test, p=0.086). (E) The scatter plot illustrates the relationship between the HLA percentile distribution and TCR ranking of immunogenic antigens (red bar) and non-immunogenic peptides (gray bar). (F) The percentage of immunogenic antigens (red bar) and non-immunogenic peptides (gray bar) is analyzed in four distinct groups based on cutoffs of HLA percentile and TCR ranking. (G) The bar plot illustrates the sensitivity and specificity of three neoantigen prioritization approaches: based on neoantigen-HLA binding affinity alone (yellow bar), neoantigen-TCR binding ranking alone (blue bar), and the combined method using both features (red bar).
Figure 4 with 2 supplements
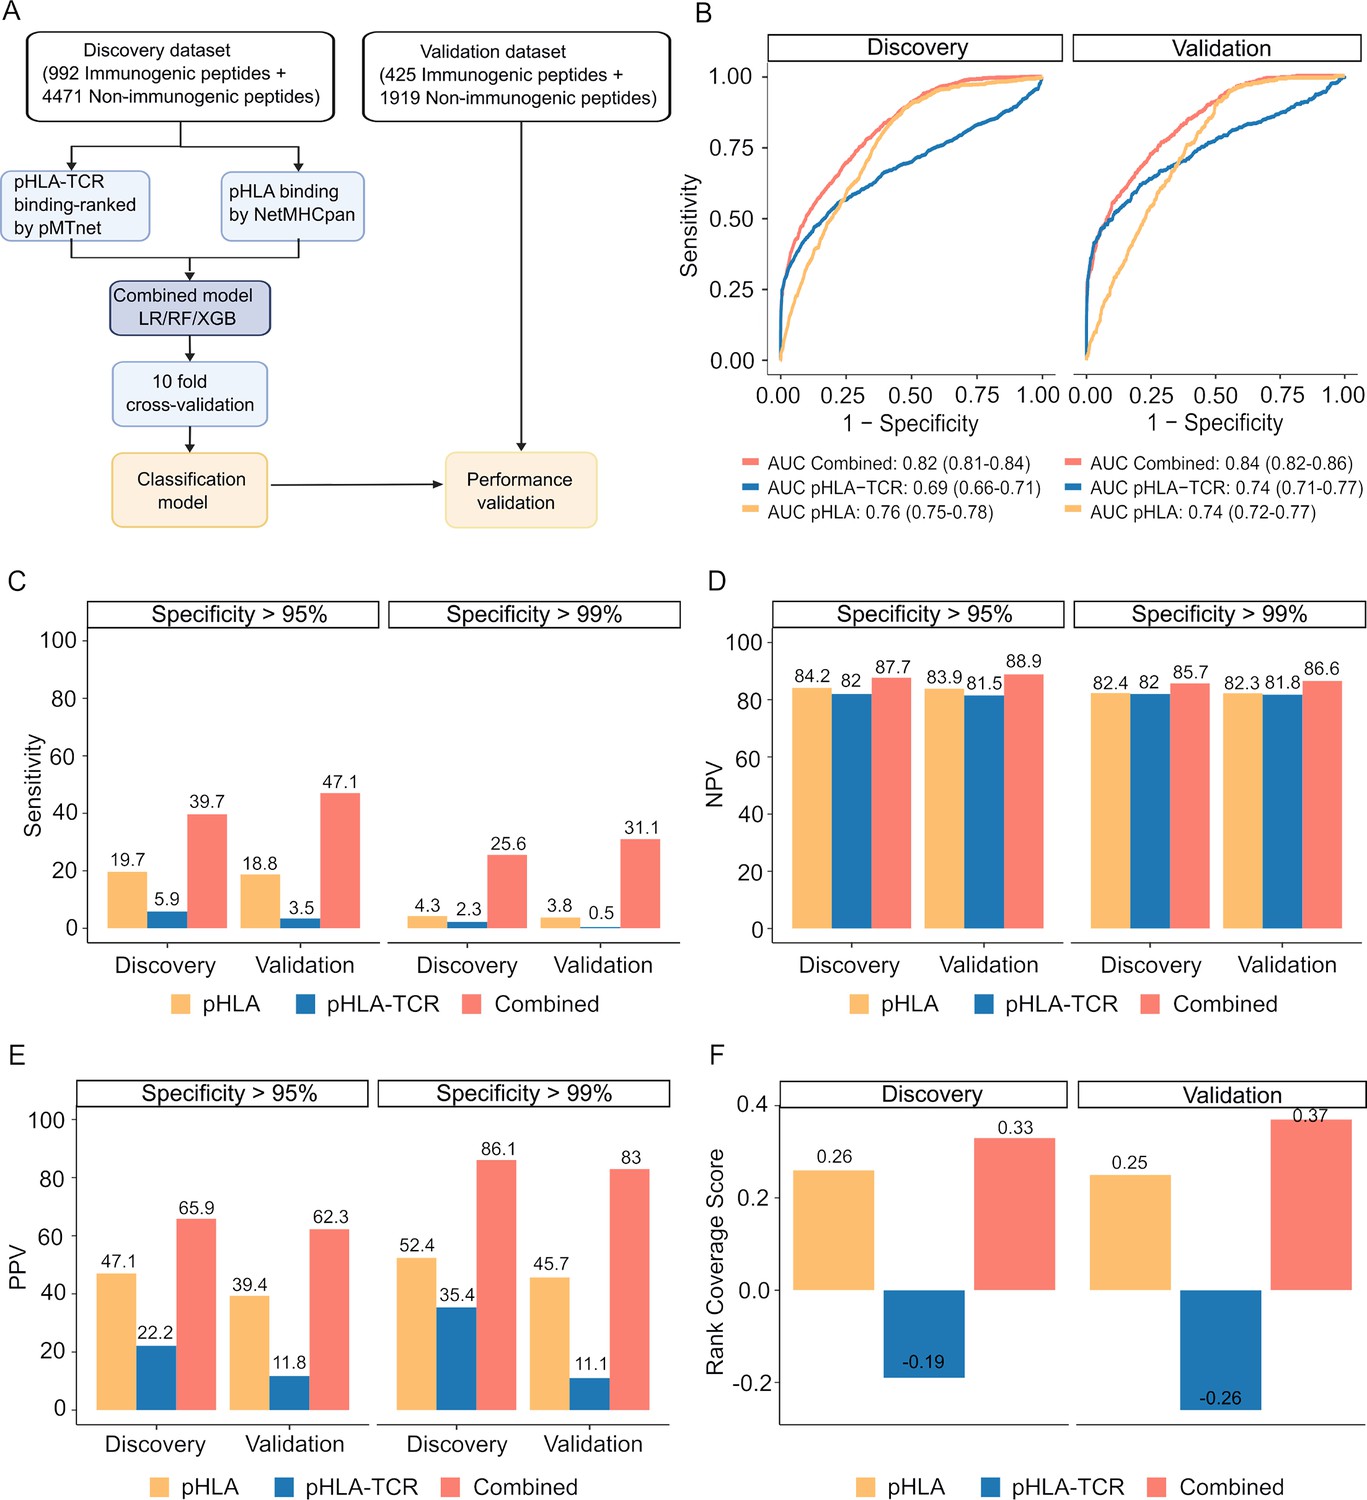
The combined model demonstrates improved sensitivity and specificity for neoantigen prioritization.
(A) The workflow for constructing the model. (B) The receiver operating characteristic (ROC) curves demonstrate the performance of both the combined model and individual models in both the discovery and validation cohorts. The bar graphs illustrate the sensitivity (C), negative predictive value (NPV) (D), and positive predictive value (PPV) (E) at specificity levels of at least 95% or 99% for both the combined and individual models in both the discovery and validation cohorts. (F) Ranking coverage scores for the specified models in either the discovery or validation cohorts.
Figure 4—figure supplement 1
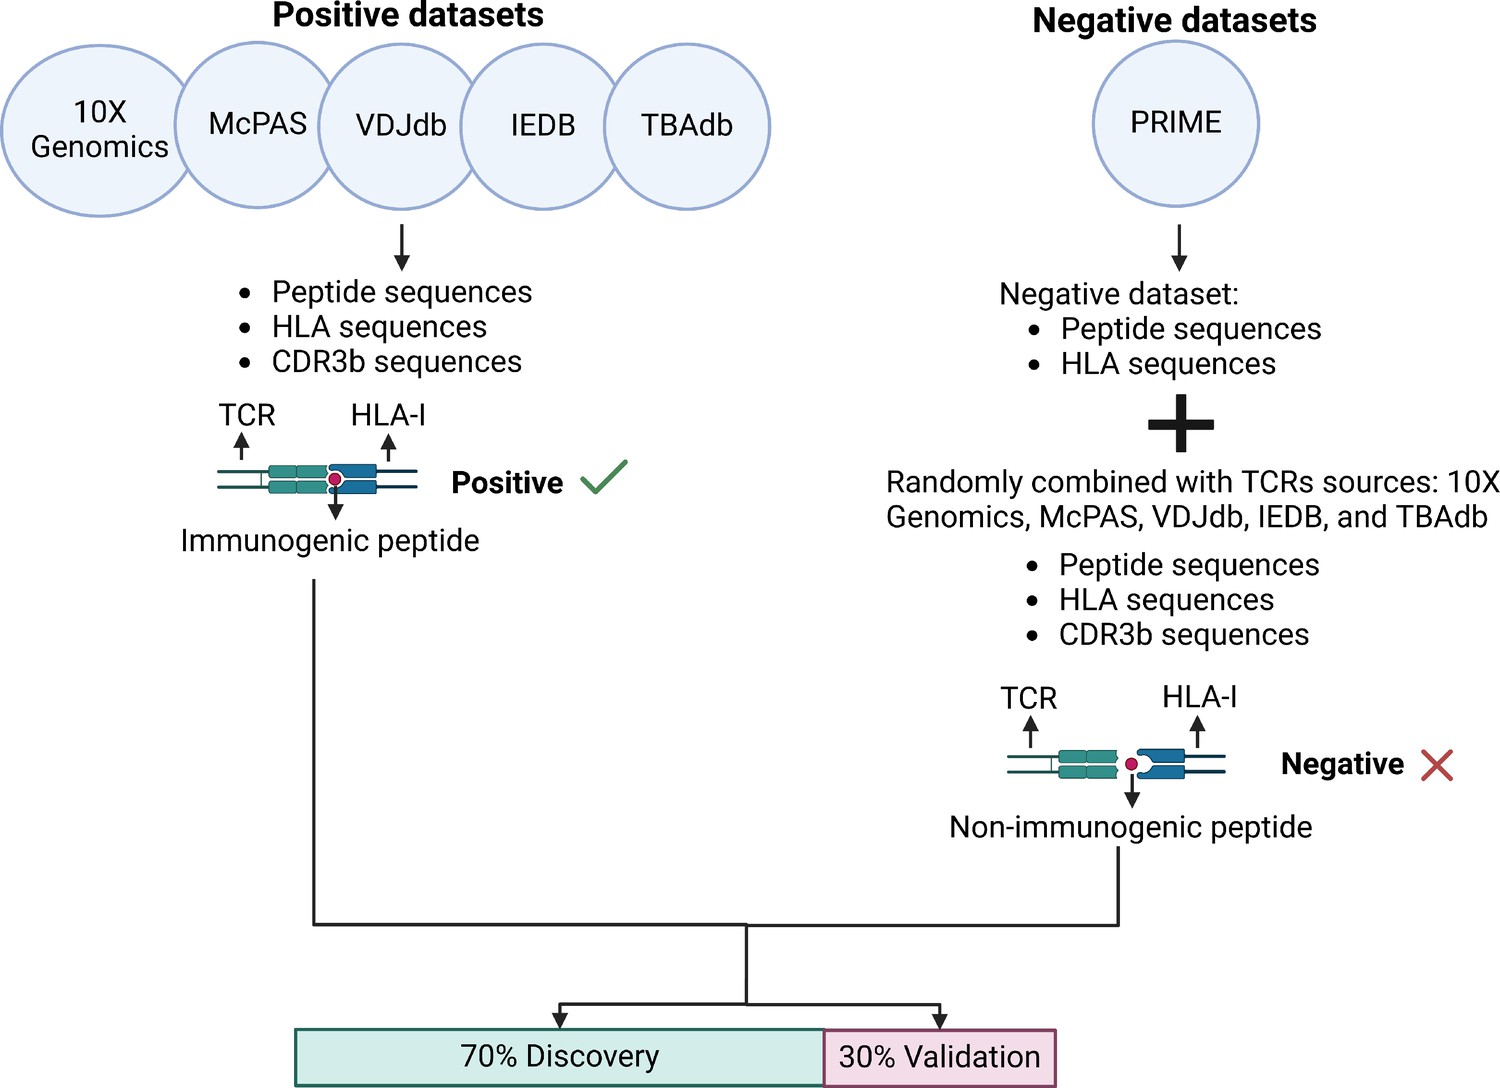
Dataset construction workflow.
Figure 4—figure supplement 2
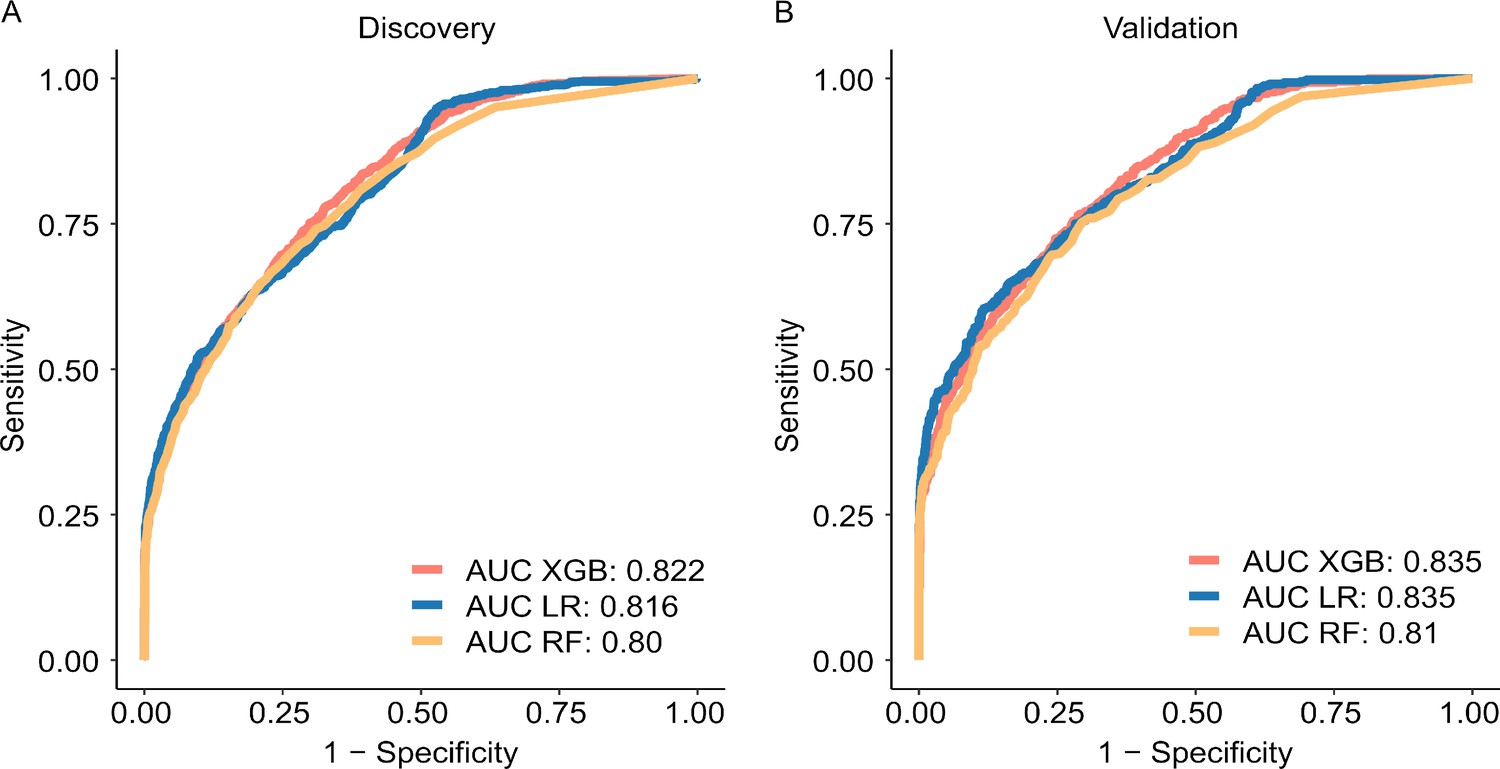
The performance of three machine learning models with three different algorithms is evaluated using receiver operating characteristic (ROC) curves.
The curves depict the performance of the combined model in the discovery cohort (A) and the validation cohort (B).
Figure 5 with 1 supplement
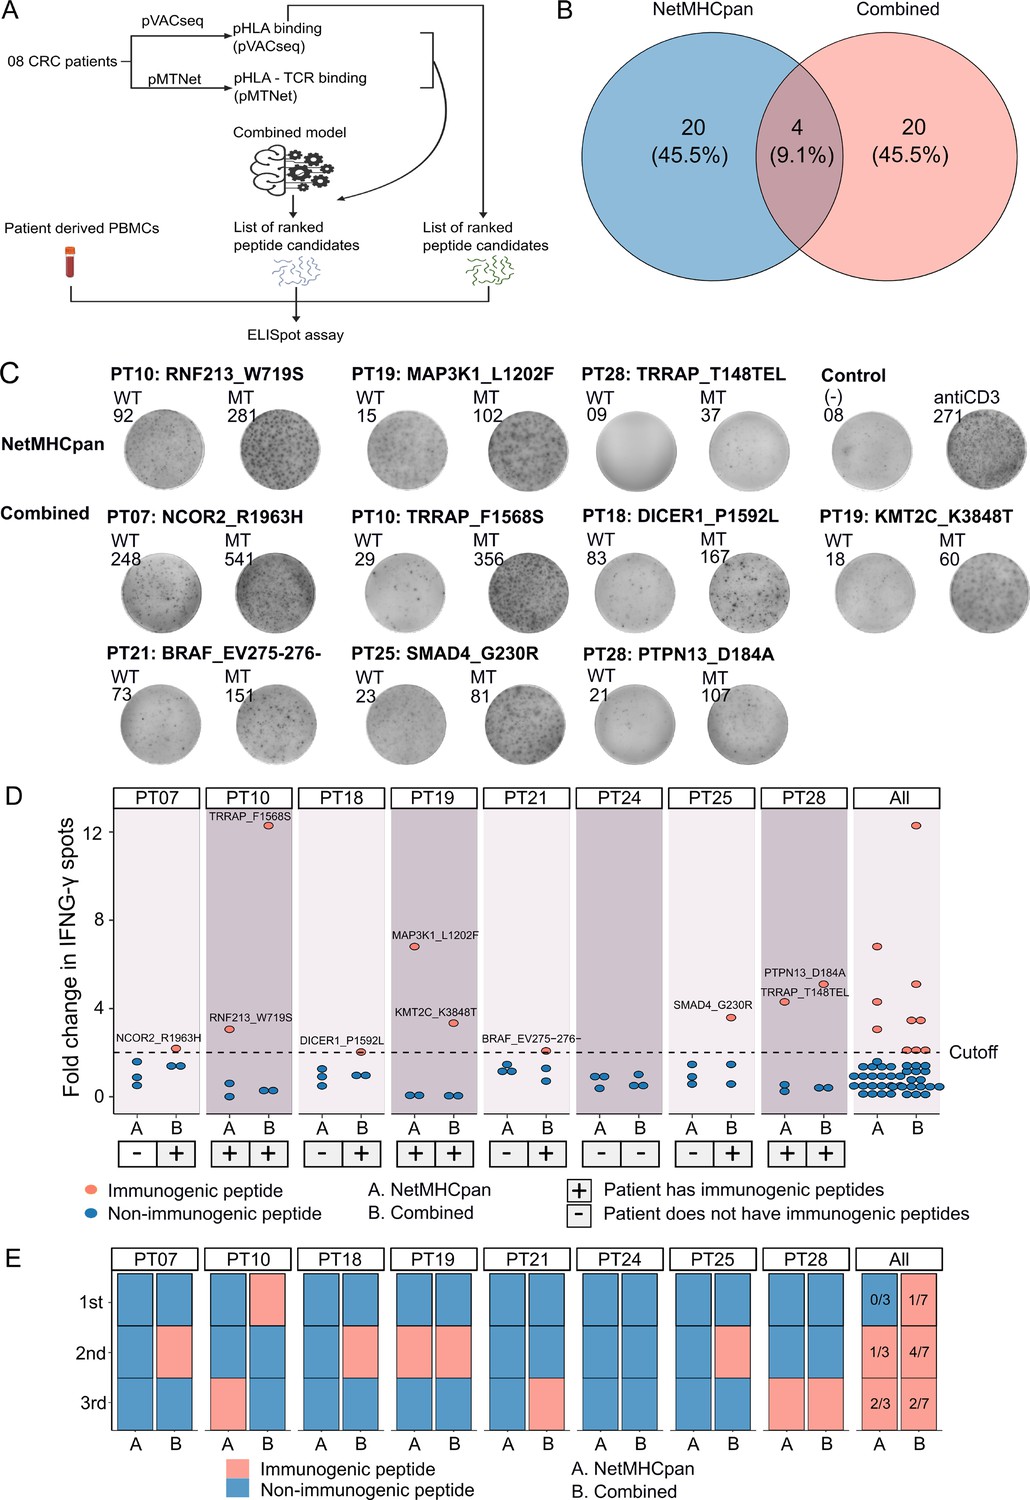
Validation of neoantigens identified in silico from the novel workflow through enzyme-linked immunospot (ELISpot) assays conducted on four colorectal cancer (CRC) patients.
(A) A schematic diagram illustrates the procedural steps of neoantigen prioritization and the ELISpot assay. (B) The count of neoantigens identified from each pipeline. (C) The fold change in IFN-γ spots, relative to the wild-type peptides, is shown for 21 long peptides. Note: Only the mutants that result in a positive value in ELISpot are depicted, along with their corresponding amino acid changes and their associated rankings. (D) ELISpot assays on six long peptides resulting in at least a twofold change in IFN-γ spots. (E) The bar graphs display the ranking of validated long peptides identified from the NetMHCpan tool (blue bar) or the combined method (red bar) for individual patients and all patients.
Figure 5—figure supplement 1
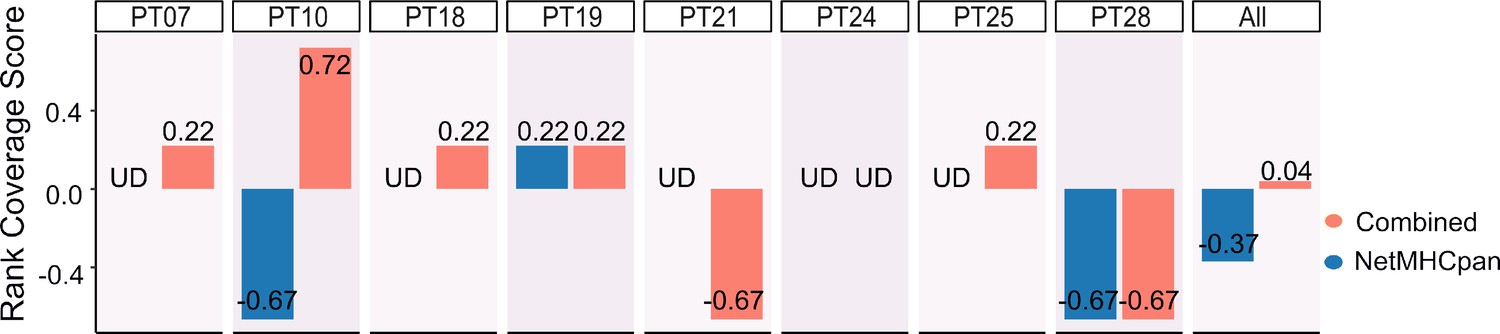
The rank coverage score of the combined model compared to NetMHCpan.
The bar graphs display rank coverage scores of validated long peptides identified by the NetMHCpan tool (blue bars) and the combined method (red bars) for individual patients and all patients collectively.
Additional files
-
Supplementary file 1
Quality metrics of TCRb sequencing.
- https://cdn.elifesciences.org/articles/94658/elife-94658-supp1-v1.xlsx
-
Supplementary file 2
Percentage of unique and expanded T cell receptor (TCR) clones from 28 colorectal cancer (CRC) patients.
- https://cdn.elifesciences.org/articles/94658/elife-94658-supp2-v1.xlsx
-
Supplementary file 3
List of immunogenic peptides and non-immunogenic peptides from public databases.
- https://cdn.elifesciences.org/articles/94658/elife-94658-supp3-v1.xlsx
-
Supplementary file 4
Performance of combined model in an independent dataset.
- https://cdn.elifesciences.org/articles/94658/elife-94658-supp4-v1.xlsx
-
Supplementary file 5
Clinical characteristics of 28 colorectal cancer (CRC) patients.
- https://cdn.elifesciences.org/articles/94658/elife-94658-supp5-v1.xlsx
-
Supplementary file 6
Comparison of human leukocyte antigen (HLA) calling accuracy between Acras-HLA and Optitype.
- https://cdn.elifesciences.org/articles/94658/elife-94658-supp6-v1.xlsx
Download links
A two-part list of links to download the article, or parts of the article, in various formats.
Downloads (link to download the article as PDF)
Open citations (links to open the citations from this article in various online reference manager services)
Cite this article (links to download the citations from this article in formats compatible with various reference manager tools)
The T cell receptor β chain repertoire of tumor infiltrating lymphocytes improves neoantigen prediction and prioritization
eLife 13:RP94658.
https://doi.org/10.7554/eLife.94658.3


