Decoding the complexity of delayed wound healing following Enterococcus faecalis infection
- School of Biological Sciences, Nanyang Technological University, Singapore
- Singapore Centre for Environmental Life Science Engineering, Nanyang Technological University, Singapore
- Department of Microbiology and Molecular Medicine, Faculty of Medicine, University of Geneva, Switzerland
- Mechanobiology Institute, National University of Singapore, Singapore
Figures
Figure 1 with 1 supplement
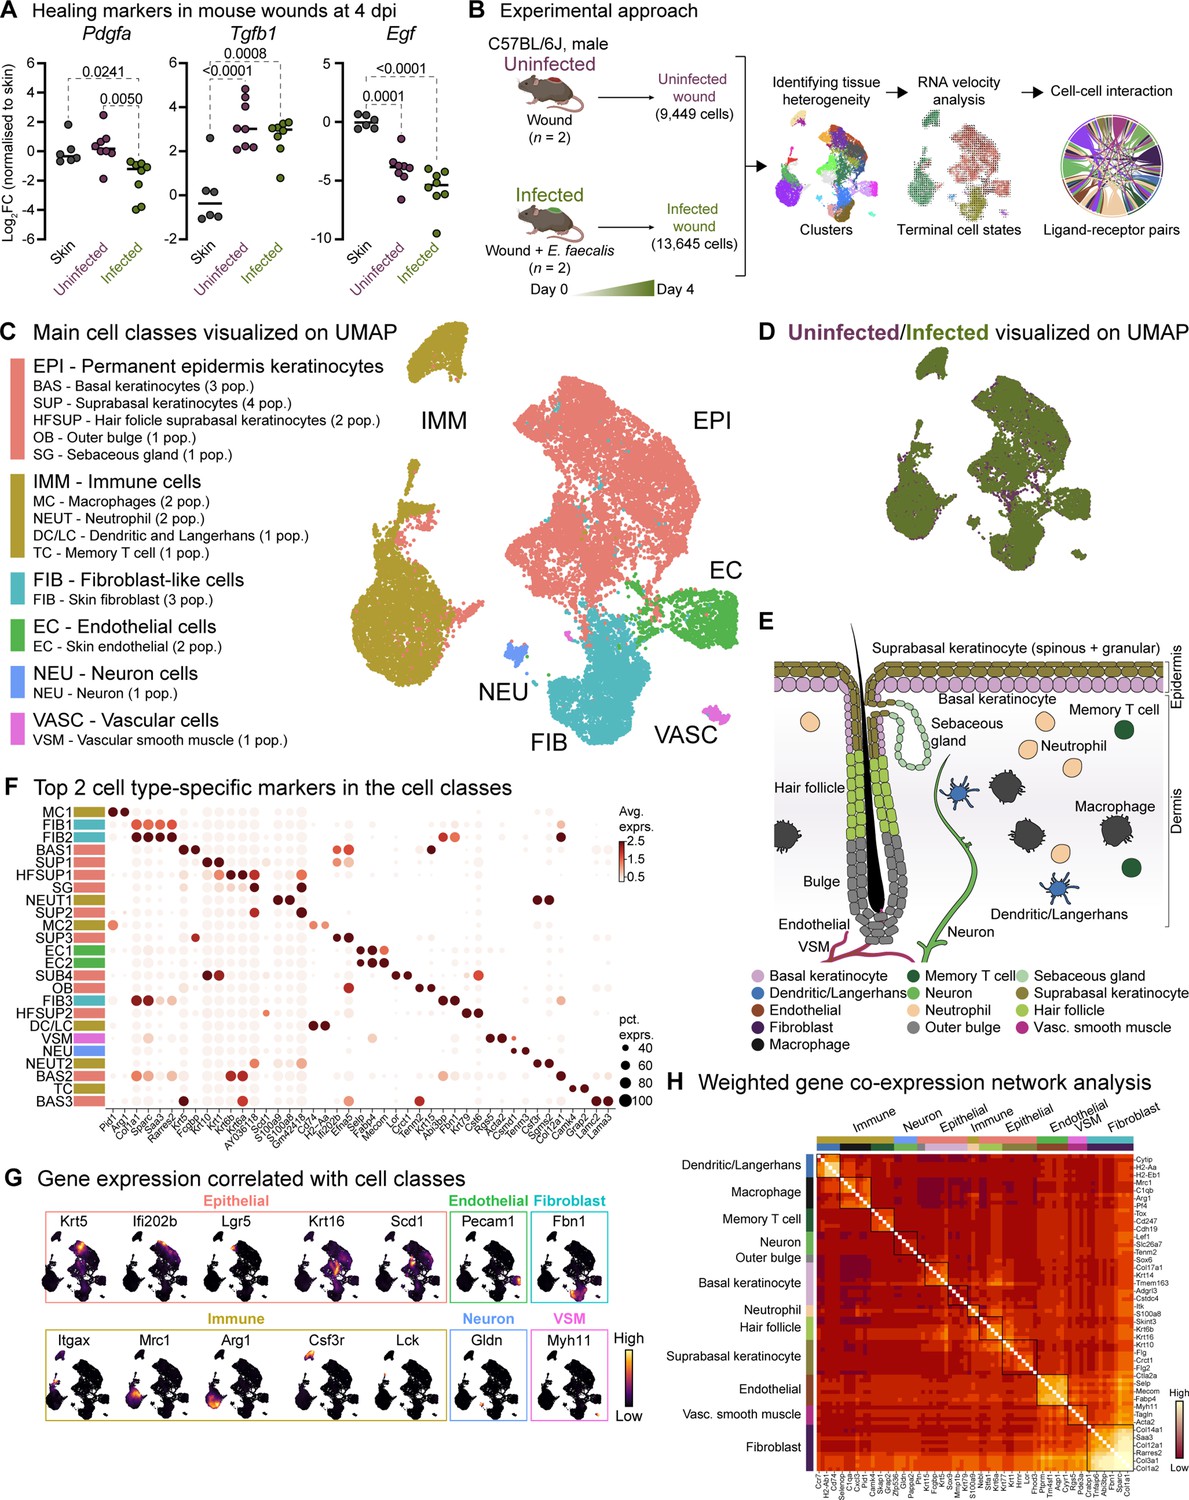
Mouse skin wound infection atlas.
(A) Gene expression of healing markers Pdgfa, Tgfb1, and Egf 4 days post-infection (4 dpi) for uninfected and E. faecalis-infected 6–7 week-old C57BL/6 J mouse skin wounds, normalized to intact skin (n=6 for skin; n=8 for wounds; one-way ANOVA). (B) Single-cell RNA sequencing workflow of full-thickness mouse wounds. (C) Integrated dataset of ~23,000 scRNA-seq libraries from uninfected and infected wounds identifies 5 mega cell classes indicated in the UMAP. (D) UMAP colored by the uninfected and infected conditions. (E) Schematic describing the color-matched cell types with that of the clusters in Figure S1F. (F) Dot plot depicting the top two cell type-specific markers in the integrated data. Legend indicates average expression and dot size represents percent expression. (G) Density plots depict cell types described in C. (H) Heat map of weighted gene co-expression network analysis for annotated cell populations, colored by bars matching mega clusters and annotated cell types in C.
Figure 1—figure supplement 1
Comparison of 4dpi characteristics between uninfected and E. faecalis infected in vivo and scRNA-seq data.
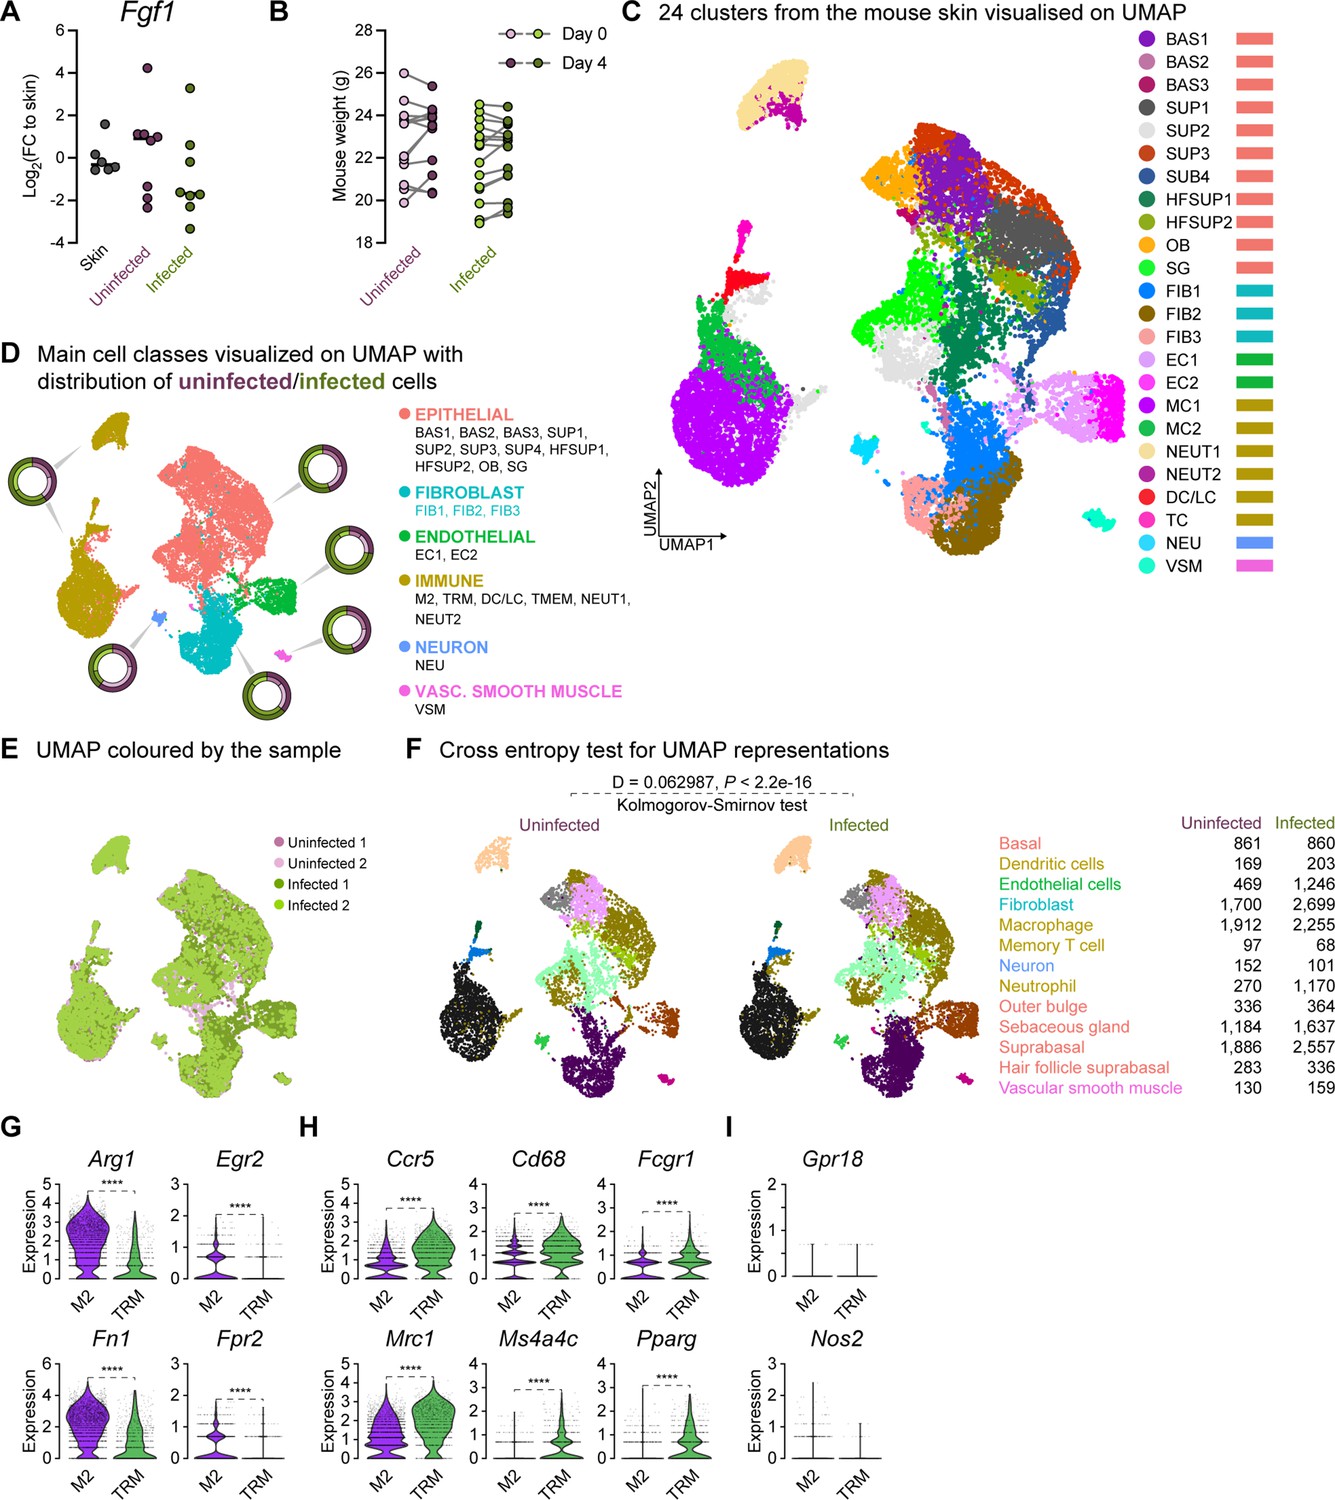
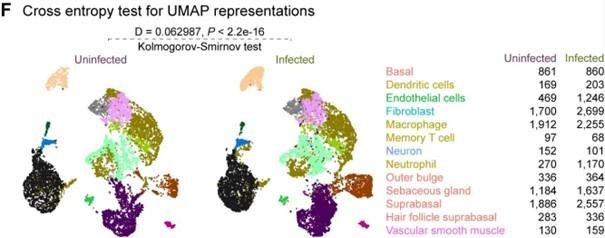
(A) Gene expression of fibroblast growth factor 1 (Fgf1) four days post-infection (4dpi) for uninfected and E. faecalis-infected 6–7 week-old C57BL/6 J mouse skin wounds, normalized to homeostatic skin (n=6 for skin; n=8 for wounds; one-way ANOVA). (B) Weight of mice from wounding (Day 0) until 4 dpi. (C–D) Integrated Louvain clustering of ~23,000 scRNA-seq libraries from uninfected and infected wounds identifies 24 clusters (C) in 5 mega clusters (D), where colored circles show the contribution to the individual clusters for each condition. (E) UMAP colored by the sample, where shades of purple and green represent uninfected and infected conditions, respectively. (F) Cross entropy test for UMAP representations of uninfected and infected single-cell datasets (p-value <2.2 x 10⁻¹⁶, two-sided Kolmogorov-Smirnov test). (G–I) Comparisons of M2-like macrophage polarization (M2) markers Arg1, Egr2, Fn1, and Fpr2 (G), tissue-resident macrophage (TRM) markers Ccr5, Cd68, Fcgr1, Mrc1 (Cd206), Ms4a4c, and Pparg (H), and M1-like macrophage polarization markers Grp18 and Nos2 (iNos) between the two annotated macrophage clusters (I). Wilcoxon Rank Sum test, ****p<0.0001.
Figure 2 with 2 supplements

Sub-clustering of keratinocyte populations reveals infection-specific cell types.
(A) UMAP of integrated keratinocyte (basal, suprabasal, hair follicle, bulge, and sebaceous gland) population reveals 19 clusters. (B) Infected keratinocytes (green) show unique and shared clusters with uninfected keratinocytes (purple). (C) Spatial dispersion of Krt5 and Krt10 abundance in keratinocytes. (D) Expression of Lgr5, Ivl, Lor, and Krt15 in Louvain clusters shown in A. (E) Heat map of top 5 differentially expressed marker genes for each cluster in keratinocytes. Rectangle boxes indicate infection-specific Louvain clusters. (F–G) The bar plots show the top 15 Gene Ontology terms for infection-specific (F) Zeb2hi (cluster 0) and (G) Gjb6hi (cluster 6) keratinocyte populations. (H–I) Dynamic RNA velocity estimation of uninfected (H) and infected (I) keratinocytes. (J) The top lineage driver gene, Rgs1, in infected keratinocytes, was ubiquitously expressed in infection-specific Louvain clusters. (K) Gene expression dynamics resolved along latent time in the top 50 likelihood-ranked genes of infected keratinocytes. The colored bar at the top indicates Louvain clusters in I. Legend describes scaled gene expression. (L) Inferred ligand-receptor pairs outgoing from infected keratinocytes. (M) The hierarchy tree depicts the trajectory of differentiating and terminally differentiated keratinocyte cells originating from basal keratinocytes. Panel M created with BioRender.com, and published using a CC BY-NC-ND license with permission.
© 2024, BioRender Inc. Figure 2 was created using BioRender, and is published under a CC BY-NC-ND 4.0. Further reproductions must adhere to the terms of this license
Figure 2—figure supplement 1
Infection-specific keratinocytes display differential transcriptome.
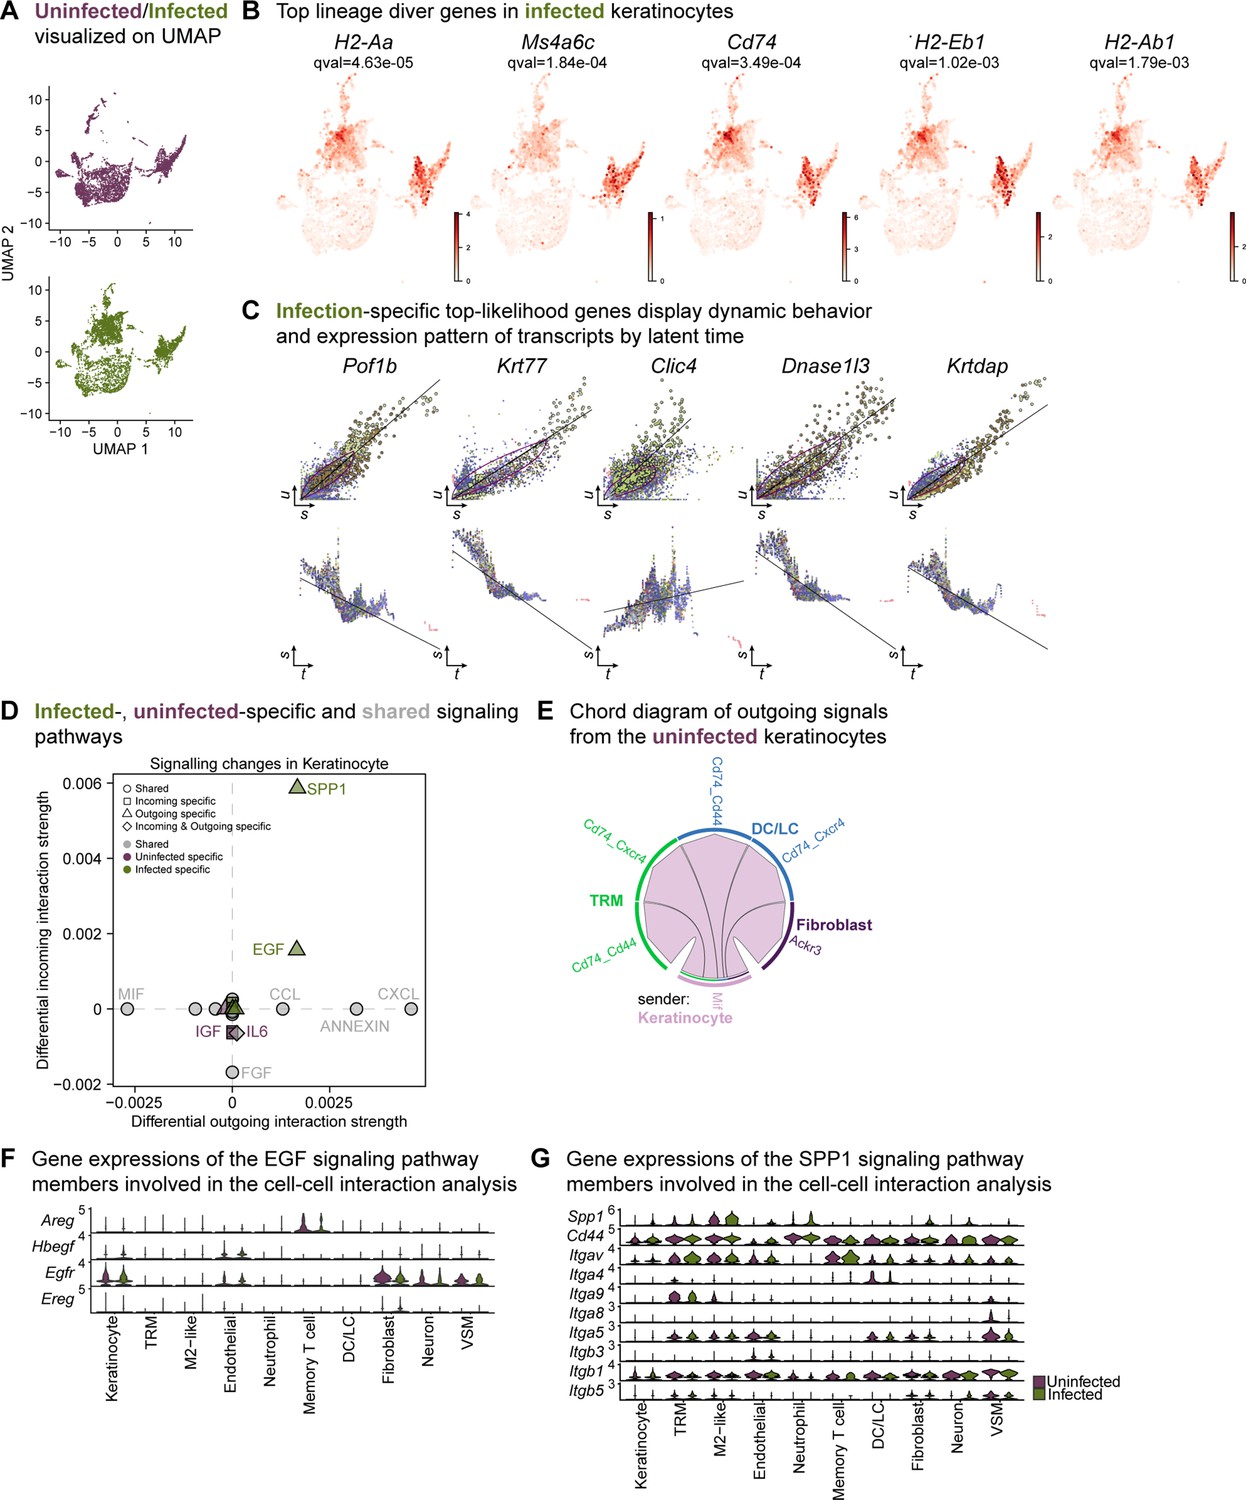
(A) UMAP representations of the extended analysis of keratinocytes from uninfected and infected wounds. (B) The lineage driver genes, H2-Aa, Ms4a6c, Cd74, H2-Eb1, and H2-Ab1 in infected keratinocytes were ubiquitously expressed in infection-specific Louvain clusters. (C) Infection-specific top-likelihood genes display dynamic behavior (top row) and expression pattern of transcripts by latent time (bottom row). Axes denote u for unspliced; s for spliced; t for latent time. (D) Infected- (green), uninfected-specific (purple) and shared (grey) signaling pathways in keratinocytes inferred from CellChat. (E) Chord diagram of outgoing signals from the uninfected keratinocyte population. (F–G) Gene expression of the EGF (F) and SPP1 (G) signaling pathway members involved in the cell-cell interaction analysis.
Figure 2—figure supplement 2
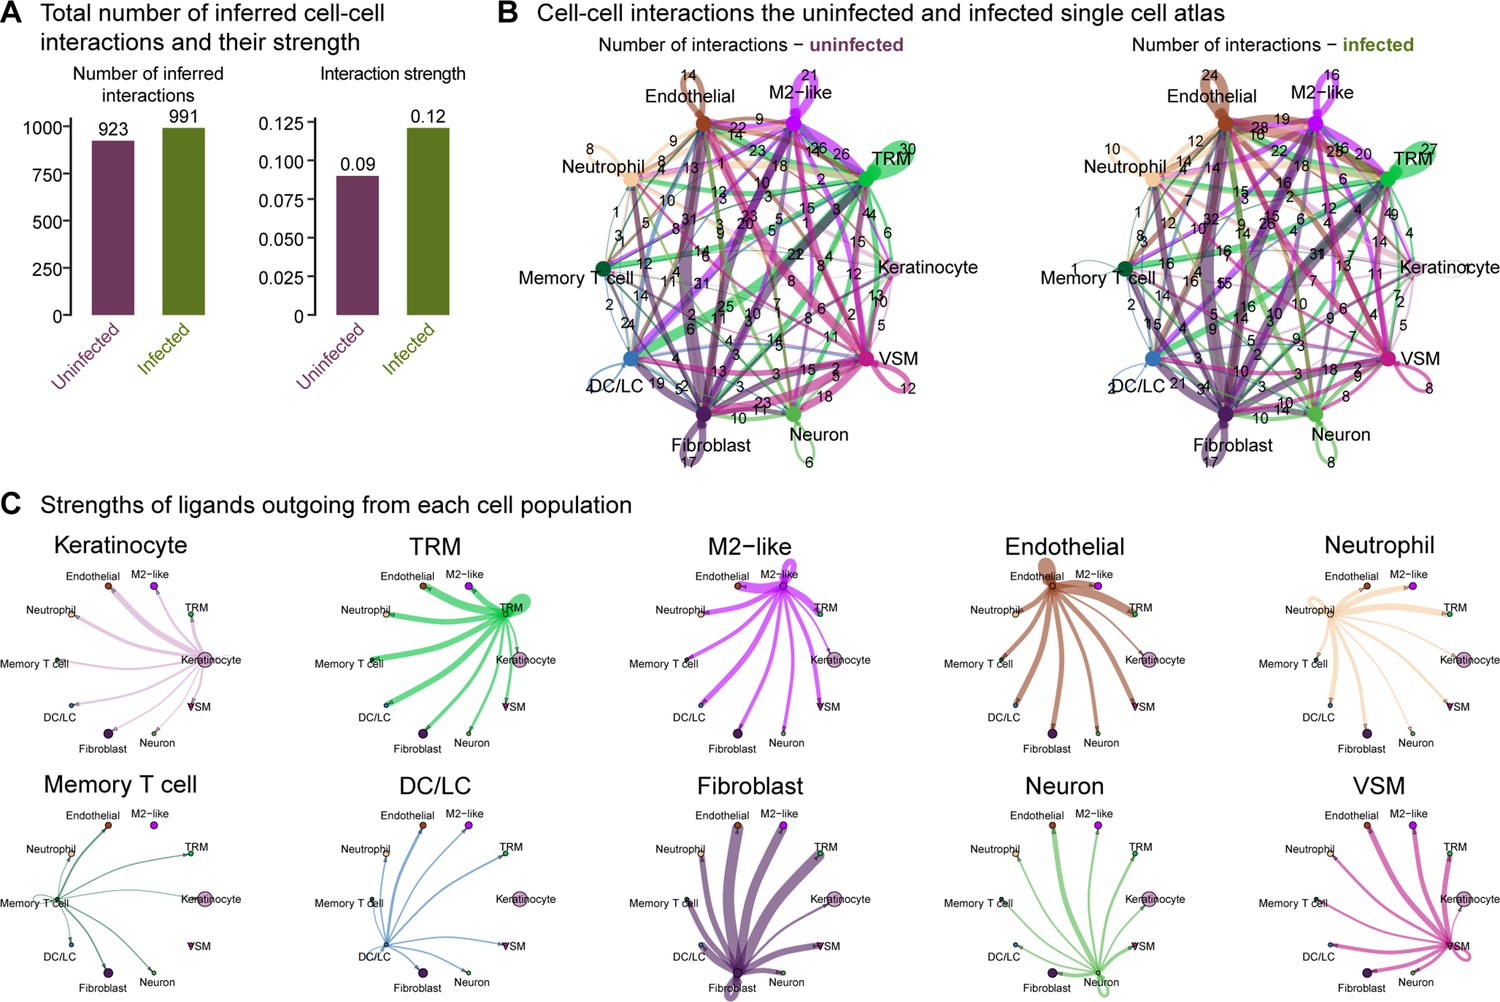
Overall cellular interactome of scRNA-seq atlas.
(A) Total number of inferred cell-cell interactions and their strength computed by CellChat. (B) A map of cell-cell interactions in the uninfected and infected single-cell atlas, indicating the number of interactions outgoing at each node. (C) The strengths of ligands outgoing from each cell population.
Figure 3 with 1 supplement
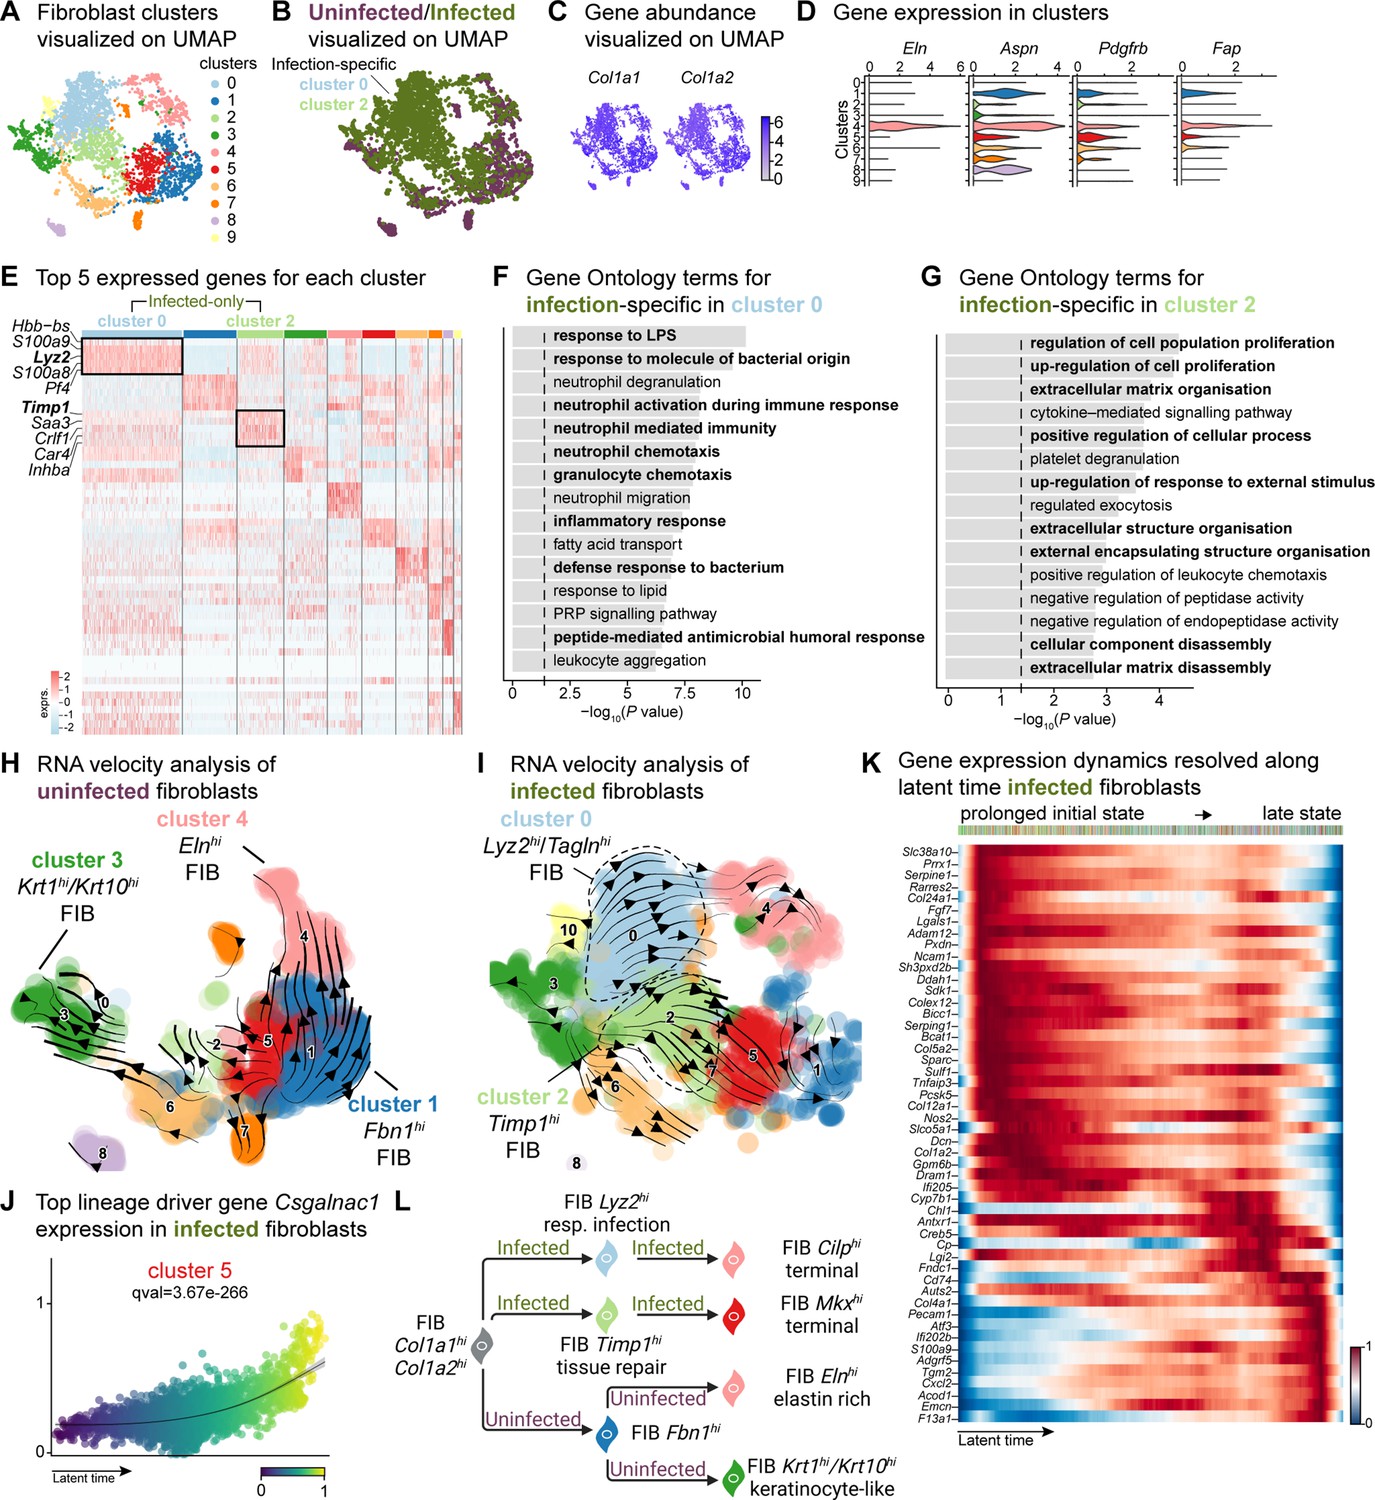
E. faecalis delays immune response in fibroblasts.
(A) UMAP of integrated fibroblasts reveals 12 clusters. (B) Infected fibroblasts (green) show unique and shared clusters with uninfected fibroblasts (purple). (C) Spatial dispersion of Col1a1 and Col1a2 abundance in fibroblasts. (D) Expression of Eln, Aspn, Pdgfrb, and Fap in Louvain clusters shown in A. (E) Heat map of top 5 differentially expressed marker genes for each cluster in fibroblasts. Rectangle boxes indicate infection-specific Louvain clusters. (F–G) The bar plots show the top 15 Gene Ontology terms for infection-specific (F) Lyz2hi/Taglnhi (cluster 0) and (G) Timp1hi (cluster 2) fibroblast populations. (H–I) Dynamic RNA velocity estimation of uninfected (H) and infected (I) fibroblasts. (J) The top lineage driver gene, Csgalnac1, expression in infected fibroblasts. (K) Gene expression dynamics resolved along latent time in the top 50 likelihood-ranked genes of infected fibroblasts. The colored bar at the top indicates Louvain clusters in I. Legend describes scaled gene expression. (L) While uninfected fibroblasts show healing phenotypes, infected fibroblasts undergo two transitioning phases: (i) contractile and (ii) pathologic. Panel L created with BioRender.com, and published using a CC BY-NC-ND license with permission.
© 2024, BioRender Inc. Figure 3 was created using BioRender, and is published under a CC BY-NC-ND 4.0. Further reproductions must adhere to the terms of this license
Figure 3—figure supplement 1
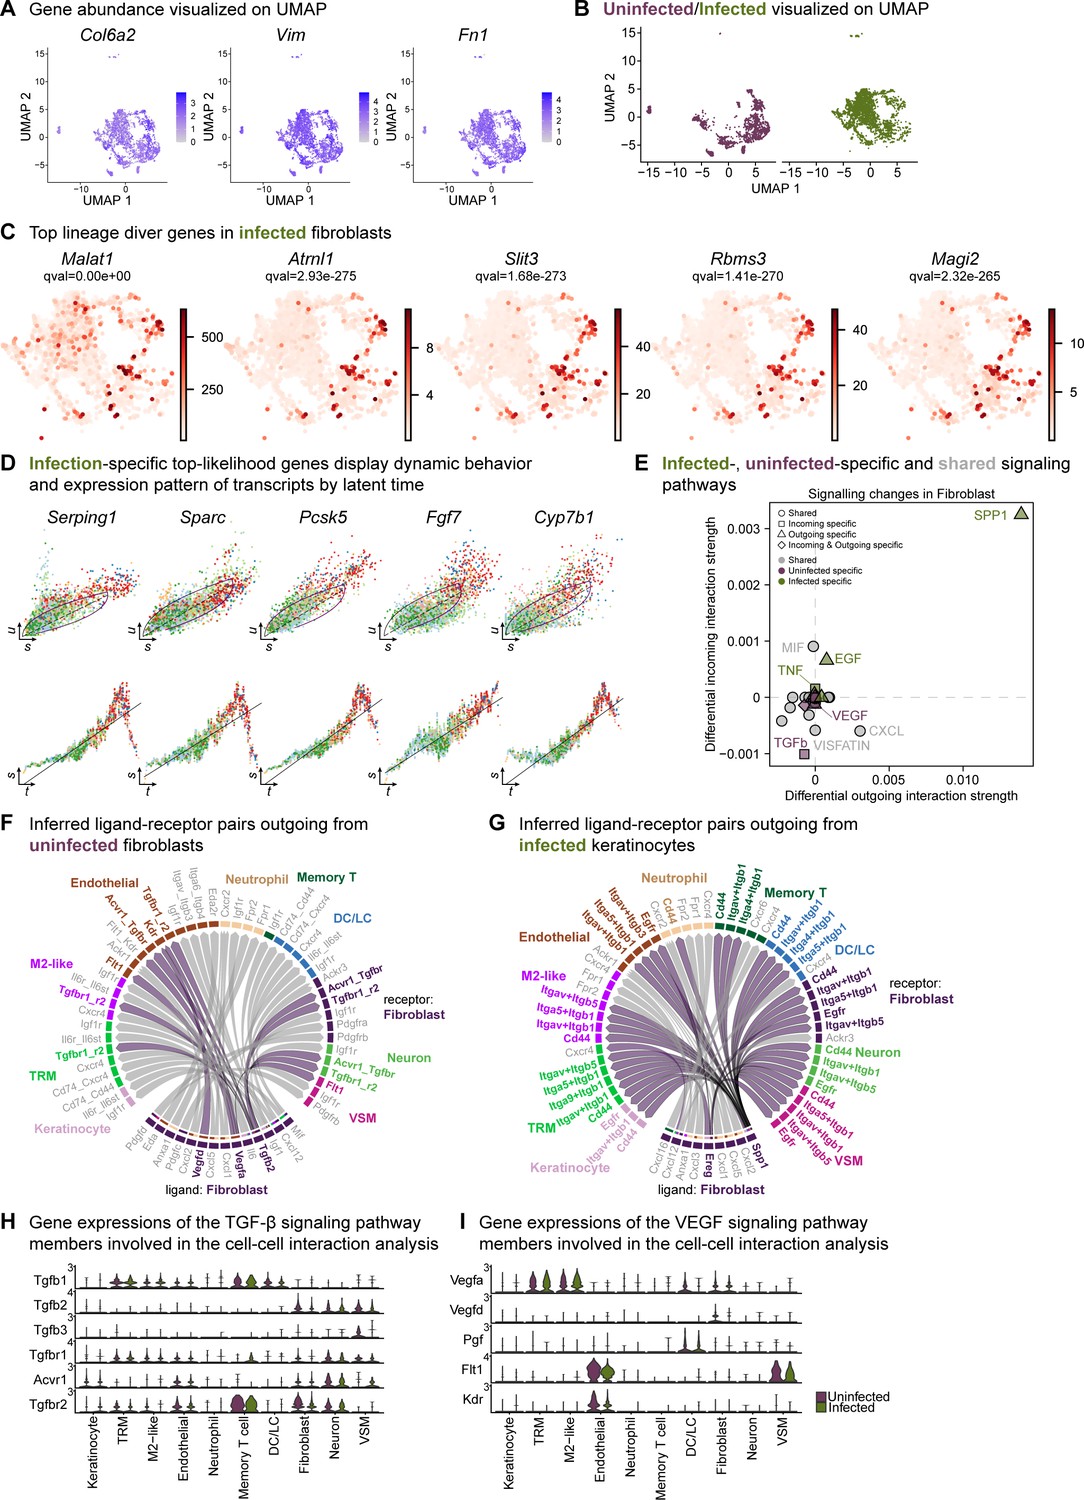
Extended analysis of the fibroblast population reveals unique signatures.
(A) Spatial dispersion of fibroblast markers Col6a2, Vim, and Fn1 in the extended analysis integrated data. (B) Extended analysis of fibroblasts displays infection- and healing-specific clusters. (C) The lineage driver genes Malat1, Atrnl1, Slit3, Rbms3, and Magi2 were predominantly expressed in infected fibroblasts. (D) Infection-specific top-likelihood genes display dynamic behavior (top row) and expression pattern of transcripts by latent time (bottom row). Axes denote u for unspliced; s for spliced; t for latent time. (E) Infected- (green), uninfected-specific (purple) and shared (grey) signaling pathways in fibroblasts inferred from CellChat. (F–G) Chord diagram of ligand-receptor pairs in the uninfected (F) and infected (G) fibroblasts. (I) Inferred ligand-receptor pairs outgoing from infected fibroblasts (H–I) Gene expression of the TGF-β (F) and VEGF (G) signaling pathway members involved in the cell-cell interaction analysis.
Figure 4 with 1 supplement
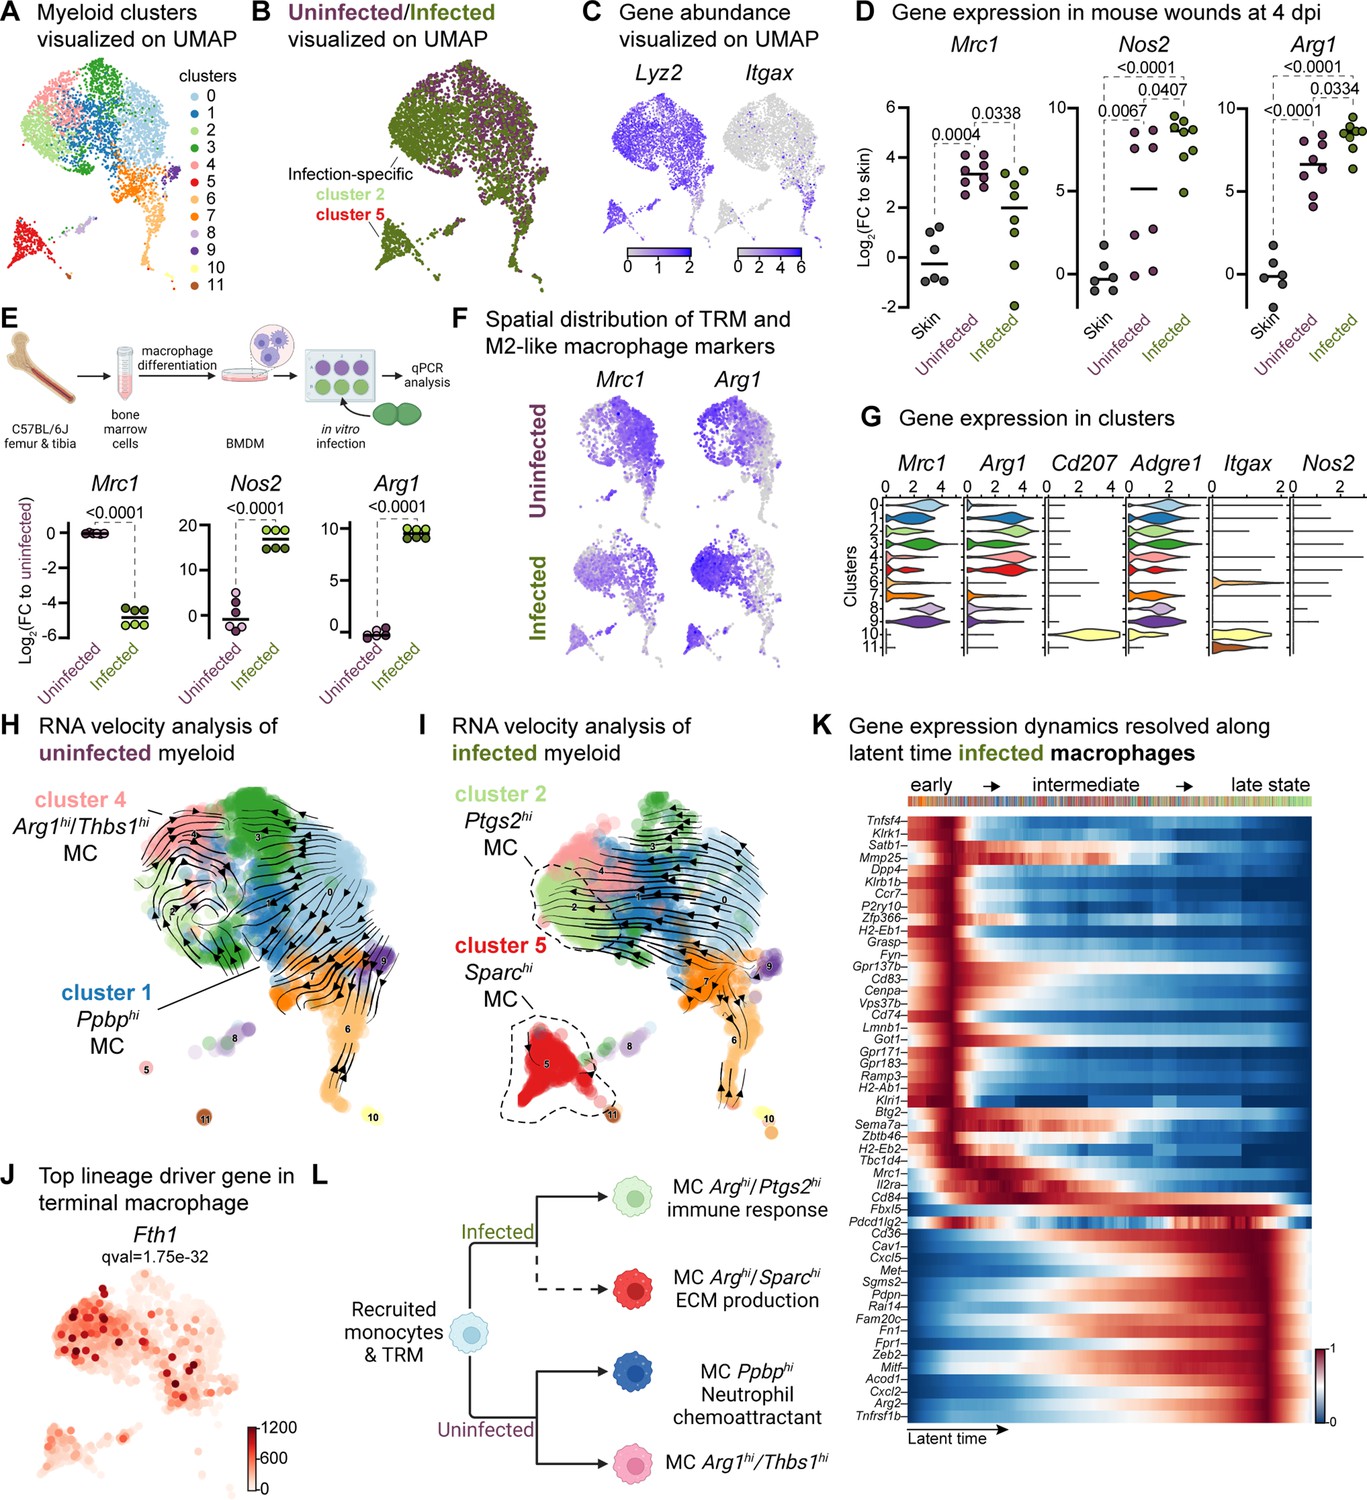
Macrophages display M2-like polarization.
(A) UMAP of the integrated myeloid population reveals nine macrophages, two dendritic cells, and one Langerhans cell cluster. (B) Infected myeloid (green) population show unique and shared clusters with the uninfected myeloid (purple) population. (C) Spatial distribution of Lyz2 (macrophage) and Itgax (DC and LC) abundance in fibroblasts. (D) Gene expression Mrc1, Nos2, and Arg1 in mouse wounds at 4dpi, normalized to homeostatic skin (n=6 for skin; n=8 for wounds; one-way ANOVA). (E) In vitro infection of unpolarized (M0) bone-marrow-derived murine macrophages (BMDMs) resulted in a down-regulation of TRM-associated marker Mrc1 and an upregulation of M2-like markers Nos2 and Arg1. Data are pooled from two biological replicates (shown in light and dark circles, respectively) of three technical replicates each. (F) Spatial distribution of TRM and M2-like macrophage markers, Mrc1 and Arg1, respectively. (G) Expression of Mrc1, Adgre1, Arg1, Itgax, Cd207, and Nos2 in the integrated myeloid dataset. (H–I) Dynamic RNA velocity estimation of uninfected (H) and infected (I) myeloid cells. (J) The top lineage driver gene, Fth1, was ubiquitously expressed in terminal macrophage populations. (K) Putative driver genes of infected macrophages. (L) The proposed model describes macrophage characteristics, where neutrophil-attracting and wound repair-associated macrophages were involved in uninfected wound healing. In contrast, bacteria-infected wounds are enriched in efferocytotic macrophages and matrix-producing macrophages. Panels E and L created with BioRender.com, and published using a CC BY-NC-ND license with permission.
© 2024, BioRender Inc. Figure 4 was created using BioRender, and is published under a CC BY-NC-ND 4.0
Figure 4—figure supplement 1
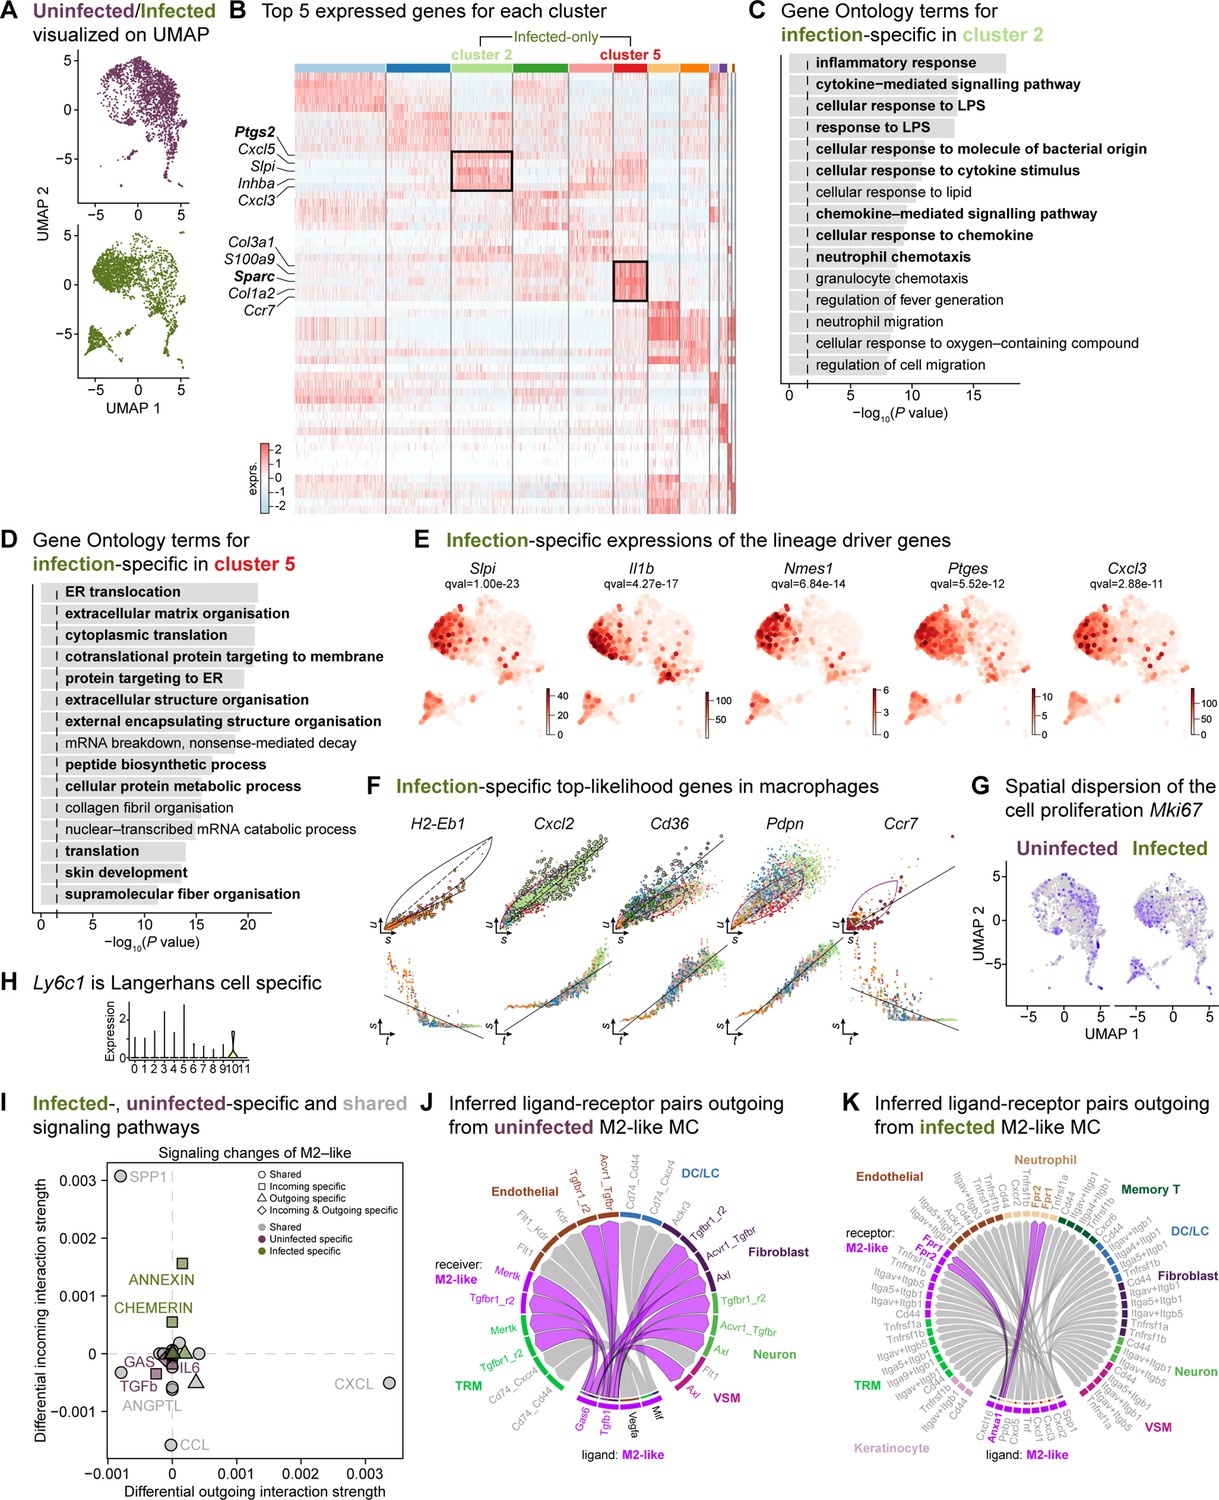
The mega myeloid cell population displays M2-like polarization signatures.
(A) Split UMAP representations of the uninfected and infected myeloid cells. (B) Heat map of top 5 differentially expressed marker genes in macrophages. Rectangle boxes indicate infection-specific Louvain clusters. (C–D) The bar plots show the top 15 Gene Ontology terms for infection-specific Ptgs2+ (cluster 2) (C) and Sparc+ (cluster 5) macrophages (D). (E) Infection-specific expression of the lineage driver genes Slpi, Il1b, AA467197, Ptges, and Cxcl3 indicate delayed inflammation. (F) Infection-specific top-likelihood genes, Cxcl2, Cd36, and Pdpn, were activated, while H2-Eb1 and Ccr7 were consumed in macrophages. (G) Spatial dispersion of the cell proliferation marker (Mki67). (H) Expression of Ly6c1 was Langerhans cell-specific. (I) Infected- (green), uninfected-specific (purple), and shared (grey) signaling pathways in M2-like macrophages. (J) Chord diagram of ligand-receptor pairs in the uninfected M2-like macrophages. (K) Inferred ligand-receptor pairs outgoing from infected M2-like macrophages.
Figure 5 with 1 supplement
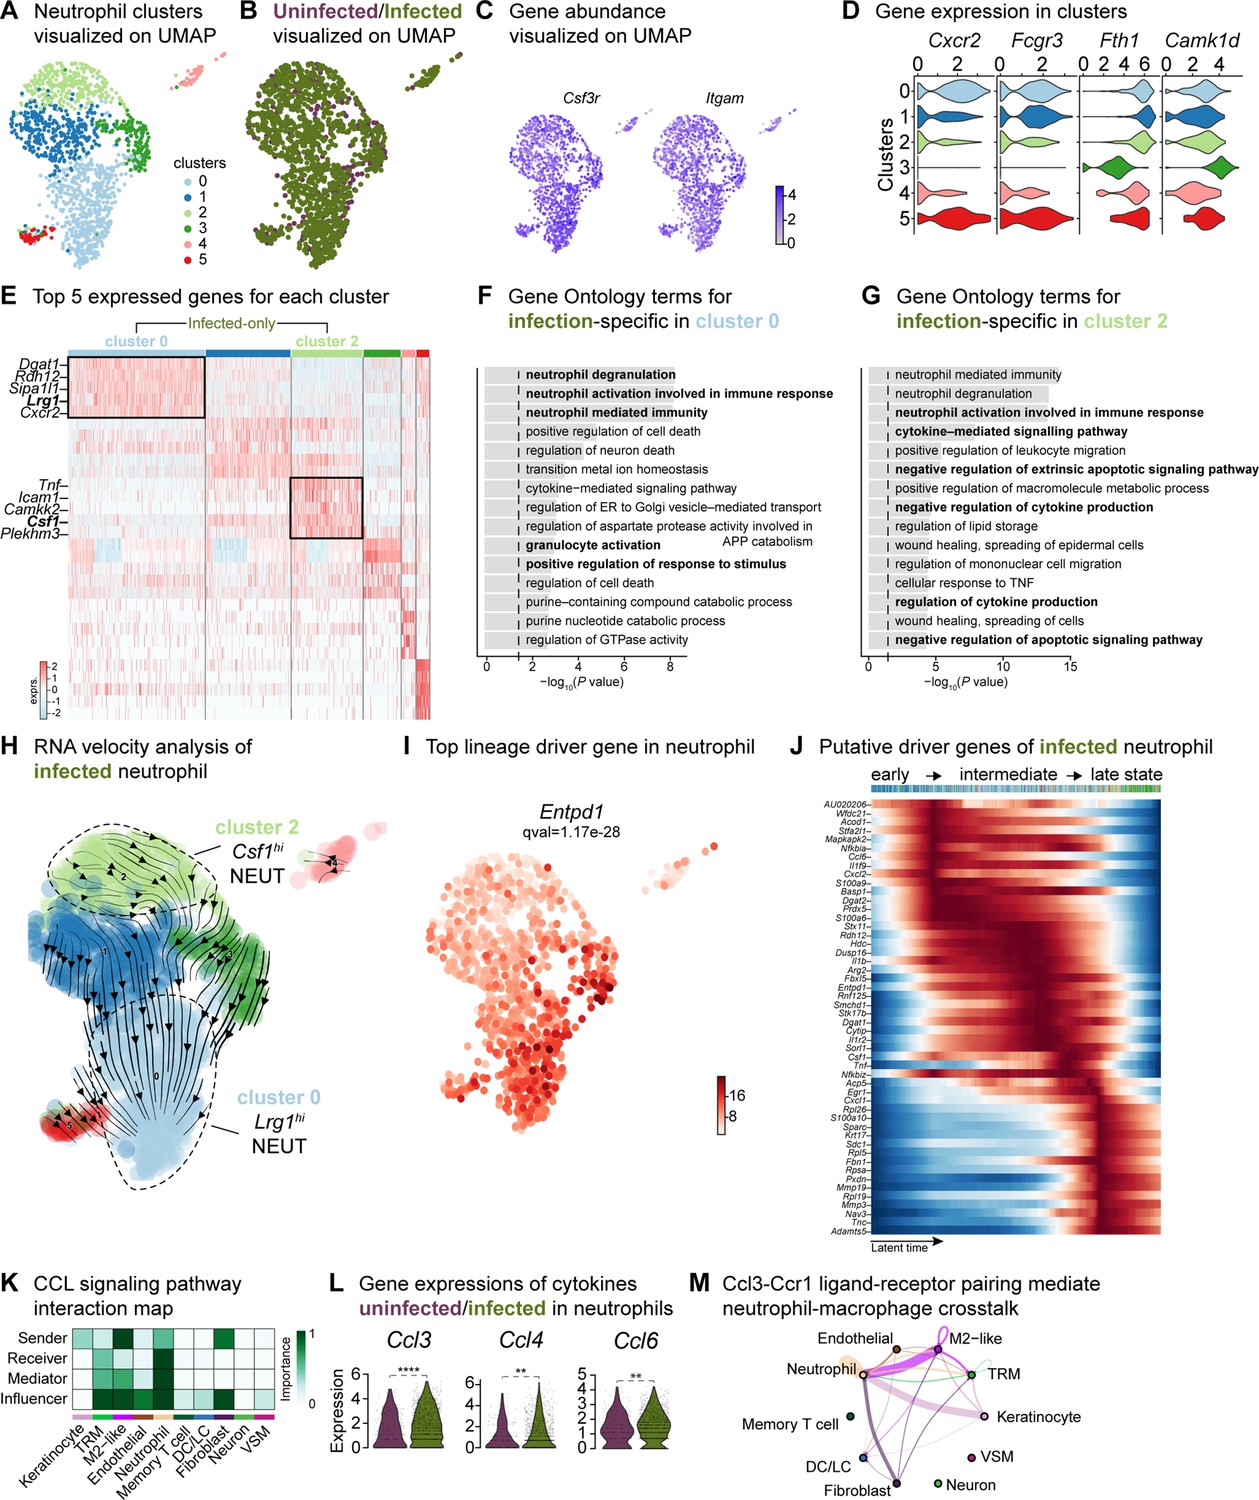
Crosstalk between neutrophils and anti-inflammatory macrophages regulates the CCL signaling pathway.
(A) UMAP of the integrated myeloid population reveals six Louvain clusters. (B) The infected neutrophil (green) population shows unique and shared clusters with the uninfected neutrophil (purple) population. (C) Spatial organization of Csf3r and Itgam abundance in neutrophils. (D) Expression of Cxcr2, Fcgr3, Fth1, and Camk1d in Louvain clusters. (E) Heat map of top 5 differentially expressed marker genes in neutrophils. Rectangle boxes indicate infection-specific Louvain clusters. (F–G) The bar plots show the top 15 Gene Ontology terms for infection-specific (F) Lrg1hi (cluster 0) and (G) Csf1hi (cluster 2) populations. (H) Dynamic RNA velocity estimation of infected neutrophils. (I) The top lineage driver gene, Entpd1, was ubiquitously expressed in Lrg1hi neutrophils (cluster 0). (J) Putative driver genes of infected neutrophil clusters. (K) Cytokine signaling pathway (CCL) cell-cell interaction map. (L) Gene expression of cytokines Ccl3, Ccl4, and Ccl6 in neutrophils. (M) Ccl3:Ccr1 ligand-receptor interaction mediate neutrophil-macrophage crosstalk.
Figure 5—figure supplement 1
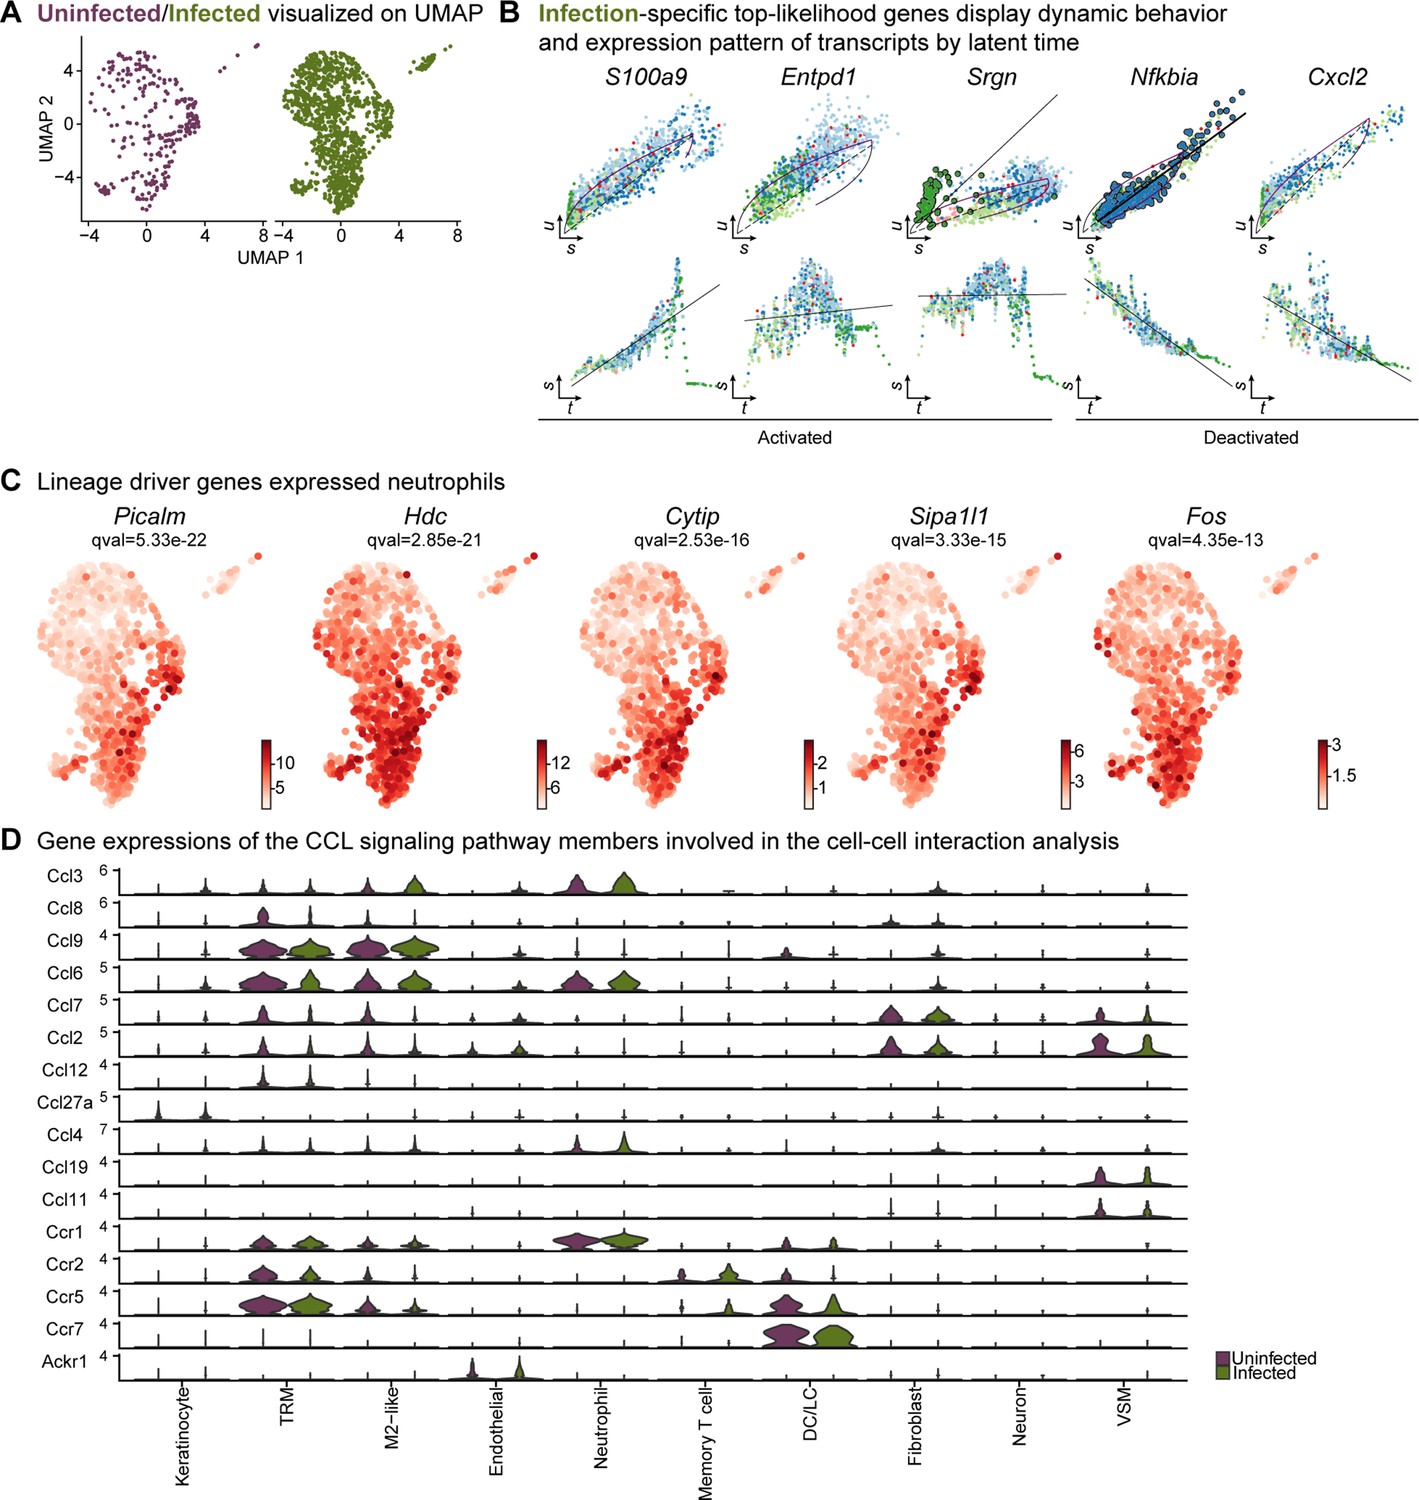
Neutrophil infiltration was enhanced in response to E. faecalis infection.
(A) UMAP representations of the extended analysis of neutrophil populations in each condition. (B) Infection-specific top-likelihood genes display dynamic behavior (top row) and expression pattern of transcripts by latent time (bottom row). (C) Lineage driver genes Picalm, Hdc, Cytip, Sipa1l1, and Fos were highly expressed in Lrg1hi neutrophils. (D) Gene expression of the CCL signaling pathway members involved in the cell-cell interaction analysis.
Figure 6 with 1 supplement
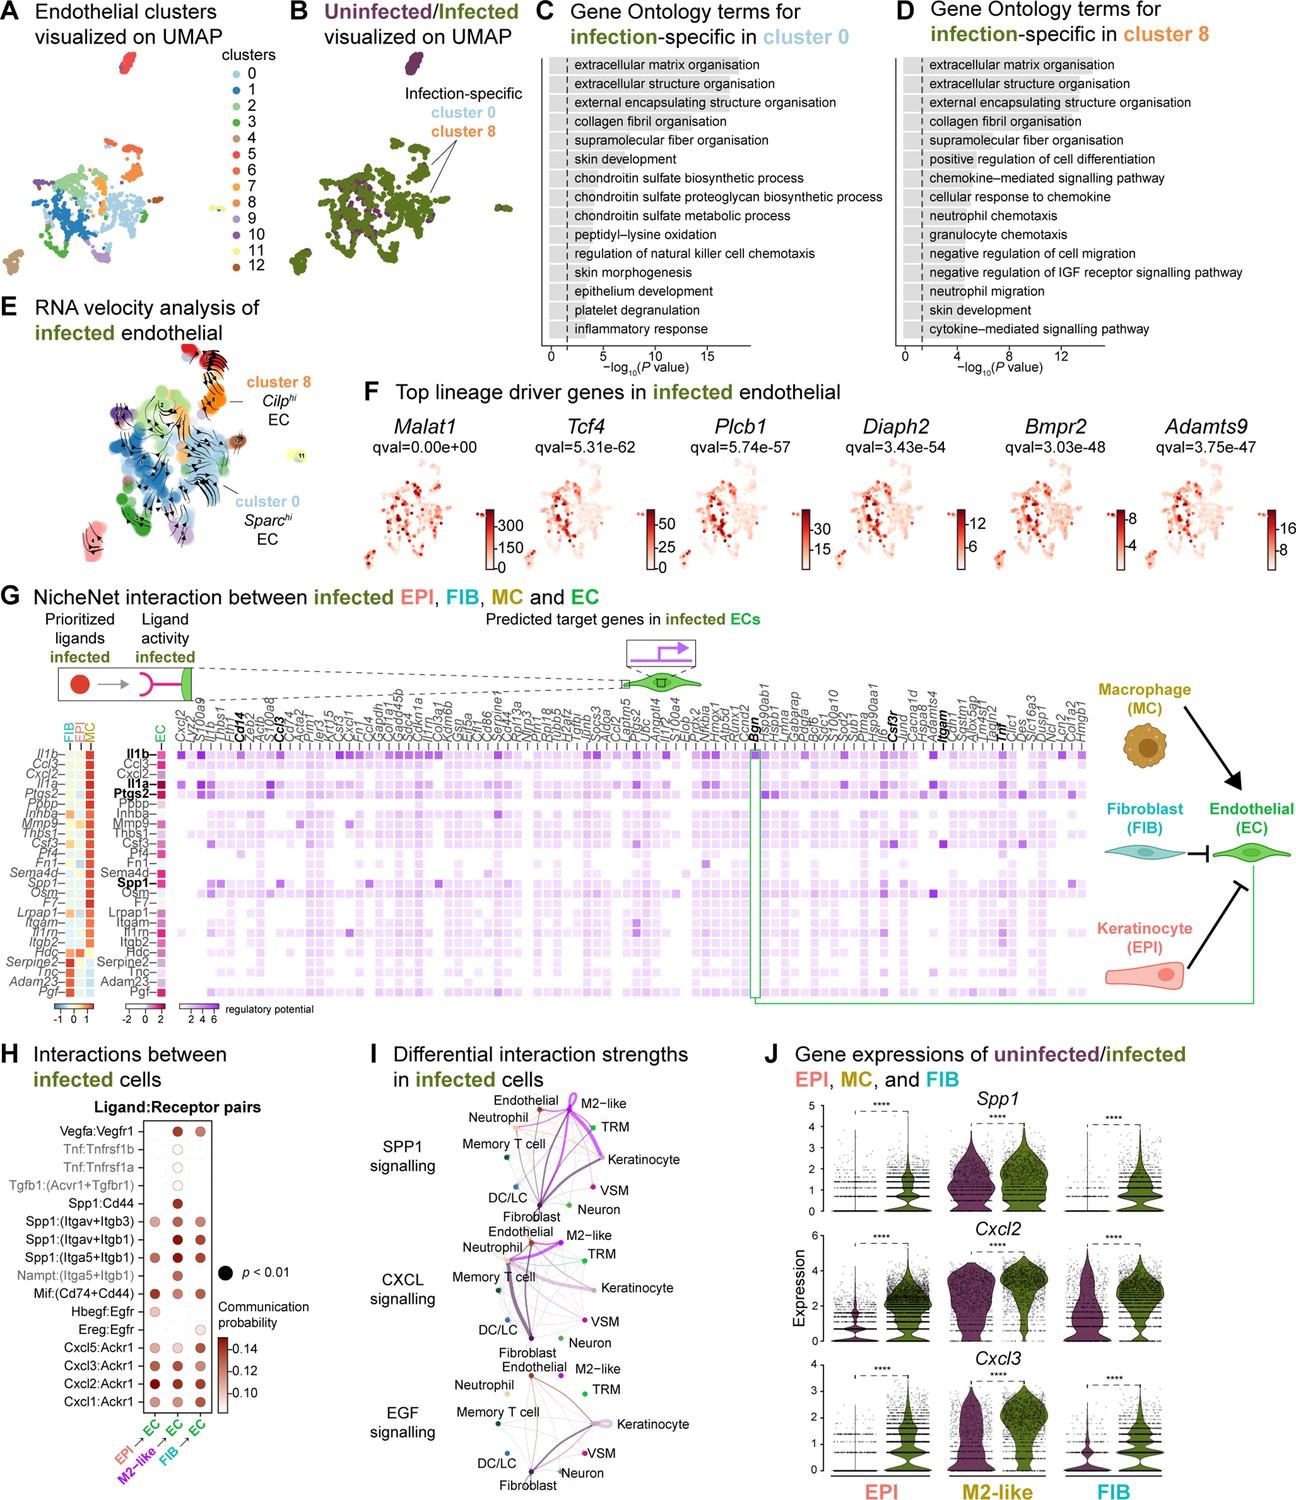
Macrophage-EC interactions display an anti-inflammatory niche.
(A) UMAP of integrated endothelial cells reveals 13 clusters. (B) Infected endothelial cells (green) show unique and shared clusters with uninfected endothelial cells (purple). (C–D) Gene Ontology analysis of infection-specific clusters 0 (C) and 8 (D). (E) Dynamic RNA velocity estimation of infected endothelial cells. (F) The top lineage driver genes, Malat1, Tcf4, Plcb1, Diaph2, Bmpr2, and Adamts9 in infected endothelial cells. (G) NicheNet interaction heat map between keratinocytes, fibroblasts, macrophages, and endothelial cells. Note the macrophage Il1b-specific Bgn induction in infected ECs. (H) The dot plot depicts interactions between endothelial cells (receptors) and keratinocytes, fibroblasts, and macrophages (ligands). Rows demonstrate a ligand-receptor pair for the indicated cell-cell interactions (column). (I) Differential interaction strengths of a cellular interactome for TNF, SPP1, and CXCL signaling pathways between all cell types in infection. (J) Spp1, Cxcl2, and Cxcl3 gene expression in keratinocytes, M2-like macrophages, and fibroblasts (Wilcoxon Rank Sum test, ****p<0.0001).
Figure 6—figure supplement 1
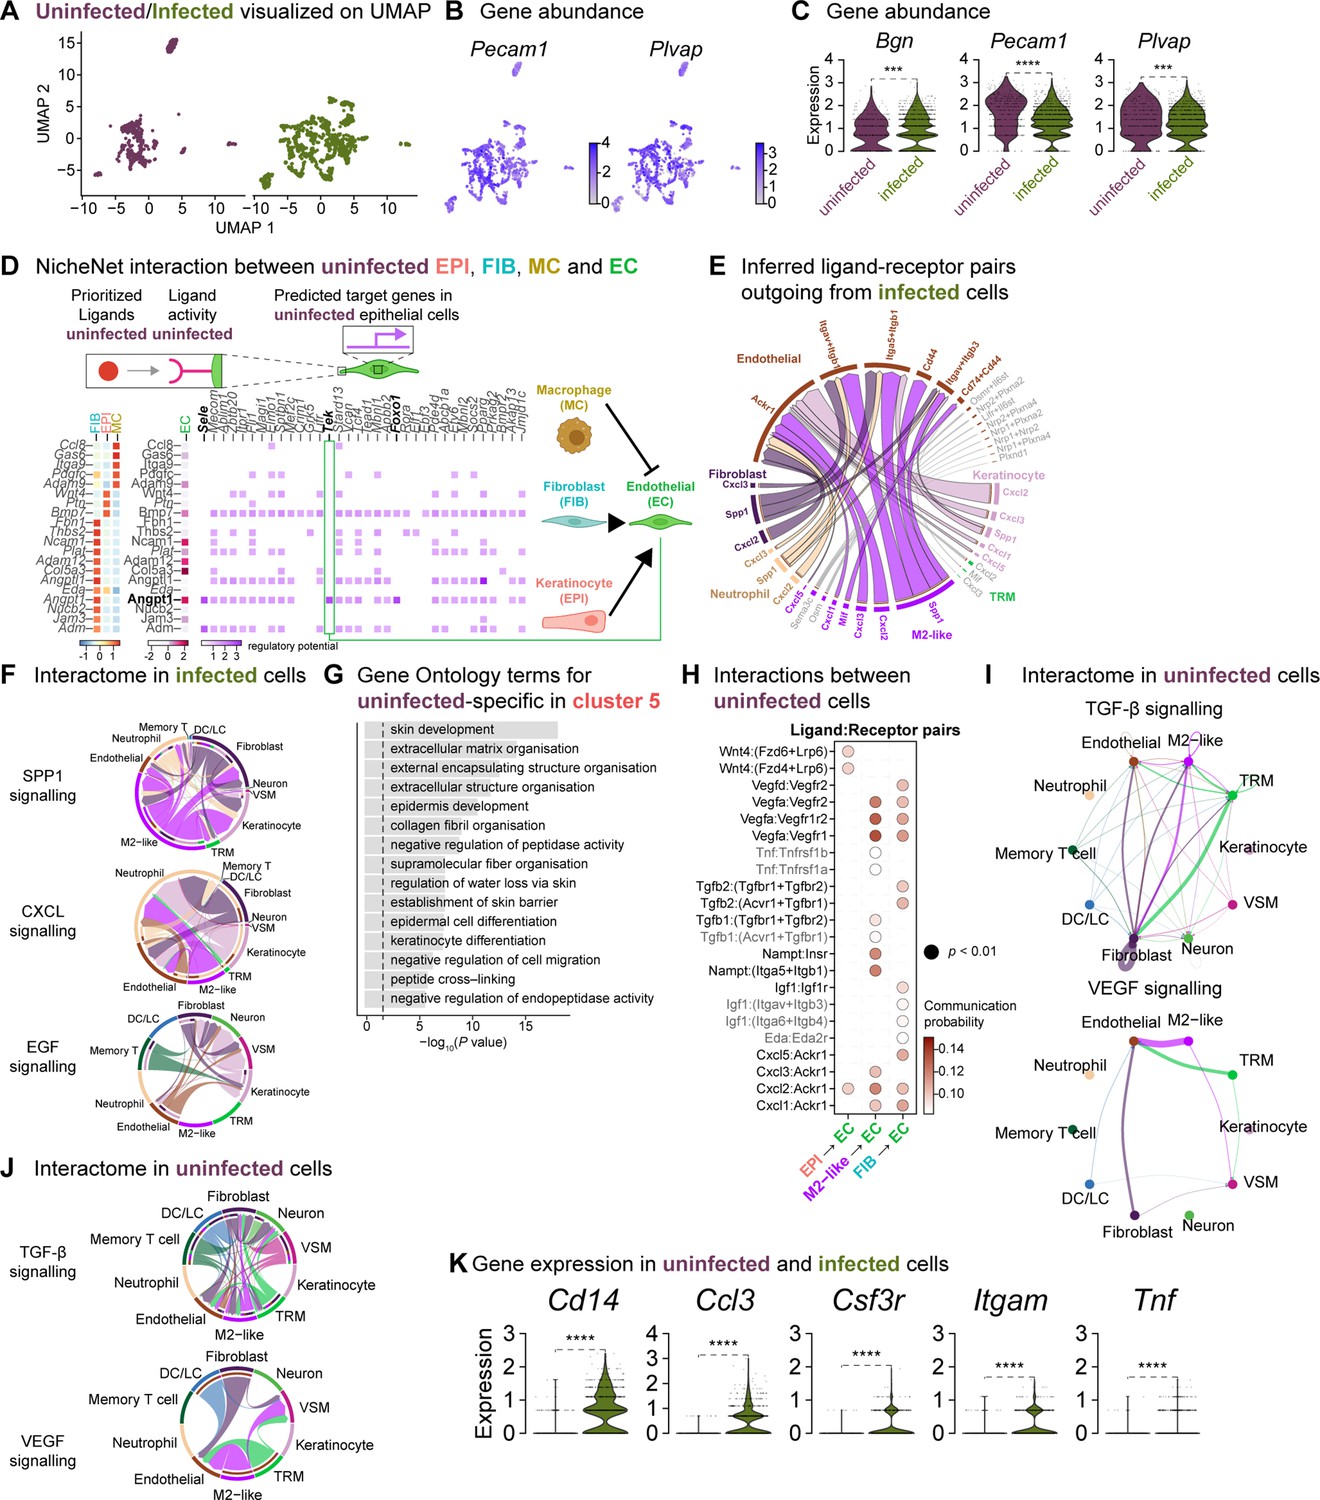
Fibroblasts orchestrate a reparative niche in the uninfected wounds.
(A) UMAP representations of the uninfected and infected endothelial subsets. (B) Spatial dispersion of endothelial cell signatures Pecam1 and Plvap. (C) Expressions of Bgn, Pecam1, and Plvap in endothelial cells (Wilcoxon Rank Sum test, **** p<0.0001, *** p<0.001). (D) NicheNet interaction heat map between keratinocytes, fibroblasts, macrophages, and endothelial cells. Note the specific pairing of the fibroblast ligand angiopoietin 1 (Angpt1) with the TEK tyrosine receptor (Tek) in the uninfected niche. (E) Chord diagram of the cellular interactome between keratinocytes, fibroblasts, macrophages, and endothelial cells from infected populations. (F) Chord diagrams of the cellular interactome for TNF, SPP1, and CXCL signaling pathways across all cell types in infection. (G) Gene Ontology analysis of the uninfected specific ECs. (H) Dot plot of ligand:receptor pairs in the healing niche. (I) Differential interaction strengths of the cellular interactome for TGF-β and VEGF signaling pathways in the unwounded niche. (J) Chord diagrams of the cellular interactome for TGF-β and VEGF signaling pathways in the uninfected niche. (K) Infection-specific expression of Cd14, Ccl3, Csf3r, Itgam, and Tnf in endothelial cells (Wilcoxon Rank Sum test, **** p<0.0001).
Author response image 1
Tables
Key resources table
| Reagent type (species) or resource | Designation | Source or reference | Identifiers | Additional information |
|---|---|---|---|---|
| Strain, strain background (Enterococcus faecalis) | OG1RF | Dunny et al., 1978 | Enterococcus faecalis OG1RF | |
| Strain, strain background (Mus musculus) | Mouse C57BL/6 | InVivos | n/a | |
| Peptide, recombinant protein | Bovine serum albumin | Merck | A7030 | |
| Peptide, recombinant protein | Collagenase type I | Thermo Fisher Scientific | 17100017 | |
| Peptide, recombinant protein | Dispase II | Thermo Fisher Scientific | 17105041 | |
| Peptide, recombinant protein | Liberase TM | Merck | 5401119001 | |
| Peptide, recombinant protein | Recombinant Mouse M-CSF | BioLegend | 576404 | |
| Chemical compound, drug | Isoflurane | Vetpharma Animal Health | NA | |
| Chemical compound, drug | Nair Moisturising Hair Removal Cream | Chruch and Dwight Co | NA | |
| Commercial assay, kit | Chromium Next GEM Chip G Single Cell Kit | 10 x Genomics | 1000127 | |
| Commercial assay, kit | Chromium Next GEM Single Cell 3' Gel Bead Kit v3.1 | 10 x Genomics | 1000129 | |
| Commercial assay, kit | Chromium Next GEM Single Cell 3' GEM Kit v3.1 | 10 x Genomics | 1000130 | |
| Commercial assay, kit | Chromium Next GEM Single Cell 3' Kit v3.1 | 10 x Genomics | 1000269 | |
| Commercial assay, kit | Dual Index Kit TT Set A | 10 x Genomics | 1000215 | |
| Commercial assay, kit | EZ-10 DNAaway RNA Mini-Preps kit | Bio Basic | BS88136-250 | |
| Commercial assay, kit | Library Construction Kit | 10 x Genomics | 1000196 | |
| Commercial assay, kit | Luna SYBR Green | New England Biolabs | M3003 | |
| Commercial assay, kit | RevertAid Reverse Transcriptase | Thermo Fisher | 01327685 | |
| Commercial assay, kit | Tube, Dynabeads MyOne SILANE | 10 x Genomics | 2000048 | |
| Software, algorithm | anndata 0.8.0 | PyPI | https://pypi.org | |
| Software, algorithm | BioRender | https://biorender.com | n/a | |
| Software, algorithm | CellChat 1.6.1 | Jin et al., 2021 | ||
| Software, algorithm | cellrank 1.5.1 | Lange et al., 2022 | ||
| Software, algorithm | Cell Ranger 6.1.2 | 10 X Genomics, Inc. | https://www.10xgenomics.com | |
| Software, algorithm | clustree 0.5.0 | Zappia and Oshlack, 2018 | ||
| Software, algorithm | glmGamPoi 1.8.0 | Ahlmann-Eltze and Huber, 2021 | ||
| Software, algorithm | miQC 1.4.0 | GitHub; Greene Laboratory, 2022 | https://github.com/greenelab/miQC | |
| Software, algorithm | NicheNet | Browaeys et al., 2020 | ||
| Software, algorithm | numpy 1.23.5 | PyPI | https://pypi.org | |
| Software, algorithm | pandas 1.5.3 | PyPI | https://pypi.org | |
| Software, algorithm | PanglaoDB | PanglaoDB | https://panglaodb.se/markers.html | |
| Software, algorithm | Prism 9.4.1 | GraphPad Software | https://www.graphpad.com | |
| Software, algorithm | PyCharm 2022.3.3 | JetBrains | https://www.jetbrains.com | |
| Software, algorithm | Python 3.9.16 | Python Software Foundation | https://python.org | |
| Software, algorithm | R 4.2.1 | The R Foundation | https://www.r-project.org | |
| Software, algorithm | RStudio 2022.07.2+576 | Posit Software | https://posit.co | |
| Software, algorithm | samtools 1.13 | GitHub; Ohan and samtools, 2021 | https://github.com/samtools | |
| Software, algorithm | scanpy 1.9.1 | PyPI | https://pypi.org | |
| Software, algorithm | scipy 1.10.0 | PyPI | https://pypi.org | |
| Software, algorithm | scDblFinder 1.10.0 | Germain et al., 2021 | ||
| Software, algorithm | sctransform 0.3.5 | Choudhary and Satija, 2022 | ||
| Software, algorithm | scvelo 0.2.5 | Bergen et al., 2020 | ||
| Software, algorithm | Seurat 4.3.0 | Hao et al., 2021 | ||
| Software, algorithm | UMAP | McInnes et al., 2018; McInnes, 2024 | https://github.com/lmcinnes/umap | |
| Software, algorithm | velocyto.py 0.17.17 | La Manno et al., 2018 | ||
| Software, algorithm | WGCNA 1.72–1 | Langfelder and Horvath, 2008 |
Author response table 1
| Uninfected | Infected | |
|---|---|---|
| Basal | 861 | 860 |
| Dendritic cells | 169 | 203 |
| Endothelial cells | 469 | 1,246 |
| Fibroblast | 1,700 | 2,699 |
| Macrophage | 1,912 | 2,255 |
| Memory T cell | 97 | 68 |
| Neuron | 152 | 101 |
| Neutrophil | 270 | 1,170 |
| Outer bulge | 336 | 364 |
| Sebaceous gland | 1,184 | 1,637 |
| Suprabasal | 1,886 | 2,557 |
| Hair follicle suprabasal | 283 | 336 |
| Vascular smooth muscle | 130 _ | 159 _ |
Additional files
-
Supplementary file 1
Number of cells in each Louvain cluster grouped by condition.
Related to Figure 1.
- https://cdn.elifesciences.org/articles/95113/elife-95113-supp1-v1.xlsx
-
Supplementary file 2
Differential expression table of genes for the main class clusters.
Related to Figure 1C.
- https://cdn.elifesciences.org/articles/95113/elife-95113-supp2-v1.xlsx
-
Supplementary file 3
Differential expression table of genes for the main uninfected class clusters.
Related to Figure 1C.
- https://cdn.elifesciences.org/articles/95113/elife-95113-supp3-v1.xlsx
-
Supplementary file 4
Differential expression table of genes for the main infected class clusters.
Related to Figure 1C.
- https://cdn.elifesciences.org/articles/95113/elife-95113-supp4-v1.xlsx
-
Supplementary file 5
Differential expression table of genes for sub-clustered keratinocytes.
Related to Figure 2.
- https://cdn.elifesciences.org/articles/95113/elife-95113-supp5-v1.xlsx
-
Supplementary file 6
CellChat comparison for ligand:receptor pairs for the uninfected and infected datasets.
- https://cdn.elifesciences.org/articles/95113/elife-95113-supp6-v1.xlsx
-
Supplementary file 7
Differential expression table of genes for sub-clustered fibroblasts.
Related to Figure 3.
- https://cdn.elifesciences.org/articles/95113/elife-95113-supp7-v1.xlsx
-
Supplementary file 8
Differential expression table of genes for sub-clustered myeloid clusters.
Related to Figure 4.
- https://cdn.elifesciences.org/articles/95113/elife-95113-supp8-v1.xlsx
-
Supplementary file 9
Differential expression table of genes for sub-clustered neutrophil clusters.
Related to Figure 5.
- https://cdn.elifesciences.org/articles/95113/elife-95113-supp9-v1.xlsx
-
MDAR checklist
- https://cdn.elifesciences.org/articles/95113/elife-95113-mdarchecklist1-v1.pdf
Download links
A two-part list of links to download the article, or parts of the article, in various formats.
Downloads (link to download the article as PDF)
Open citations (links to open the citations from this article in various online reference manager services)
Cite this article (links to download the citations from this article in formats compatible with various reference manager tools)
Decoding the complexity of delayed wound healing following Enterococcus faecalis infection
eLife 13:RP95113.
https://doi.org/10.7554/eLife.95113.3


