3D genomic features across >50 diverse cell types reveal insights into the genomic architecture of childhood obesity
- Center for Spatial and Functional Genomics, The Children's Hospital of Philadelphia, United States
- Division of Human Genetics, The Children's Hospital of Philadelphia, United States
- Cell and Molecular Biology Graduate Group, Perelman School of Medicine, University of Pennsylvania, United States
- Department of Genetics, Perelman School of Medicine, University of Pennsylvania, United States
- Department of Pathology, The Children's Hospital of Philadelphia, United States
- Division of Gastroenterology, Hepatology, and Nutrition, Children's Hospital of Philadelphia, United States
- Scheie Eye Institute, Department of Ophthalmology, Perelman School of Medicine, University of Pennsylvania, United States
- Penn Medicine Center for Ophthalmic Genetics in Complex Disease, United States
- Department of Orthopedic Surgery University of Michigan Medical School Ann Arbor, United States
- Laboratory of Translational Genomics, Division of Cancer Epidemiology and Genetics, National Cancer Institute, United States
- Department of Child and Adolescent Psychiatry, Children's Hospital of Philadelphia, United States
- Department of Psychiatry, Perelman School of Medicine, University of Pennsylvania, United States
- Institute for Diabetes, Obesity and Metabolism, Perelman School of Medicine, University of Pennsylvania, United States
- Department of Cell and Developmental Biology, Perelman School of Medicine, University of Pennsylvania, United States
- Department of Physiology, Perelman School of Medicine, University of Pennsylvania, United States
- Department of Microbiology and Immunology, University of Melbourne, Peter Doherty Institute for Infection and Immunity, Australia
- Department of Critical Care, Melbourne Medical School, University of Melbourne, Australia
- Division of Infectious Diseases, Department of Medicine, University of British Columbia, Canada
- Department of Surgery, University of British Columbia, Canada
- BC Children's Hospital Research Institute, Canada
- School of Biomedical Engineering, University of British Columbia, Canada
- Department of Pediatrics, Perelman School of Medicine, University of Pennsylvania, United States
- Department of Pathology, Perelman School of Medicine, University of Pennsylvania, United States
- Institute for Immunology, Perelman School of Medicine, University of Pennsylvania, United States
- Division Endocrinology and Diabetes, The Children's Hospital of Philadelphia, United States
- Penn Neurodegeneration Genomics Center, Perelman School of Medicine, University of Pennsylvania, United States
Figures
Figure 1
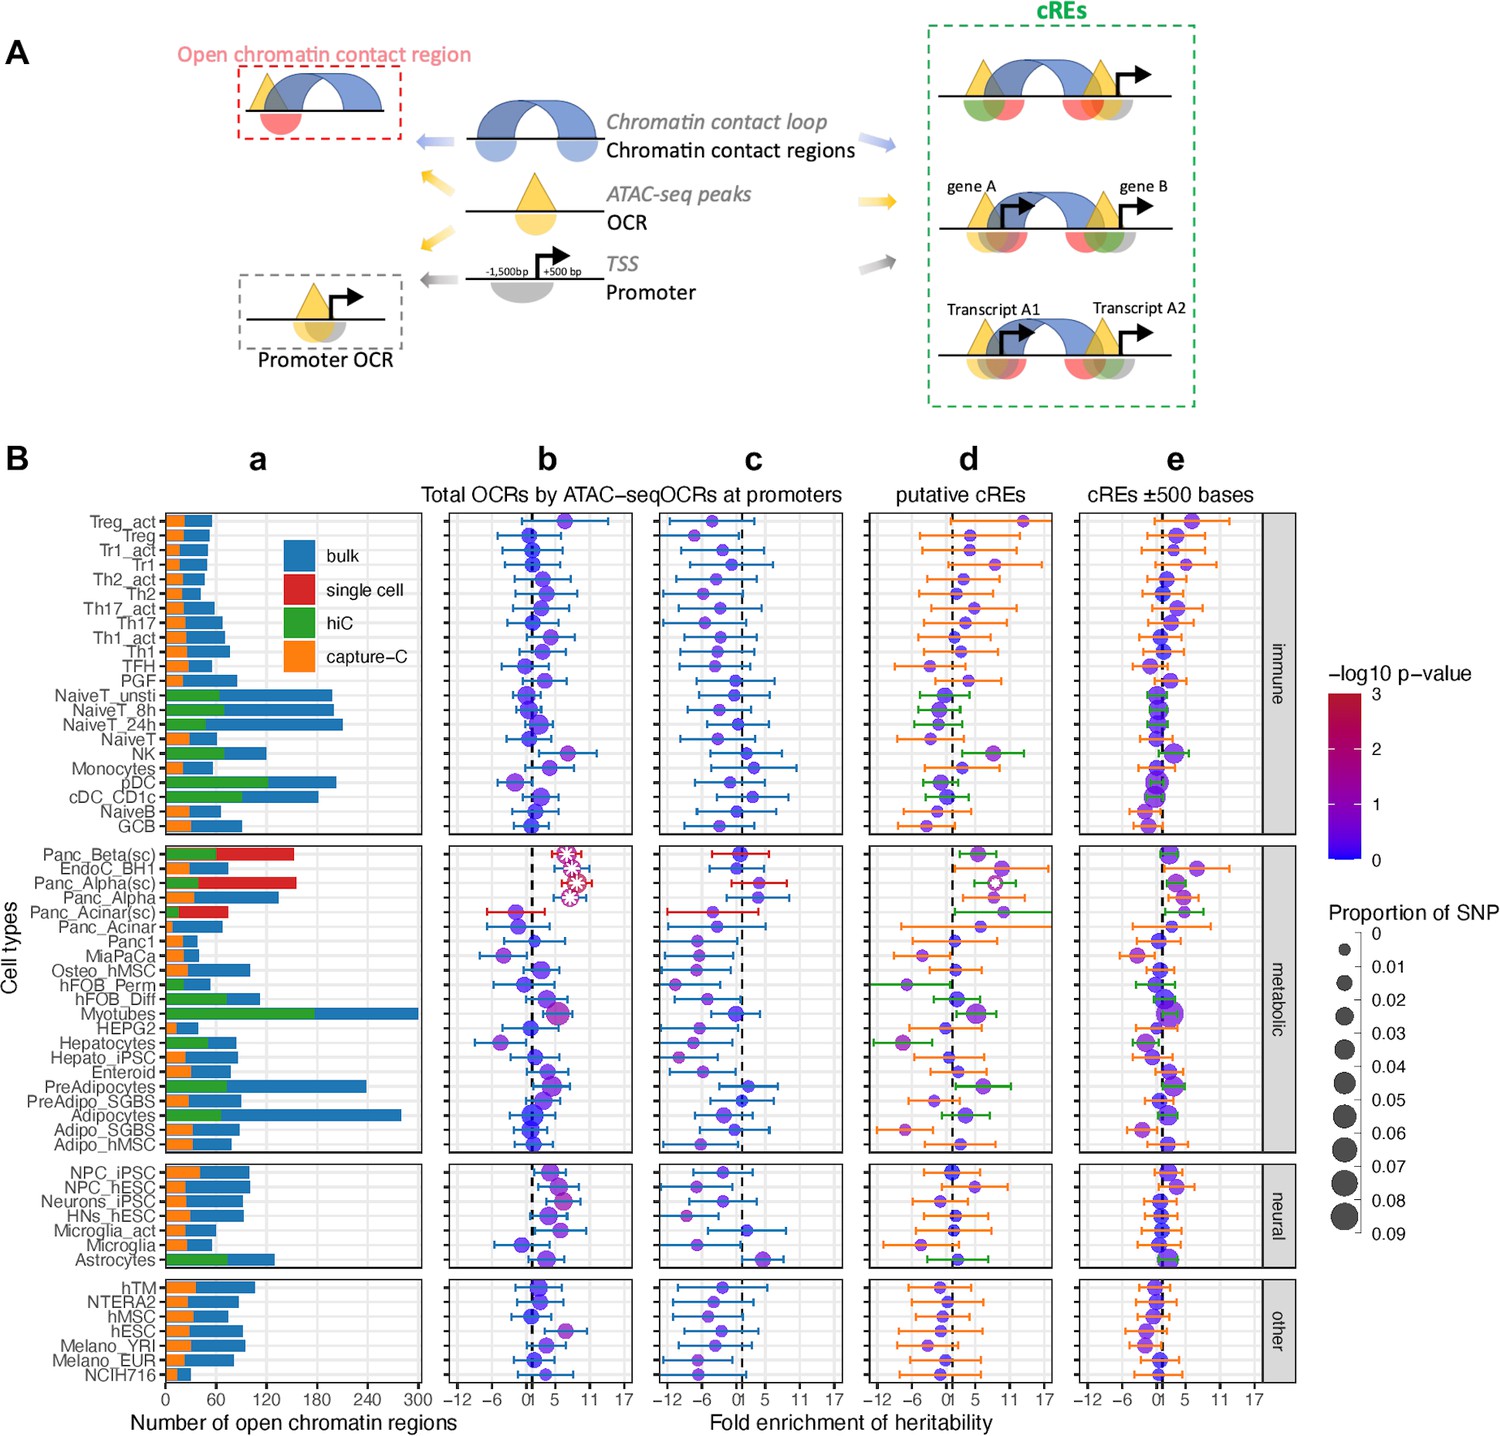
Partitioned Linkage Disequilibrium Score Regression analysis for open chromatin regions of all cell types.
(A) The schematic shows the different types of regions defined in our study and 3 different ways overlapping chromatin contact regions – OCRs – gene promoters define cREs. (B) Heritability enrichment by LDSC analysis for each cell type. (a) Bar-plot shows the total number of OCRs identified by ATAC-seq for each cell type on bulk cells - blue, or on single cells – red; and the portion of OCRs that fall within cREs identified by incorporating Hi-C (green) or by Capture-C (orange). 4 panels of dot-plots show heritability enrichment by LDSC analysis for each cell type, with standard error whiskers. Dots’ colors correspond to -log10(p-values), dots with white asterisks are significant P-values <0.05, and dots’ sizes corresponding to the proportion of SNP contribute to heritability. Dash line at 1, i.e., no enrichmen. (b) Analysis done on whole OCRs set of each cell type (whiskers colors match with bulk/single cell from bar-plot a); (c) On only OCRs that overlapped with promoters (whiskers’ colors match with 623 bulk/single cell from bar-plot a); (d) On the putative cREs of each cell type (whiskers’ colors match with Hi-C/Capture-C from bar-plot a); (e) On the same cREs as (c) panel with their genomic positions expanded ±500 bases on both sides (whiskers’ colors match with Hi-C/Capture-C from bar-plot a).
Figure 2 with 6 supplements
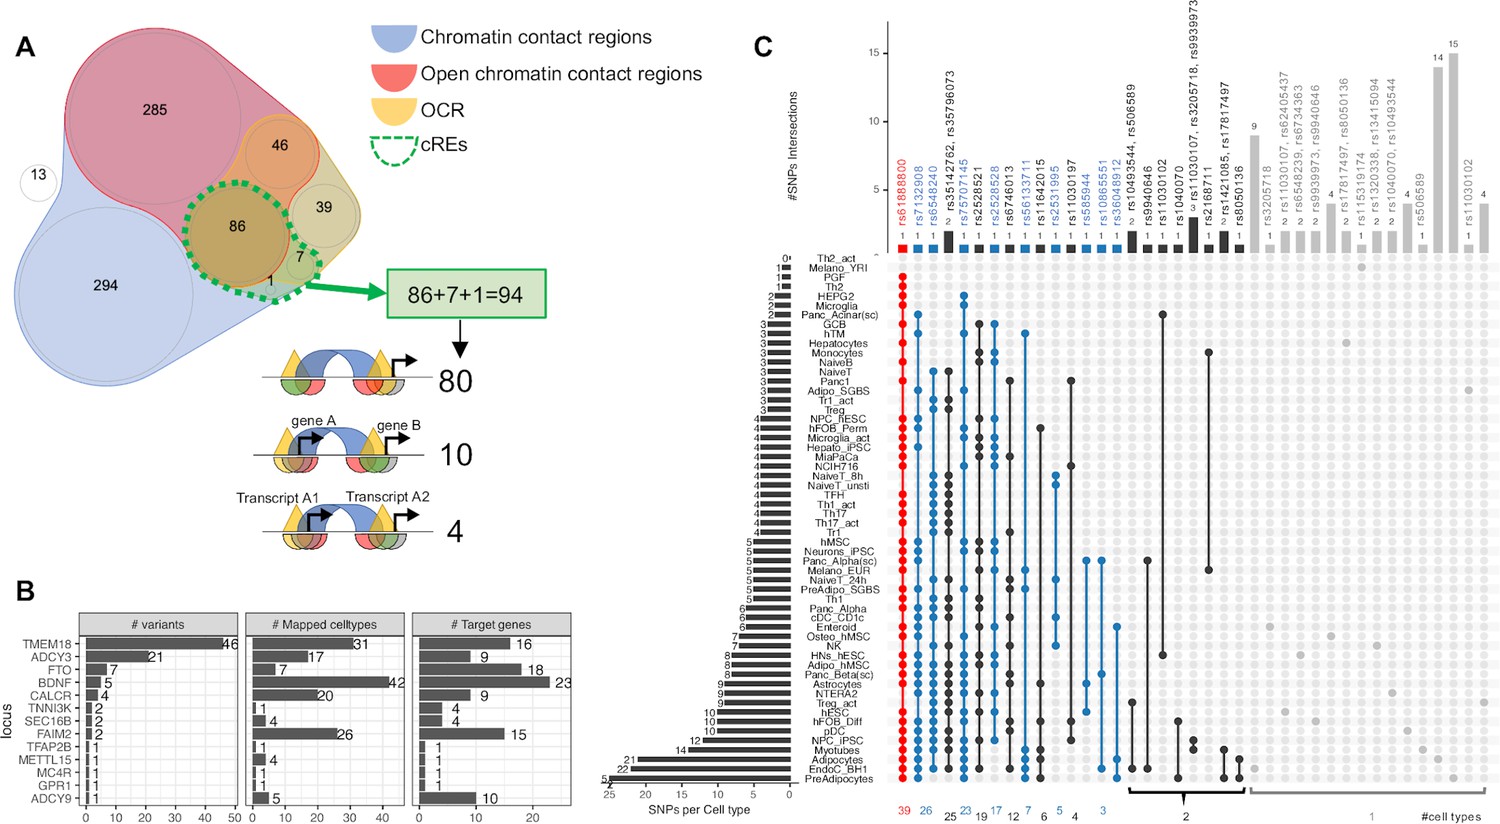
Mapping 771 proxies to the open chromatin regions of each cell type.
(A) Venn diagram shows how 771 proxies mapped to the OCRs: · Blue area: 758 proxies were located within contact regions of at least one cell type regardless of chromatin state; · Red area: 417 proxies were located within contact regions marked as open by overlapping with OCR; · Yellow area: If we only considered open chromatin regions, 178 proxies were included; · Dotted green bordered area: To focus on just those variants residing within open chromatin and contacting promoter regions in any cell type, we overlapped the genomic positions of these proxies with each cell type’s cRE set, yielding 90 variants (3 from the 99% credible set) directly contacting open gene promoters (Supplementary file 1b), with 10 of which located within a promoter of one gene but contacting another different gene promoter. There were an additional 4 variants located within gene promoters but in chromatin contact with promoter(s) of nearby transcript(s) of the same gene (correspond to 3 cREs illustrations in Figure 1A). · White area: proxies that fall into neither defined region of interest. (B) Bar-plot shows number of proxies, cell types and target genes mapped at each locus. (C) The upSet plot shows the degree of overlap across cell types of the variants; ranked from the most common variant (red) – rs61888800 from BDNF locus, a well-known 5' untranslated region variant of this gene that is associated with anti-depression and therapeutic response (Licinio et al., 2009; Colle et al., 2015) – appeared in 39 cell types, to the group of variants (grey) which appeared in only one cell type.
Figure 2—figure supplement 1

Venn diagrams show intersections and the number of proxies within each locus were mapped in different scenarios as illustrated in Figure 1A.
Colors of the areas corresponding to different subset of OCRs, the white areas show proxies that unmapped to any OCR.
Figure 2—figure supplement 2
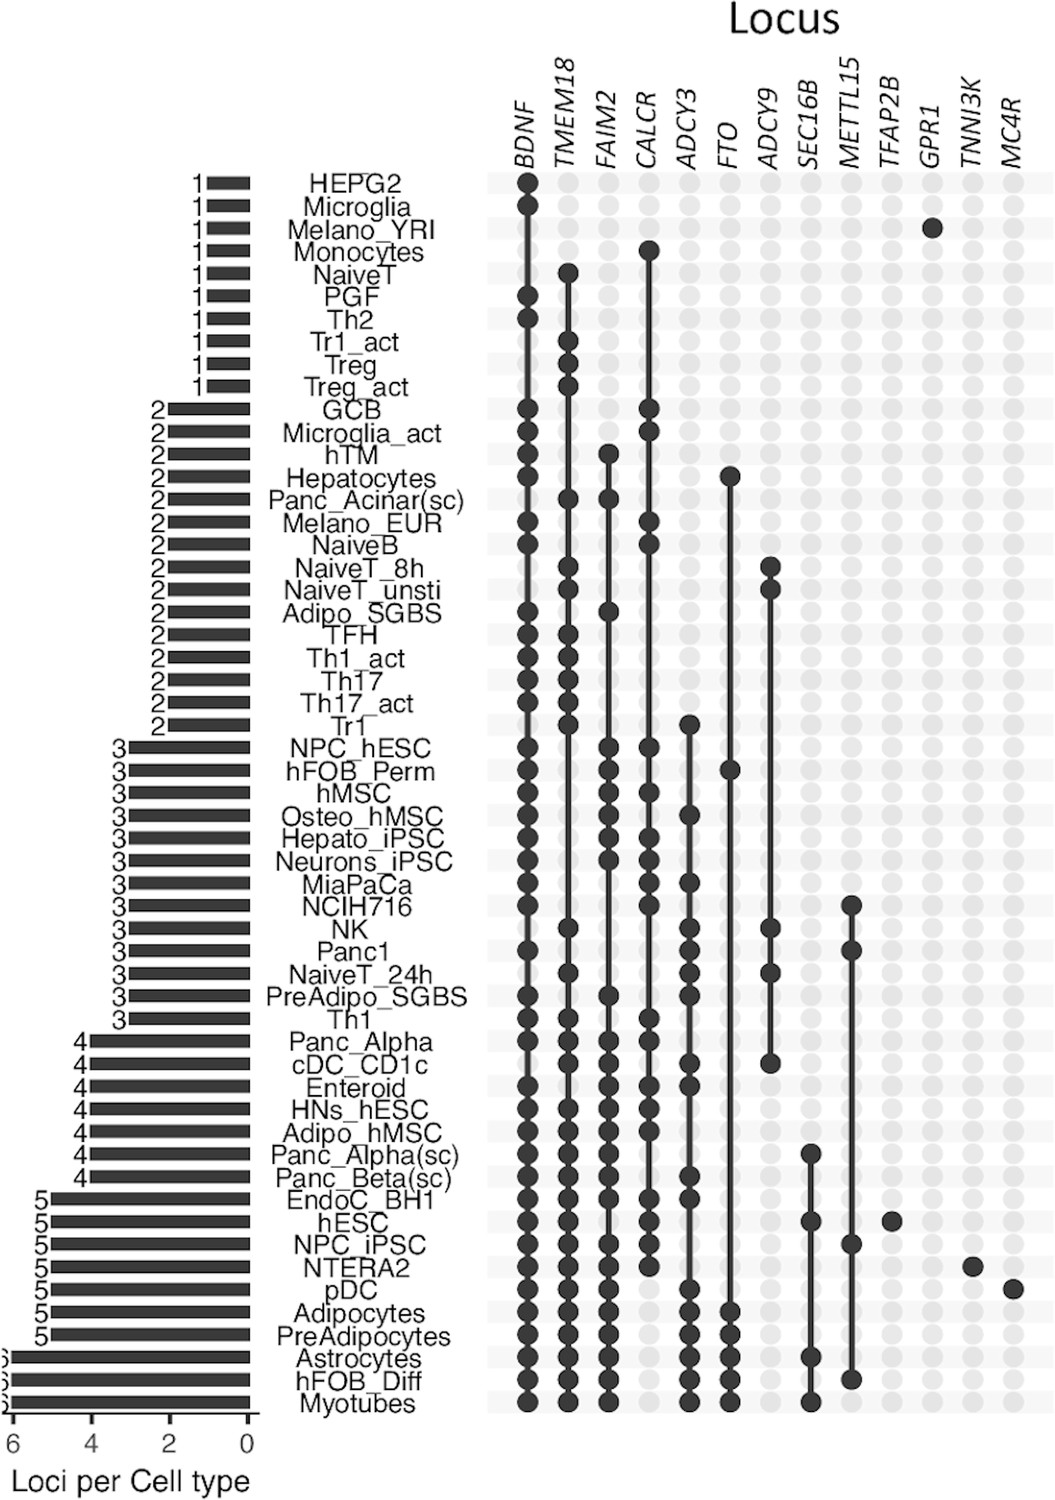
The upSet plot outlines in which cell type(s) each locus appeared.
The 46 variants at the TMEM18 locus appeared in 31 cell types and implicated 16 genes, while only 5 variants of BDNF locus appeared in 42 cell types and implicated 23 genes, or 2 variants of FAIM2 locus with 26 cell types and 15 implicated genes. Seven variants of the FTO locus though appeared in only 7 cell types, but targeted promoters of up to 18 genes. At five loci ADCY9, GPR1, MC4R, METTL15, and TFAP2B, only one single proxy – but not the lead variant in each case – was mapped. Of these, the variant from METTL15 locus only implicated the BDNF gene but appeared in four different cell types. In contrast, the variant from ADCY9 locus appeared in five different cell types and implicated up to 10 different genes.
Figure 2—figure supplement 3
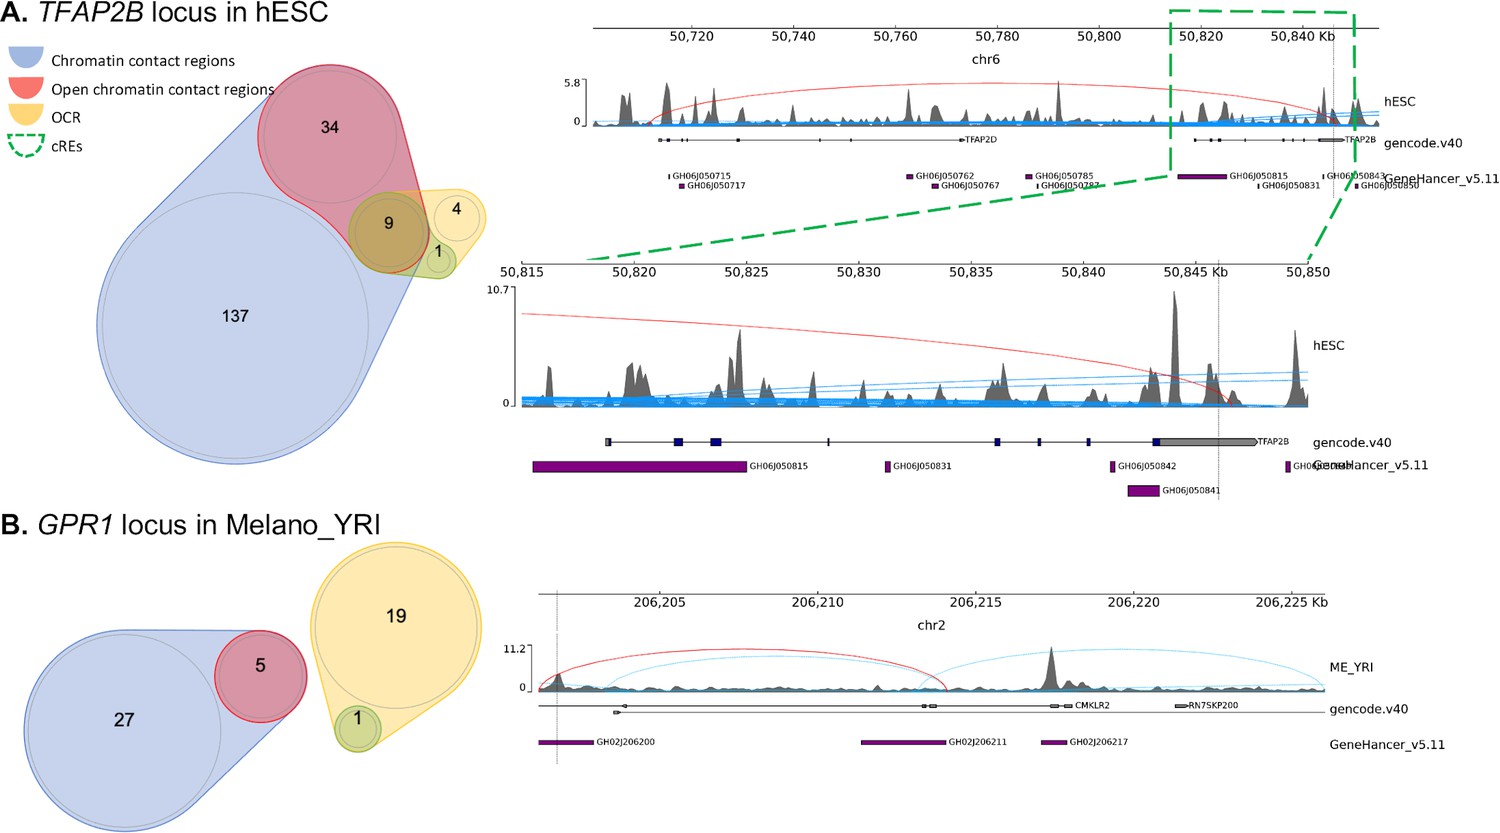
Examples of 2 variants mapped to only one gene promoter.
(A) At TFAP2B locus on chromosome 6, rs62405437 was found only in a human embryonic stem cell line, within the body of transcription factor AP-2 beta (TFAP2B) contacting the promoter of TFAP2D (red arc). Interestingly, there were many contacts identified by our Capture-C assay between these two members of the transcription factor AP-2 family (blue arcs), and many of our proxies were located within these loop ends, albeit outside any defined open chromatin region – red regions in illustration Figure 1A. (B) At the GPR1 locus on chromosome 2, rs115319174 was identified only within Nigerian melanocytes cREs, positioned in an open region within the body of the CMKLR2 gene and contacting (red arc) the promoter of GPR1 – a gene for G-protein-coupled receptors known to increase its expression in obese phenotypes14. Blue arcs represented other chromatin contacts identified within this window. Figure 2—figure supplement 4. Dot-plot with each variant colored by their locus shows the number of genes and cell types each proxy mapped into our cREs.
Figure 2—figure supplement 4
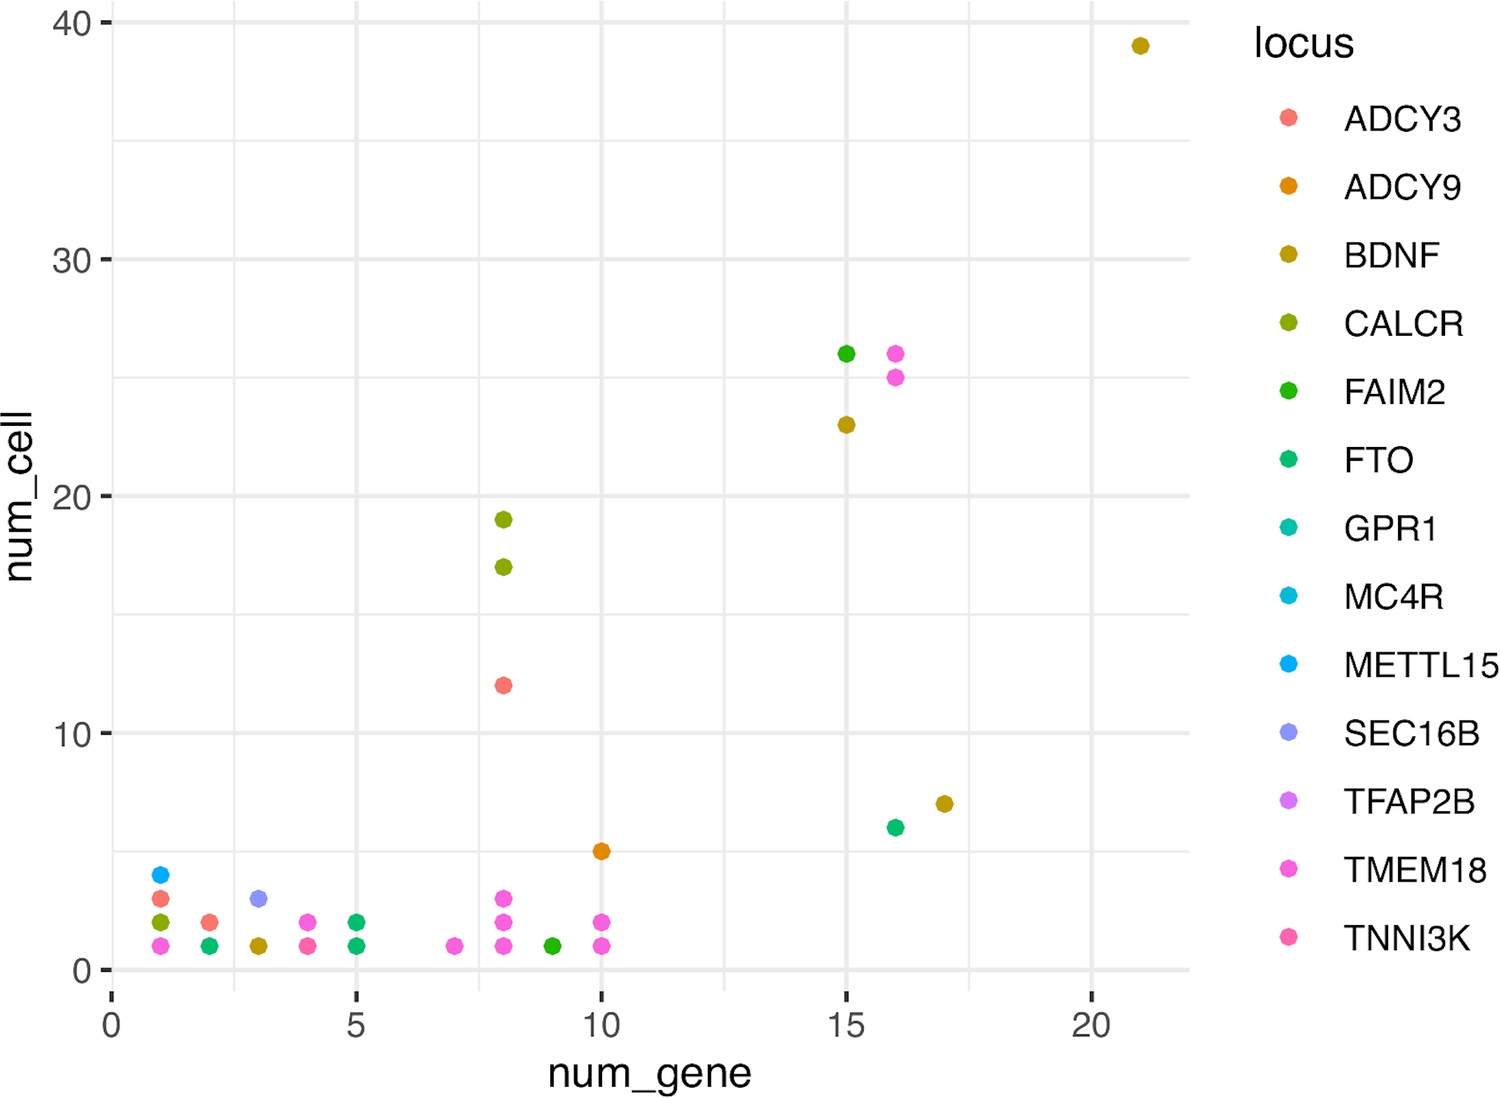
Dot-plot with each variant colored by their locus shows the number of genes and cell types each proxy mapped into our cREs.
Figure 2—figure supplement 5
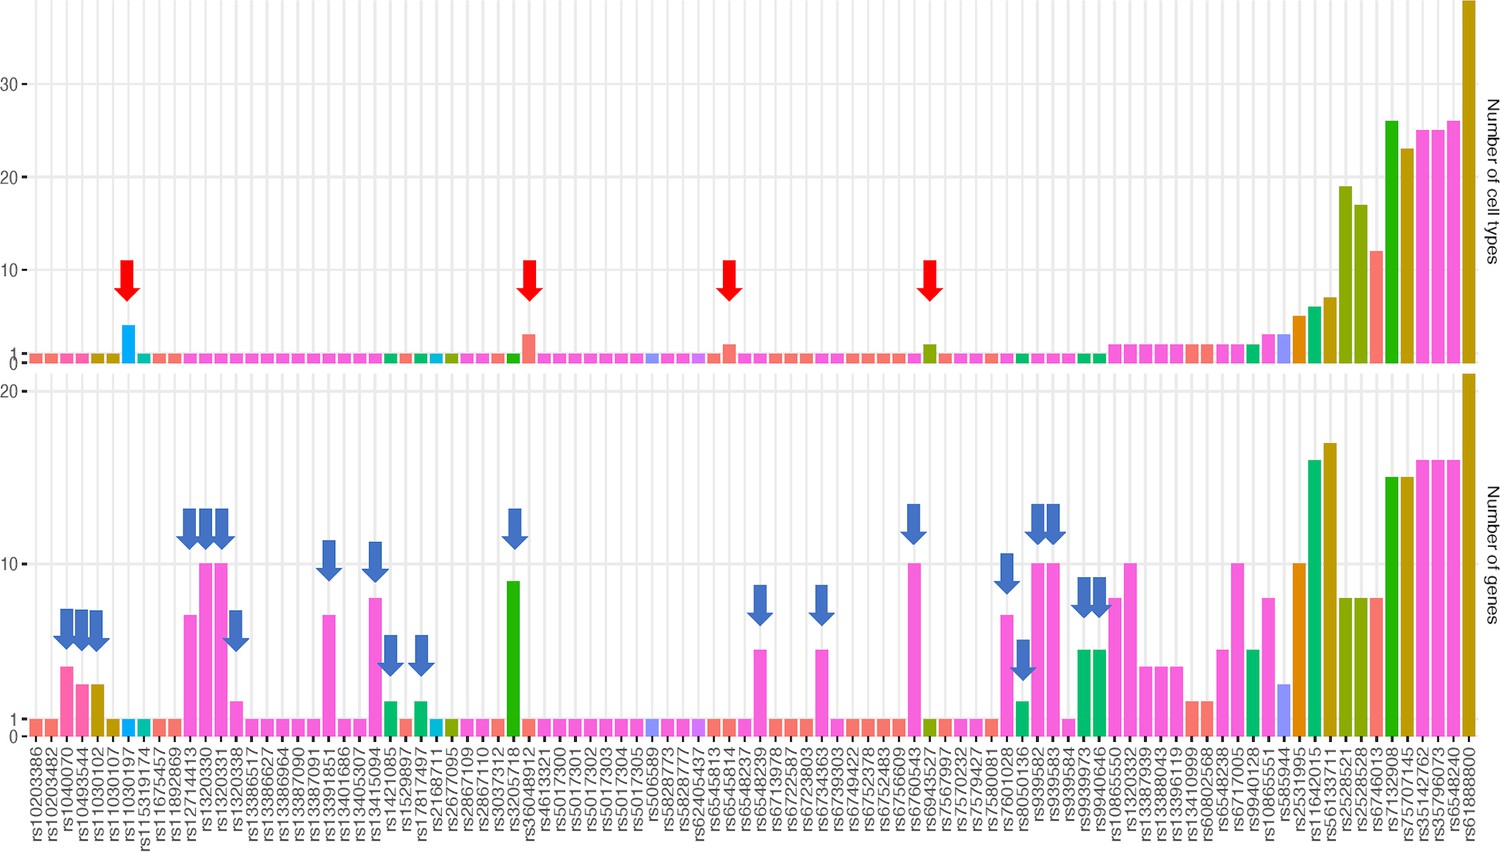
Bar plots for the number of cell types and number of genes implicated by each variant.
Bar-plots show some variants found in multiple cell types were more selective with respect to their target genes (red arrow) – such as rs11030197 at the METTL15 locus – or conversely more selective in given cell types but implicated multiple genes (blue arrow) – such as 21 other variants from the 66 mentioned earlier that appeared in only one cell type but contacted multiple genes within that cellular setting. These 21 variants included one from BDNF locus, one from FAIM2 locus, two from TNNI3K, five from FTO, and twelve from the TMEM18 locus.
Figure 2—figure supplement 6
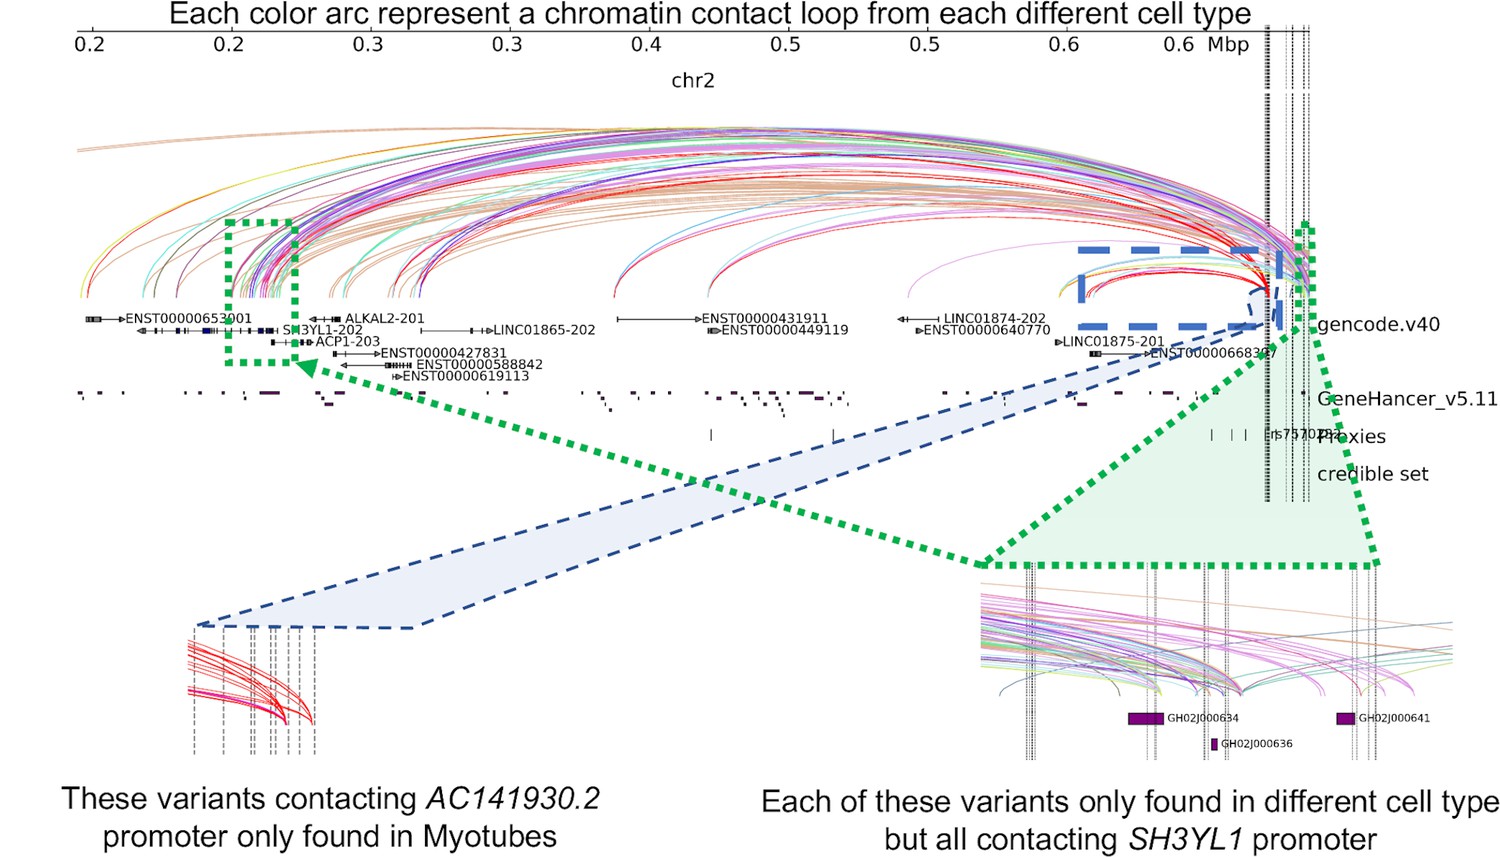
TMEM18 locus: within this locus where there were 45 proxies in LD with the sentinel SNP rs7579427 that mapped to the cREs of 31 cell types; 35 of these proxies were found exclusively in only one unique cell type (10 in pre-adipocytes only, 9 in adipocytes only, 8 in EndoC-BH1 only, 2 in hESC-derived hypothalamic neurons only, 2 in natural killer cells only, and 4 in activated regulatory T cells only); however, their target gene promoters were also frequently contacted by other different proxies in other cell types.
Example in blue window. The green window: The SH3YL1 open promoter was contacted within 25 cell types, including eleven immune cell types (mostly T-cells), six metabolic cell types (adipocytes, different pancreatic cell types, differentiated osteoblasts), and three neural cell types (primary astrocytes, hESC-derived hypothalamic neurons, and neural progenitors). Similarly, the ACP1 promoter was contacted in 14 cell types across three systems, except for adipocytes and astrocytes.
Figure 3 with 3 supplements
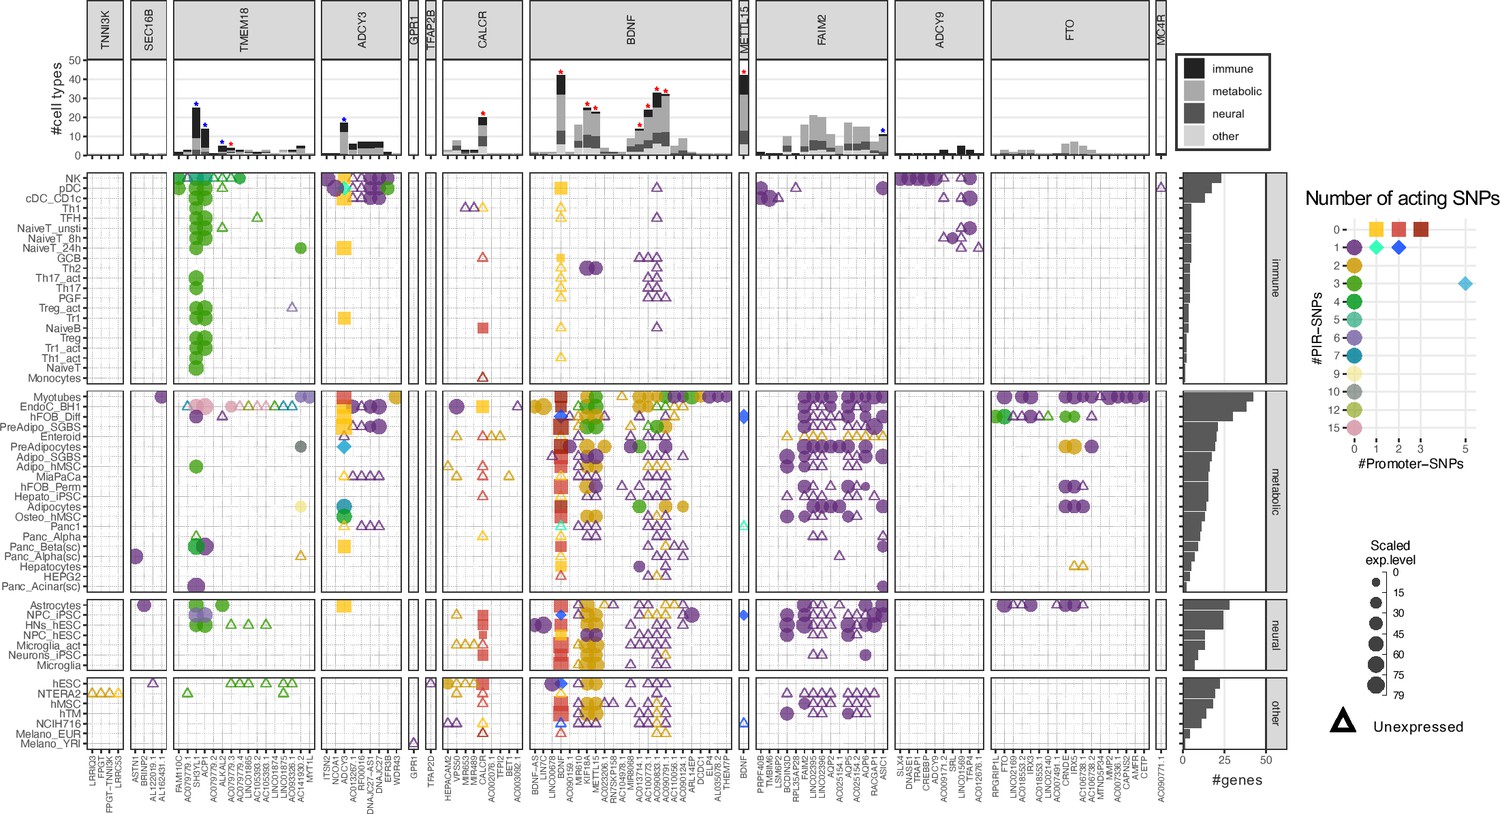
Profiles of 111 implicated genes by 94 proxies through cREs of each cell type.
Main panel: Bubble plot show corresponding expression level (size) and number of variants (color) target each implicated gene of each cell type. Squares represent genes with variants at their promoters. Circles represent genes with variants contacted through chromatin loops. Some genes were implicated by both types, these ‘double implications’ are represented as diamond shapes, and were identified across several cell types: two cell types (plasmacytoid dendritic cells and pre-differentiated adipocytes) for ADCY3 gene, and five for BDNF (human embryonic stem cells - hESC, differentiated human fetal osteoblast cells - hFOB_Diff, neural progenitor cells derived from induced pluripotent stem cells - NPC_iPSC, PANC-1, and NCIH716 cell lines). Genes with expression undetected in our arrays are shown as triangles. Top panel: bar-plot shows numbers of cell types each gene was implicated within, color-coded by which systems the cell types belong to. Right panel: bar-plot shows numbers of genes implicated by the variants with each cell type.
Figure 3—figure supplement 1
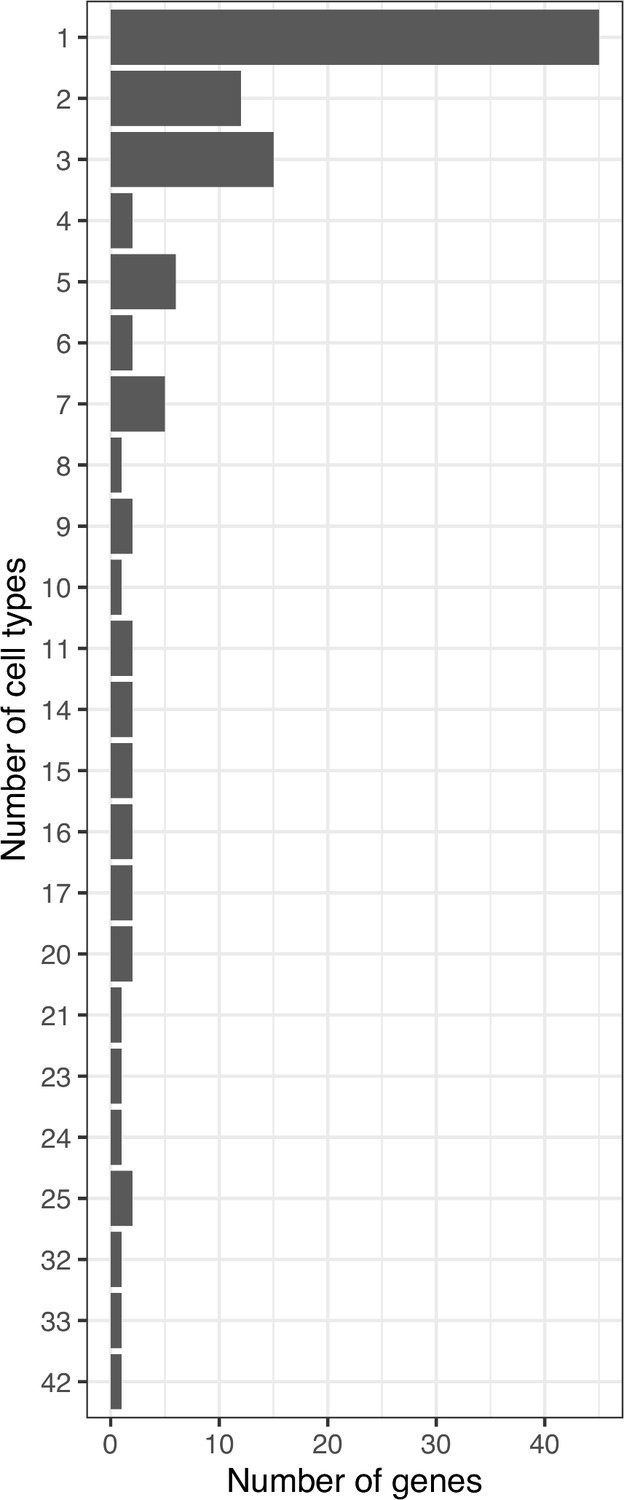
Bar-plot shows number of genes implicated in how many cell types.
Figure 3—figure supplement 2
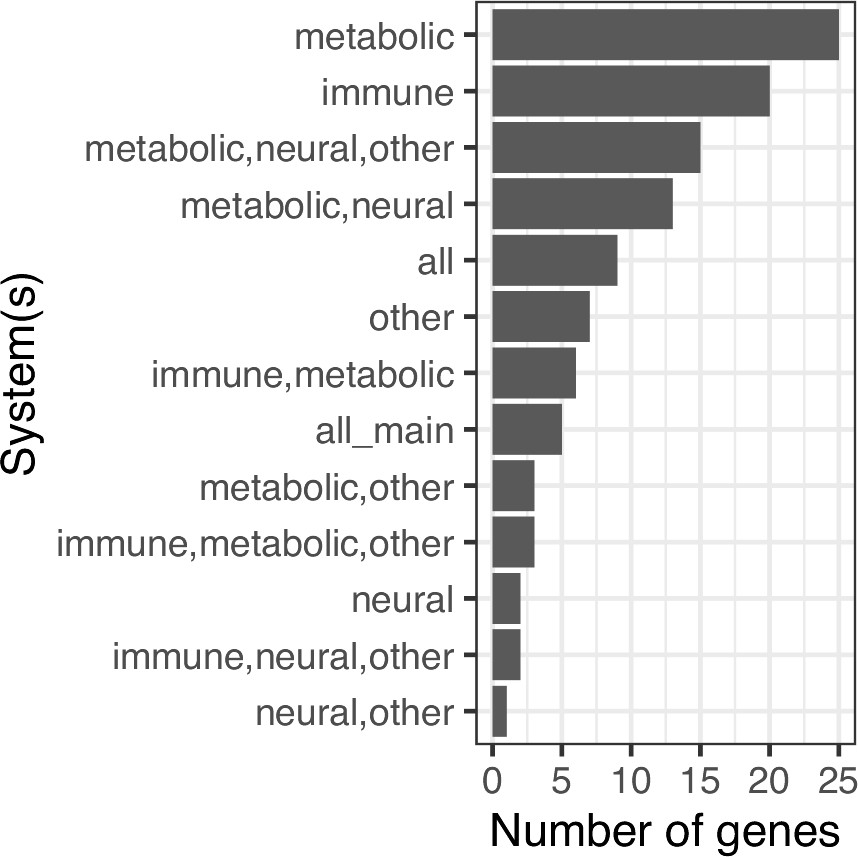
Bar-plot shows number of genes implicated in cell types of each combination of metabolic, immune, neural system and other cell lines groups.
Figure 3—figure supplement 3

Double-implicated genes.
Genomic views of two loci where genes promoters both harbor childhood obesity variants (solid arrows) and were contacted by OCRs harboring variants though chromatin contacts (hollow arrows), hence “double-implicated”. Top panel: BDNF locus where BDNF gene promoters harbor two variants rs61888800 and rs75707145 that overlapped with OCRs of three cell types. In differentiated hFOB cell and iPSC-derived neural progenitor cells, different BDNF promoters were contacted through chromatin loops in different cell types. Lower panel: ADCY3 locus where ADCY3 gene promoters were double-implicated by two variants in plasmacytoid dendritic cells and 8 other variants in pre-differentiated adipocytes.
Figure 4 with 4 supplements
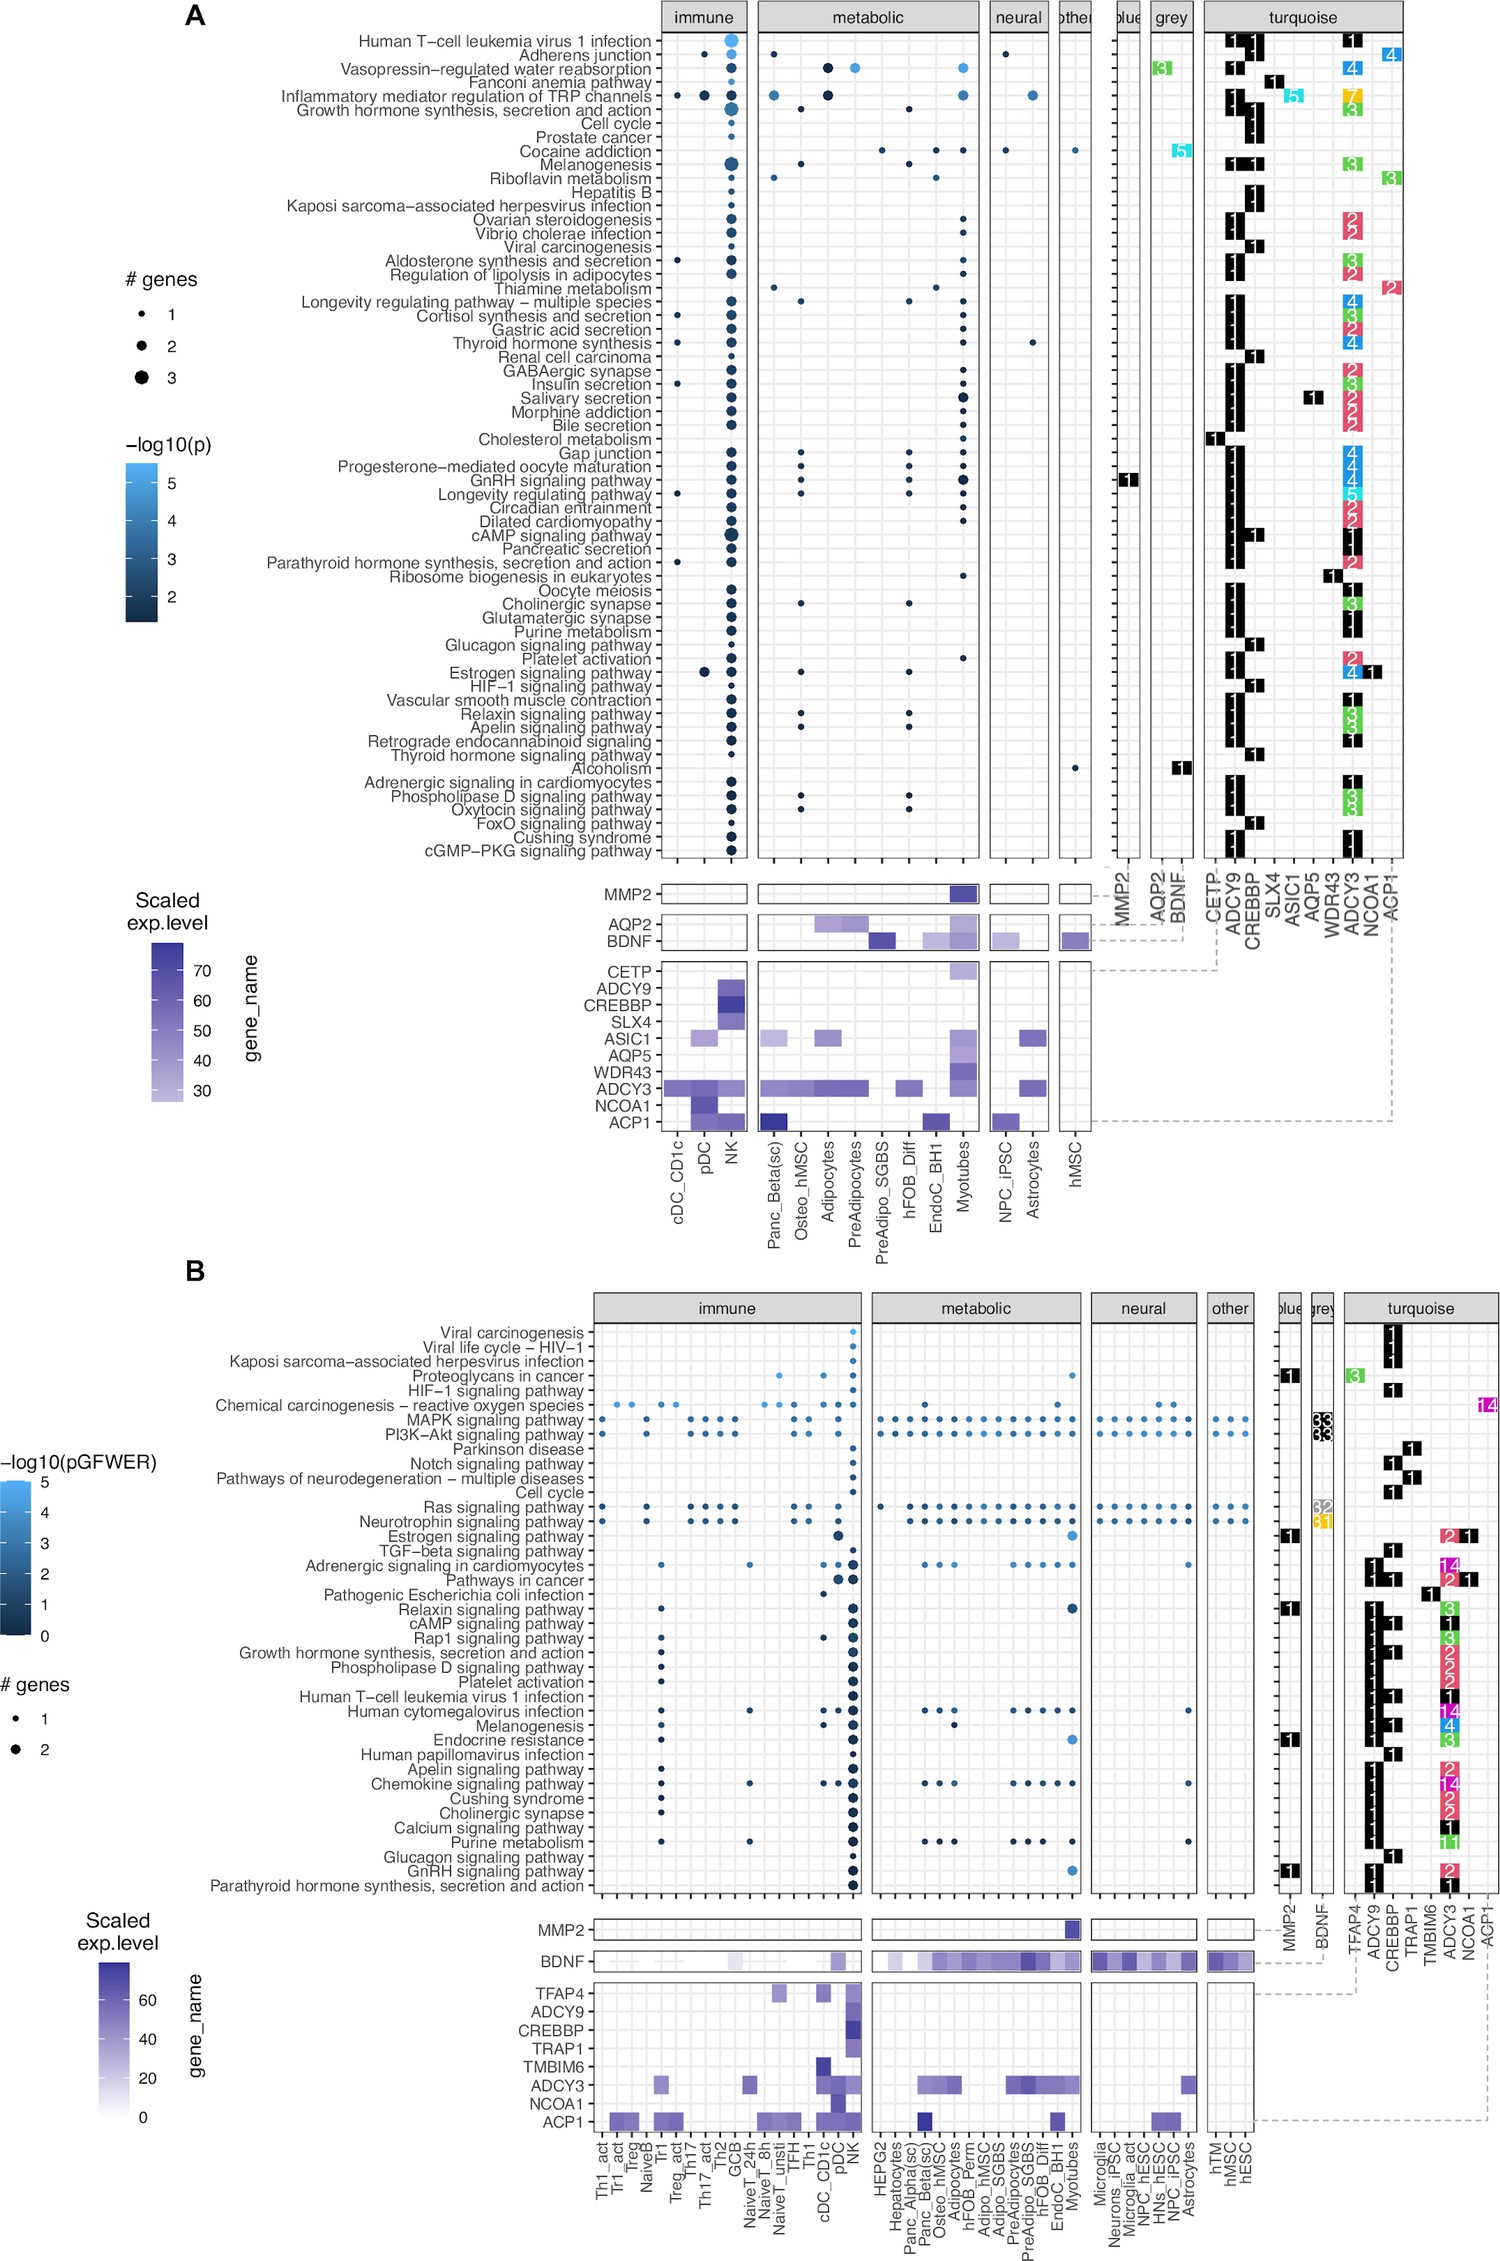
KEGG pathways enrichment analysis.
(A) The pathfindR method: Focused on ‘leveraging interaction information from a protein-protein interaction network (PIN) to identify distinct active subnetworks and then perform enrichment analyses on these subnetworks’, thus aiding enriched pathway analyses through the inter-connection between the genes targeted by obesity variants with key genes driving the pathology of the disease. The result with 60 enriched KEGG terms in the main panel (Supplementary file 1c), shows 13 genes in 14 cell types and their scaled expression levels in the lower panel. (B) The modified SPIA: After applying the adjusted P-value of 0.05 as the filtering threshold, the analysis yielded 39 enriched KEGG terms (full table at Supplementary file 1d) with only 10 genes, but involved up to 42 cell types.
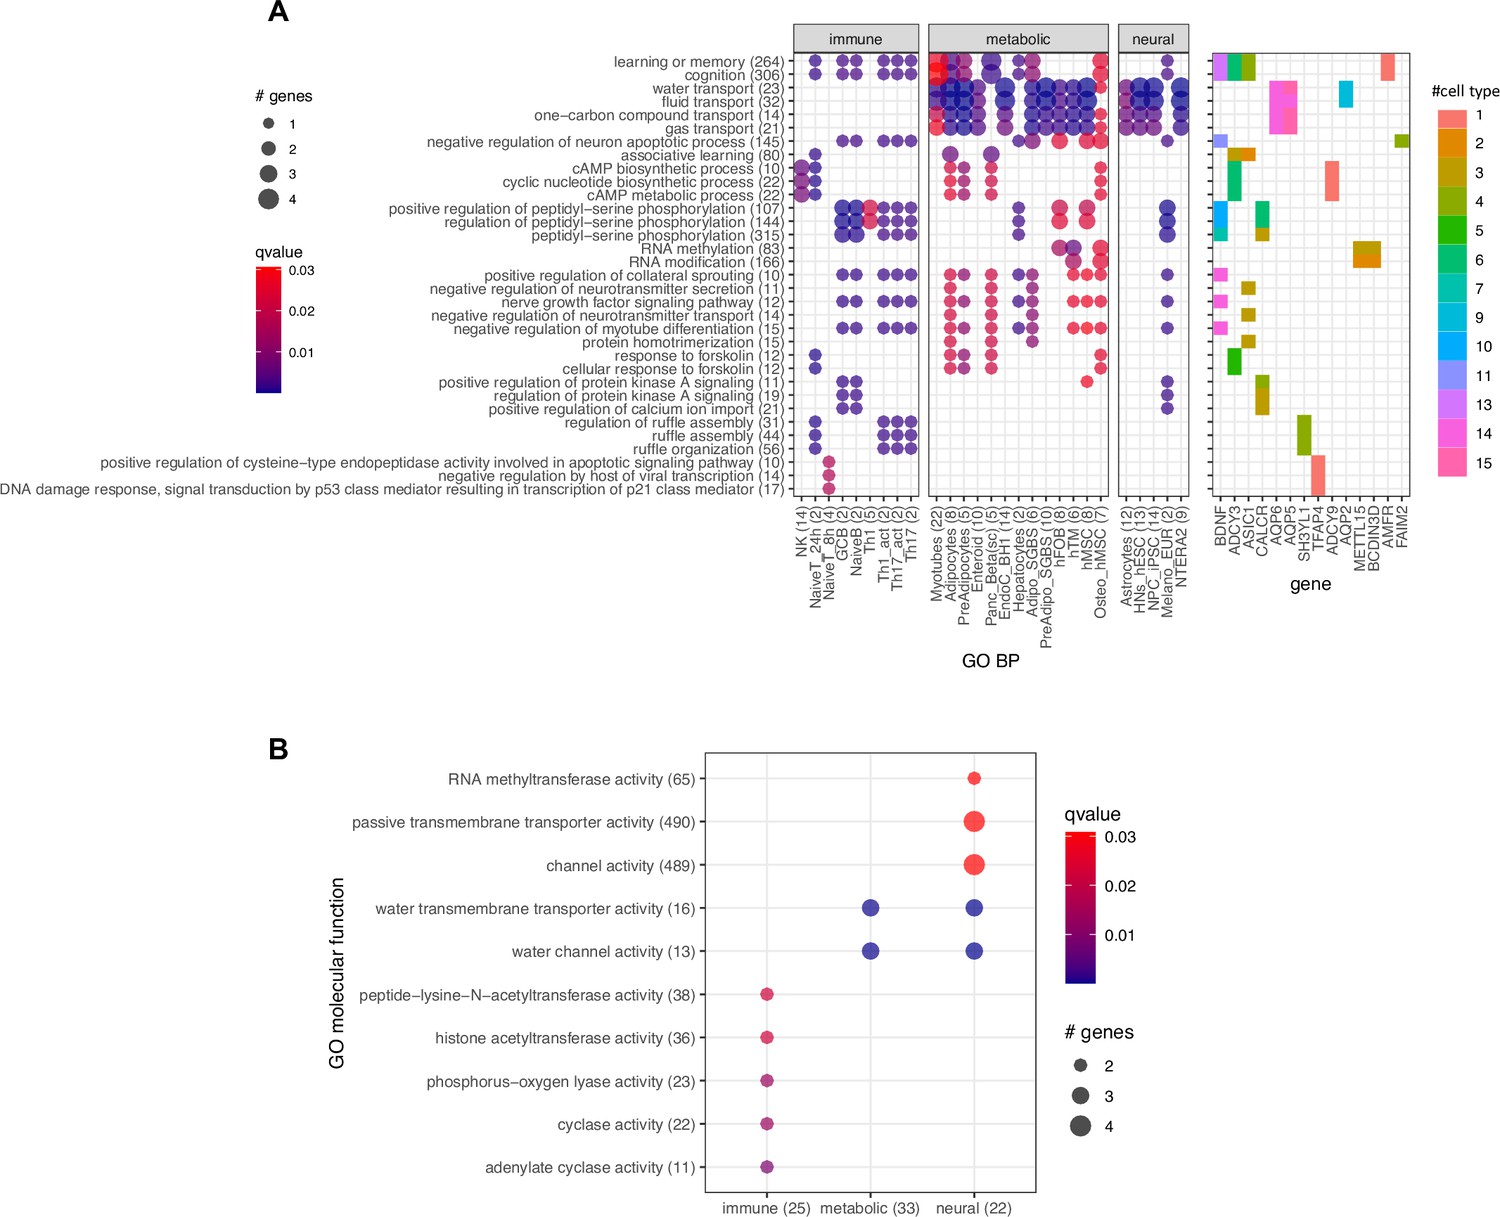
Figure 4—figure supplement 1
Gene Ontology (GO) biological process terms enrichment.
(A) Due to the limited number of implicated genes, over-representation analysis for GO biological process terms across the cell types showed only a few main clusters. This result mainly emphasized the frequencies of several genes that appeared in many cell types and participated in many biological processes and pathways – namely BDNF, FAIM2, CALCR, Aquaporin genes (AQP2, AQP5, AQP6), ASIC1, and the Adenylate cyclase genes (ADCY3, ADCY9, BCDIN3D, METTL15). (B) Pooling genes resulting from the 3 systems of metabolic, neural, and immune cell types revealed two clear clusters of processes, segregated by the implicated genes enriched mainly in immune cell types (primarily within the ADCY3 locus) versus genes enriched on both metabolic and neural cell types. This somewhat reflected the gene clusters in Figure 3.
Figure 4—figure supplement 2
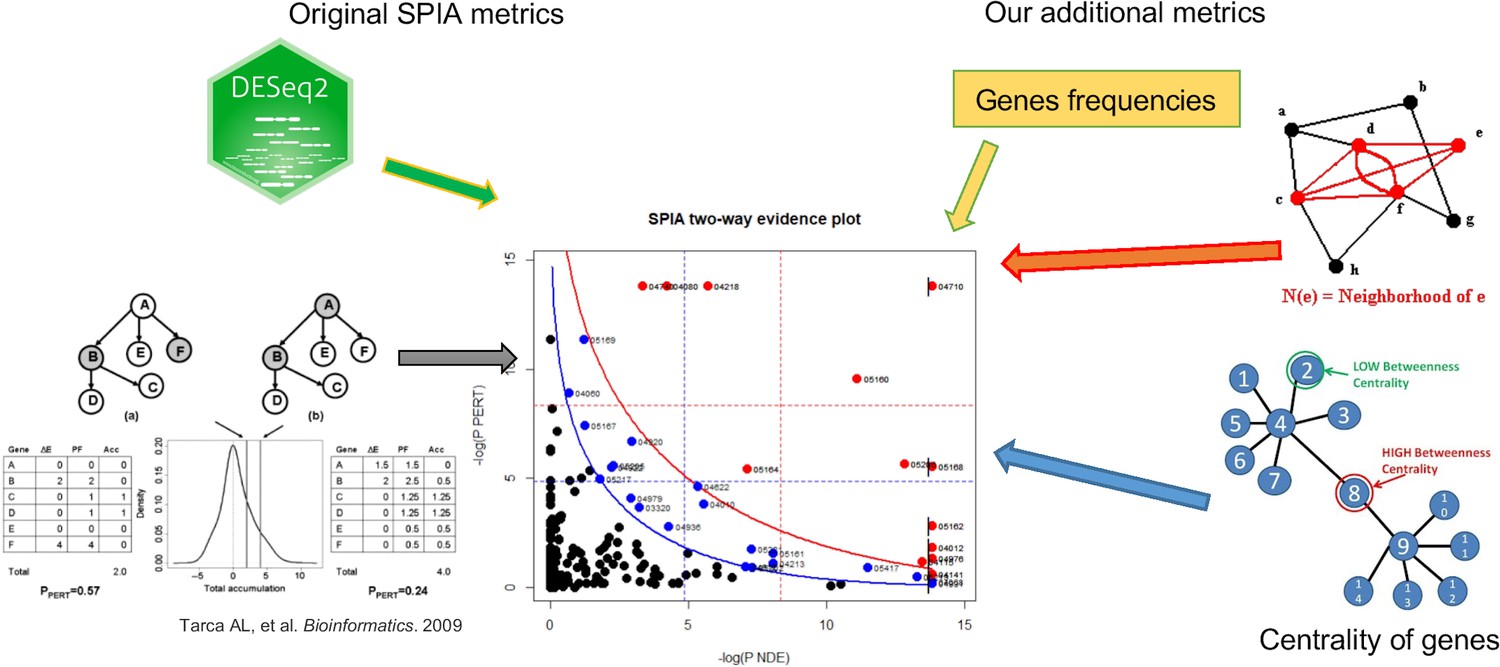
The additional metrics scheme.
To extend the analysis beyond the prerequisite protein-protein networks, but still account for how our genes were weighted within the network architecture of the pathways, we devised a modified SPIA analysis with additional metrics.
Figure 4—figure supplement 3
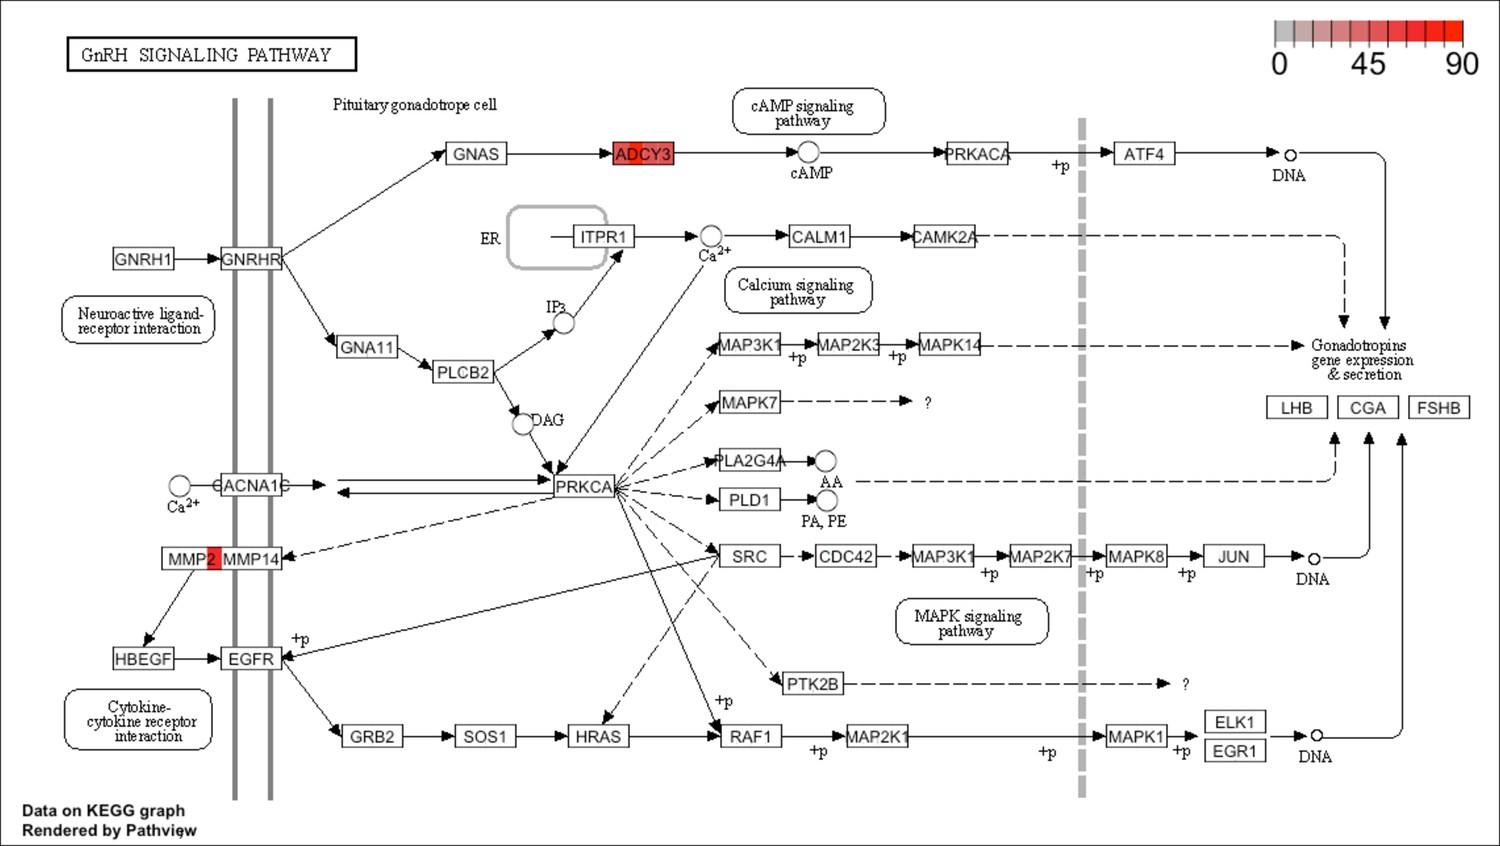
The GnRH signaling pathway: The KEGG graph shows the involvement of ADCY3 and MMP2 genes driving the GnRH signaling pathway.
The four areas in each gene were colored by expression levels of such gene within the corresponding cell types: the hMSC-derived BMP2 differentiated osteoblast, the differentiated osteoblast cell line, the natural killer cell, and the skeletal myotubes.
Figure 4—figure supplement 4

Cluster dendrogram of weighted genes expression of genes from the variant-to-genes mapping process into three modules, named by the colors.
Figure 5
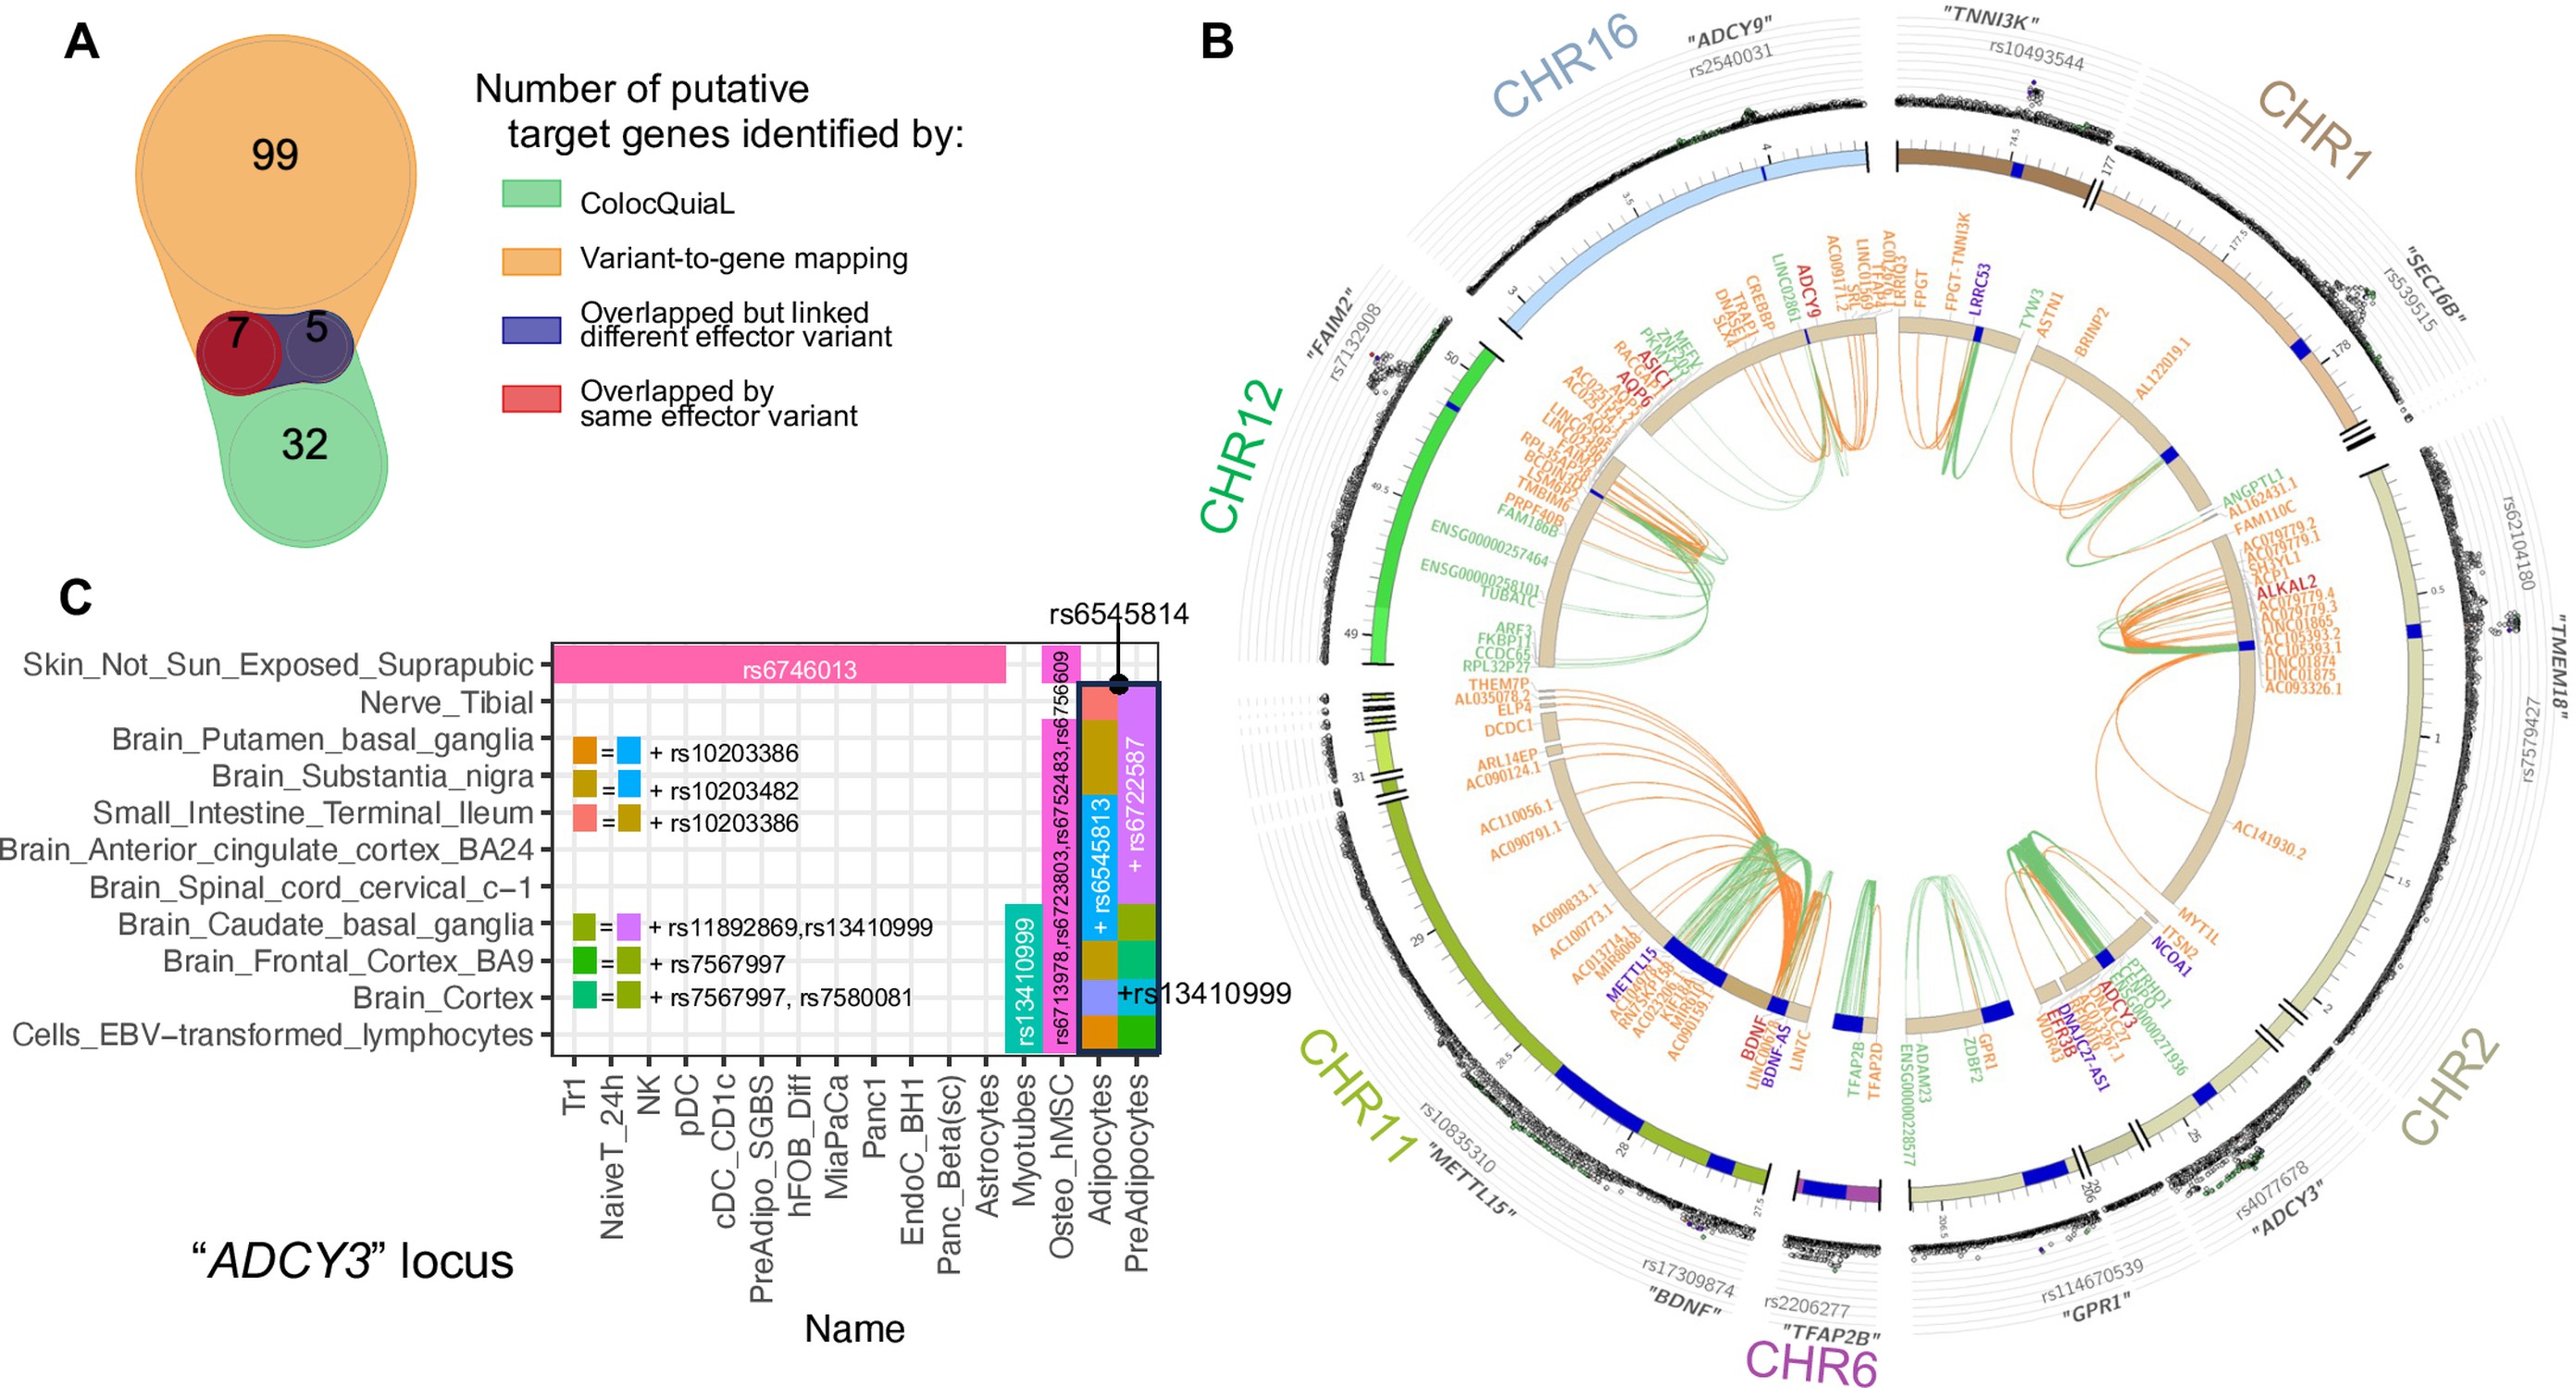
Colocalization of target effector genes with eQTLs.
(A) Venn diagram shows the overlaps between sets of genes yielded by ColocQuiaL and the variant-to-gene mapping process. (B) Circos plot of the 10 loci demonstrates the differences in the ranges of associations between the two approaches, with long-ranged chromatin contacts between obesity variants and target genes displayed as orange links and short-range eQTLs colocalizations as green links. Two SNPs – rs35796073, and rs35142762 within the TMEM18 locus, in linkage disequilibrium with rs7579427 – were estimated with high probability (cond.PP.H4=0.78) of colocalizing with the expression of ALKAL2 gene in subcutaneous adipose tissue. These pairs of SNP-gene were also identified by our variant-to-gene mapping approach in natural killer cells, plasmacytoid dendritic cells, unstimulated PBMC naïve CD4 T cells and astrocytes. The rs7132908 variant at the FAIM2 locus colocalized with the expression of AQP6 in thyroid tissue and with ASIC1 in prostate tissue, not only with high cond.PP.H4 but also with high individual SNP causal probability (SNP.PP.H4>0.95). rs7132908 was the second most consistent observation in our variant-to-gene mapping, namely across 25 different cell types (Figure 2B) and all three systems plus the other independent cell lines. The pair of rs7132908-contacting-AQP6 was observed in 15 different cell types - 8 metabolic and 4 neural cell types, and 3 independent cell lines. The pair of rs7132908-contacting-ASIC1 was observed in 11 different cell types - 8 metabolic and 2 neural cell types, and plasmacytoid dendritic cells. The other eQTL signals that overlapped with our variant-to-gene mapping results were: BDNF at the METTL15 locus with its promoter physically contacted by rs11030197 in 4 cell types and its expression significantly colocalized (cond.PP.H4=0.82) in tibial artery; ADCY9 at its locus with its promoter physically contacted by rs2531995 in natural killer cells and its expression significantly colocalized in skin tissue (‘Skin_Not_Sun_Exposed_Suprapubic’, cond.PP.H4=0.97). And ADCY3 in the C panel. (C) ColocQuiaL estimated that these SNPs highly colocalize with the expression of ADCY3 in 11 different tissues, where the overlapping with the 16 cell types is represented, color-coded by the proxies rs numbers.
Figure 6 with 1 supplement
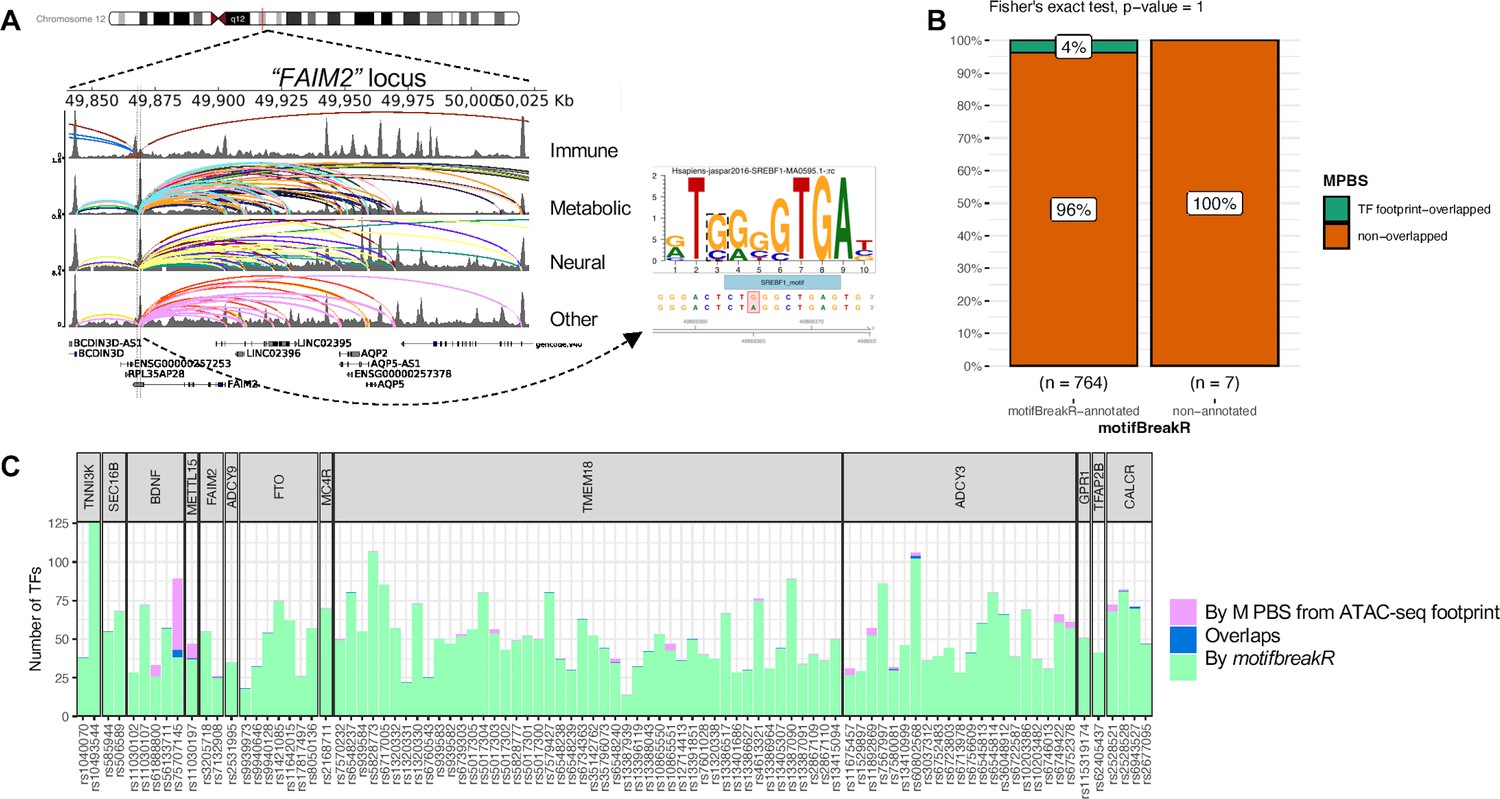
motifbreakR vs ATAC-seq footprint analysis.
(A) Genome view at the FAIM2 locus where rs7132908 is located and can target many genes through many chromatin contacts, presented by arcs (different colors for different cell types). rs7132908 was predicted by motifBreakR to disrupt the TF SREBF1’s binding site, thus potentially altering the expression of its implicated genes. (B) Mosaic plot shows number of variants that were annotated with disrupt-TF-binding affect by motifBreakR, and the proportions that also overlapped with predicted TF footprint from ATAC-seq TF footprint analysis. Fisher exact test was performed and produced p-value = 1. (C) Stacked bar plot for all the variants from variant-to-gene analysis, showing number of transcription factor binding sites each of the variant can disrupt (predicted by motifbreakR – green), or simply overlap (analyzed by RGT suite – purple), or both (blue).
Figure 6—figure supplement 1
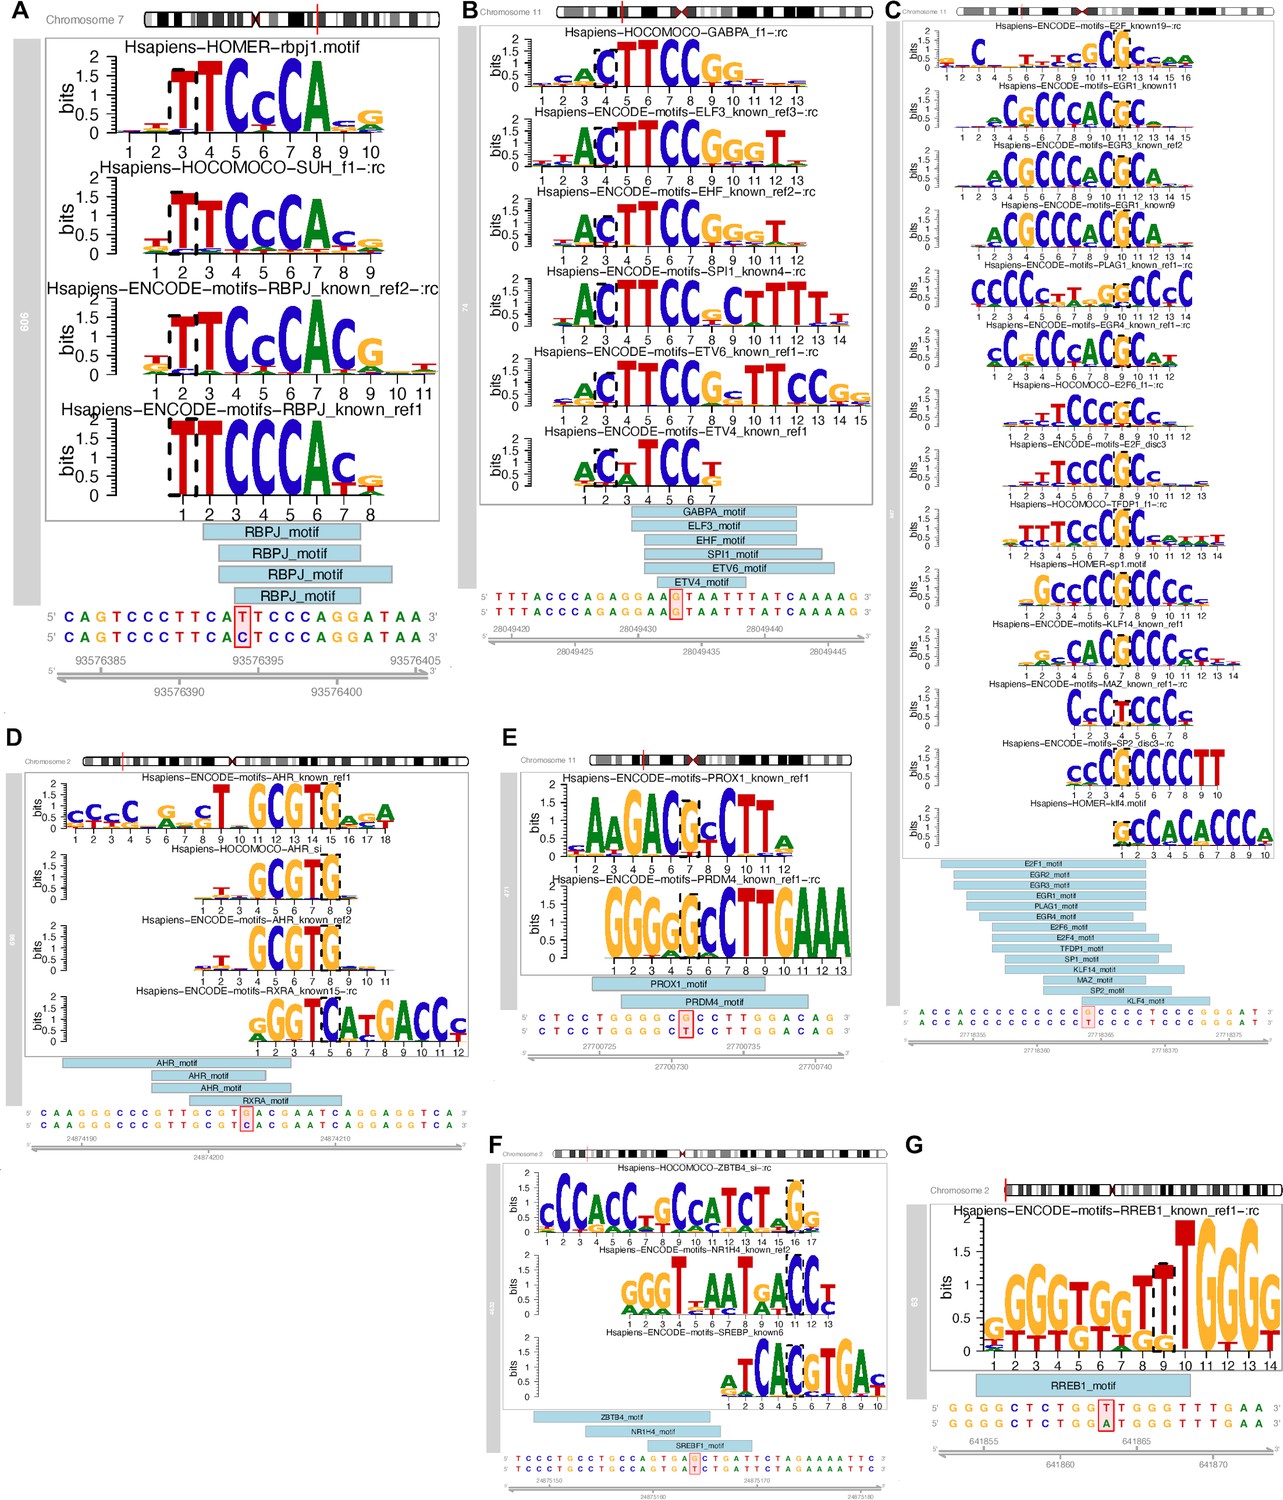
7 variants and the corresponding TF motifs.
(A) At the CALCR locus, rs6943527 was predicted by motifbreakR to disrupt RBPJ binding in naïve T-cells that got activated for 24 hr. (B) From METTL15 locus, rs11030197 is one of the few variants that only targets one single gene promoter, namely BDNF gene, but is implicated in many cell types. It was predicted to disrupt the binding sites of six different TFs in melanocytes and enteroids. (C) A variant from BDNF locus, rs75707145 is predicted to disrupt at least 14 TFs binding sites, supported by overlaps with cREs-MPBS in pre-adipocytes, pancreatic cells, permissive osteoblasts, EndoC BH1 cell and NCIH716 cell lines. (D) At ADCY3 locus, rs7580081 was predicted to disrupt AHR binding in pre-adipocytes and RXRA binding in adipocytes. (E) The ‘regulatory-hub’ variant rs61888800 of BDNF locus was found to contact multiple genes across 41 different cell types and was predicted by motifbreakR to disrupt binding sites of many TFs. The overlaps with cREs-MPBS only provided support for disruption of binding of PROX1 and PRDM4 in germinal center B cell-like cell line, naïve B cells, naive T cells, and the HEPG2 cell line where it contacts via short-ranged chromatin loops with the BDNF promoter, and long-ranged chromatin loops with several lncRNA genes: AC090833.1, AC100773.1, AC090791.1 and AC013714.1. (F) Another variant, rs60802568, at ADCY3 locus was predicted to disrupt bindings of SREBF1 and SREBF2, which were supported by cREs-MPBS from ATAC-seq footprints from astrocytes, pre-adipocytes, adipocytes and osteocytes derived from mesenchymal stem cells. It was also predicted to disrupt ZBTB4 and NR1H4 with supported cREs-MPBS from ATAC-seq footprints only in osteocytes derived from mesenchymal stem cells. (G) At the TMEM18 locus, rs10865551 was predicted to disrupt the binding site of RREB1, in pancreatic alpha and beta cells (from the single-cell data set) by motifbreakR, which were supported by cREs-MPBS from ATAC-seq footprints from these cell types; the target genes through chromatin contact were different between these cell types, where rs10865551 contacts the AC141930.2 promoter in alpha cells, but contacts SH3YL1 and ACP1 promoters in beta cells. About eleven thousand bases upstream from that was rs5017303, which was predicted to disrupt binding sites of BC11A in adipocytes but contacts the same gene AC141930.2 as in pancreatic alpha cells.
Tables
Table 1
PubMed-query known functions for 111 genes implicated by obesity variants.
| Locus | Implicated genes | Obesity or related traits | Different traits |
|---|---|---|---|
| TNNI3K | LRRIQ3 | (NA) | Associated with opioid usage [PMID:34728798] and MDD [PMID: 31748543] |
| FPGT | Predict BMI in Korean pop. [PMID: 28674662] | (NA) | |
| FPGT-TNNI3K | Associated with MDD [PMID: 31748543] | ||
| LRRC53 | Associated with high BMI increased risk heart attack [PMID: 32471361] | (NA) | |
| ASTN1 | Identified as obesity QTL in rat [PMID: 35729251] | Associated with neurodevelopmental traits [PMID: 24381304] and variety of cancers [PMID: 32945491] | |
| BRINP2 | (NA) | Associated with neurodevelopmental traits [PMID: 34267256] | |
| SEC16B | AL122019.1 | (NA) | |
| AL162431.1 | |||
| TMEM18 | FAM110C | (NA) | Overexpression induces microtubule aberrancies [PMID: 17499476], involved in cell spreading and migration [PMID: 19698782] |
| SH3YL1 | Associated with BMI in type 2 diabetes nephropathy [PMID: 33223406] | Influence on T cell activation [PMID: 31427643], involved in different cancer types [PMID: 26305679,24508479] | |
| ACP1 | Associated with early-onset obesity [PMID: 24129437], correlated with cardiovascular risks [PMID: 19570551], drive adipocyte differentiation via control of pdgfrα signaling [PMID: 33615467] | Associated with bipolar disorder [PMID: 31830721] | |
| ALKAL2 | Associated with childhood BMI [PMID: 33627773] | Enhance expression in response to inflammatory pain in nociceptors [PMID: 35608912, 35610945] | |
| MYT1L | Associated with early-onset obesity [PMID: 24129437] | (NA) | |
| AC079779.1 | (NA) | ||
| AC079779.2 | |||
| AC079779.3 | |||
| AC079779.4 | |||
| LINC01865 | |||
| AC105393.2 | |||
| AC105393.1 | |||
| LINC01874 | |||
| LINC01875 | |||
| AC093326.1 | |||
| AC141930.2 | |||
| ADCY3 | ITSN2 | (NA) | Regulate T-cells function [PMID: 32618424] and help the interaction with B-cells [PMID: 29337666] |
| NCOA1 | Meta-inflammation gene [PMID: 25647480], reduce adipogenesis, shift the energy balance between white and brown fat [PMID: 31133421] | (NA) | |
| ADCY3 | Regulate/impair MC4R within energy-regulating melanocortin signaling pathway [PMID: 29311635,32955435] | ||
| DNAJC27-AS1 | Linked to obesity, diabetes traits [PMID: 30131766] | ||
| DNAJC27 | Linked to obesity, diabetes traits [PMID: 30131766] | ||
| EFR3B | Associated with T1D [PMID: 21980299], down-regulated in rare obesity-related disorder [PMID: 25705109] | ||
| WDR43 | (NA) | Associated with breast cancer [PMID: 27117709] | |
| AC013267.1 | (NA) | ||
| RF00016 | |||
| GPR1 | GPR1 | Increase expression in obese phenotype [PMID: 34174278] | (NA) |
| TFAP2B | TFAP2D | (NA) | Involve in embryogenesis [PMID: 12711551] |
| CALCR | HEPACAM2 | Associated with colorectal cancer [PMID: 29659199, 29973580] | |
| VPS50 | Involve in neurodevelopmental disorders and defects [PMID: 30828385, 34037727] | ||
| MIR653 | Involve in different types of cancer [PMID: 35777307] | ||
| MIR489 | Promote adipogenesis in mice [PMID: 34004251] | (NA) | |
| CALCR | Associated with BMI and control of food-intake [PMID: 34462445, 34210852, 31955990, 29522093] | ||
| TFPI2 | (NA) | Involved in colorectal cancer [PMID: 35004840, 34092617, 25902909] | |
| BET1 | Involved in triacylglycerol metabolism [PMID: 24423365] | Associated with muscular dystrophy [PMID: 34310943, 34779586] | |
| AC003092.1 | (NA) | Association with glioblastoma [PMID: 33815468, 30442884] | |
| AC002076.1 | (NA) | ||
| BDNF | LIN7C | Associated in T2D [PMID: 20215397], obesity [PMID: 23044507] | Associated with psychopathology [PMID: 23044507] |
| BDNF-AS | Regulate BDNF and LIN7C expression [PMID: 22960213, 22446693] | (NA) | |
| BDNF | Regulate eating behavior and energy balance [PMID: 34556834] | ||
| MIR610 | (NA) | Involve in different types of cancer [PMID: 34408418, 29228616, 26885452] | |
| KIF18A | Involve in different types of cancer [PMID: 35591854, 35286090] | ||
| METTL15 | Associated with childhood obesity [PMID: 31504550] | (NA) | |
| AC090124.1 | (NA) | Reported to differentially prognostic of pancreatic cancer [PMID: 34307375] | |
| ARL14EP | Involve in WAGR syndrome [PMID: 36011342, 31511512] | ||
| DCDC1 | Involvement with eyes anomalies [PMID: 34773354, 34703991] | ||
| THEM7P | Associated with mechanisms underlying inguinal hernia [PMID: 34392144] | ||
| AL035078.2 | (NA) | ||
| ELP4 | |||
| LINC00678 | |||
| AC023206.1 | |||
| RN7SKP158 | |||
| AC104978.1 | |||
| MIR8068 | |||
| AC013714.1 | |||
| AC100773.1 | |||
| AC090833.1 | |||
| AC090791.1 | |||
| AC110056.1 | |||
| AL035078.2 | |||
| FAIM2 | PRPF40B | (NA) | Splicing regulator involved in T-cell development [PMID: 31088860, 34323272] |
| TMBIM6 | Deficiency leads to obesity by increasing Ca2+-dependent insulin secretion [PMID: 32394396] | Immune cell function and survival [PMID: 26470731] | |
| BCDIN3D | Associated with obesity, T2D [PMID: 20215397] | (NA) | |
| FAIM2 | Associated with childhood obesity [PMID: 31504550] | ||
| AQP2 | Associated with obesity, diabetes [PMID: 33367818] | ||
| AQP5 | Associated with non-obese diabetes [PMID: 25635992,22320885] | Responsible for transporting water, involve in Sjogren’s syndrome [PMID: 25635992, 31557796] | |
| AQP6 | Down-regulated in retina in diabetes [PMID: 21851171] | Associated with renal diseases [PMID: 30654539] | |
| RACGAP1 | Involve in diabetes nephropathy [PMID: 35222021] | (NA) | |
| ASIC1 | Inhibition increase food intake and decrease energy expenditure [PMID: 35894166] | ||
| LSM6P2 | (NA) | ||
| RPL35AP28 | |||
| LINC02396 | |||
| LINC02395 | |||
| AC025154.1 | |||
| AC025154.2 | |||
| ADCY9 | SLX4 | (NA) | Associated with blood pressure [PMID: 30671673] |
| DNASE1 | Associated with obesity hypertension [PMID: 33351325] | (NA) | |
| TRAP1 | Involve in global metabolic network, deletion reduce obesity incidence [PMID: 25088416] | ||
| CREBBP | Associated with high adiposity and low cardiometabolic risk [PMID: 33619380] | ||
| ADCY9 | Asoociated with BMI, obesity [PMID: 33619380, 23563607] | ||
| SRL | (NA) | Involve in cardiac dysfunction [PMID: 22119571] | |
| LINC01569 | Associated with cancer and endometriosis [PMID: 35341703, 34422671] | ||
| TFAP4 | Associated with BMI, birth weight, maternal glycemic [PMID: 35708509] | (NA) | |
| AC012676.1 | (NA) | Involve in hepatocellular carcinoma [PMID: 35210216] | |
| AC009171.2 | (NA) | ||
| FTO | FTO | Most extensively studied obesity locus [PMID: 34556834] | (NA) |
| IRX3 | Obesogenic effects in adipocytes [PMID: 26760096], brain [PMID: 24646999], pancreas[93] | ||
| IRX5 | |||
| AC018553.1 | (NA) | Associated with melanoma [PMID: 35611195] | |
| CRNDE | Regulator of angiogenesis in obesity-induced diabetes [PMID: 31863035] | (NA) | |
| MMP2 | Involve in obesity-relate angiogenesis [PMID: 35919566] | ||
| CAPNS2 | (NA) | Associated with thyroid-related traits [PMID: 23408906] | |
| AMFR | Involve in hepatic lipid metabolism [PMID: 33591966] | (NA) | |
| CETP | Involve in monogenic hyperalphalipoproteinemia [PMID: 34878751] | ||
| RPGRIP1L | Hypomorphism of this ciliary gene linked to morbid obesity [PMID: 27064284, 30597647, 29657248] | Required for hypothalamic arcuate neuron development [PMID: 30728336] | |
| LINC02169 | (NA) | Associated with occupational exposure to gases/fumes and mineral dust [PMID: 31152171] | |
| AC007491.1 | (NA) | ||
| AC018553.2 | |||
| LINC02140 | |||
| AC106738.1 | |||
| AC106738.2 | |||
| MTND5P34 | |||
| AC007336.1 | |||
| MC4R | AC090771.1 | (NA) | |
Additional files
-
Supplementary file 1
Supporting data tables.
(a) Data resources of 57 cell types. (b) Variant-to-gene mapping results (c) 60 enriched KEGG pathways by pathfindR analysis (d) 39 enriched KEGG pathways by customized SPIA analysis (e) Colocalization analysis summary from ColocQuiaL. Highlighted rows are concordance with variant-to-gene mapping (f) Predicted transcription factor binding by motifbreakR to be disrupted by obesity variants (g) 771 proxies in linkage with 19 original sentinel childhood obesity signals, reported by TopLD and Ldlink.
- https://cdn.elifesciences.org/articles/95411/elife-95411-supp1-v1.xlsx
-
MDAR checklist
- https://cdn.elifesciences.org/articles/95411/elife-95411-mdarchecklist1-v1.docx
Download links
A two-part list of links to download the article, or parts of the article, in various formats.
Downloads (link to download the article as PDF)
Open citations (links to open the citations from this article in various online reference manager services)
Cite this article (links to download the citations from this article in formats compatible with various reference manager tools)
3D genomic features across >50 diverse cell types reveal insights into the genomic architecture of childhood obesity
eLife 13:RP95411.
https://doi.org/10.7554/eLife.95411.3


