Evaluation of clonal hematopoiesis and mosaic loss of Y chromosome in cardiovascular risk: An analysis in prospective studies
- CHU de Bordeaux, Service des Maladies Coronaires et Vasculaires, France
- CHU de Bordeaux, Laboratoire d'hematologie, France
- Univ. Bordeaux, INSERM, Biologie des maladies cardiovasculaires, France
- Univ. Bordeaux, Bordeaux Population Health Research Center, INSERM, France
Figures
Figure 1 with 1 supplement
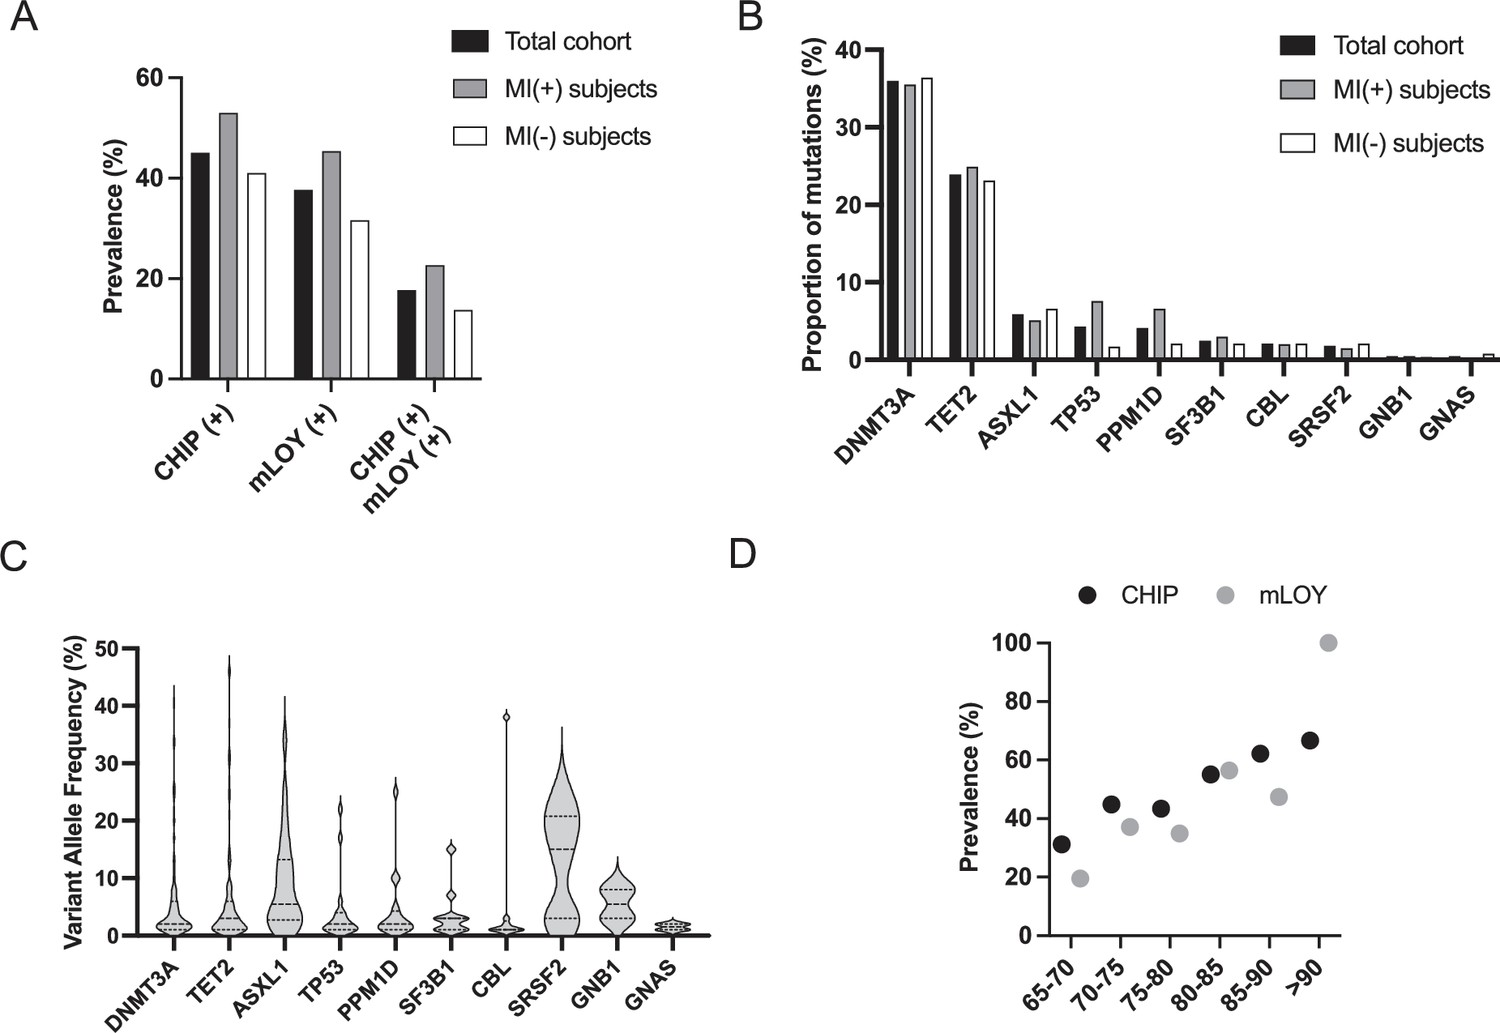
Clonal hematopoiesis of indeterminate potential (CHIP), mosaic loss of Y chromosome (mLOY) and their combination are as frequent in myocardial infarction (MI)(+) and MI(-) subjects.
(A) Prevalence of CHIP, mLOY, and their combination in the total cohort of 449 subjects, in MI(+) as well as in MI(-) subjects. (B) Mutational spectrum of CHIP expressed as the proportion of mutations detected in the indicated genes. (C) Variant allele frequency (VAF) measured for the different mutations detected in the 449 subjects detected in the indicated genes. (D) Prevalence of CHIP and mLOY depending on age in the total cohort (for CHIP) and in male subjects (for mLOY).
Figure 1—figure supplement 1
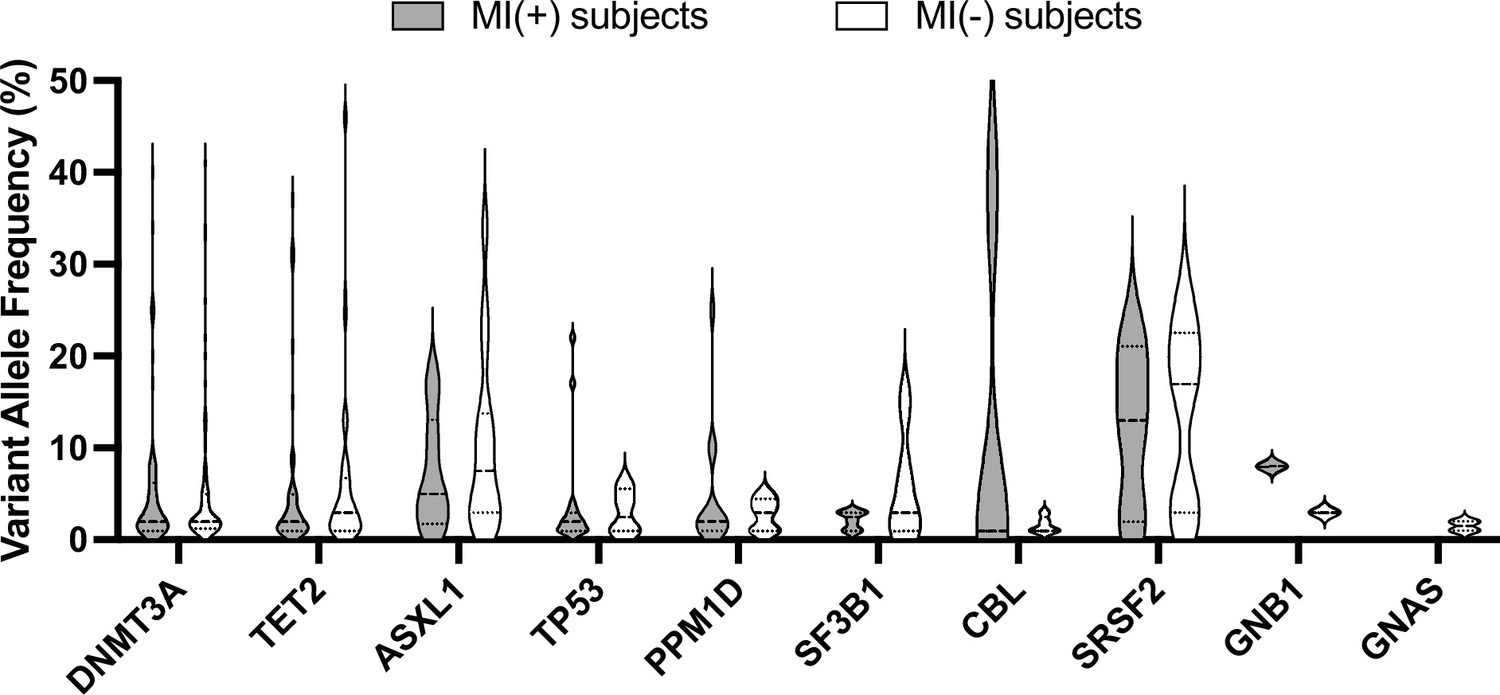
Variant allele frequency (VAF) of somatic mutations detected in myocardial infarction (MI)(+) and MI(-) subjects.
The graph represents the VAF measured for the different mutations detected in MI(+) and MI(-) subjects in the indicated genes.
Figure 2 with 1 supplement
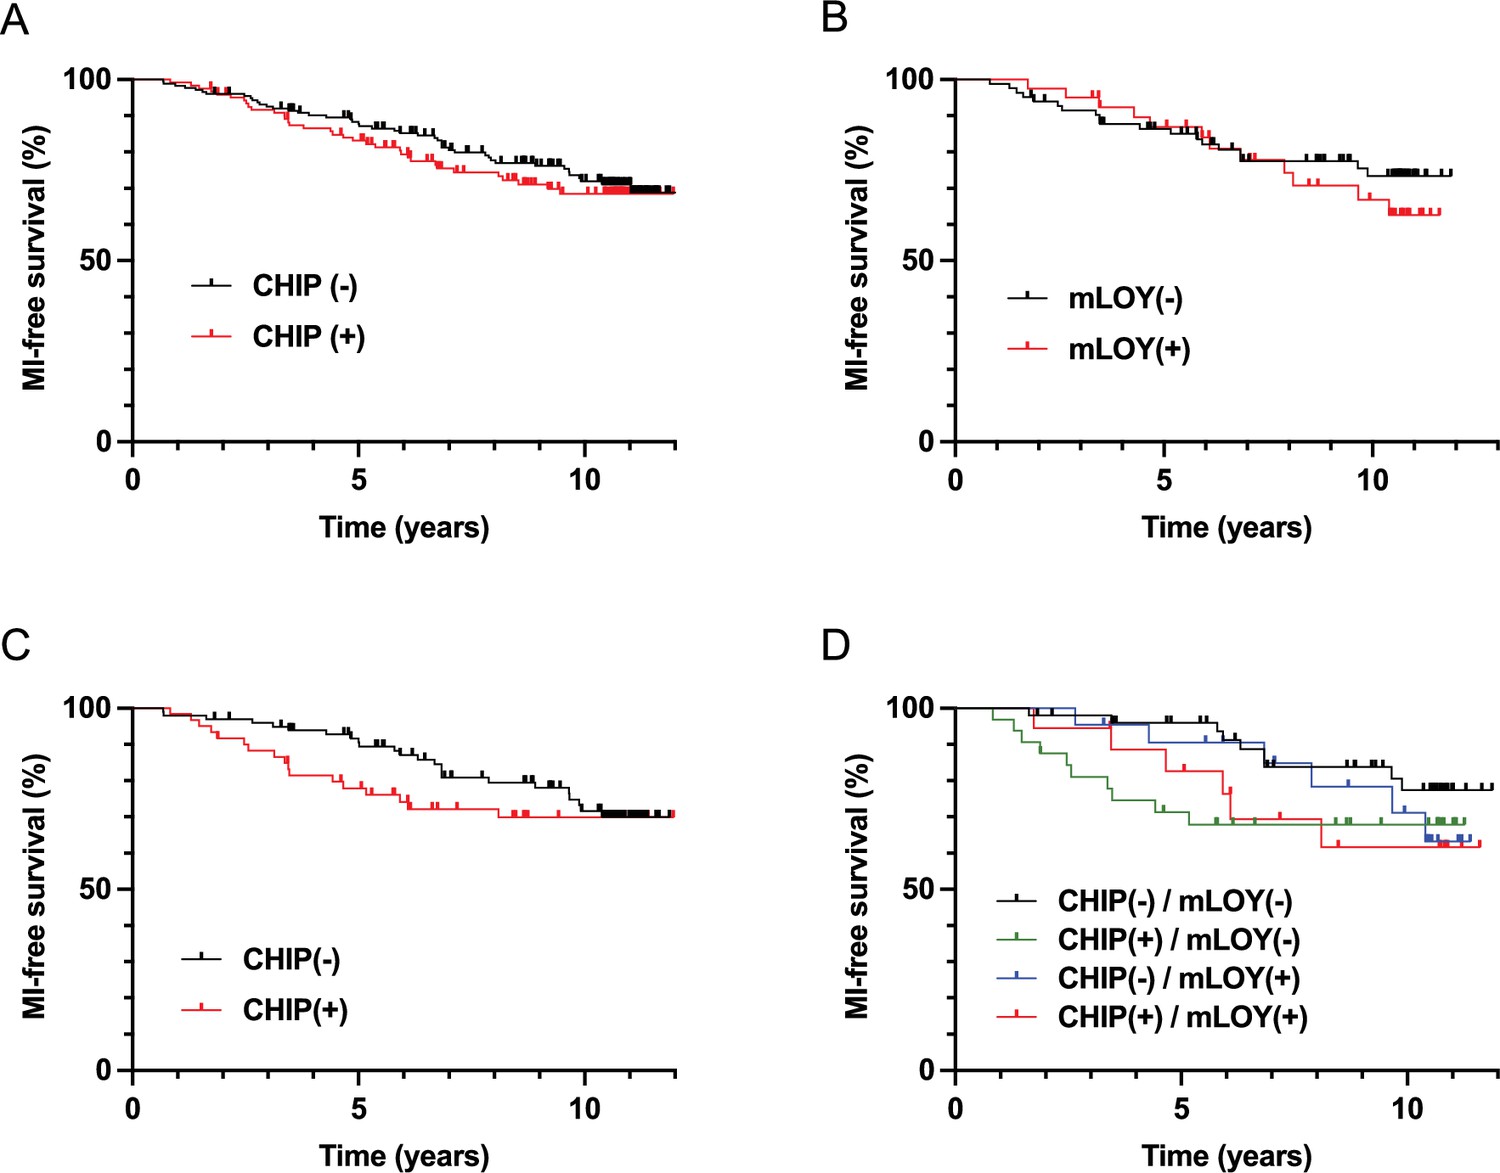
Clonal hematopoiesis of indeterminate potential (CHIP) and mosaic loss of Y chromosome (mLOY) do not increase significantly the risk of incident myocardial infarction (MI), but could accelerate it in male subjects.
Incidence of MI during follow-up according to the presence of CHIP (A) or mLOY (B) in MI(-) subjects. Incidence of MI during follow-up according to the presence of CHIP (C) or the combination of CHIP and mLOY (D) in male MI(-) subjects. Survival was compared between the different groups with log-rank tests.
Figure 2—figure supplement 1
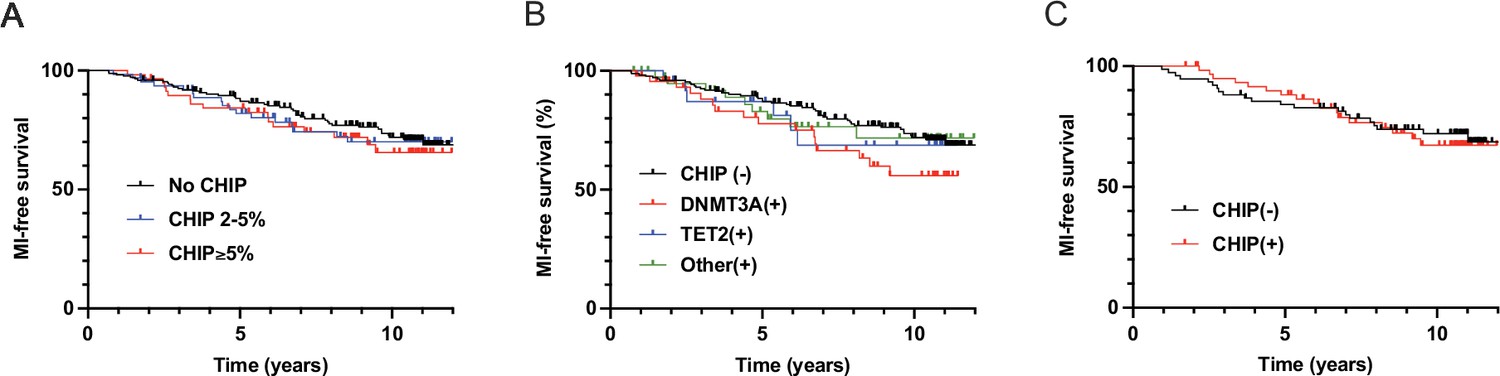
Clonal hematopoiesis of indeterminate potential (CHIP) do not increase significantly the risk of incident myocardial infarction (MI).
Incidence of MI during follow-up according to the variant allele frequency (VAF) (A) or the mutated gene (B) in MI(-) subjects. Incidence of MI during follow-up according to the presence of CHIP in MI(-) female subjects (C). Survival was compared between the different groups with log-rank tests.
Author response image 1

Tables
Key resources table
| Reagent type (species) or resource | Designation | Source or reference | Identifiers | Additional information |
|---|---|---|---|---|
| Sequence-based reagent | Primer-amel-Fwd | This paper | PCR primers | CCCCTGGGCACTGTAAAGAAT |
| Sequence-based reagent | Primer-amel-Rev | This paper | PCR primers | CCAAGCATCAGAGCTTAAACTG |
| Sequence-based reagent | Probe-amelX | This paper | PCR probe | CCAAATAAAGTGGTTTCTCAAGT |
| Sequence-based reagent | Probe-amelY | This paper | PCR probe | CTTGAGAAACATCTGGGATAAAG |
| Commercial assay or kit | ddPCR supermix for Probes (no dUTP) | Biorad | PCR mix | |
| Commercial assay or kit | SureSelect XT Low Input kit | Agilent | NGS custom RNA-baits panel | |
| Software, algorithm | Quantasoft | Biorad | Analysis software | |
| Software, algorithm | R | CRAN | https://www.r-project.org/ |
Table 1
Subjects' characteristics.
| All subjectsn=446 | MI(+) subjectsn=149 | MI(-) subjectsn=297 | p-value | ||||
|---|---|---|---|---|---|---|---|
| Male, n (%) | 257 (57.6) | 98 (66) | 159 (54) | 0.015 | |||
| Median age, years (Q1;Q3) | 76.4 (71.9;80.9) | 82.0 (78.0;86.0) | 73.6 (70.6;77.8) | p<10–4 | |||
| Cardiovascular risk factors | |||||||
| BMI, kg/m2 (Q1;Q3) | 25.5 (23.6;28.3) | 25.5 (23.6;28.5) | 25.5 (23.6;28.1) | 0.14 | |||
| Diabetes, n (%) | 94 (21.2) | 47 (32%) | 47 (16%) | p<10–4 | |||
| Hypertension, n (%) | 362 (82.8) | 107 (76.4) | 255 (85.9) | 0.020 | |||
| Total cholesterol, g/L (Q1;Q3) | 2.08 (1.72;2.38) | 1.45 (1.25;1.72) | 2.23 (2.00;2.47) | p<10–4 | |||
| LDL-c, g/L (Q1;Q3) | 1.25 (0.94;1.52) | 0.77 (0.61;1.03) | 1.39 (1.19;1.60) | p<10–4 | |||
| HDL-c, g/L (Q1;Q3) | 0.56 (0.46;0.66) | 0.47 (0.39;0.57) | 0.59 (0.50;0.68) | p<10–4 | |||
| Smoking, n (%) | 32 (7.2) | 6 (4.4) | 26 (8.7) | 0.117 | |||
| Prevalence of CHIP and mLOY | |||||||
| CHIP prevalence, n (%) | 201 (45.1) | 79 (53%) | 122 (41%) | 0.923 | |||
| Prevalence of CHIP with VAF ≥5% | 88 (19.7) | 30 (20.1) | 58 (19.5) | 0.069 | |||
| Subjects tested for mLOY, n | 220 | 97 | 123 | - | |||
| mLOY prevalence, n (%) | 83 (37.7) | 44 (45.4) | 39 (31.7) | 0.783 | |||
| CHIP(+) / mLOY(+) prevalence, n (%) | 39 (17.7) | 22 (22.7) | 17 (13.8) | 0.797 | |||
-
Data are expressed as numbers and frequency or median, first and third quartiles. For quantitative values, comparisons were made by linear regression of log values adjusted for age and sex. For qualitative parameters, comparisons were made by the fisher test. For each variable, results are expressed among patients with available value.
Table 2
.CHIP and mLOY are not associated with increased hsCRP level.
| hsCRP level All subjects | p value | hsCRP level MI(+) subjects | p value | hsCRP level MI(-) subjects | p value | |
|---|---|---|---|---|---|---|
| CHIP(-) | 1.64 (1.00;3.69) | 0.652 | 1.40 (1.00;4.00) | 0.600 | 1.71 (0.97;3.22) | 0.141 |
| CHIP(+) | 2.00 (1.00:3.90) | 2.20 (1.10;5.00) | 1.63 (0.91;2.54) | |||
| mLOY(-) | 1.45 (0.99;2.75) | 0.156 | 1.8 (1.0;4.8) | 0.149 | 1.41 (0.74;2.16) | 0.358 |
| mLOY(+) | 1.73 (1.01;4.00) | 2.4 (1.03;4.5) | 1.2 (0.99;2.99) | |||
| CHIP (-) mLOY (-) | 1.11 (0.76;2.19) | 0.410 | 1.00 (0.77;2.72) | 0.430 | 1.35 (0.79;2.14) | 0.570 |
| CHIP (+) mLOY (-) | 1.87 (1.00;3.03) | 2.30 (1.35;7.35) | 1.43 (0.72;2.37) | |||
| CHIP (-) mLOY (+) | 2.20 (1.02;4.00) | 2.50 (1.30;4.00) | 1.37 (0.95;3.75) | |||
| CHIP (+) mLOY (+) | 1.23 (1.01;3.80) | 2.00 (1.02;4.75) | 1.17 (1.03;1.73) |
-
hsCRP Data are expressed as median, first and third quartiles. Comparisons were performed by linear regression of log values adjusted for age and sex. hsCRP levels are expressed in mg/L For each variable, results are expressed among patients with available value.
Table 3
CHIP and mLOY are not associated with an increased atherosclerotic burden.
| Atherosclerosis burden evaluation in MI(+) subjects | |||||||
|---|---|---|---|---|---|---|---|
| All patients (n=149) | CHIP (-) (n=70) | CHIP (+) (n=79) | p-value | mLOY (-) (n=53) | mLOY (+) (n=44) | p-value | |
| Multitroncular lesions, n (%) | 68 (45.6) | 29 (41.4) | 39 (49.4) | 0.484 | 25 (47.2) | 20 (45.4) | 0.717 |
| Carotid stenosis ≥50%, n (%) | 7 (4.7) | 2 (2.8) | 5 (6.3) | 0.317 | 2 (3.8) | 3 (6.8) | 0.451 |
| Global atheroma volume (mm3), median (Q1;Q3) | 499.5 (408.0;604.5) | 455.0 (374.0;555.0) | 520.0 (411.5;611.5) | 0.333 | 601.0 (412.0;718.0) | 492.0 (344.5;600.5) | 0.707 |
| Atherosclerosis burden evaluation in MI(-) subjects | |||||||
| All patients (n=297) | CHIP (-) (n=175) | CHIP (+) (n=122) | p-value | mLOY (-) (n=84) | mLOY (+) (n=39) | p-value | |
| Patients with atherosclerotic plaque, n (%) | 135 (45.4) | 81 (46.3) | 54 (44.3) | 0.997 | 34 (40.5) | 19 (48.7) | 0.537 |
| Number of plaque, median (Q1;Q3) | 1 (1;2) | 2 (1;2) | 1 (1;2) | 0.258 | 2 (1;2) | 2 (1;2) | 0.863 |
| Intima Media Thickness (mm), median (Q1;Q3) | 0.68 (0.60;0.76) | 0.67 (0.60;0.76) | 0.68 (0.59;0.74) | 0.897 | 0.67 (0.62;0.76) | 0.72 (0.57;0.83) | 0.706 |
-
Data are expressed as numbers and frequency or median, first and third quartiles. For quantitative values, comparisons were made by linear regression of log values adjusted for age and sex. For qualitative parameters, comparisons were made by the fisher test and logistic regression. For each variable, results are expressed among patients with available value.
Additional files
-
Supplementary file 1
Additionnal data about genetic, inflammatory and atheroscletrotic parameters in the studied subjects.
(a) Targeted sequencing panel used in the laboratory of Hematology of the University Hospital of Bordeaux for the diagnosis and follow-up of myeloid hematological malignancies and used in this study. (b) Characteristics of the identified mutations according to the degree of certainty of their pathogenicity (deleterious, possibly deleterious, or variant of undetermined significance). Exceptions: ASXL1/ASXL2/TET2: only variants resulting in a truncated protein were retained as deleterious variants (A). For TET2, missense mutations were retained only when they affected CD1 or CD2 domain ANKRD26: non-coding region 5’-UTR was retained. TP53: database IARC (https://p53.iarc.fr/) was used for the classification. * Only variants classified as A or B are retained as clonal hematopoiesis of indeterminate potential (CHIP) in the study. (c) Mutational profile of CHIP(+) MI(+) subjects. (d) Mutational profile of CHIP(+) MI(-) subjects. (e) Comparison of characteristics of MI(+) subjects depending on their CHIP and mosaic loss of Y chromosome (mLOY) status. (f) comparison of characteristics of MI(-) subjects depending on their CHIP and mLOY status. For statistical analysis, logistical regression (adjusted on age and sex) and/or Fisher’s test were used to compare qualitative variables, and linear regression (adjusted on age and sex) and/or ANOVA were used to compare quantitative variables. Blood counts were not available for MI(-) subjects. (g) CHIP associated with DNMT3A or TET2 mutations do not present differential effect on inflammation or atherosclerotic burden. Data are expressed as numbers and frequency or median, first, and third quartiles. For quantitative values, comparisons were made by linear regression of log values adjusted for age and sex. For qualitative parameters, comparisons were made by the fisher test. (h) Important clones of CHIP and mLOY are not associated with increased inflammation, atherosclerosis, or CVE. Data are expressed as numbers and frequency or median, first, and third quartiles. For quantitative values, comparisons were made by linear regression of log values adjusted for age and sex. For qualitative parameters, comparisons were made by the Fisher test and logistic regression. For each variable, results are expressed among patients with available values. (i) mLOY do not impact the atherosclerotic burden in the presence of CHIP. Data are expressed as numbers and frequency or median, first and third quartiles. For quantitative values, comparisons were made by linear regression of log values adjusted for age and sex. For qualitative parameters, comparisons were made by the Fisher test. For each variable, results are expressed among patients with available values. (j) Characteristics of MI(-) patients at the time of inclusion depending on whether they presented a myocardial Infarction (MI) during follow-up or not. Data are expressed as numbers and frequency or median, first and third quartiles. For quantitative values, comparisons were made by linear regression of log values adjusted for age and sex. For qualitative parameters, comparisons were made by the Fisher test and logistic regression. For each variable, results are expressed among patients with available values. (k) CHIP may accelerate the incidence MI in the absence of mLOY in male subjects. Data are expressed as numbers and frequency or median, first and third quartiles. For the ‘time to MI’ in MI(-) subjects, comparisons were performed by the Mann-Whitney test for CHIP and mLOY separately and the Kruskall-Wallis test for combinations of CHIP +/- mLOY. For qualitative parameters, comparisons were made by the Fisher test. For each variable, results are expressed among patients with available values.
- https://cdn.elifesciences.org/articles/96150/elife-96150-supp1-v1.docx
-
MDAR checklist
- https://cdn.elifesciences.org/articles/96150/elife-96150-mdarchecklist1-v1.docx
Download links
A two-part list of links to download the article, or parts of the article, in various formats.
Downloads (link to download the article as PDF)
Open citations (links to open the citations from this article in various online reference manager services)
Cite this article (links to download the citations from this article in formats compatible with various reference manager tools)
Evaluation of clonal hematopoiesis and mosaic loss of Y chromosome in cardiovascular risk: An analysis in prospective studies
eLife 13:RP96150.
https://doi.org/10.7554/eLife.96150.3


