A microglia clonal inflammatory disorder in Alzheimer’s disease
- Immunology Program, Sloan Kettering Institute, Memorial Sloan Kettering Cancer Center, New York, United States
- Department of Physiology and Biophysics, Institute for Computational Biomedicine, Weill Cornell New York, United States
- Department of Physiology and Biophysics, Stony Brook University School of Medicine, Stony Brook, United States
- Marie-Josée & Henry R. Kravis Center for Molecular Oncology, Memorial Sloan Kettering Cancer Center, New York, United States
- St. Giles Laboratory of Human Genetics of Infectious Diseases, Rockefeller Branch, The Rockefeller University, New York, United States
- Human Oncology & Pathogenesis Program, Memorial Sloan Kettering Cancer Center, New York, United States
- Department of Pathology, Memorial Sloan Kettering Cancer Center, New York, United States
- SKI Stem Cell Research Core, Memorial Sloan Kettering Cancer Center, New York, United States
- Third Rock Ventures, United States
- Netherlands Brain Bank, Netherlands
Figures
Figure 1 with 1 supplement
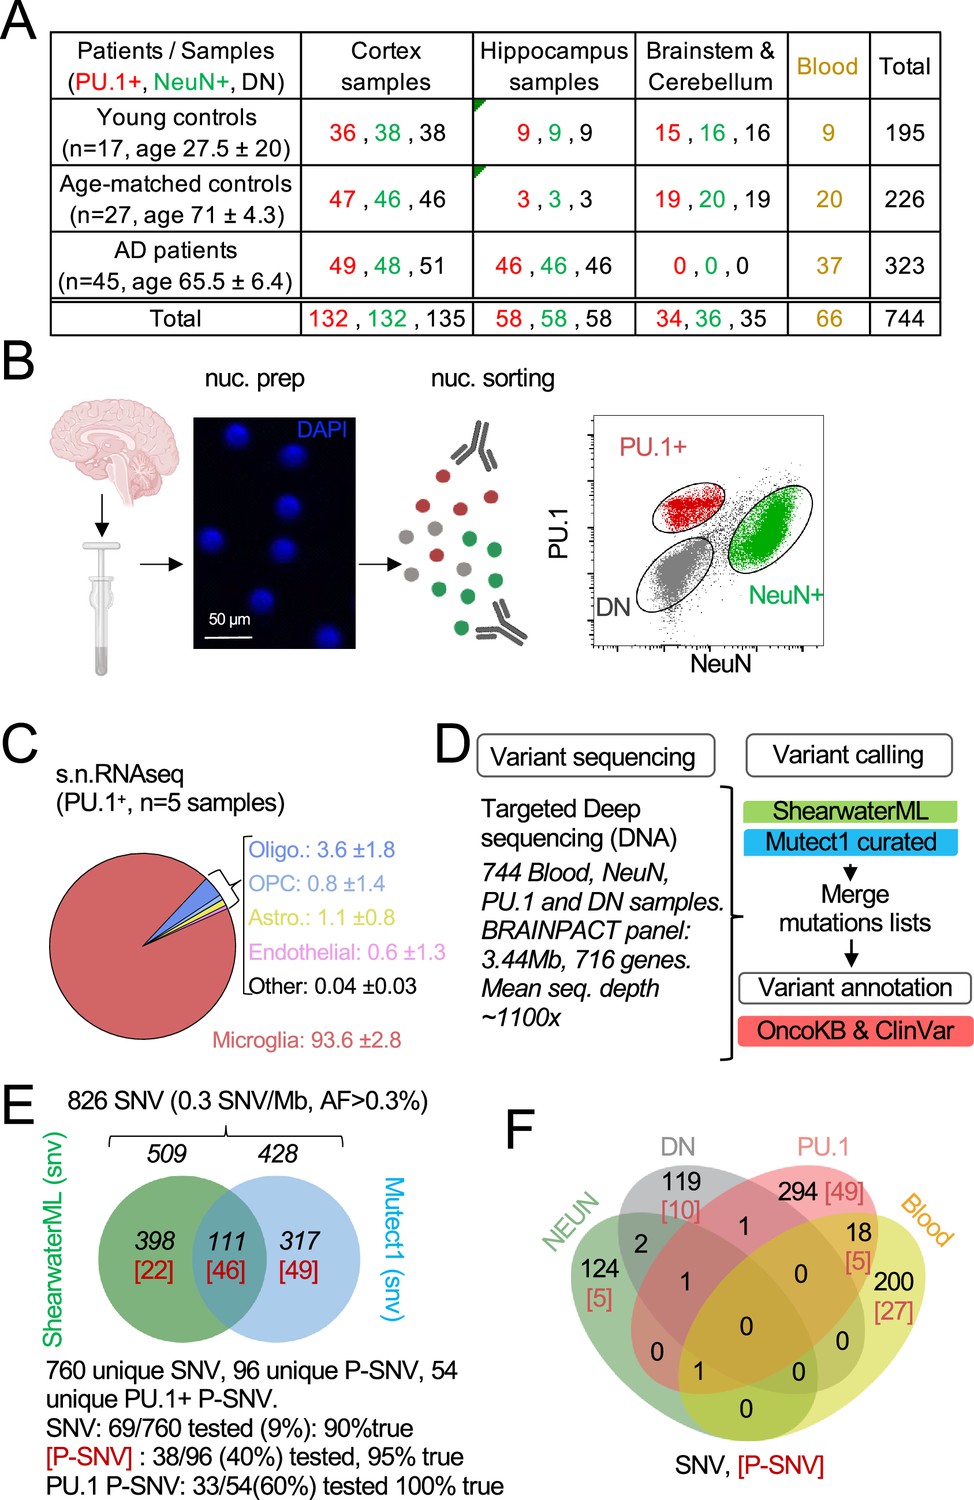
Detection of mutations in brain cell types and blood.
(A) Table with patient and sample information. (B) Schematic represents the isolation and labeling of nuclei from post-mortem frozen brain samples from controls and Alzheimer’s disease patients with DAPI and antibodies against PU.1+ (myeloid/microglia) and NeuN+ (neurons). Representative flow cytometry dot-plot of nuclei separation. Double negative nuclei are labeled ‘DN.’ (C) Percentage of cell types obtained in sorted PU.1+ nuclei determined by single-nuclei RNAseq in five brain samples from four individuals. (D) Schematic represents the sequencing strategy. Two algorithms (ShearwaterML and Mutect1) were used for variant calling. After annotation, pathogenicity was determined using OncoKb and ClinVar. (E) Venn diagram represents the number of variants and overlap between the ShearwaterML and Mutect1. Numbers in red indicate pathogenic variants (P-SNV). Validation of variants was performed by droplet digital (dd)PCR on pre-amplified DNA when available. (F) Venn diagrams represent the repartition per cell type of the 826 single-nucleotide variations (SNVs) identified in NeuN+: Neurons, PU.1+: microglia, DN: glia, and matching blood. [Numbers] in red indicate pathogenic variants P-SNV.
-
Figure 1—source data 1
Source data for panel 1C.
- https://cdn.elifesciences.org/articles/96519/elife-96519-fig1-data1-v1.xlsx
Figure 1—figure supplement 1
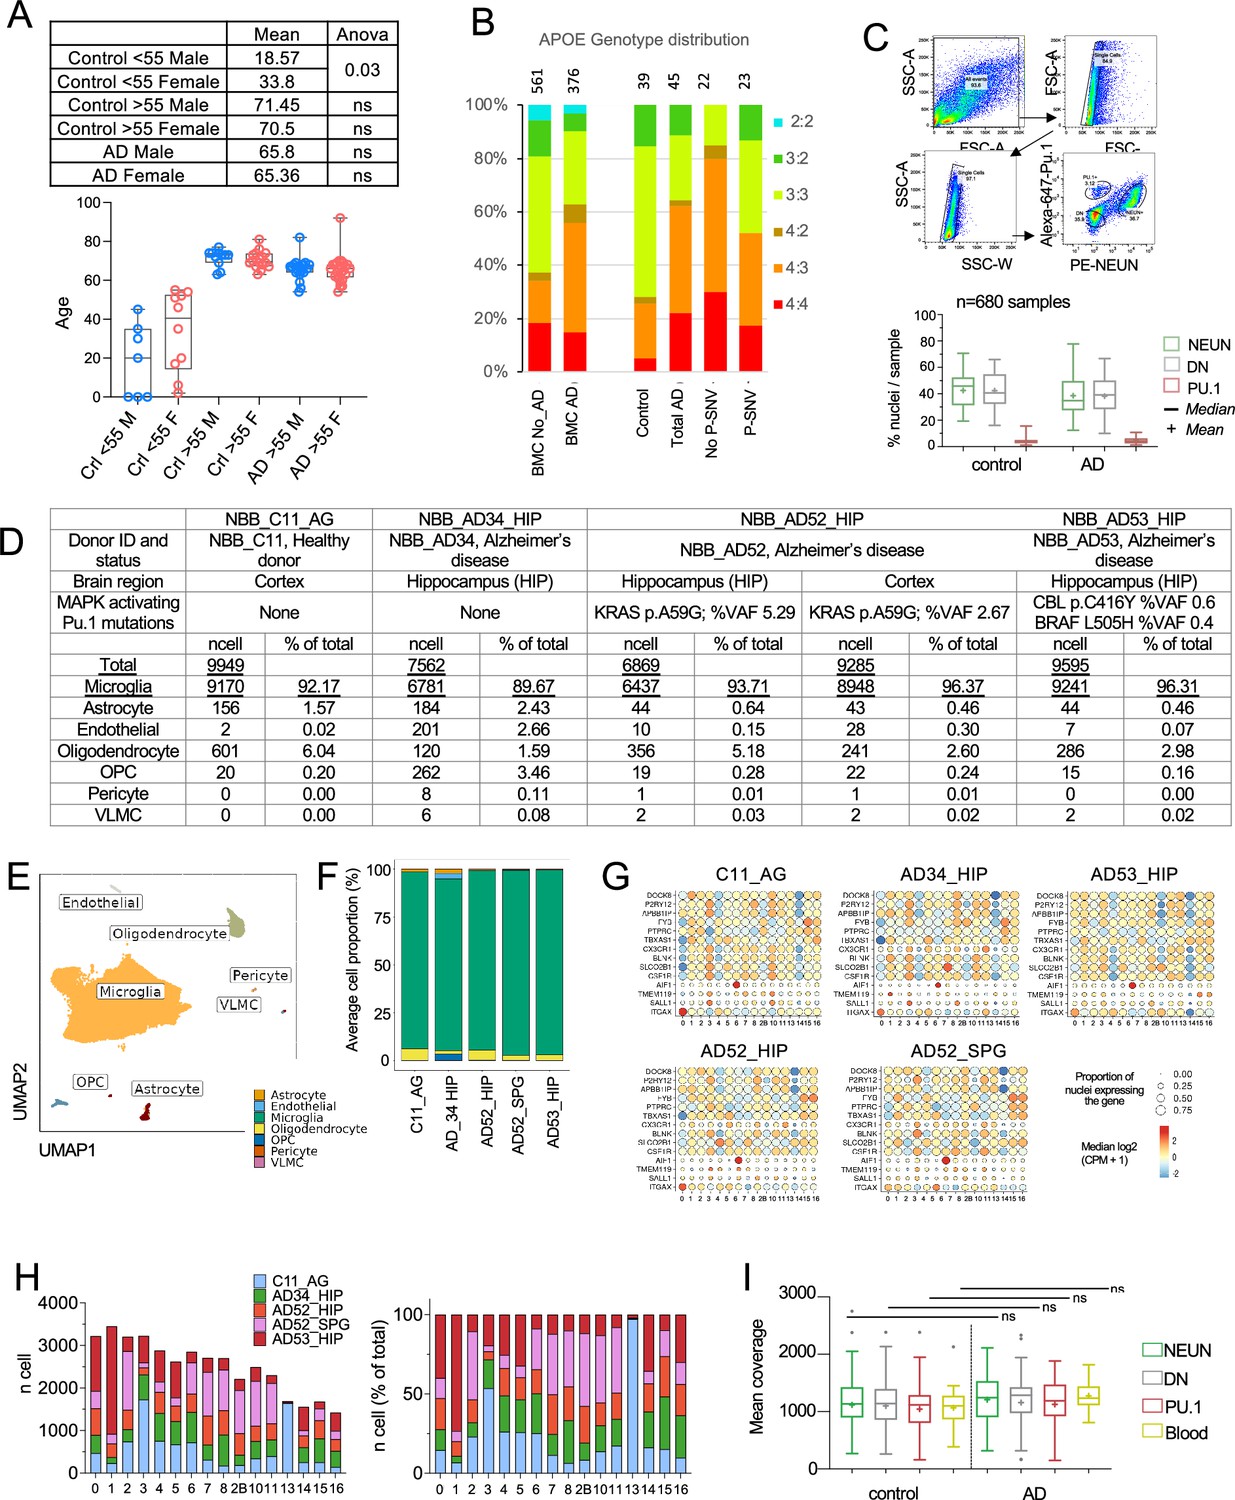
Quality control for DNA analysis and snRNA-seq.
(A) Patients characterisitic: age and sex distribution of young controls, age-matched control,s and Alzheimer’s disease (AD) patients, Statistics: two-way Anova. (B) Distribution of apolipoprotein E (APOE) genotype in a historical cohort of controls and AD patients (Karch and Goate, 2015) (Left) and the present series (Right) of Control, AD and AD without and with pathogenic (P-SNV) microglia variants. Numbers on top of the bars show patient number in each group. (C) Sorting strategy to separate PU.1+, NEUN+ , and DN nuclei from post-mortem brain samples. Boxplot represents relative frequencies, median, mean, 25-75th quartiles (boxes) and minimum/maximum (whiskers) of nuclei for each cell type in controls (n=63 brain samples) and AD patients (n=99 brain samples). (D) SnRNA-seq analysis of Facs-sorted PU.1+nuclei from four donors. Table indicate donor characteristics, number of nuclei analyzed after quality control (see methods) and cell types as determined by unsupervised clustering of normalized and integrated gene expression of nuclei from five PU.1+ samples. (E) Uniform Manifold Approximation and Projection (UMAP) representation of cell types from (C). (E) Cell proportion plot of the 5 PU.1+ samples from (C). (F) Boxplot showing the coverage of targeted DNA deep sequencing per cell type in AD and control samples. Box plots show median (+mean) and 25th and 75th percentiles; whiskers extend to the largest and smallest values. Dots show outliers. (G) Expresion of microglia markers by snRNA-seq across samples and clusters. (H) Number (TOP) and proportiton (BOTTOM) of cells from each sample, per-cluster. (I) Boxplot showing the coverage of targeted DNA deep sequencing per cell type in AD and control samples. Box plots show median (+mean) and 25th and 75th percentiles; whiskers extend to the largest and smallest values. Dots show outliers.
-
Figure 1—figure supplement 1—source data 1
Source data corresponding to panels A, B, C, and I.
- https://cdn.elifesciences.org/articles/96519/elife-96519-fig1-figsupp1-data1-v1.xlsx
Figure 2 with 2 supplements
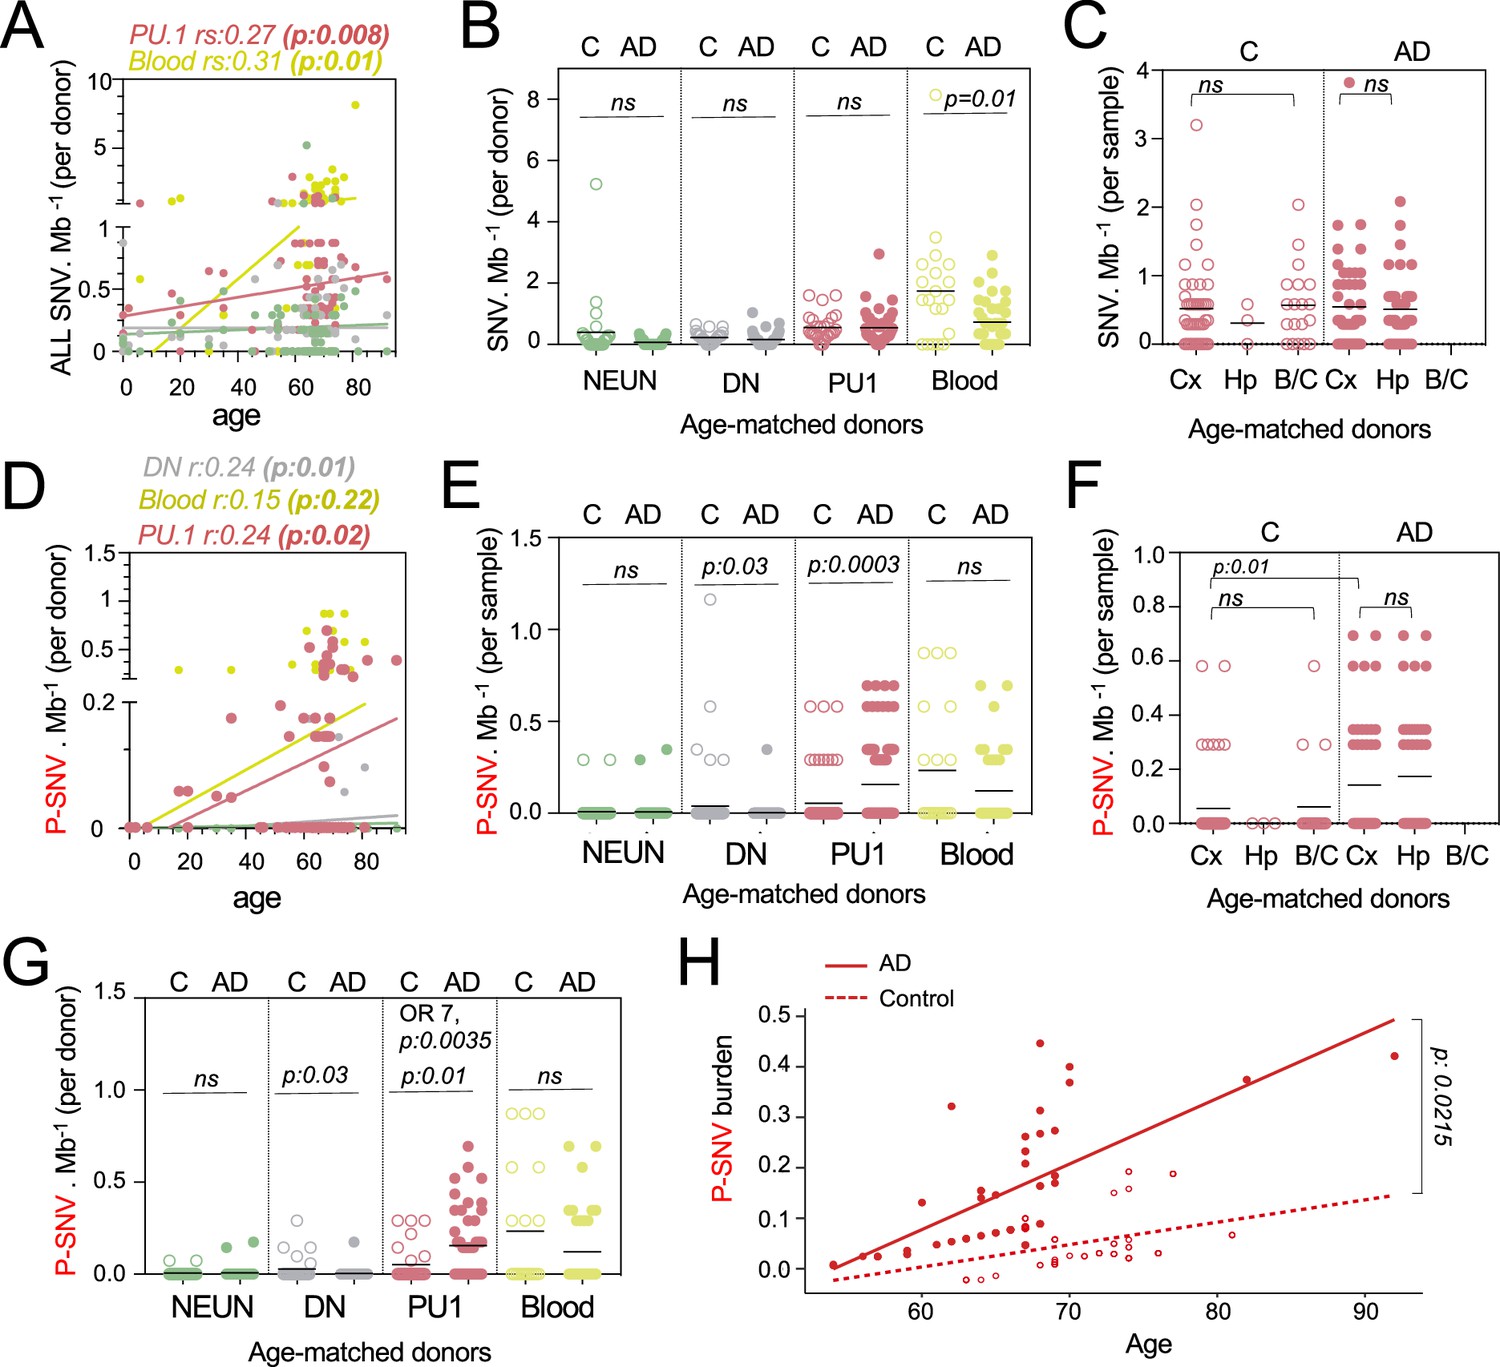
Pathogenic variants are enriched in microglia from Alzheimer’s disease (AD) patients.
(A) Correlation plot represents the mean number of variants per cell type and donor (n=89) (Y-axis), as a function of age (X-axis). Each dot represents mean value for a donor. Statistics: fitted lines, the correlation coefficients (rs), and associated p-values were obtained by linear regression (Spearman’s correlation). (B) Number of single-nucleotide-variation (SNV) per Mb and cell types per donor, of age-matched controls (n=27) and AD patients (n=45). Each dot represents mean value for a donor. Statistics: p-values are calculated with unpaired two-tailed Mann-Whitney U. Note: non-parametric tests were used when data did not follow a normal distribution (D'Agostino-Pearson normality test). (C) Number of SNV per Mb in PU.1+ samples across brain regions, of age-matched controls (n=27) and AD patients (n=45). Each dot represents a sample. Statistics: p-values are calculated with Kruskal–Wallis, multiple comparisons. Note: non-parametric tests were used when data did not follow a normal distribution (D'Agostino-Pearson normality test). (D) Correlation plot represents the mean number of pathogenic variants (P-SNV) as determined by ClinVar and/or OncoKB, per cell type and donor (n=89) (Y-axis), as a function of age (X-axis). Each dot represents mean value for a donor. Statistics: fitted lines, the correlation coefficients (rs) and associated p values were obtained by linear regression (Spearman’s correlation). (E) Number of P-SNV per Mb and cell types per sample, of age-matched controls (n=27) and AD patients (n=45). Each dot represents a sample. Statistics: p-values are calculated with unpaired two-tailed Mann-Whitney U. Note: non-parametric tests were used when data did not follow a normal distribution (D'Agostino-Pearson normality test). (F) Number of P-SNV per Mb in PU.1 samples across brain regions, of age-matched controls (n=27) and AD patients (n=45). Each dot represents a sample. Statistics: p-values for comparison within each group (controls and patients) are calculated with Kruskal–Wallis test and Dunn’s test for multiple comparisons. p-values for the comparison of P-SNV between the cortex of C and the cortex of AD (0.01) was calculated with unpaired two-tailed Mann-Whitney U. Note: non-parametric tests were used when data did not follow a normal distribution (D'Agostino-Pearson normality test). (G) Number of P-SNV per Mb and cell types per donor for age-matched controls (n=27) and AD patients (n=45). Each dot represents mean value for a donor. Statistics: p-values are calculated with unpaired two-tailed Mann-Whitney U test. Odds ratio (95% CI, 2.049–29.02) and p values for the association between AD and the presence of pathogenic variants are calculated by multivariate logistic regression, with age and sex as covariates. (H) P-SNV burden as a function of age and disease status (age-matched controls and AD). Linear lines represent trend lines from mixed-effects linear regression that incorporates individual donor as a random effect (blue, control: p=0.0025, R^2=0.13; red, NDD: P=9.1 × 10^–16, R^2=0.50 by Pearson’s correlation). The model’s total explanatory power is substantial (conditional R^2=0.48). Both age and AD are associated with a significant increase in SNV burden in this model (P<1 × 10^–4 and P=1 × 10^–4, respectively, by likelihood ratio test). Anatomical regions of the brain specimen and originating brain banks were not incorporated because the models incorporating those parameters did not significantly improve the overall model fitting by likelihood ratio test (see Methods). Graph depicts SNV burden corrected by the mixed-effects model (See Figure 2—figure supplement 1E for observed P-SNV burden).
-
Figure 2—source data 1
Data corresponding to panels A, B, C, D, E, F, G, and H.
- https://cdn.elifesciences.org/articles/96519/elife-96519-fig2-data1-v1.xlsx
Figure 2—figure supplement 1
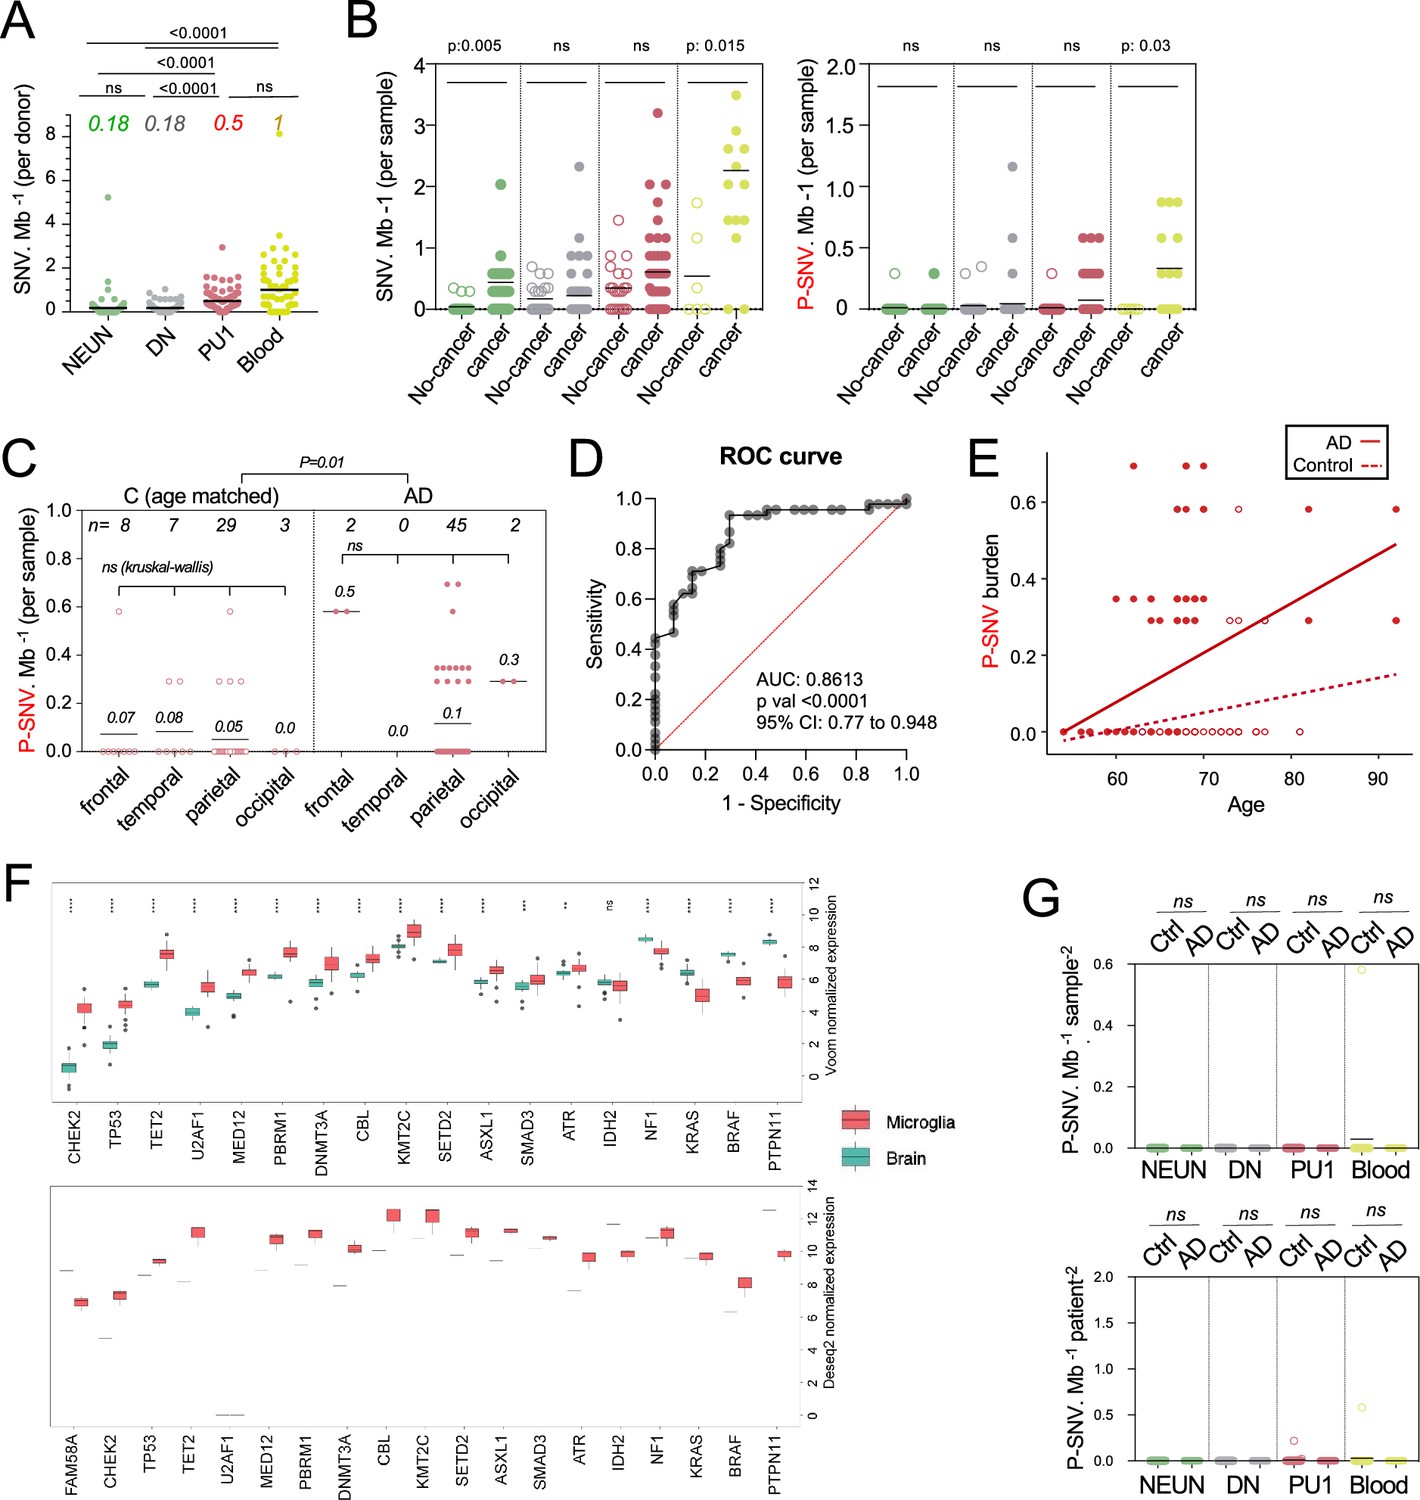
Analysis of pathogenic variants.
(A) Number of single-nucleotide-variation (SNV) per Mb, per donor, and cell types. Each dot represents the mean of a donor. NeuN n=226, DN n=229, PU.1 n=225, Blood n=66). Values (color, italics) indicate the mean number of variants /Mb per cell type. Statistics: p-value are calculated by Kruskal–Wallis test and Dunn’s test for multiple comparisons. (B) Number of SNV (Left) and P-SNV (right) per Mb in controls (age-matched with the patients) with or without cancer per sample and cell types. Each dot represents a sample. Statistics: p-values within each group are calculated with Kruskal–Wallis, multiple comparisons. (C) Number of SNV per Mb in PU.1 samples across cortical samples, of age-matched controls (n=27) and Alzheimer’s disease (AD) patients (n=45). Each dot represents a sample. Statistics: p-values within each group are calculated with Kruskal–Wallis, multiple comparisons. (D) Receiver operating characteristic (ROC) curve showing the accuracy of the multivariate logistic regression model in predicting the association of AD and the presence or not of pathogenic variants in PU.1+ nuclei. Note: non-parametric tests were used as data did not follow a normal distribution (D'Agostino-Pearson normality test). (E) Observed SNV burden for Figure 2H. (F) Expression of pathogenic genes in microglia and whole brain tissue, reported in Koh et al., 2018 (TOP, sorted microglia n=39, and whole brain n=16) and Lim et al., 2015 (BOTTOM, sorted microglia n=3 and whole brain n=1. (G) Graph depicts mean number of pathogenic variants in a group of control genes not expressed by the brain or by microglia (see Supplementary file 3), per Mb, and samples (LEFT) and donor (RIGHT), in NEUN, DN, PU.1 nuclei and matching blood from all controls and AD patients. Each dot represents the mean for each donor. Statistics: p-values are calculated with unpaired two-tailed Mann-Whitney U test comparing AD to controls.
-
Figure 2—figure supplement 1—source data 1
Data corresponding to panels A, B, C, D, E, and G.
- https://cdn.elifesciences.org/articles/96519/elife-96519-fig2-figsupp1-data1-v1.xlsx
Figure 2—figure supplement 2
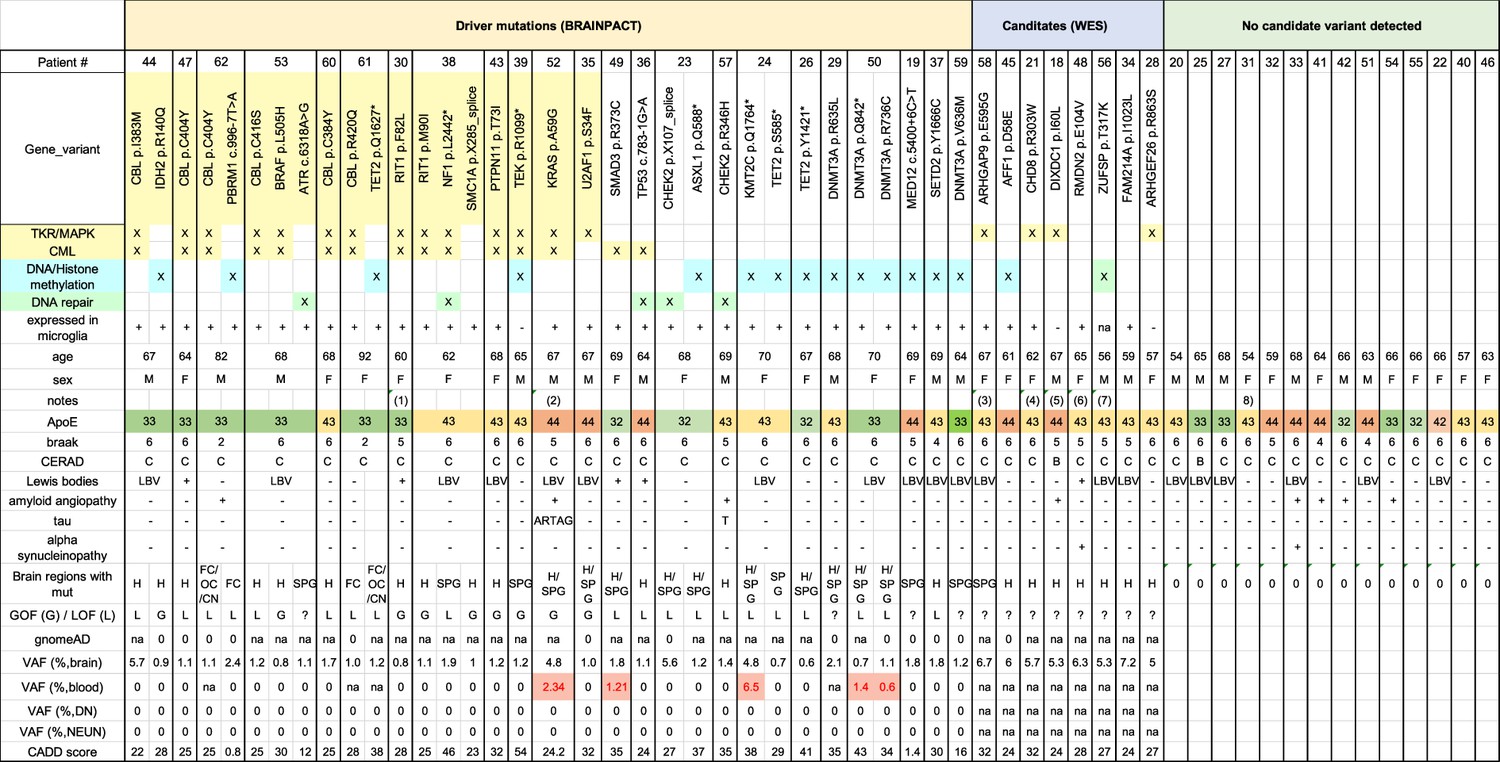
Summary of Alzheimer’s disease (AD) patients characteristics and pathogenic variants.
Table shows for all AD patients studied, the detection of pathogenic variants by targeted deep sequencing (TDS), candidates identified by whole exome sequencing (WES), categories of gene functions (MAPK pathway, DNA repair, DNA/Histone methylation), expression in microglia, and patient information (age/sex/Apoe genotype/braak status/CERAD score/presence of lewis bodies/presence of amyloid angiopathy). #Brain regions: number of brain regions where variant was detected. GOF (G, Gain of Function)/LOF (L, Loss of Function) as reported in bibliography (see manuscript for references). gnomeAD shows the minor allele frequency of each variant in the population. VAF: variant allelic frequency (%) by BRAIN-PACT in brain cell types and matching-blood when available. CADD score (Combined Annotation Dependent Depletion) of each variant. Notes: (1) Trisomy 21, Down syndrome. (2) familial history of AD, no variant in AD-associated genes. (3) MAPK docking protein. (4) cooperative interaction with ELK1 on chromatin. (5) inhibits JNK activation, murine KO has a neurological phenotype (Turner et al., 2013; Martin et al., 2018) (6) microtubule binding, involved in b-amyloid aggregation. (7) DNA repair gene. (8) Mosaic trisomy 21.
Figure 3 with 1 supplement
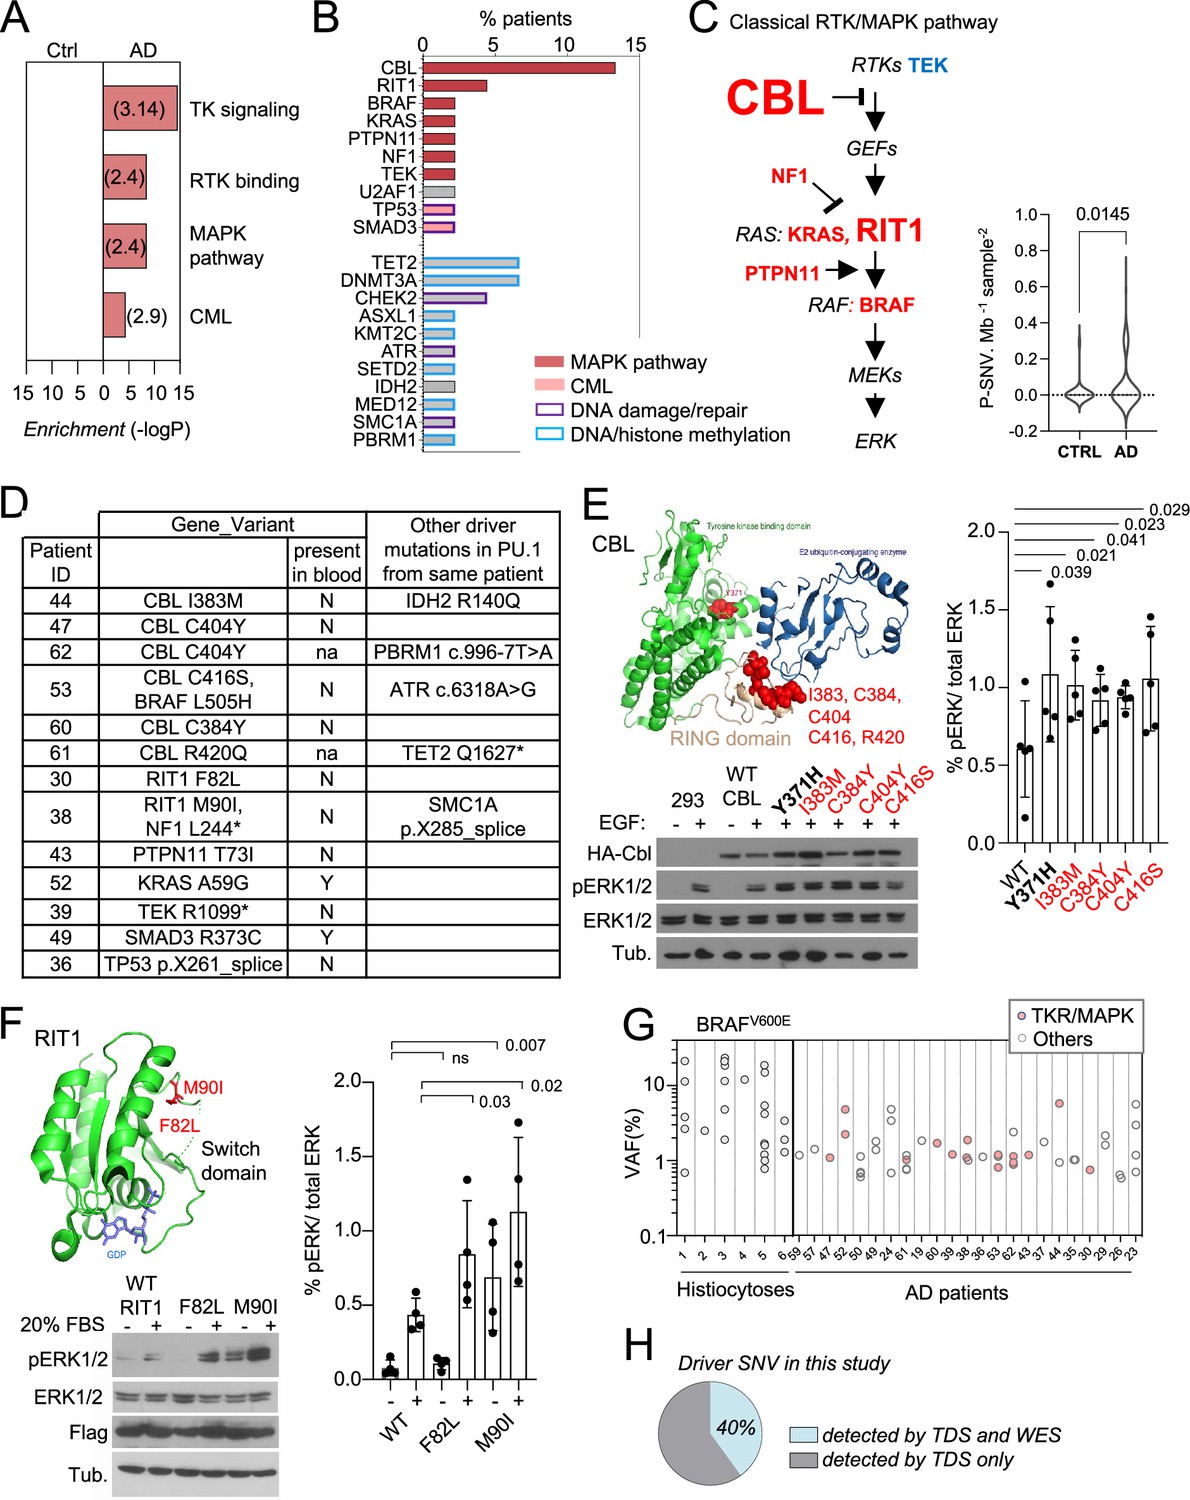
Somatic microglial clones with multiple and recurrent CBL and MAP-Kinase pathway activating variants.
(A) Pathway enrichment analysis for the genes target of pathogenic variants (P-SNVs) using the panel of 716 genes as background set. Graph shows the most enriched pathways by: Reactome Gene Sets, GO Molecular Functions, Canonical Pathways and KEGG Pathway (see complete list in Supplementary file 4). (B) Bar plot indicates the genes carrying P-SNV (y-axis) and the % of Alzheimer’s disease (AD) patients carrying P-SNV for each gene (x-axis). Genes are color-coded by pathway. (C) Representation of the classical MAPK pathway, the six genes mutated in AD patients are labeled in red, TEK is labeled in blue, and larger font size indicate reccurence of variants in a given gene. Violin plot shows distribution of P-SNV in genes from classical MAPK pathway per Mb sequenced and per sample in patients and controls, p-value: unpaired two-tailed Mann-Whitney U test. (D) Summary Table showing patients carrying P-SNV in the classical RTK/MAPK pathway and Chronic Myeloid Leukemia (CML)-associated genes (see Supplementary file 3) and indicating the detection of variants in blood, and their association with other variants in microglia. (E) Recurrent variants in the ring-like domain of CBL are indicated in red on the diagram structure of gene, above representative Western blot from cell lysates from HEK293T cells expressing WT, positive control (Y371H), or CBL variants alleles found in patients, and stimulated with EGF or control, probed with antibodies against Phospho-p44/42 MAPK (Erk 1/2, Thr202/Tyr204), total p44/42 MAPK (Erk1/2), HA-tag, and tubulin (BOTTOM). Histogram (RIGHT) represents quantification of the increase of the Phospho-ERK1/2/total ERK1/2 ratio in western blots in n=5 independent experiments, statistics: unpaired one-tailed t-test. (F) RIT1 M90I and F82L are represented on the 3D structure of the gene (pdb code: 4klz, F82 is within a segment whose structure was not resolved) and representative western blot from HEK293T cells expressing Flag-RIT1 (WT and mutants) and treated -/+ 20% FBS before harvesting. Lysates were probed with antibodies against Phospho-p44/42 MAPK (Erk 1/2, Thr202/Tyr204), total p44/42 MAPK (Erk1/2, (MAPK)), Flag, and tubulin. Histogram (RIGHT) represents quantification of the increase of the Phospho-ERK1/2/total ERK1/2 ratio in western blots in n=4 independent experiments, statistics: unpaired one-tailed t-test. (G) Variant allelic frequency (VAF, %) for the BRAFV600E allele in PU.1+ nuclei from brain samples from histiocytosis patients (each dot represents a sample) and for P-SNVs in in PU.1+ nuclei from brain of AD patients (each dot represent a variant). Note: non-parametric tests were used when data did not follow a normal distribution (D'Agostino-Pearson normality test). (H) Percentage of P-SNVs detected by targeted deep sequencing (TDS) which were also detected by Whole-Exome-Sequencing (WES).
-
Figure 3—source data 1
Data corresponding to panels A, B, C, E, F, and G.
- https://cdn.elifesciences.org/articles/96519/elife-96519-fig3-data1-v1.xlsx
-
Figure 3—source data 2
Original PNG files for western blot analysis, indicating the relevant bands and treatments, displayed in panel E and F.
- https://cdn.elifesciences.org/articles/96519/elife-96519-fig3-data2-v1.zip
-
Figure 3—source data 3
Unedited western blot JPEGs.
- https://cdn.elifesciences.org/articles/96519/elife-96519-fig3-data3-v1.zip
Figure 3—figure supplement 1
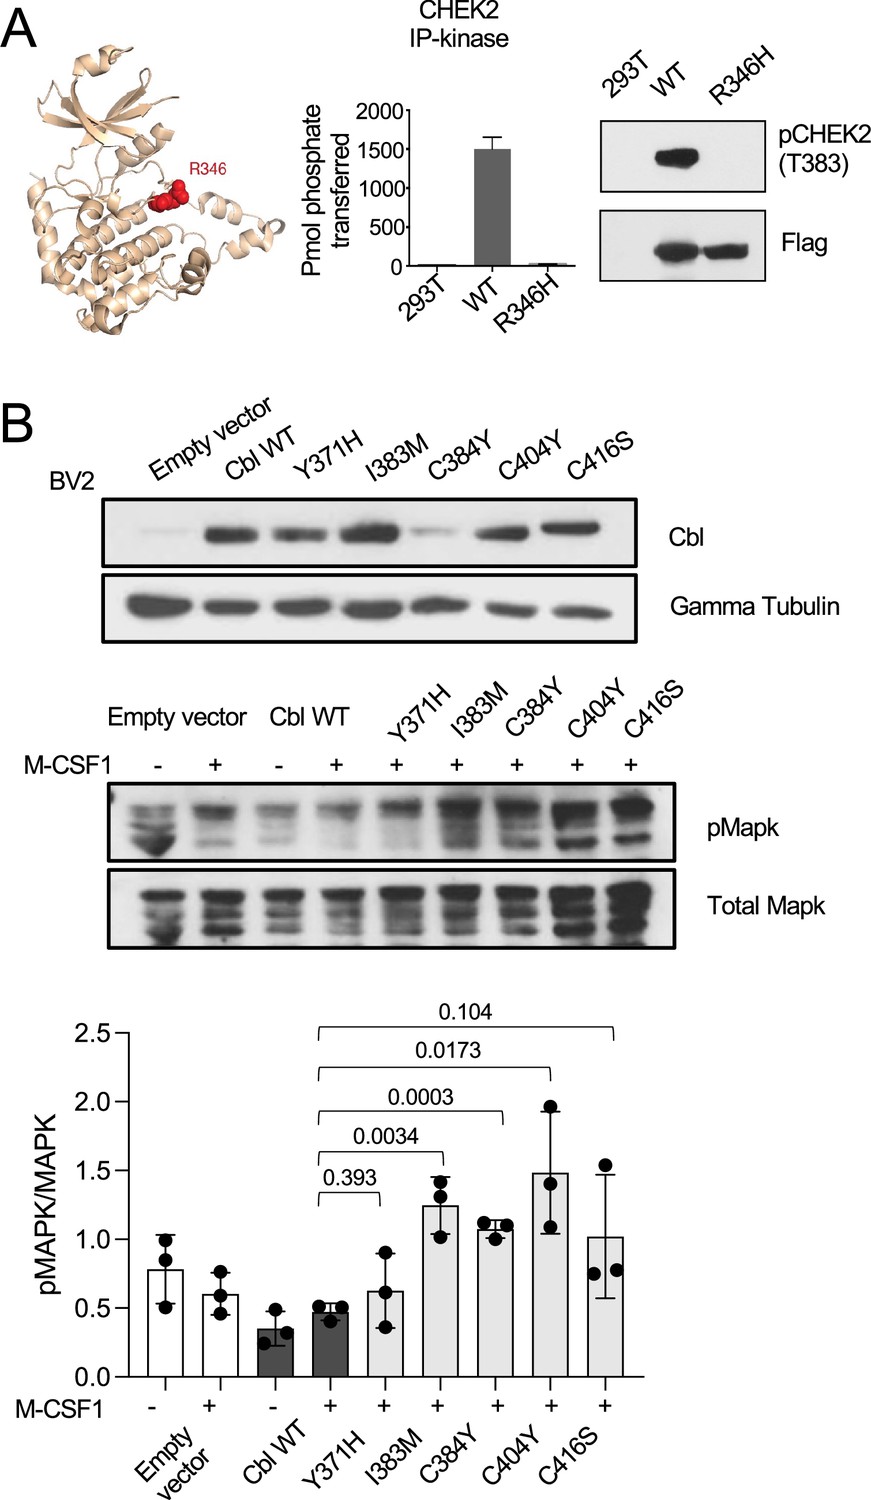
Functional analysis of variants in HEK293 and BV2 cell lines.
(A) CHEK2 R346H is a loss-of-function mutant. The R346H variant is located within the catalytic loop of the protein kinase domain and shown in red on the 3D structure of CHEK2 kinase domain (pdb code: 2cn5) (LEFT). CHEK2 R346 Lysates from HEK293T cells expressing Flag-WT or CHEK2 R346 were probed with antibodies that recognizes the auto phosphorylated and activated form of CHEK2 and Flag (MIDDLE). Flag-tagged WT and R346H CHK2 were expressed in HEK293T cells, proteins were isolated by immunoaffinity capture using anti-Flag resin. CHK2 activity was measured with (Zar, 2010 P)-labeled ATP and a synthetic CHEK2 substrate peptide. Wild-type CHEK2 showed robust activity, while the R346H mutant was inactive (RIGHT). (B) Western-blot analysis of CBL expression (TOP), pMAPK and total MAPK (MIDDLE) and respective quantification (BOTTOM) in BV2 cell lines transduced with empty vector, CBLWT, CBLY371H, CBLI383M, CBLC384Y, CBLC404Y, and CBLC416S. For MIDDLE panel, cells were treated with M-CSF1 100 ng/ml for 5 min. Statistics: p-values are calculated with t-test. n=3.
-
Figure 3—figure supplement 1—source data 1
Data corresponding to panel B.
- https://cdn.elifesciences.org/articles/96519/elife-96519-fig3-figsupp1-data1-v1.xlsx
-
Figure 3—figure supplement 1—source data 2
Original PNG files for western blot analysis, indicating the relevant bands and treatments, displayed in panel A and B.
- https://cdn.elifesciences.org/articles/96519/elife-96519-fig3-figsupp1-data2-v1.zip
-
Figure 3—figure supplement 1—source data 3
Unedited western blot JPEGs.
- https://cdn.elifesciences.org/articles/96519/elife-96519-fig3-figsupp1-data3-v1.zip
Figure 4 with 1 supplement
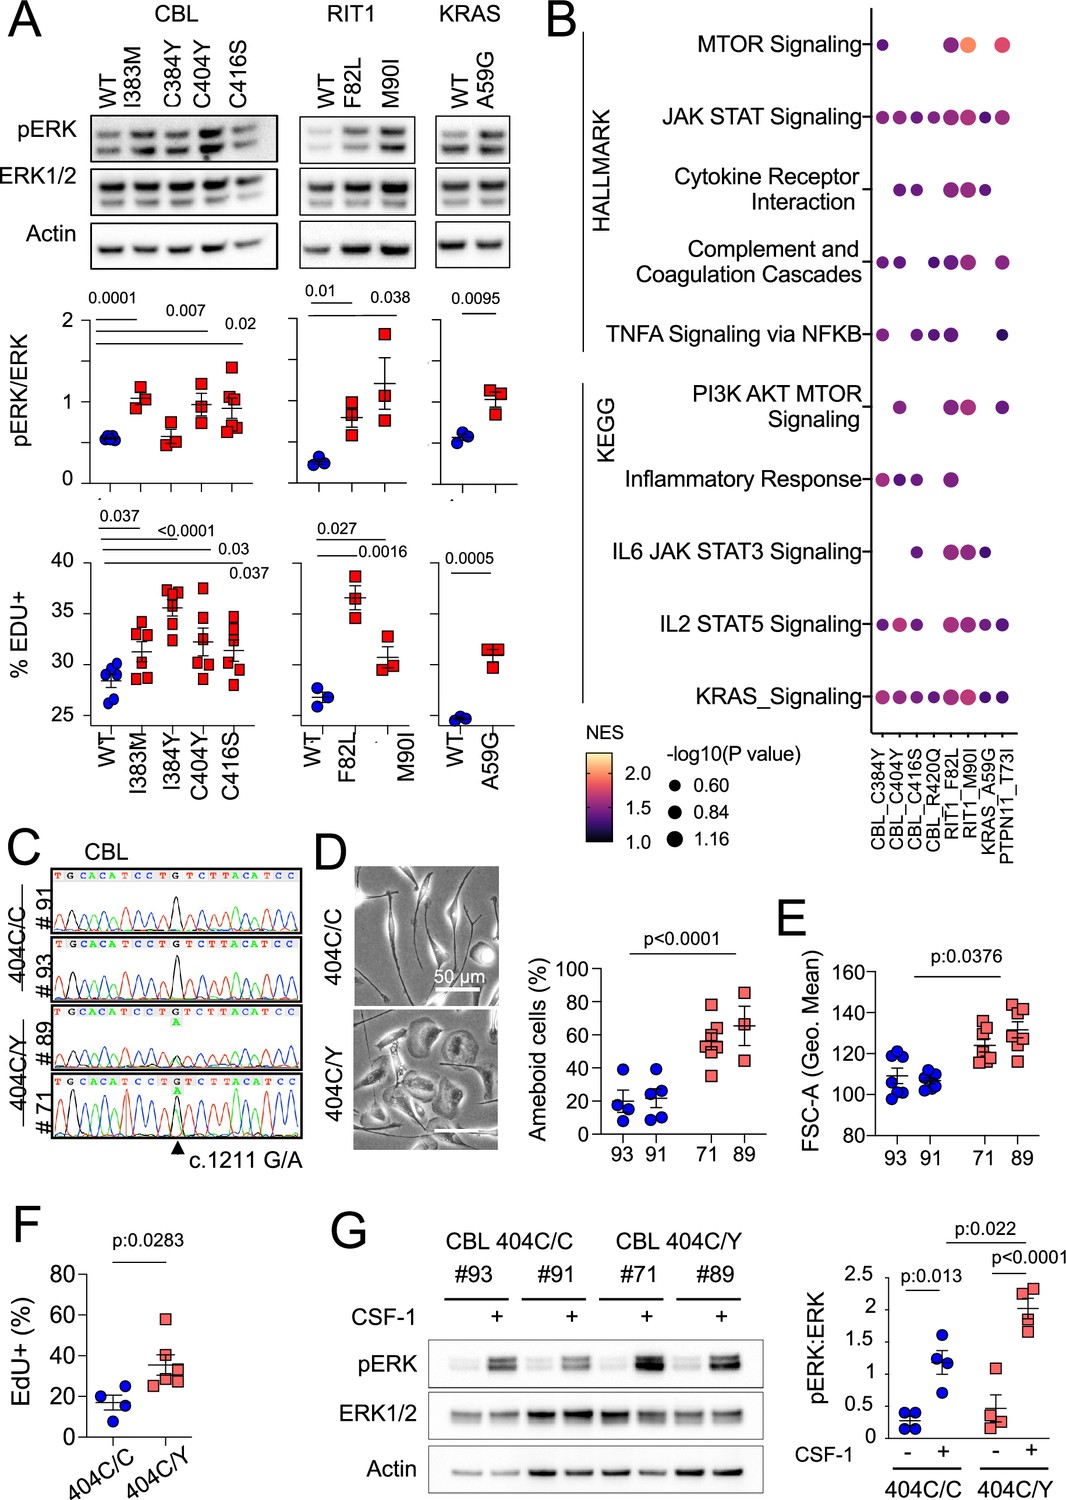
MAPK pathway activating variants in mouse macrophages and human induced Pluripotent Stem Cells (iPSC)-derived microglia-like cells.
(A) Representative western-blot analysis (Top panels) and quantification (Middle panels) of phospho- and total-ERK in lysates from a murine CSF-1 dependent macrophage cell line expressing CBLWT, CBLI383M, CBLC384Y, CBLC404Y, CBLC416S (n=3–6), and RIT1WT, RIT1F82L and RIT1M90I (n=3), KRASWT, and KRASA59G (n=3). Bottom panels depicts flow cytometry analysis of EdU incorporation in the same lines. Statistics, Unpaired t-test. (B) HALLMARK and KEGG pathways (FDR/adj.p value <0.25, selected from Supplementary file 7) enriched in gene set enrichment analysis (GSEA) of RNAseq from mutant CSF-1 dependent macrophages lines CBLI383M, CBLC384Y, CBLC404Y, CBLC416S, CBLR420Q, RIT1F82L RIT1M90I, KRASA59G, and PTPN11T73I (n=3–6) in comparison with their wt controls. NES: normalized enrichment score. (C) Sanger sequencing of 2 independent hiPSC clones (#93 and #91) of CBL404C/Y heterozygous mutant carrying the c.1211G/A transition on one allele and 2 independent isogenic control CBL404C/C clones (#71 and #89) all obtained by prime editing. (D) Photomicrographs in CBL404C/C and CBL404C/Y iPSC-derived microglia-like cells.(E) Quantification of leading edge and lateral lamellipodia in CBL404C/C and CBL404C/Y iPSC-derived microglia-like cells. n=3–7, statistics: p-value are obtained by nested one-way ANOVA. (F) Flow cytometry analysis of cell size for the same lines (n>3) statistics: p-value are obtained with nested one-way ANOVA. (G) Flow cytometry analysis of EdU incorporation in CBL404C/C and CBL404C/Y microglia-like cells after a 2 hr EdU pulse. n=3, unpaired t-test. (H) Western-blot analysis (left) and quantification (right) of phospho- and total-ERK proteins in lysates from CBL404C/C and CBL404C/Y microglia-like cells starved of CSF-1 for 4 hr and stimulated with CSF-1 (5 min, 100 ng/mL) (n=4), statistics: p-value are obtained with two-way ANOVA.
-
Figure 4—source data 1
Data corresponding to panels A, D, E, F, and G.
- https://cdn.elifesciences.org/articles/96519/elife-96519-fig4-data1-v1.xlsx
-
Figure 4—source data 2
Original PNG files for western blot analysis, indicating the relevant bands and treatments, displayed in A and G.
- https://cdn.elifesciences.org/articles/96519/elife-96519-fig4-data2-v1.zip
-
Figure 4—source data 3
Unedited western blot JPEGs.
- https://cdn.elifesciences.org/articles/96519/elife-96519-fig4-data3-v1.zip
Figure 4—figure supplement 1
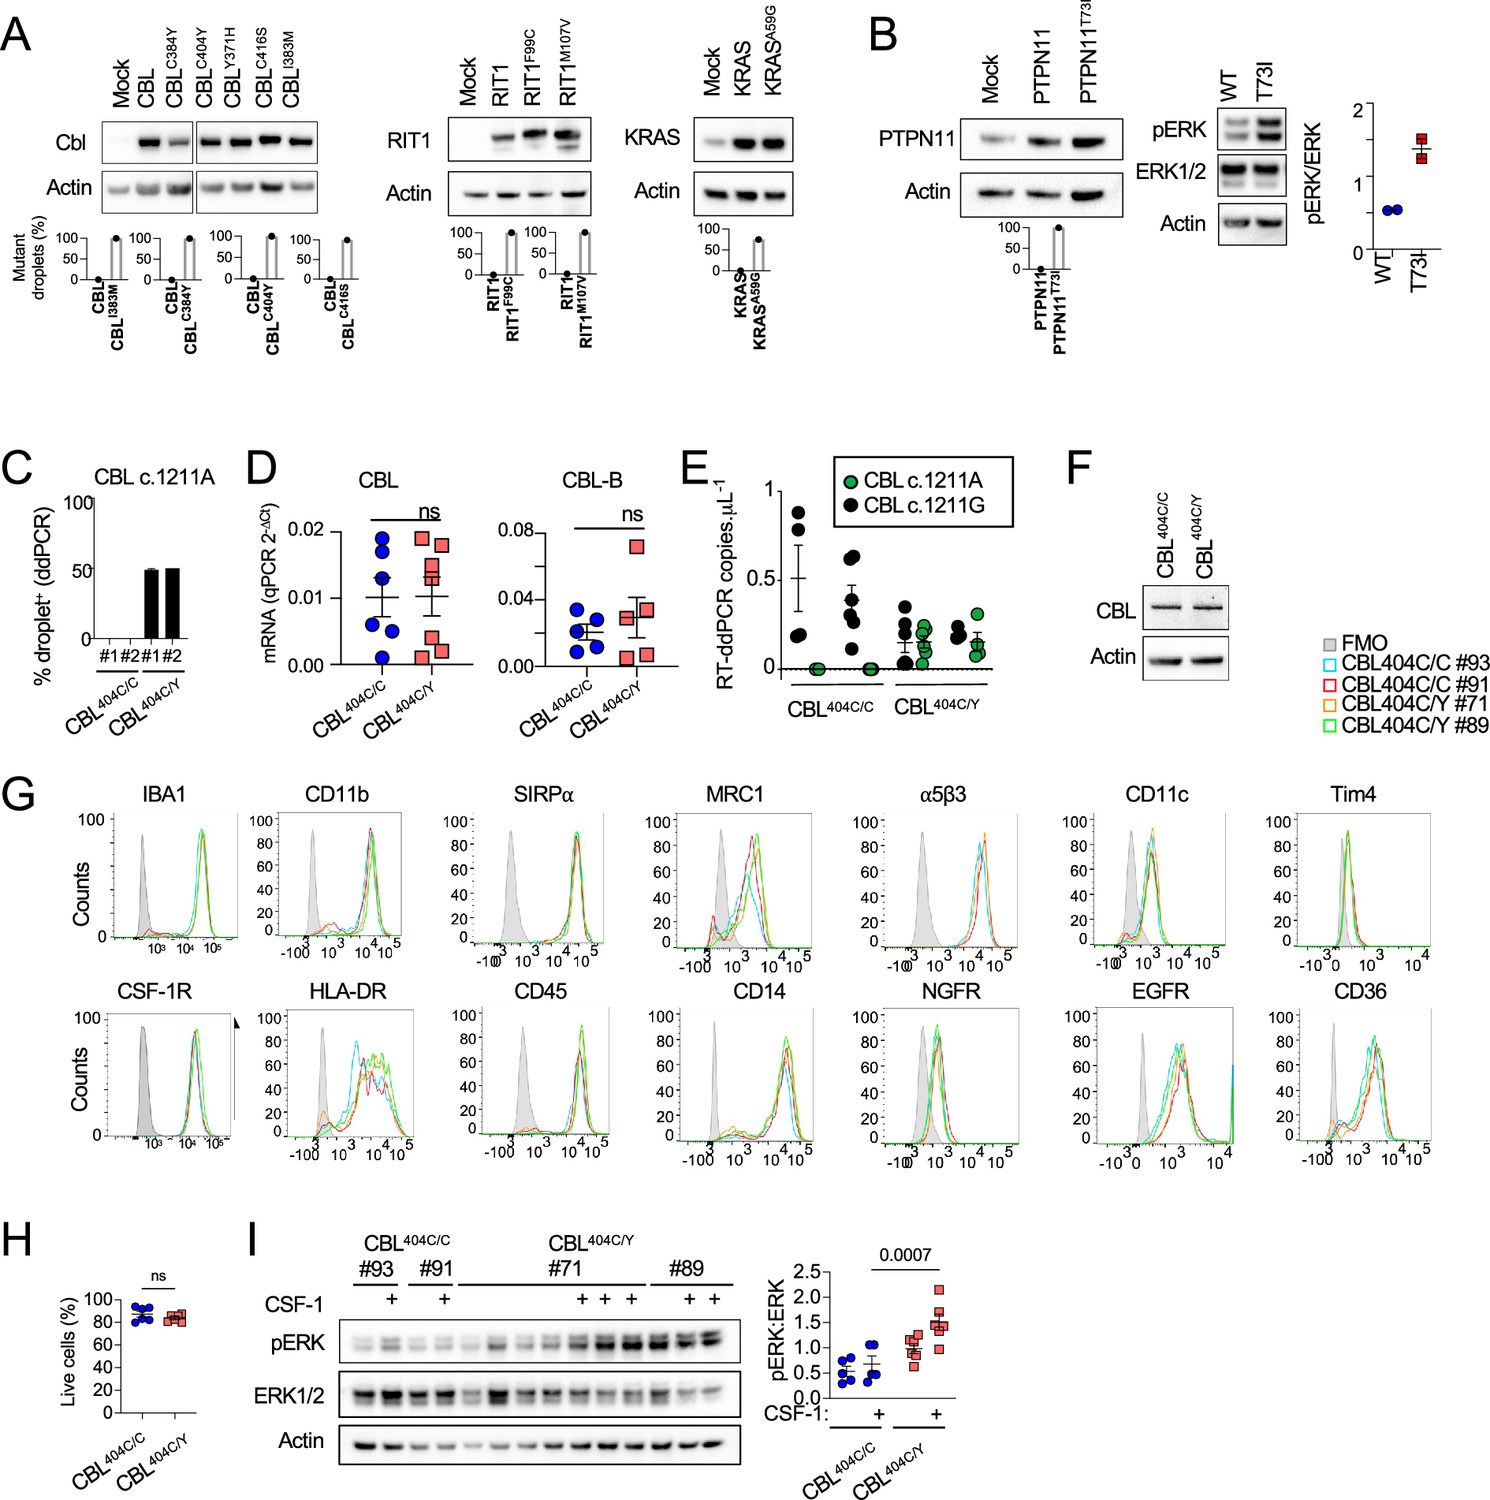
Analysis of mouse and human microglia-like cells.
(A) Western-blot analysis of CBL, RIT1, and KRAS expression in lysates from a growth factor-dependent macrophage cell line expressing CBLWT, CBLI383M, CBLC384Y, CBLC404Y, CBLC416S, CBLR420Q, RIT1WT, RIT1F99C, RIT1M107V, KRASWT, and KRASA59G alleles (TOP), and ddPCR analysis of wt and mutant alleles in DNA from the same cell lines (BOTTOM). (B) Western-blot analysis of PTPN11 expression and phospho- and total-ERK in lysates from growth factor-dependent macrophage cell line expressing PTPN11WT or PTPN11T73I alleles, and ddPCR analysis of wt and variant alleles in DNA from the same lines. (C) Genomic DNA ddPCR of two independent hiPSC clones (#1 and #2) of CBL404C/Y heterozygous mutant carrying the c.1211G/A transition on one allele and two independent isogenic control CBL404C/C clones all obtained by prime editing. (D) CBL and CBL-B mRNA expression assessed by Taqman assay in CBL404C/C and CBL404C/Y iPSC-derived microglia-like cells. Unpaired t-test. (E) RT-ddPCR of CBL reference allele (CBL c.1211A) and CBL variant CBL c.1211G transcripts in CBL404C/C and CBL404C/Y iPSC-derived macrophages. n=4–6 independent experiments. (F) Western-blot analysis of CBL expression in lysates from CBL404C/C and CBL404C/Y iPSC-derived microglia-like cells. (G) Representative flow cytometry analysis of the expression of surface receptors and Iba1 in CBL404C/C and CBL404C/Y cells (n=3) (H) Viability of CBL404C/C and CBL404C/Y iPSC-derived microglia-like cells estimated by flow cytometry analysis after DAPI staining. Unpaired t-test. n=6. (I) Western-blot analysis and quantification of phospho- and total-ERK proteins in lysates from CBL404C/C and CBL404C/Y iPSC-derived microglia-like cells untreated or re-stimulated with CSF-1 cells (5 min, 100 ng/mL). (Two-way ANOVA, n=6–7).
-
Figure 4—figure supplement 1—source data 1
Data corresponding to panels B, D, E, H, I.
- https://cdn.elifesciences.org/articles/96519/elife-96519-fig4-figsupp1-data1-v1.xlsx
-
Figure 4—figure supplement 1—source data 2
Original PNG files for western blot analysis, indicating the relevant bands and treatments, displayed in panels A, B, F, and I.
- https://cdn.elifesciences.org/articles/96519/elife-96519-fig4-figsupp1-data2-v1.zip
-
Figure 4—figure supplement 1—source data 3
Unedited western blot JPEGs.
- https://cdn.elifesciences.org/articles/96519/elife-96519-fig4-figsupp1-data3-v1.zip
Figure 5 with 1 supplement
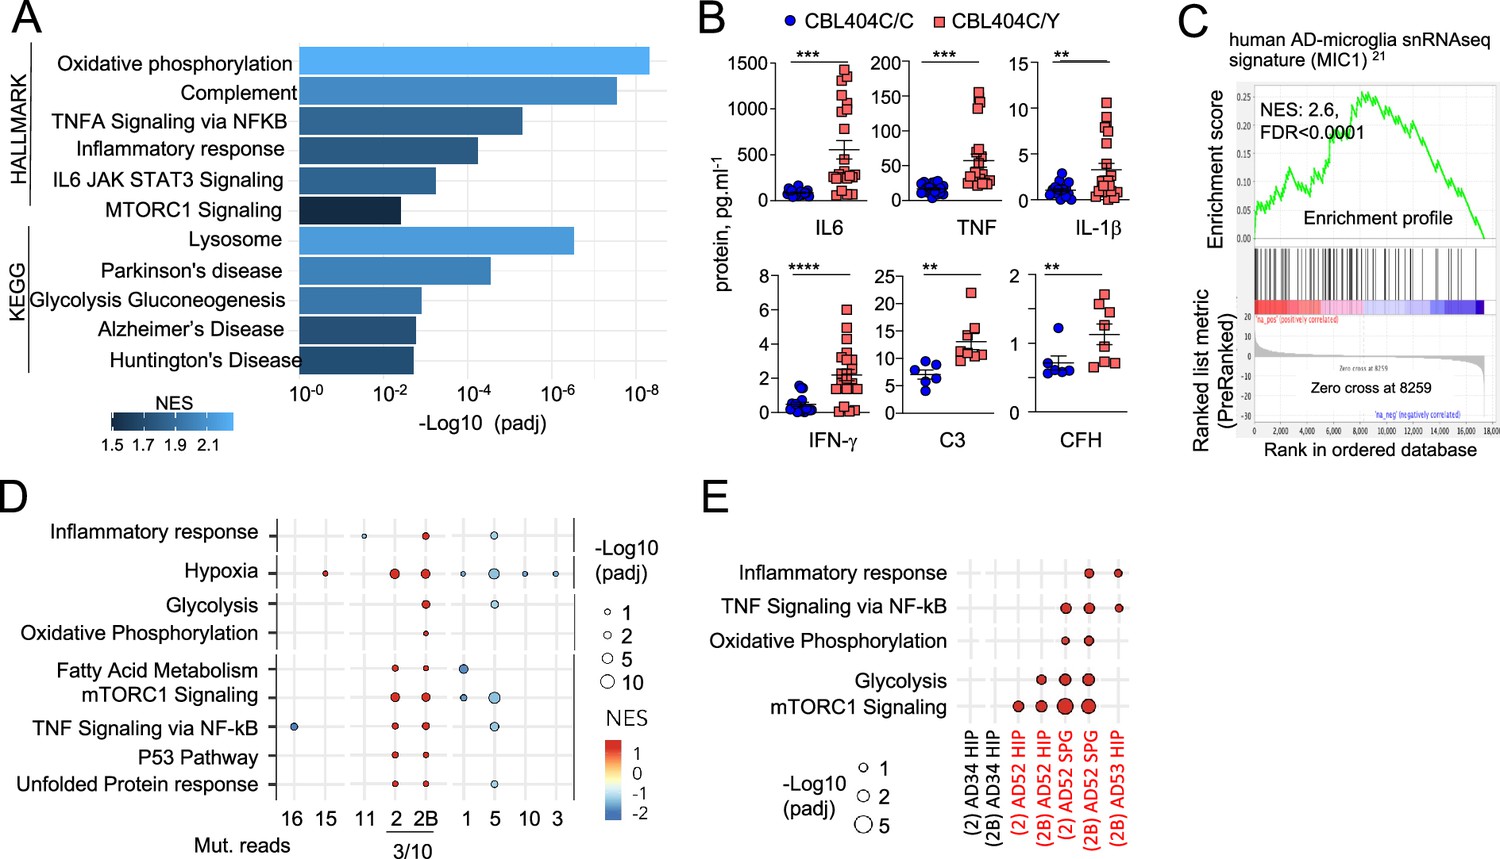
CBL404C/Y microglia signature.
(A) HALLMARK and KEGG pathways (FDR /adj.p value <0.25, selected from Supplementary file 8) enriched in gene set enrichment analysis (GSEA) of RNAseq from from CBL404C/Y induced Pluripotent Stem Cells (iPSC)-derived macrophages and isogenic controls NES, normalized enrichment score. (B) ELISA for pro-inflammatory cytokines (n=3) and complement proteins (n=2) in the supernatant from CBL404C/Y iPSC-derived microglial-like cells and isogenic controls. Statistics: p-value are obtained by nonparametric Mann-Whitney U test,* 0.05, ** 0.01, *** 0.001, **** 0.0001. (C) GSEA analysis for enrichment of the human AD-microglia snRNA-seq signature (MIC1) Mathys et al., 2019 in differentially expressed genes between CBL404Y/C microglial-like cells and isogenic controls. (D) Dot plot represents the GSEA analysis of HALLMARK and KEGG pathways enriched in snRNAseq microglia clusters (samples from all donors). Genes are pre-ranked per cluster using differential expression analysis with SCANPY and the Wilcoxon rank-sum method. Statistical analyses were performed using the fgseaMultilevel function in fgsea R package for HALLMARK and KEGG pathways. Selected gene-sets with p-value <0.05 and adjusted p-value <0.25 are visualized using ggpubr and ggplot2 R package (gene sets/pathways are selected from Figure 5—figure supplement 1B, Supplementary file 9). (E) Dot plot represents the GSEA analysis (as in (E)) of HALLMARK and KEGG pathways enriched in cluster 2/2 B and deconvoluted by donor samples (selected from Figure 5—figure supplement 1A).
-
Figure 5—source data 1
Data corresponding to panel B.
- https://cdn.elifesciences.org/articles/96519/elife-96519-fig5-data1-v1.xlsx
Figure 5—figure supplement 1
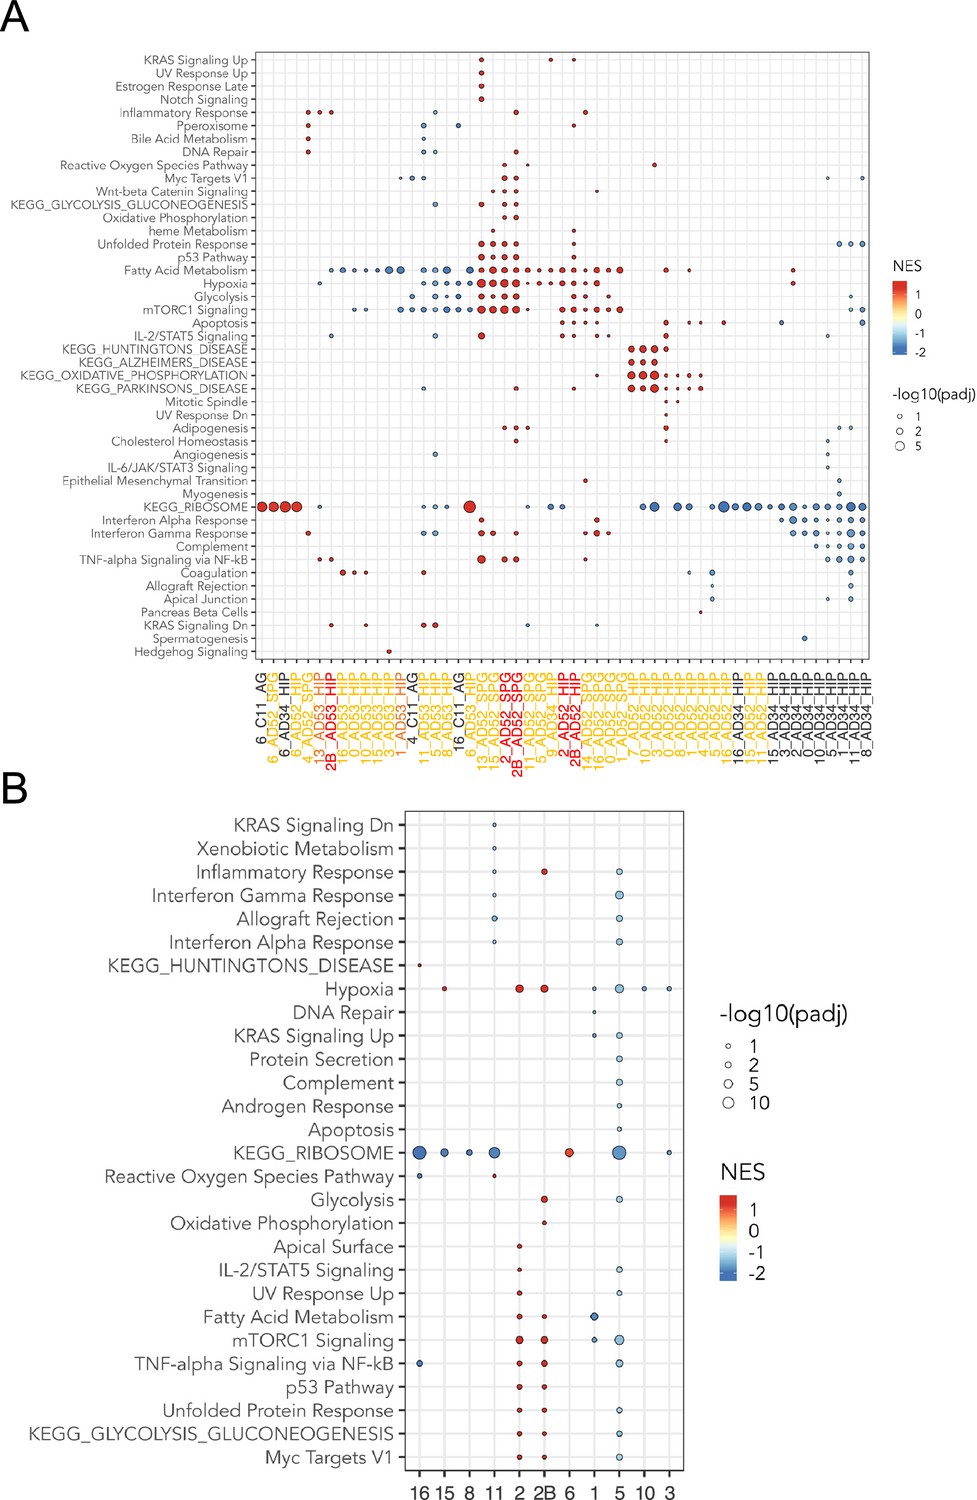
snRNA-seq analysis of microglia.
(A) Dot plot represents the significant pathways by Gene Set Enrichment Analysis (GSEA) of HALLMARK and KEGG pathways of snRNAseq analysis of microglia, by samples and clusters. Genes from all samples are pre-ranked per cluster using differential expression analysis with SCANPY Mass et al., 2017 and the Wilcoxon rank-sum method. Statistical analysis were performed using the fgseaMultilevel function in fgsea R package (Askew et al., 2017) for HALLMARK and KEGG pathways. Only HALLMARK and KEGG gene sets with p-value <0.05 and adjusted p-value <0.25 are visualized, using ggpubr and ggplot2 (Réu et al., 2017) R package. (B) Dot plot represents the same GSEA analysis of HALLMARK and KEGG pathways enriched in snRNA-seq microglia clusters as in A, but samples from all donors are grouped by microglia clusters.
Tables
Key resources table
| Reagent type (species) or resource | Designation | Source or reference | Identifiers | Additional information |
|---|---|---|---|---|
| Cell line (Homo sapiens) | 293T cell line | ATCC | RRID:CVCL_0063 | |
| Cell line (Mus musculus) | BV2 microglial cell line | ARP American Research Products, Inc | RRID:CVCL_0182 | inmortalized with v-raf |
| Cell line (Mus musculus) | Mouse primary CSF-1 | gift of Dr. E. R. Stanley (Albert Einstein College of Medicine, Bronx, NY). | immortalized with the SVU19-5 retrovirus | |
| Cell line (Homo sapiens) | C12 induced Pluripotent Stem Cells (iPSCs) (female) | Derived from peripheral blood mononuclear cells (PBMCs) | Used as a healthy wildtype control iPSC line (WT CBL) | |
| Cell line (Homo sapiens) | 293T- Flag-tagged WT and 293 T-R346H CHK2 | This paper | generated by transfection | |
| Cell line (Homo sapiens) | 293T-Flag-tagged WT, 293T- RIT1 F82L, 293T-RIT1 M90I | This paper | generated by transfection | |
| Cell line (Homo sapiens) | 293T-CBL, 293T-CBLI383M, 293T-CBLC404Y, 293T-CBLC416S, 293T-CBLC384Y, 293T-CBLY371H | This paper | generated by transfection | |
| Cell line (Mus musculus) | BV2-empty vector, BV2-CBL, BV2-CBLI383M, BV2-CBLC404Y,BV2-CBLC416S, BV2-CBLC384Y, BV2-CBLY371H | This paper | generated by viral transduction | |
| Cell line (Mus musculus) | MAC-RIT1, MAC-RIT1 F82L, MAC-RIT1 M90I | This paper | generated by viral transduction | |
| Cell line (Homo sapiens) | MAC-CBL, MAC-CBLI383M, MAC-CBLC404Y, MAC-CBLC416S, MAC-CBLC384Y, MAC-CBLY371H | This paper | generated by viral transduction | |
| Cell line (Homo sapiens) | MAC-KRAS, MAC-KRASA59G | This paper | generated by viral transduction | |
| Cell line (Homo sapiens) | MAC-PTPN11, MAC- PTPN11T73I | This paper | generated by viral transduction | |
| Cell line (Homo sapiens) | IPSC-CBLC404Y | This paper | C12 line genetically modified to contain CBLC404Y | |
| Transfected construct (human) | Flag-tagged CHK2 | Sino Biological | ||
| Transfected construct (human) | Flag-tagged RIT1 | Origene | ||
| Transfected construct (human) | Flag-tagged RIT1M90I and Flag-tagged RIT1F82L | This paper | generated by site-directed mutagenesis using the QuikChange Kit | |
| Transfected construct (human) | pcDNA3-HA-tagged c-Cbl | gift from Dr. Nicholas Carpino (Stony Brook) | ||
| Transfected construct (human) | pcDNA3-HA-tagged- CBLI383M, CBLC404Y, CBLC416S, CBLC384Y, CBLY371H | This paper | generated by site-directed mutagenesis using the QuikChange Kit | |
| Transfected construct (human) | pHAGE_puro | gift from Christopher Vakoc | Addgene plasmid # 118692; http://n2t.net/addgene:118692; RRID:Addgene_118692 | |
| Transfected construct (human) | pHAGE-KRAS | gift from Gordon Mills & Kenneth Scott | Addgene plasmid # 116755; http://n2t.net/addgene:116755; RRID:Addgene_116755 | |
| Transfected construct (human) | pHAGE-PTPN11 | gift from Gordon Mills & Kenneth Scott | Addgene plasmid # 116782; http://n2t.net/addgene:116782; RRID:Addgene_116782 | |
| Transfected construct (human) | pHAGE-PTPN11-T73I | gift from Gordon Mills & Kenneth Scott | Addgene plasmid # 116647; http://n2t.net/addgene:116647; RRID:Addgene_116647 | |
| Transfected constructs (human) | Phage-CBL, Phage-CBLI383M, Phage-CBLC404Y, Phage-CBLC416S, Phage-RIT1, Phage-RIT1M90I, Phage-RIT1F82L, phage-KRASA59G and pHAGE-CBLC384Y | This paper | generated by Azenta Life Sciences via a PCR cloning approach and targeted mutagenesis | |
| Transfected construct (human) | pDONR223_KRAS_p.A59G | gift from Jesse Boehm & William Hahn & David Root | Addgene plasmid # 81662; http://n2t.net/addgene:81662; RRID:Addgene_81662 | |
| Biological samples (Homo-sapiens) | Biological samples (brain tissue and blood) from patients and controls | See ‘Human sample collection and consent information’ in methods for details | ||
| Biological samples (Mus musculus) | CF1 Mouse Embryonic Fibroblasts, irradiated | Thermo Fisher Scientific | A34181 | |
| Antibody | NeuN-PE. Mouse monoclonal | Milli-Mark | Cat# FCMAB317PE, RRID:AB_11212465 | used at 1:500 dilution |
| Antibody | Pu.1-AlexaFluor 647. Rabbit monoclonal | Cell Signaling | Cat# 2240, RRID:AB_2186911 | used at 1:50 dilution |
| Antibody | anti-Cdc42, rabbit polyclonal | Santa Cruz | Cat# sc-87, RRID:AB_631213 | 1 µg |
| Antibody | Phospho-p44/42 MAPK (Thr202/Tyr204) mouse monoclinal | Cell Signaling | Cat# 4370, RRID:AB_2315112 | used at 1:1000 dilution |
| Antibody | total p44/42 MAPK, rabbit polyclonal | Cell Signaling | Cat# 9102, RRID:AB_330744 | used at 1:1000 dilution |
| Antibody | HA, mouse monoclonal | Millipore | Cat# 05–904, RRID:AB_417380 | used at 1:1000 dilution |
| Antibody | Flag, mouse monoclonal | Sigma | Cat# A8592, RRID:AB_439702 | used at 1:1000 dilution |
| Antibody | pCHEK2 (T383), Rabbit Polyclona | Abcam | Cat# ab59408, RRID:AB_942224 | used at 1:500 dilution |
| Antibody | Anti-γ-Tubulin, mouse monoclonal | Sigma | Cat# T6557, RRID:AB_477584 | used at 1:10000 dilution |
| Antibody | anti-c-CBL, Rabbit Polyclonal | Cell Signaling | Cat# 2747, RRID:AB_2275284 | used at 1:1000 dilution |
| Antibody | anti-RIT1, Rabbit Polyclonal | Abcam | Cat# ab53720, RRID:AB_882379 | used at 1:1000 dilution |
| Antibody | anti-KRAS, Rabbit Polyclonal | Sigma | Cat# H00003845-M01, RRID:AB_540078 | 1 μg/mL |
| Antibody | anti-Actin, mouse monoclonal | Sigma | Cat# MAB1501, RRID:AB_2223041 | used at 1:10,000 dilution |
| Antibody | anti-rabbit IgG HRP-linked, goat polyclonal | Cell Signaling | Cat# 7074, RRID:AB_2099233 | used at 1:1000 dilution |
| Antibody | anti-mouse IgG HRP-linked, horse polyclonal | Cell Signaling | Cat# 7076, RRID:AB_330924 | used at 1:1000 dilution |
| Antibody | PE- anti-CD115 (CSF1-R), rat monoclonal | BD | Cat# 565368, RRID:AB_2739206 | used at 1:100 dilution |
| Antibody | PE/Cy7-conjugated anti-CD11b, mouse monoclonal | BD Biosciences | at# 557743, RRID:AB_396849 | used at 1:100 dilution |
| Antibody | Alexa Fluor 488-conjugated-anti-CD206, mouse monoclonal | Thermo Fisher Scientific | Cat# 53-2069-42, RRID:AB_2574416 | used at 1:100 dilution |
| Antibody | PE-conjugated anti-integrin, mouse monoclonal | R&D systems | Cat# FAB3050P, RRID:AB_920540 | used at 1:100 dilution |
| Antibody | PE/Cy5-conjugated anti-CD11c, mouse monoclonal | BD Biosciences | Cat# 551077, RRID:AB_394034 | used at 1:100 dilution |
| Antibody | APC-conjugated anti-Tim4, mouse monoclonal | Biolegend | Cat# 354007, RRID:AB_2564543 | used at 1:100 dilution |
| Antibody | PE/Cy7-conjugated anti-HLA-DR, mouse monoclonal | BD Biosciences | Cat# 560651, RRID:AB_1727528 | used at 1:100 dilution |
| Antibody | BV650-conjugated anti-CD45, mouse monoclonal | Thermo Fisher Scientific | Cat# 416-0459-42, RRID:AB_2925684 | used at 1:100 dilution |
| Antibody | APC/Cy7-conjugated anti-CD14, rat monoclonal | Biolegend | Cat# 123317, RRID:AB_10900813 | used at 1:100 dilution |
| Antibody | PE-conjugated anti-NGFR, mouse monoclonal | eBioscience | Cat# 12-9400-42, RRID:AB_2572710 | used at 1:100 dilution |
| Antibody | Alexa Fluor 647-conjugated anti-EGFR, mouse monoclonal | BD Pharmigen | Cat# 563577, RRID:AB_2738288 | used at 1:100 dilution |
| Antibody | APC/Cy7-conjugated anti- CD36, mouse monoclonal | Biolegend | Cat# 336213, RRID:AB_2072512 | used at 1:100 dilution |
| Antibody | APC-conjugated anti-CD172a (SIRPa), mouse monoclonal | Thermo Fisher Scientific | Cat# 17-1729-42, RRID:AB_1944409 | used at 1:100 dilution |
| Antibody | Alexa Fluor 555-conjugated anti-Iba1 antibody, Rabbit monoclonal | Cell Signaling | Cat# 36618, RRID:AB_2943227 | used at 1:100 dilution |
| Commercial assay or kit | KAPA Hyper Prep Kit | Kapa Biosystems | KK8504 | |
| Software, algorithm | muTect 1 | https://github.com/soccin/BIC-variants_pipeline and https://github.com/soccin/Variant-PostProcess; doi:10.1016/j.jmoldx.2014.12.006 | v1.1.7 | |
| Software, algorithm | ShearwaterML | Martincorena, I. et al. | ||
| Software, algorithm | FlowJo | BD | 10.6.2 | |
| Commercial assay or kit | QIAamp DNA Micro Kit | Qiagen | Cat#56304 | |
| Commercial assay or kit | HiSeq 3000/4000 SBS Kit | Illumina | ||
| Sequence-based reagent | KRAS_G12D, ddPCR | Bio-Rad | Unique Assay ID: dHsaMDV2510596 | |
| Sequence-based reagent | MTOR_Arg1616His_c.4847G>A | Bio-Rad | Unique Assay ID: dHsaMDV2510596 | |
| Commercial assay or kit | 10 X genomics Reagent Kit 3’ v3.1 | 10 X genomics | ||
| Software, algorithm | Seurat v4.0.3 | https://github.com/satijalab; Hao et al., 2021 | ||
| Commercial assay or kit | NovaSeq 6000 S4 Reagent Kit (200 Cycles) | Illumina | ||
| Commercial assay or kit | RNeasy Mini kit | Qiagen | ||
| Sequence-based reagent | CBL_I383M | Thermo Fisher Scientific | dHsaMDS675699482 | |
| Sequence-based reagent | CBL_C384Y | Thermo Fisher Scientific | dHsaMDS386449640 | |
| Sequence-based reagent | CBL_C404Y | Thermo Fisher Scientific | dHsaMDS437459772 | |
| Sequence-based reagent | CBL_mRNA_C404Y | Thermo Fisher Scientific | dMDS334857054 | |
| Sequence-based reagent | CBL_C416S | Thermo Fisher Scientific | dHsaMDS613275900 | |
| Sequence-based reagent | RIT1_ F82L | Thermo Fisher Scientific | dMDS959028273 | |
| Sequence-based reagent | RIT1_M90I | Thermo Fisher Scientific | dHsaMDS133045056 | |
| Sequence-based reagent | c-CBL FAM | Thermo Fisher Scientific | Hs01011446_m1 | |
| Sequence-based reagent | CBLb FAM | Thermo Fisher Scientific | Hs00180288_m1 | |
| Sequence-based reagent | GAPDH VIC | Thermo Fisher Scientific | Hs02786624_g1 | |
| Commercial assay or kit | Zombie Violet Viability | Biolegend | ||
| Commercial assay or kit | Cytofix/Cytoperm solution | BD Pharmingen | ||
| Commercial assay or kit | Click-iT Plus EdU Alexa Fluor 647 Flow Cytometry Assay Kit | Thermo Fisher Scientific | ||
| Commercial assay or kit | miRNeasy Mini Kit | Qiagen | ||
| Commercial assay or kit | MagMAX mirVana Total RNA Isolation Kit | Thermo Fisher Scientific | ||
| Commercial assay or kit | KingFisher Flex Magnetic Particle Processor | Thermo Fisher Scientific | ||
| Commercial assay or kit | TruSeq Stranded mRNA LT Kit | Illumina | ||
| Software, algorithm | R/Bioconductor package DESeq | EMBL Heidelberg | https://bioconductor.org/packages//2.10/bioc/html/DESeq.html |
Additional files
-
Supplementary file 1
Characteristics of Alzheimer’s disease (AD) and control donors and samples.
- https://cdn.elifesciences.org/articles/96519/elife-96519-supp1-v1.xlsx
-
Supplementary file 2
Targeted-sequencing gene panel.
- https://cdn.elifesciences.org/articles/96519/elife-96519-supp2-v1.xlsx
-
Supplementary file 3
Variants identified in Alzheimer’s disease and control brain samples.
- https://cdn.elifesciences.org/articles/96519/elife-96519-supp3-v1.xlsx
-
Supplementary file 4
Pathway enrichment analysis for genes target of pathogenic variants in PU.1 samples.
- https://cdn.elifesciences.org/articles/96519/elife-96519-supp4-v1.xlsx
-
Supplementary file 5
BRAFV600E in brain PU.1+ cells from Histiocytosis patients.
- https://cdn.elifesciences.org/articles/96519/elife-96519-supp5-v1.xlsx
-
Supplementary file 6
Predicted deleterious variants by whole exome sequencing (WES).
- https://cdn.elifesciences.org/articles/96519/elife-96519-supp6-v1.xlsx
-
Supplementary file 7
RNAseq analysis of mouse cell lines: Differential expressed genes and GSEA analysis.
- https://cdn.elifesciences.org/articles/96519/elife-96519-supp7-v1.xlsx
-
Supplementary file 8
RNAseq analysis of human induced Pluripotent Stem Cells (hIPSC) derived microglial-like cells: Differential expressed genes and gene set enrichment analysis (GSEA).
- https://cdn.elifesciences.org/articles/96519/elife-96519-supp8-v1.xlsx
-
Supplementary file 9
Single nuclei RNAseq analysis of control and Alzheimer’s disease (AD) microglia: Differential expressed genes per clusters and gene set enrichment analysis (GSEA).
- https://cdn.elifesciences.org/articles/96519/elife-96519-supp9-v1.xlsx
-
MDAR checklist
- https://cdn.elifesciences.org/articles/96519/elife-96519-mdarchecklist1-v1.docx
Download links
A two-part list of links to download the article, or parts of the article, in various formats.
Downloads (link to download the article as PDF)
Open citations (links to open the citations from this article in various online reference manager services)
Cite this article (links to download the citations from this article in formats compatible with various reference manager tools)
A microglia clonal inflammatory disorder in Alzheimer’s disease
eLife 13:RP96519.
https://doi.org/10.7554/eLife.96519.3


