Estradiol elicits distinct firing patterns in arcuate nucleus kisspeptin neurons of females through altering ion channel conductances
- Department of Chemical Physiology and Biochemistry, Oregon Health & Science University, United States
- Department of Mathematics and Statistics, University of Exeter, United Kingdom
- Living Systems Institute, University of Exeter, United Kingdom
- Department of Women and Children’s Health, School of Life Course and Population Sciences, King’s College London, United Kingdom
- Department of Psychiatry and Behavioral Sciences, University of Washington, United States
- Depatment of Pharmacology, University of Washington, United States
- Division of Neuroscience, Oregon National Primate Research Center, United States
Figures
Figure 1
Properties of the firing of Kiss1ARH neurons from ovariectomized (OVX) and E2-treated OVX mice.
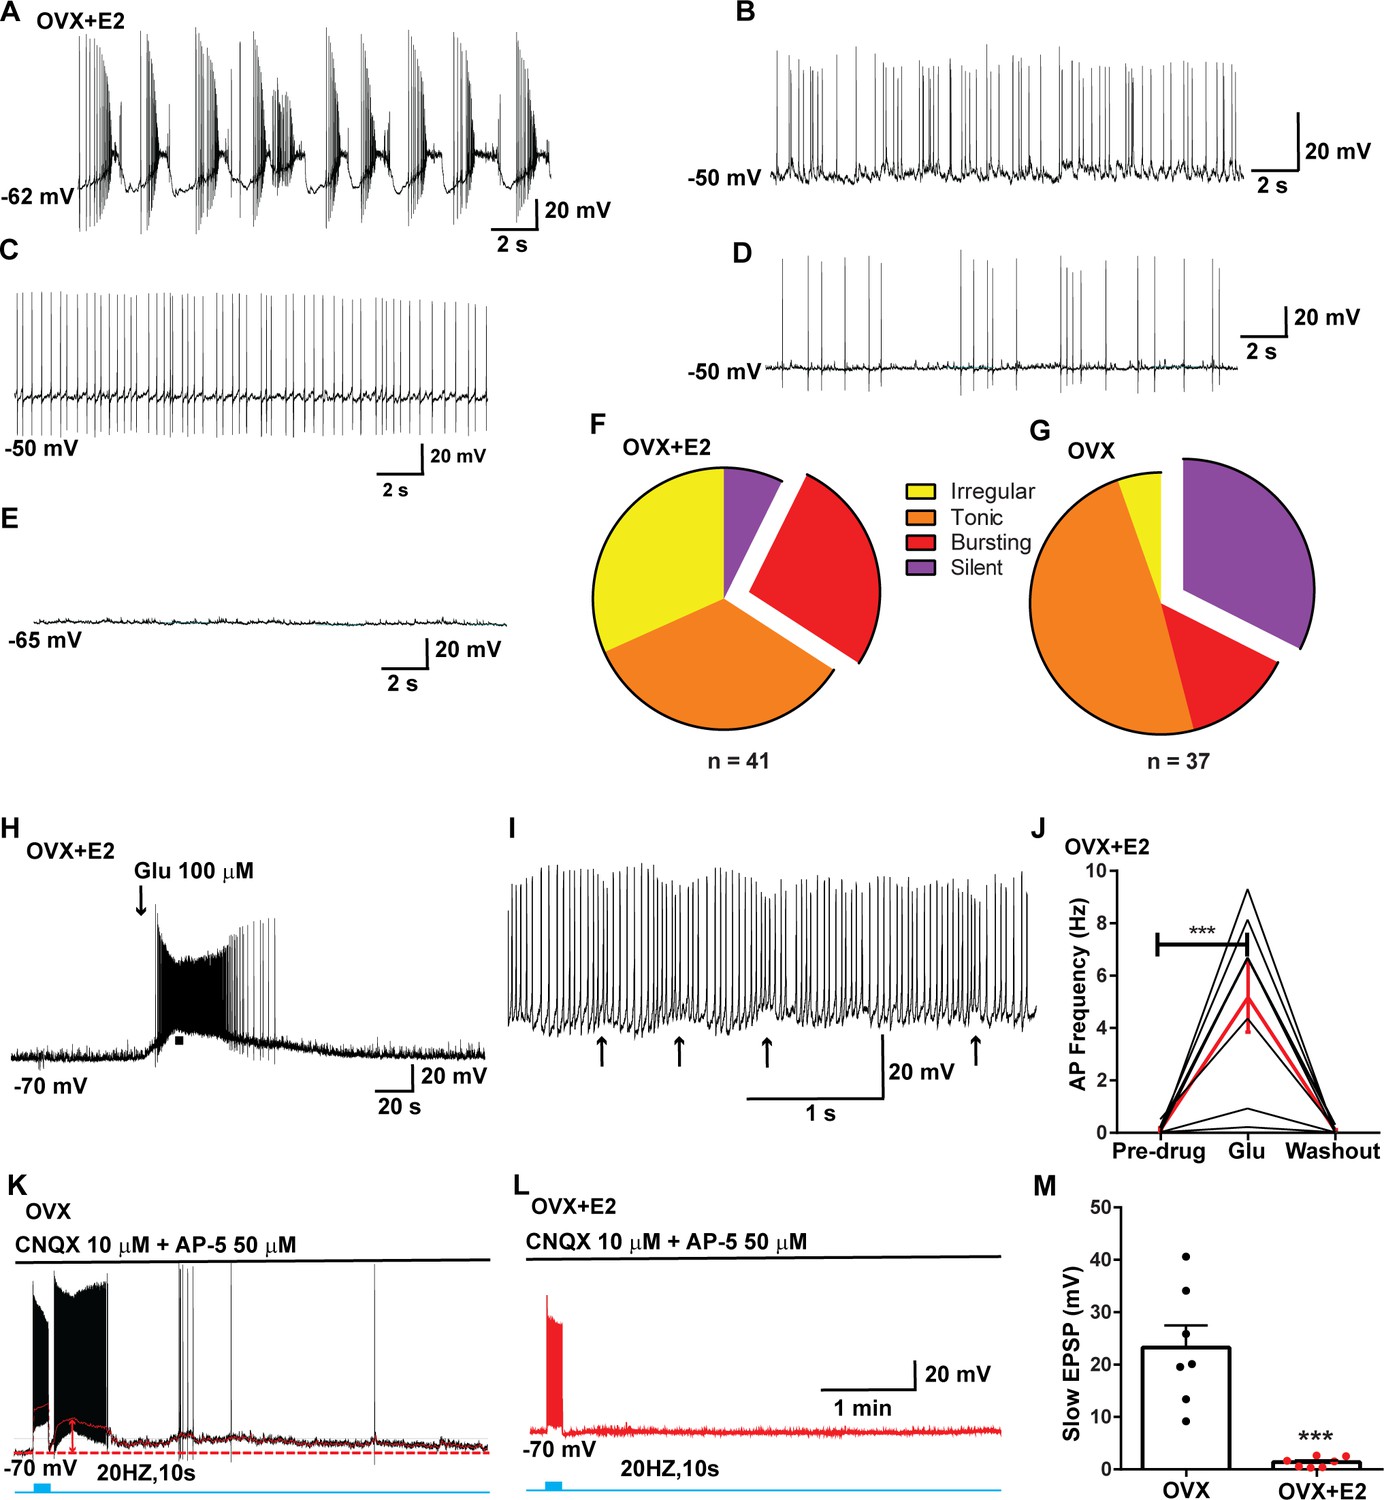
(A–E) Representative whole-cell, current-clamp recordings of spontaneous phasic burst firing (A, which is only seen in E2-treated mice with clear up and down states), irregular burst firing (B), tonic firing (C), irregular firing (D), and silent (E) in Kiss1ARH neurons from E2-treated OVX mice. (F, G) Summary pie chart illustrating the distribution of firing patterns in Kiss1ARH neurons from OVX + E2 (F, from six mice) or OVX (G, from eight mice) mice (OVX versus OVX + E2, X2(3) = 6.05, p=0.0011). (H) Current-clamp recording in a Kiss1ARH neuron from an OVX + E2 female demonstrating the response to glutamate (100 μM). RMP = –70 mV. Similar responses were observed in all recorded female Kiss1ARH neurons (n = 7 from four mice). (I) The spiking activity above the bar in (H) was expanded to highlight the pronounced effects of glutamate on burst firing activity of Kiss1ARH neurons, characterized by an ensemble of spikes riding on top of low-threshold spikes (arrows). Drugs were rapidly perfused into the bath as a 4 μl bolus. (J) Spontaneous AP frequency of Kiss1ARH neurons before, during, and after glutamate application (n = 7 cells). Data are presented as mean ± SEM. Statistical comparisons between different treatments were performed using one-way ANOVA (F(2, 18) = 14.60, p=0.0002) followed by Bonferroni’s post hoc test. ***p<0.005. (K, L) Representative traces showing the amplitude of slow excitatory postsynaptic potential (EPSP) induced by high-frequency photostimulation in Kiss1ARH neurons in the presence of ionotropic glutamate receptor antagonists CNQX and AP5 from OVX (K) and OVX + E2 (L) females. The arrows indicate the measurements of slow EPSP amplitude after low-pass filtering (shown in K). (M) Bar graphs summarizing the slow EPSPs in the Kiss1ARH neurons from OVX and E2-treated OVX mice in the presence of CNQX and AP5. Statistical comparisons between the two groups were performed using an unpaired t-test (t(12) = 5.181, p=0.0002). Data are expressed as mean ± SEM, with data points representing individual cells.
-
Figure 1—source data 1
Data presented in Figure 1.
- https://cdn.elifesciences.org/articles/96691/elife-96691-fig1-data1-v1.xlsx
Figure 2
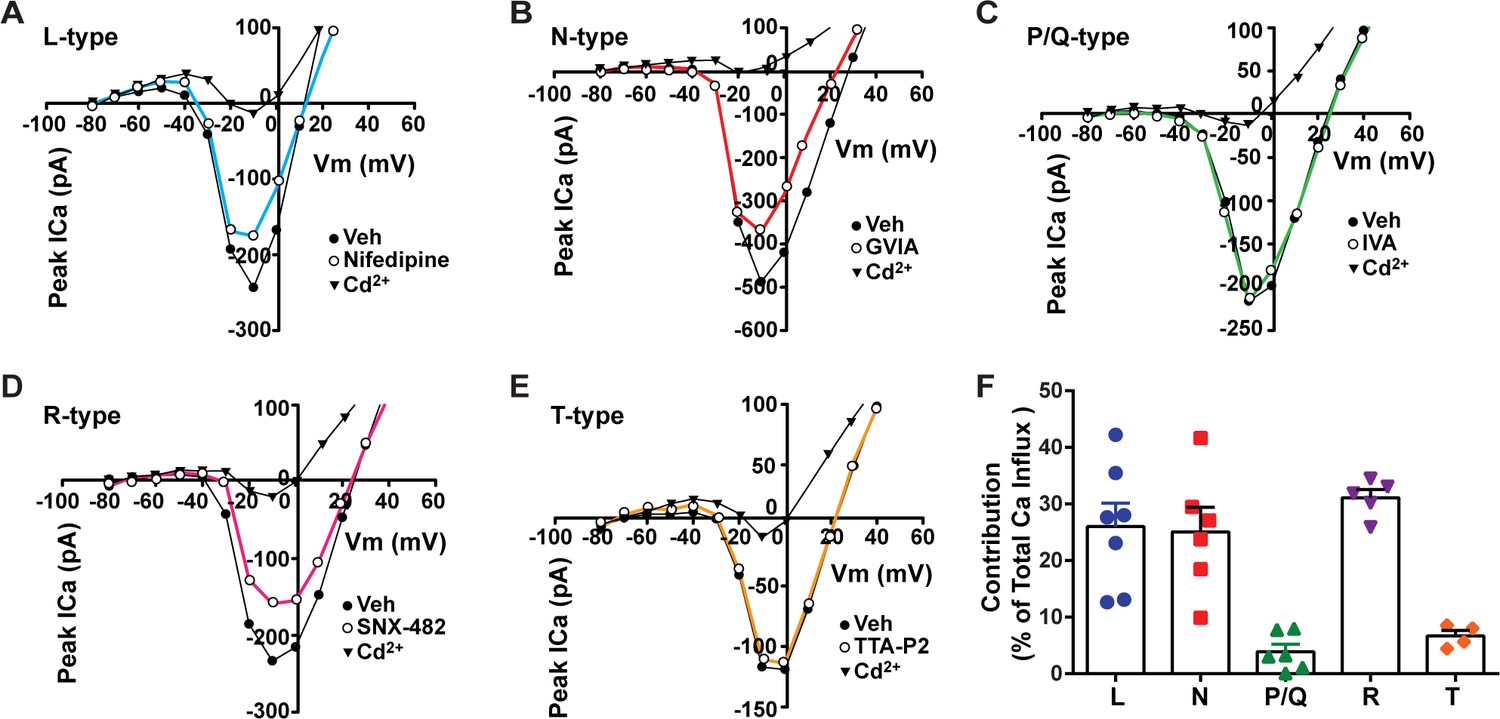
Relative contribution of voltage-gated calcium currents in Kiss1ARH neurons from OVX mice.
(A–E) Representative current–voltage relationships showing that Cd2+ (non-selective blocker of calcium channels)-sensitive peak currents were inhibited by different calcium channel blockers: (A) nifedipine; (B) ω-conotoxin GIVA; (C) ω-agatoxin IVA; (D) SNX-482; (E) TTA-P2. (F) The maximum peak currents were measured at –10 mV. The proportions of Ca2+ currents inhibited by nifedipine (L type), ω-conotoxin GVIA (N type), ω-agatoxin IVA (P/Q), SNX-482 (R type), and TTA-P2 (T type). Data are expressed as mean ± SEM, with data points representing individual cells.
-
Figure 2—source data 1
Data presented in Figure 2.
- https://cdn.elifesciences.org/articles/96691/elife-96691-fig2-data1-v1.xlsx
Figure 3
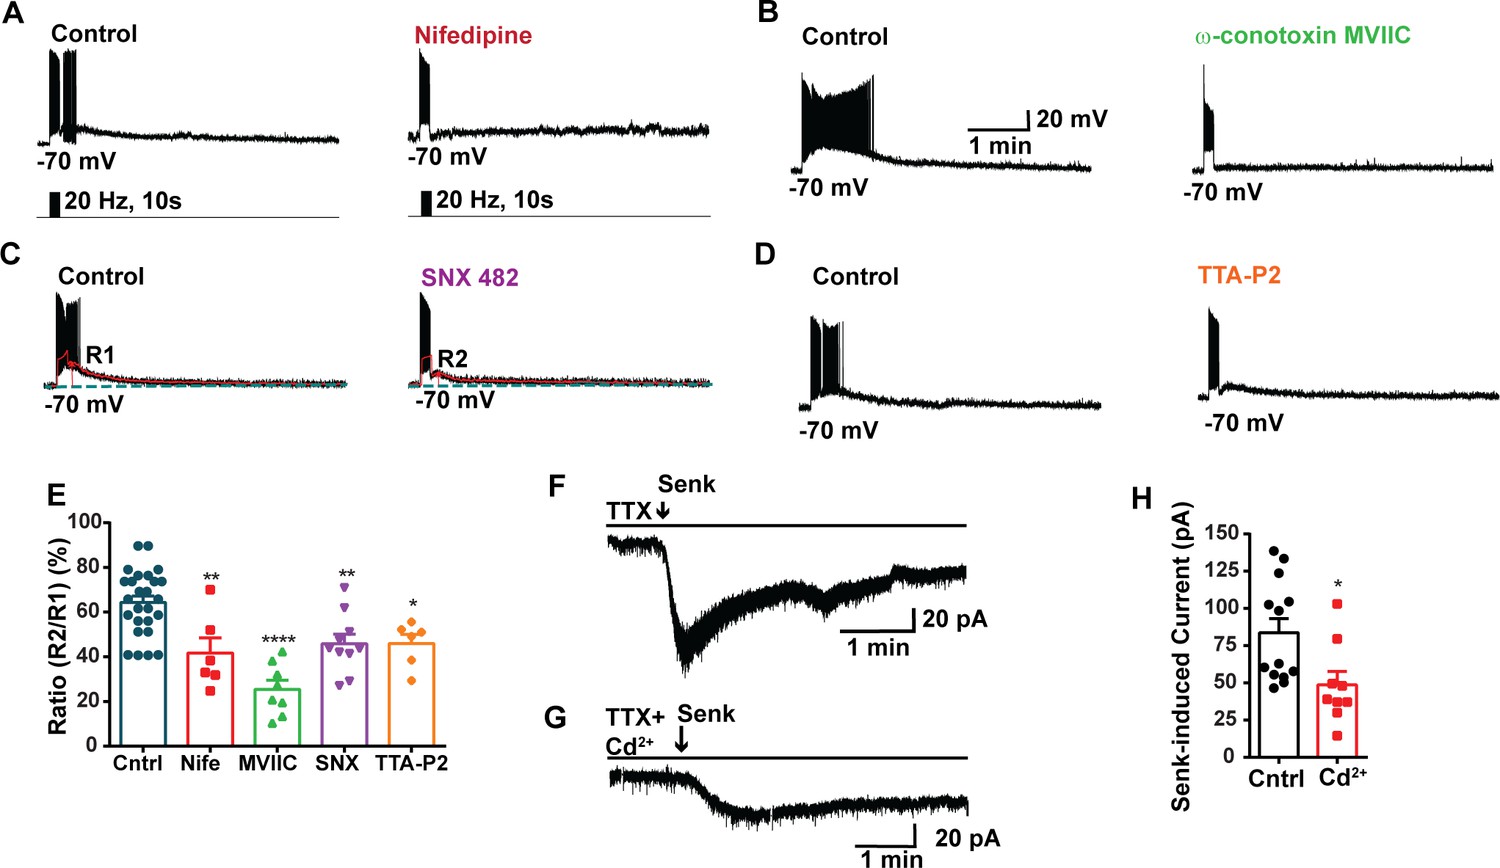
Blockade of voltage-activated Ca2+ channels decreases the slow excitatory postsynaptic potential (EPSP) in Kiss1ARH neurons.
(A–D) Representative traces showing that the slow EPSPs induced by high-frequency photostimulation were abolished by perfusing the blocker of the L-type calcium channel, nifedipine (A) or N- and P/Q-type calcium channels, ω-conotoxin MVIIC (B), or the R-type calcium channel, SNX 482 (C), or the T-type calcium channel, TTA-P2 (D), respectively. The arrows indicate the measurements of slow EPSP amplitude, denoted as R1 and R2, after low-pass filtering (shown in C). (E) Bar graphs summarizing the effects of drugs on the R2/R1 ratios. The slow EPSP was generated in OVX Kiss1-Cre::Ai32 mice. Comparisons between different treatments were performed using a one-way ANOVA (F (3, 51) = 14.36, p<0.0001) with the Bonferroni’s post hoc test. *, **, **** indicate p<0.05, 0.01, 0.001, respectively versus control. (F, G) Representative traces show that in voltage clamp senktide induced a significant inward current in Kiss1ARH neurons (F) in the presence of TTX. This current was inhibited by the calcium channel blocker CdCl2 (200 μM) in another cell (G). (H) Bar graphs summarize the effect of the calcium channel blocker CdCl2 on the senktide-induced inward currents. Unpaired t-test for (F) versus (G): t(20) = 2.575, p=0.0181; *p<0.05. Data are expressed as mean ± SEM, with data points representing individual cells.
-
Figure 3—source data 1
Data presented in Figure 3.
- https://cdn.elifesciences.org/articles/96691/elife-96691-fig3-data1-v1.xlsx
Figure 4

E2 increases the mRNA expression of volatge-activated Ca2+ channels and Hcn1 channels in Kiss1ARH neurons.
(A) E2 increases the expression of low and high voltage-activated calcium channels in Kiss1ARH neurons. Kiss1ARH neurons (three 10-cell pools) were harvested from each of five vehicle- and five E2-treated, OVX females to quantify ion channel mRNA expression of low and high voltage-activated calcium channels as described in the ‘Materials and methods’. The analysis included T-type (Cacna1g) low voltage-activated, as well as the following high voltage-activated channels: R-type (Cacna1e), L-type (Cacna1c), N-type (Cacna1b), and P/Q-type (Cacna1a) calcium channels. Interestingly, all of these channels were upregulated with E2 treatment, which significantly increased the whole-cell calcium current (see Figure 5). Bar graphs represent the mean ± SEM, with data points representing individual animals (oil versus E2, unpaired t-test for Cacna1g, t(8) = 7.105, ***p=0.0001; for Cacna1e, t(8) = 3.007, *p=0.0169; for Cacna1c, t(8) = 2.721, *p=0.0262; for Cacna1b, t(8) = 4.001, **p=0.0039; for Cacna1a, t(8) = 4.225, **p=0.0028). (B) The same Kiss1ARH neuronal pools were also analyzed for mRNA expression of Hcn1 ion channels, and E2 also increased the expression of hyperpolarization-activated, cyclic-nucleotide gated Hcn1 channels in Kiss1ARH neurons. Hcn1 channel mRNA expression was the most highly upregulated by E2 treatment in Kiss1ARH neurons. The expression values were calculated via the ΔΔCT method, normalized to Gapdh and relative to the oil control values (oil versus E2, unpaired t-test, t(8) = 11.450, ****p<0.0001).
-
Figure 4—source data 1
Data presented in Figure 4.
- https://cdn.elifesciences.org/articles/96691/elife-96691-fig4-data1-v1.xlsx
Figure 5
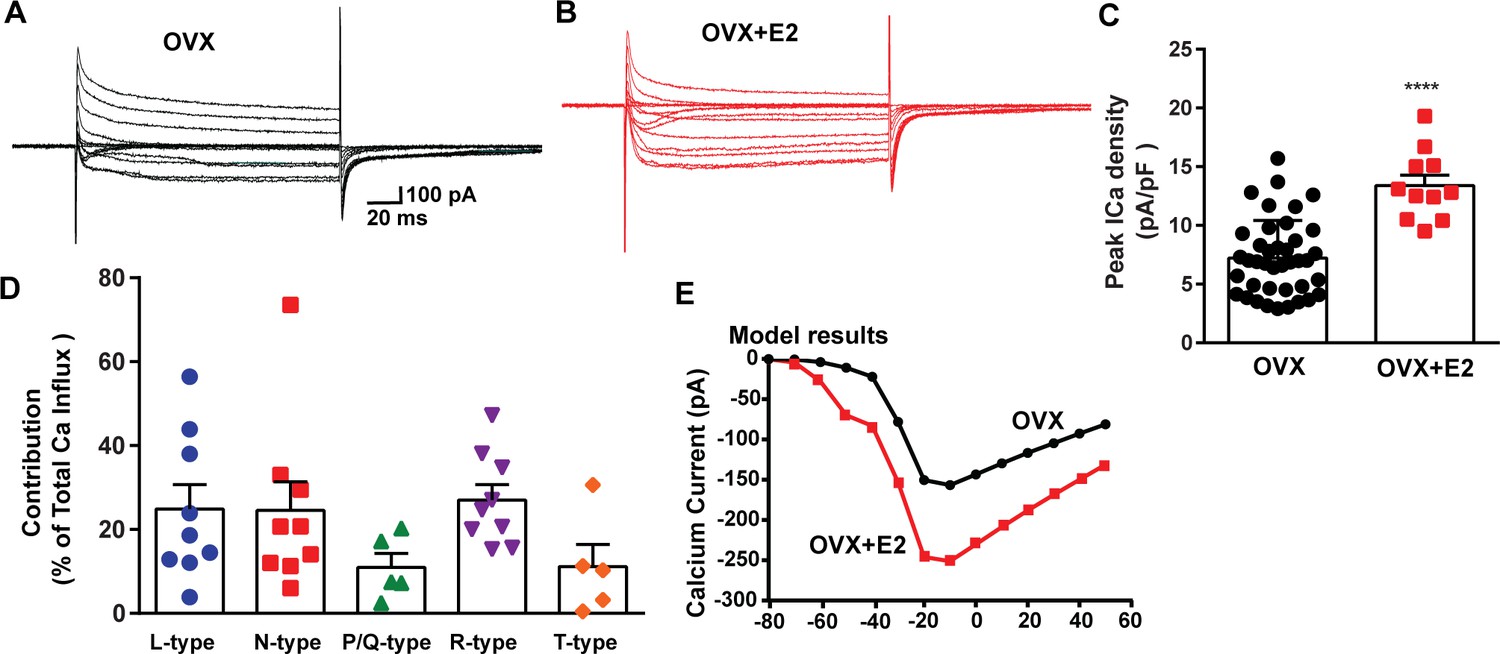
E2 treatment (positive feedback regimen) increases the Ca2+ currents in Kiss1ARH neurons.
(A, B) Ca2+ currents in Kiss1ARH neurons with the same membrane capacitance from oil-treated (A) or E2-treated (B) animals. (C) The maximum peak currents were measured at –10 mV. The current amplitudes were normalized to the cell capacitance in all cases to calculate current density. The bar graphs summarize the density of Ca2+ current in Kiss1ARH neurons from oil-treated and E2-treated animals. The mean density was significantly greater in E2-treated (13.4 ± 0.9 pA/pF, n = 11) than in oil-treated OVX females (7.2 ± 0.5 pA/pF, n = 40) (unpaired t-test, t(49) = 5.75, ****p<0.0001). (D) Relative contribution of voltage-gated calcium currents in Kiss1ARH neurons from OVX, E2-treated mice. The maximum peak currents were measured at –10 mV. The proportions of Ca2+ currents inhibited by nifedipine (L type), ω-conotoxin GVIA (N type), ω-agatoxin IVA (P/Q), SNX-482 (R type), and TTA-P2 (T type). Data are expressed as mean ± SEM, with data points representing individual cells. (E) The modeling predicts that E2-treated, OVX females exhibit a significantly greater inward Ca2+ current (red trace) than the vehicle-treated females (black trace). The conductance of the modeled voltage-gated calcium current (L-, N-, P/Q-, and R-type) is set to 2.1 nS in the OVX state and 2.8 nS in OVX + E2 state, while for the T-type is set to 0.66 nS in the OVX state and 5 nS in OVX + E2 state.
-
Figure 5—source data 1
Data presented in Figure 5.
- https://cdn.elifesciences.org/articles/96691/elife-96691-fig5-data1-v1.xlsx
Figure 6

Voltage dependence of ICa in Kiss1ARH neurons from OVX and OVX + E2 mice.
(A, B) Top panels: activation and inactivation protocol. Bottom: representative traces. (C, D) The mean V1/2 values for calcium channel activation were not significantly different for cells from controls versus cells from E2-treated females. Similarly, the V1/2 values for channel steady-state inactivation were similar for both groups. Data are expressed as mean ± SEM.
-
Figure 6—source data 1
Data presented in Figure 6.
- https://cdn.elifesciences.org/articles/96691/elife-96691-fig6-data1-v1.xlsx
Figure 7

Contribution of small conductance, calcium-activated K+ (SK) channel to Kiss1ARH neuronal excitability.
(A) Representative traces of the inhibition of outward currents before (left, control) and after the specific SK blocker apamin (500 nM, middle). Apamin-sensitive currents were calculated from the subtraction of control and apamin at depolarized potentials (right). Cells were clamped at –70 mV and given 500 ms voltage pulses from –60 mV to +40 mV in 10 mV steps at 0.2 Hz, as shown in (A) at the bottom. (B) Mean current density–voltage relationships measured at the end of the 500 ms voltage step ranging from –60 mV to +40 mV were obtained in the absence and presence of apamin (two-way ANOVA: main effect of treatment [F(1, 8) = 22.69, p=0.0014], main effect of voltage [F(10, 80) = 306.0, p<0.0001] and interaction [F(10, 80) = 24.76, p<0.0001]; mean ± SEM; n = 5; post hoc Bonferroni test, ***p<0.005, ****p<0.001). (C) Apamin-sensitive current densities were obtained from (B) (mean ± SEM, n = 5). (D) Representative traces of the inhibition of outward currents before (left, control) and after the specific SK blocker apamin (500 nM, middle). Apamin-sensitive currents resulted from the subtraction of control and apamin at depolarized potentials (right). (E) Mean current density–voltage relationships measured at the end of the 500 ms voltage step ranging from –60 mV to +40 mV were obtained in the absence and presence of apamin (two-way ANOVA: main effect of treatment [F(1, 10) = 12.85, p=0.0050], main effect of voltage [F(10,100) = 264.1, p<0.0001] and interaction [F(10, 100)=11.93, p<0.0001]; mean ± SEM, n = 6; post hoc Bonferroni test, **p<0.01, ****p<0.001). (F) Apamin-sensitive current densities were obtained from (C) and (E) (ns; two-way ANOVA followed by Bonferroni post hoc test; mean ± SEM; OVX, n = 5; OVX + E2, n = 6). (G) Kiss1ARH neurons (three 10-cell pools) were harvested from each of five vehicle- and five E2-treated, OVX females to quantify the mRNA expression of Kcnn3 ion channel. E2 did not increase the mRNA expression of small conductance calcium-activated K+ (SK3) channels in Kiss1ARH. Bar graphs represent the mean ± SEM, with data points representing individual animals, oil versus E2, Unpaired t-test, t(8) = 0.551, p=0.5967. The expression values were calculated via the ΔΔCT method, normalized to Gapdh and relative to the oil control values. (H) The mathematical model was calibrated on the electrophysiology data from Kiss1ARH neurons before and after treatment with the specific SK blocker apamin, left panel versus middle panel, respectively. For the calibration, it was assumed that the applied concentration of apamin (500 nM) completely blocked the SK current. The modeled apamin-sensitive current with gSK = 28.1 nS (right panel) matches the electrophysiological data from OVX animals.
-
Figure 7—source data 1
Data presented in Figure 7.
- https://cdn.elifesciences.org/articles/96691/elife-96691-fig7-data1-v1.xlsx
Figure 8
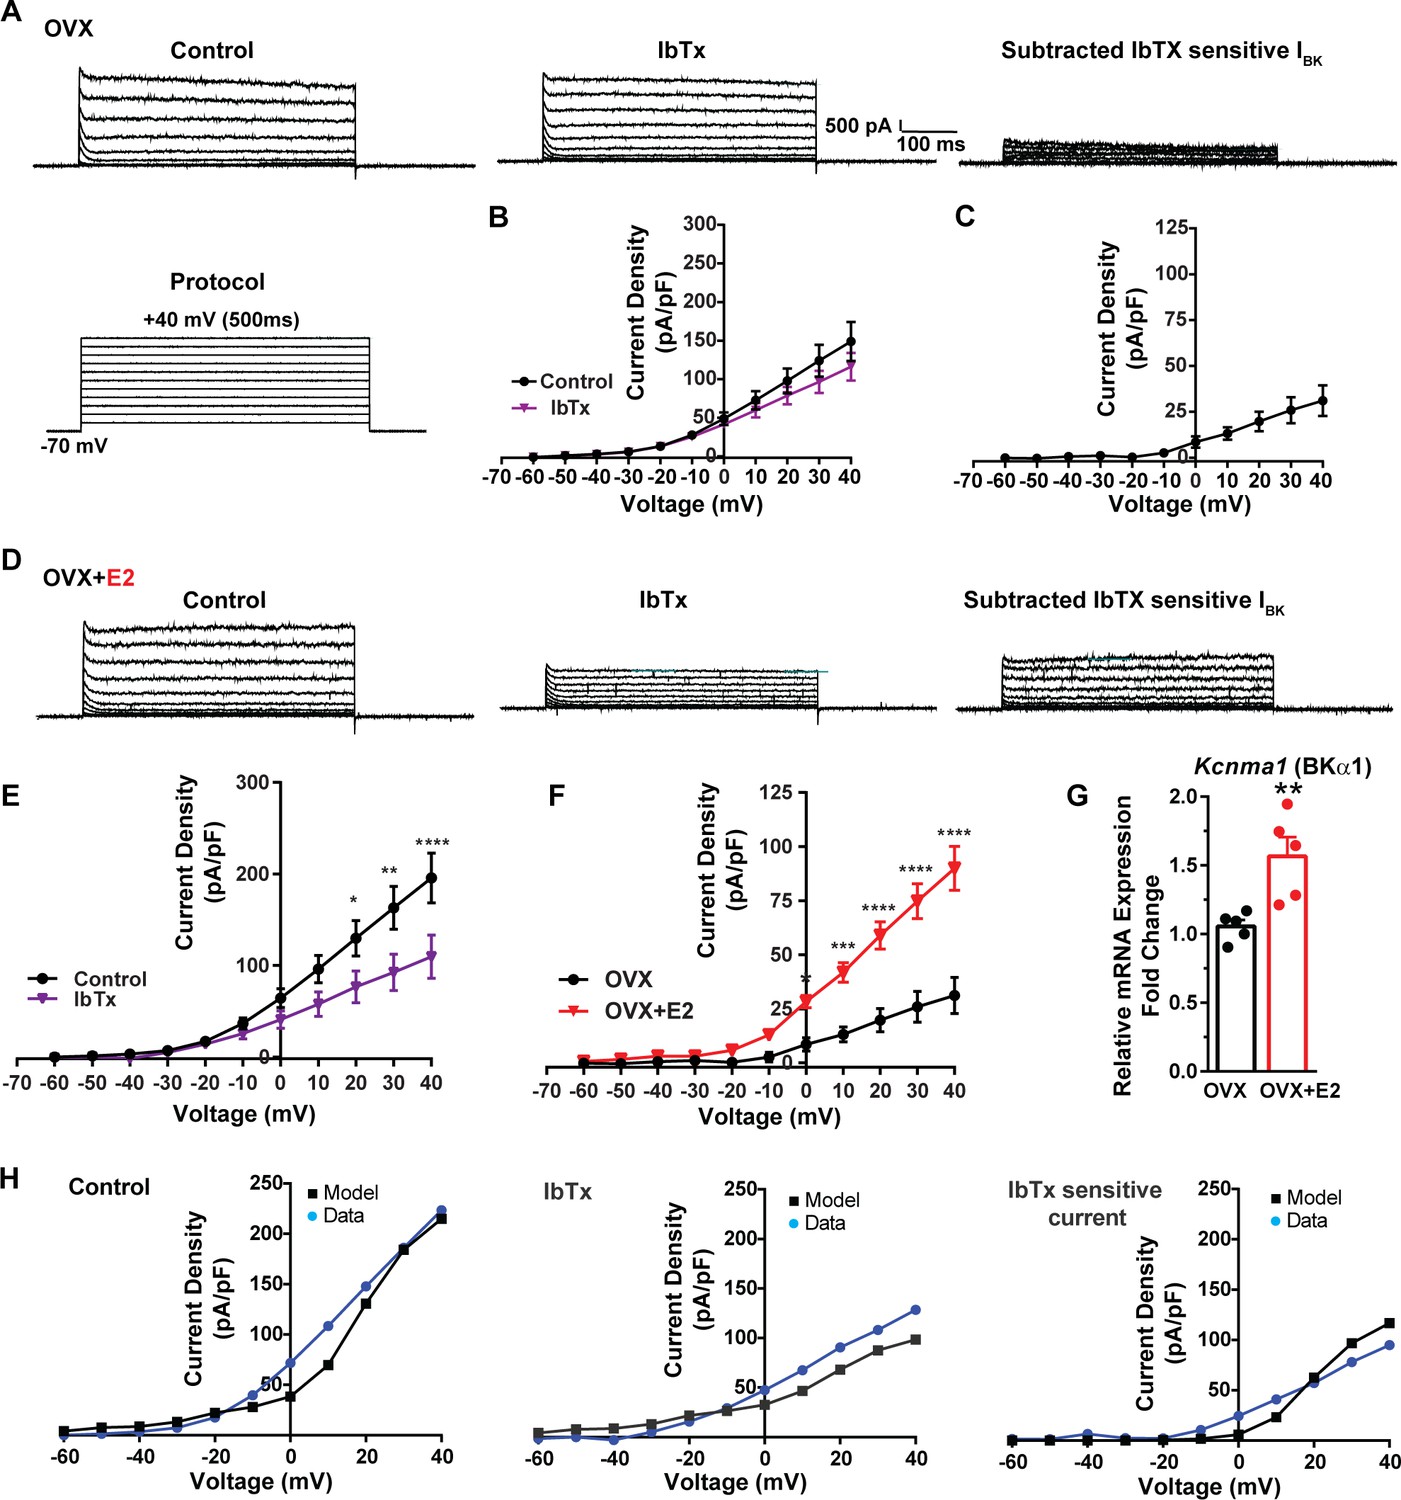
E2 upregulates Kcnma1 mRNA and BK current in Kiss1ARH neurons.
(A) Representative traces of the inhibition of outward currents before (left, control) and after the specific BK blocker iberiotoxin (IbTx; 200 nM, middle). IbTx-sensitive currents were calculated from the subtraction of control and IbTx at depolarized potentials (right). Cells were clamped at –70 mV and given 500 ms voltage pulses from –60 mV to +40 mV in 10 mV steps at 0.2 Hz, as shown in (A) at the bottom. (B) Mean current density–voltage relationships measured at the end of the 500 ms voltage step ranging from –60 mV to +40 mV were obtained in the absence and presence of IbTx (two-way ANOVA: main effect of treatment [F(1, 8) = 0.8841, p=0.3746], main effect of voltage [F(10, 80) = 71.56, p<0.0001] and interaction [F(10, 80) = 1.127, p=0.3528]; mean ± SEM, n = 5; post hoc Bonferroni test, p>0.05). (C) IbTX-sensitive current densities were obtained from (B) (mean ± SEM, n = 5). (D) Representative traces of the inhibition of outward currents before (left, control) and after the specific BK blocker iberiotoxin (IbTx; 200 nM, middle). IbTx-sensitive currents resulted from the subtraction of control and IbTx at depolarized potentials (right). (E) Mean current density–voltage relationships measured at the end of the 500 ms voltage step ranging from –60 mV to +40 mV were obtained in the absence and presence of IbTX (two-way ANOVA: main effect of treatment [F(1, 10) = 4.660, p=0.0562], main effect of voltage [F(10, 100) = 63.98, p<0.0001] and interaction [F(10, 100) = 4.907, p<0.0001]; mean ± SEM, n = 6; post hoc Bonferroni test, *p<0.05, **p<0.01, ****p<0.001). (F) IbTx-sensitive current densities were obtained from (C) and (E) (two-way ANOVA: main effect of treatment [F(1, 9) = 22.04, p=0.0011], main effect of voltage [F(10, 90) = 78.26, p<0.0001] and interaction [F(10, 90) = 17.84, p<0.0001]; mean ± SEM, OVX, n = 5; OVX + E2, n = 6; Bonferroni post hoc test, *p<0.05, ***p<0.005, ****p<0.001). (G) Kiss1ARH neurons (three 10-cell pools) were harvested from each of five vehicle- and five E2-treated, OVX females to quantify the mRNA expression of Kcnma1 (BKα1) channel. E2-treatment increased the mRNA expression of Kcnma1. The expression values were calculated via the ΔΔCT method, normalized to Gapdh and relative to the oil control values. Bar graphs represent the mean ± SEM, with data points representing individual animals (unpaired two-tailed t-test for BK, t(8) = 3.479, **p=0.0083). (H) The mathematical model was calibrated to reproduce the current–voltage relationship observed in Kiss1ARH neurons before and after treatment with IbTx. For the calibration, it was assumed that the applied concentration of IbTx (200 nM) completely blocked the BK current. The modeled IbTx -sensitive current with gBK = 20.0 nS (right panel) matches the electrophysiological data from OVX + E2 animals.
-
Figure 8—source data 1
Data presented in Figure 8.
- https://cdn.elifesciences.org/articles/96691/elife-96691-fig8-data1-v1.xlsx
Figure 9
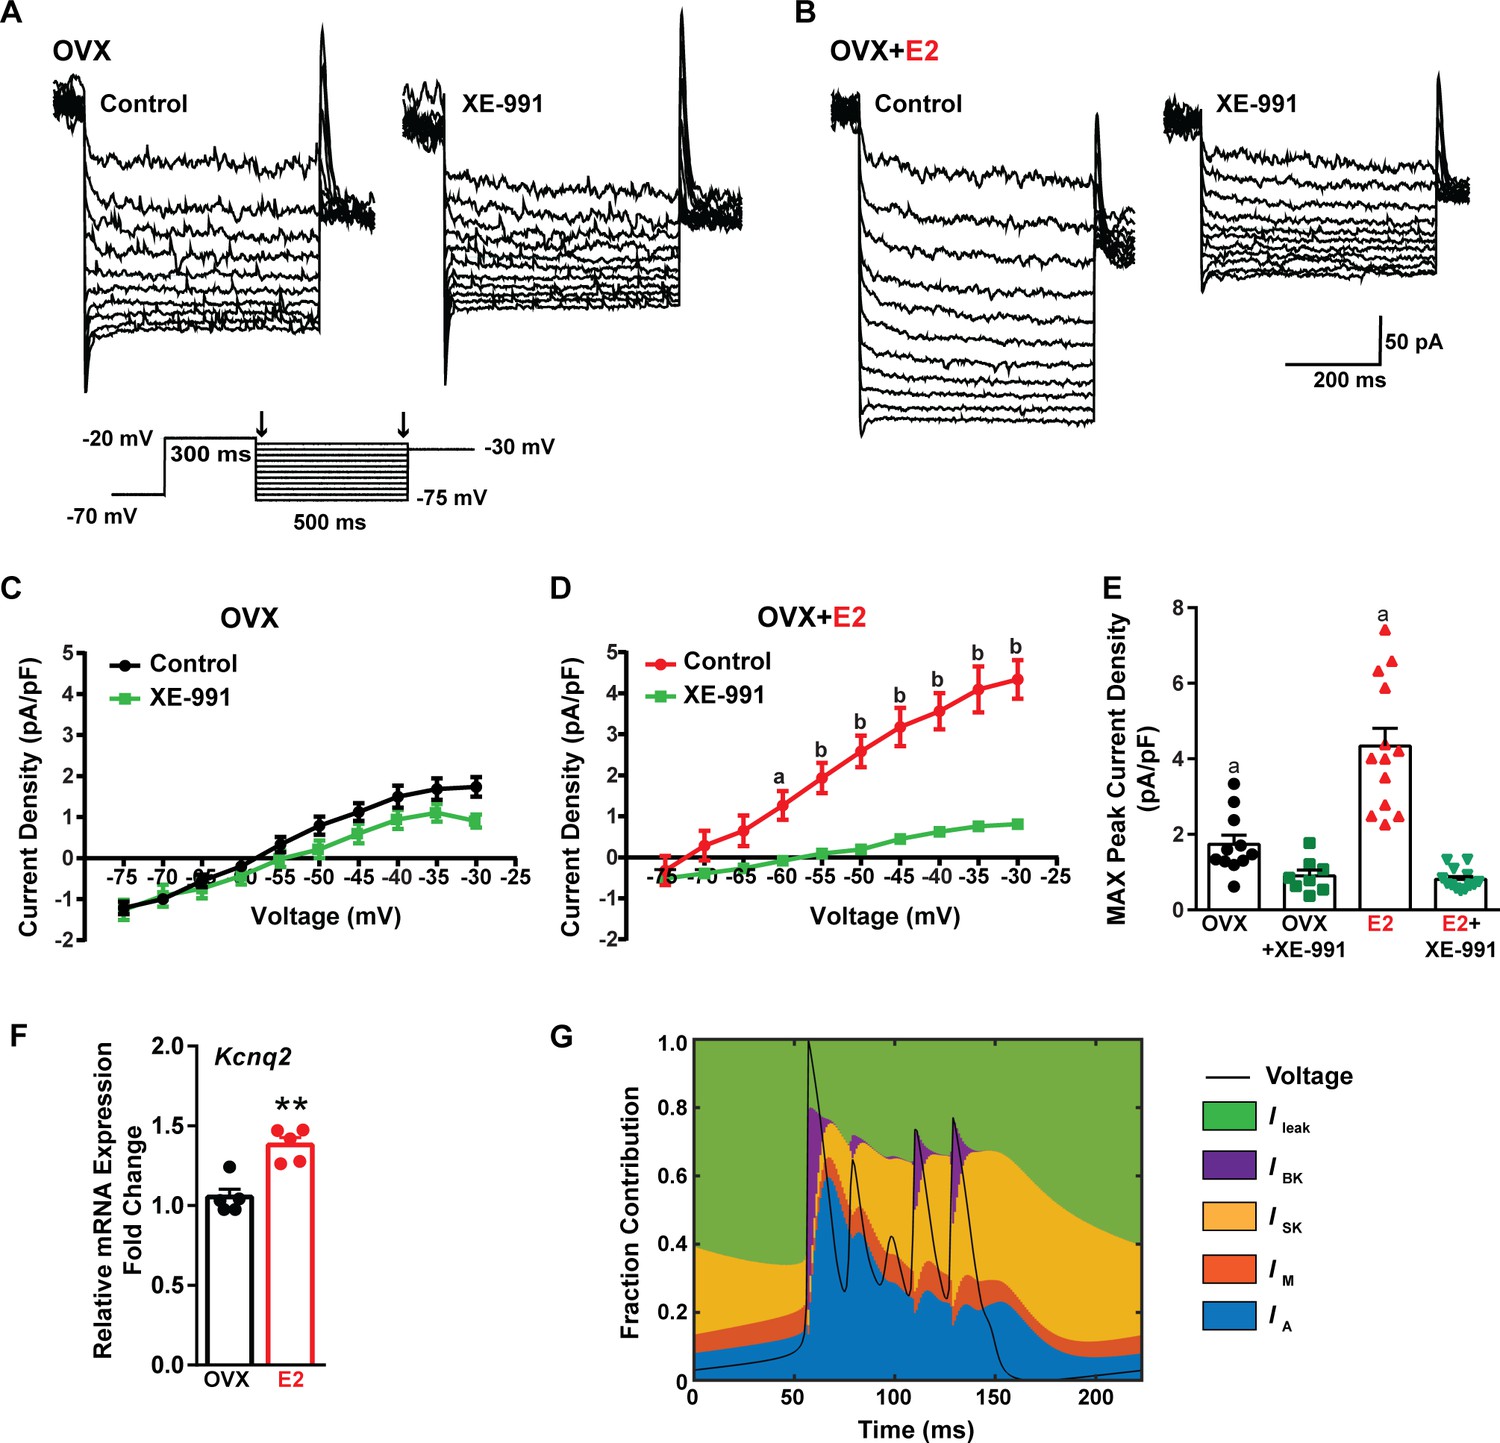
E2 upregulates Kcnq2 channels and M current in Kiss1ARH neurons.
(A, B) Representative current traces of the M current inhibition caused by 40 µM XE-991 perfused for 10 min in (A) OVX oil and (B) OVX + E2-treated female mice. Inset: M current deactivation protocol. (C, D) Current density–voltage plots from –75 to –30 mV of vehicle and XE-991 perfusion in (C) OVX oil and (D) OVX + E2-treated mice. Two-way ANOVA for (C): main effect of treatment (F(1, 17) = 1.908, p=0.1851), main effect of voltage (F(9, 153) = 187.1, p<0.0001) and interaction (F(9, 153) = 3.901, p=0.0002); Veh, n = 11; XE-991, n = 8; Bonferroni post hoc test, p>0.05. For (D): main effect of Veh and XE-991 (F(1, 24) = 24.92, p<0.0001), main effect of voltage (F(9, 216) = 174.5, p<0.0001) and interaction (F(9, 216) = 52.75, p<0.0001); Veh, n = 13; XE-991, n = 13; Bonferroni post hoc test, a = p<0.05, b = p<0.001. (E) Treatment with E2 elevated, while XE-991 diminished the maximum peak current density elicited by a –30 mV step in OVX- and OVX + E2-treated mice. Two-way ANOVA: main effect of Veh and XE-991 (F(1, 41) = 47.59, p<0.0001), main effect of OVX and OVX + E2 (F(1, 41) = 15.76, p=0.0003), and interaction F(1, 41) = 18.2, p=0.0001; Bonferroni post hoc test, Veh: OVX vs. OVX + E2, a = p<0.001. XE-991: OVX vs. OVX + E2, p>0.05. Data are expressed as mean ± SEM, with data points representing individual cells. (F) Kiss1ARH neurons (three 10-cell pools) were harvested from each of five vehicle- and five E2-treated, OVX females to quantify the mRNA expression of Kcnq2. E2 treatment increased the mRNA expression of Kcnq2. Unpaired t-test, t(8) = 4.850, **p=0.0013. Data are expressed as mean ± SEM, with data points representing individual animals. (G) Percent contribution of the different K+ currents to the repolarization current during burst-type firing activity in the OVX + E2 state. At each time point, the length of each color bar denotes the percent contribution of the corresponding current to the total outward current.
-
Figure 9—source data 1
Data presented in Figure 9.
- https://cdn.elifesciences.org/articles/96691/elife-96691-fig9-data1-v1.xlsx
Figure 10

Estradiol decreases Tac 2, Trpc5, and Kcnj6 but increases Slc17a6 mRNA expression in Kiss1ARH neurons.
(A) qPCR amplification curves illustrating the cycle threshold (CT) for Tac2, Gapdh, Kiss1, Trpc5, Slc17a6 (Vglut2), and Kcnj6 (Girk2) in Kiss1ARH ten cell neuronal pools (3–6 pools from each animal) in OVX Oil-treated and (B) OVX E2-treated females. (C) Quantitative real-time PCR analysis of Tac2 mRNA, (D) Slc17a6, (E) Trpc5, and (F) Kcnj6. Comparisons were made between oil-treated and E2-treated, OVX females using the comparative 2-ΔΔCT method. Bar graphs represent the mean ± SEM, with data points representing individual animals (unpaired t-test for Tac2, t(6) = 10.670, ***p<0.0001; for Slc17a6, t(7) = 9.678, ***p<0.0001; for Trpc5, t(6) = 5.774, **p=0.0012; unpaired t-test for Kcnj6, t(8) = 3.457, **p=0.0086).
-
Figure 10—source data 1
Data presented in Figure 10.
- https://cdn.elifesciences.org/articles/96691/elife-96691-fig10-data1-v1.xlsx
Figure 11
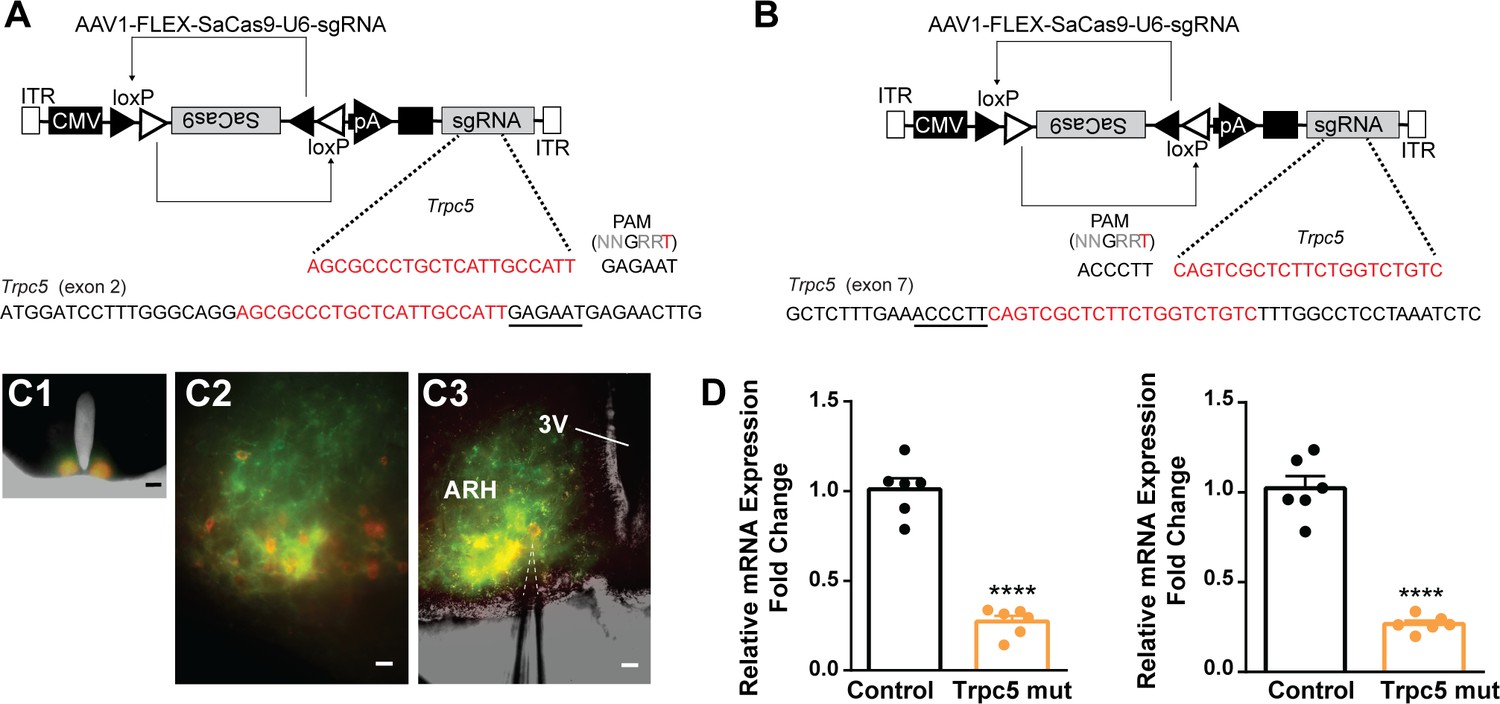
CRISPR mutagenesis of Trpc5 channels in Kiss1ARH neurons.
(A) Structure of AAV1-FLEX-SaCas9-U6sgTrpc5-exon2. Exon 2 of Trpc5 is denoted with guide sequence highlighted in red, the PAM is underlined. (B) Structure of AAV1-FLEX-SaCas9-U6sgTrpc5-exon7. Exon 7 of Trpc5 is denoted with guide sequence highlighted in red, the PAM is underlined. (C1) Image of coronal section through the ARH from Kiss1-Cre::Ai32 mouse with dual co-injections of AAV-DIO-mCherry and AAV1-FLEX-SaCas9-U6-sgTrpc5. Scale = 200 µm. (C2, C3) Higher-power overlays of epifluorescence (EYFP and mCherry) images with recording pipette patched onto a Kiss1ARH-Cre:mCherry cell (C3). Scale = 40 µm. (D) Quantitative PCR measurements of Trpc5 transcripts from 10-cell neuronal pools (three pools from each animal) in double sgRNA mutagenesis of Trpc5 (second sgRNA against pore-forming region) in Kiss1ARH neurons. Primers were targeted to first (left panel) or second (right panel) guide, respectively (unpaired t-test for first, t(10) = 10.67, ****p<0.0001; for second, t(10) = 10.79, ****p<0.0001). Data are expressed as mean ± SEM, with data points representing individual animals.
-
Figure 11—source data 1
Data presented in Figure 11.
- https://cdn.elifesciences.org/articles/96691/elife-96691-fig11-data1-v1.xlsx
Figure 12
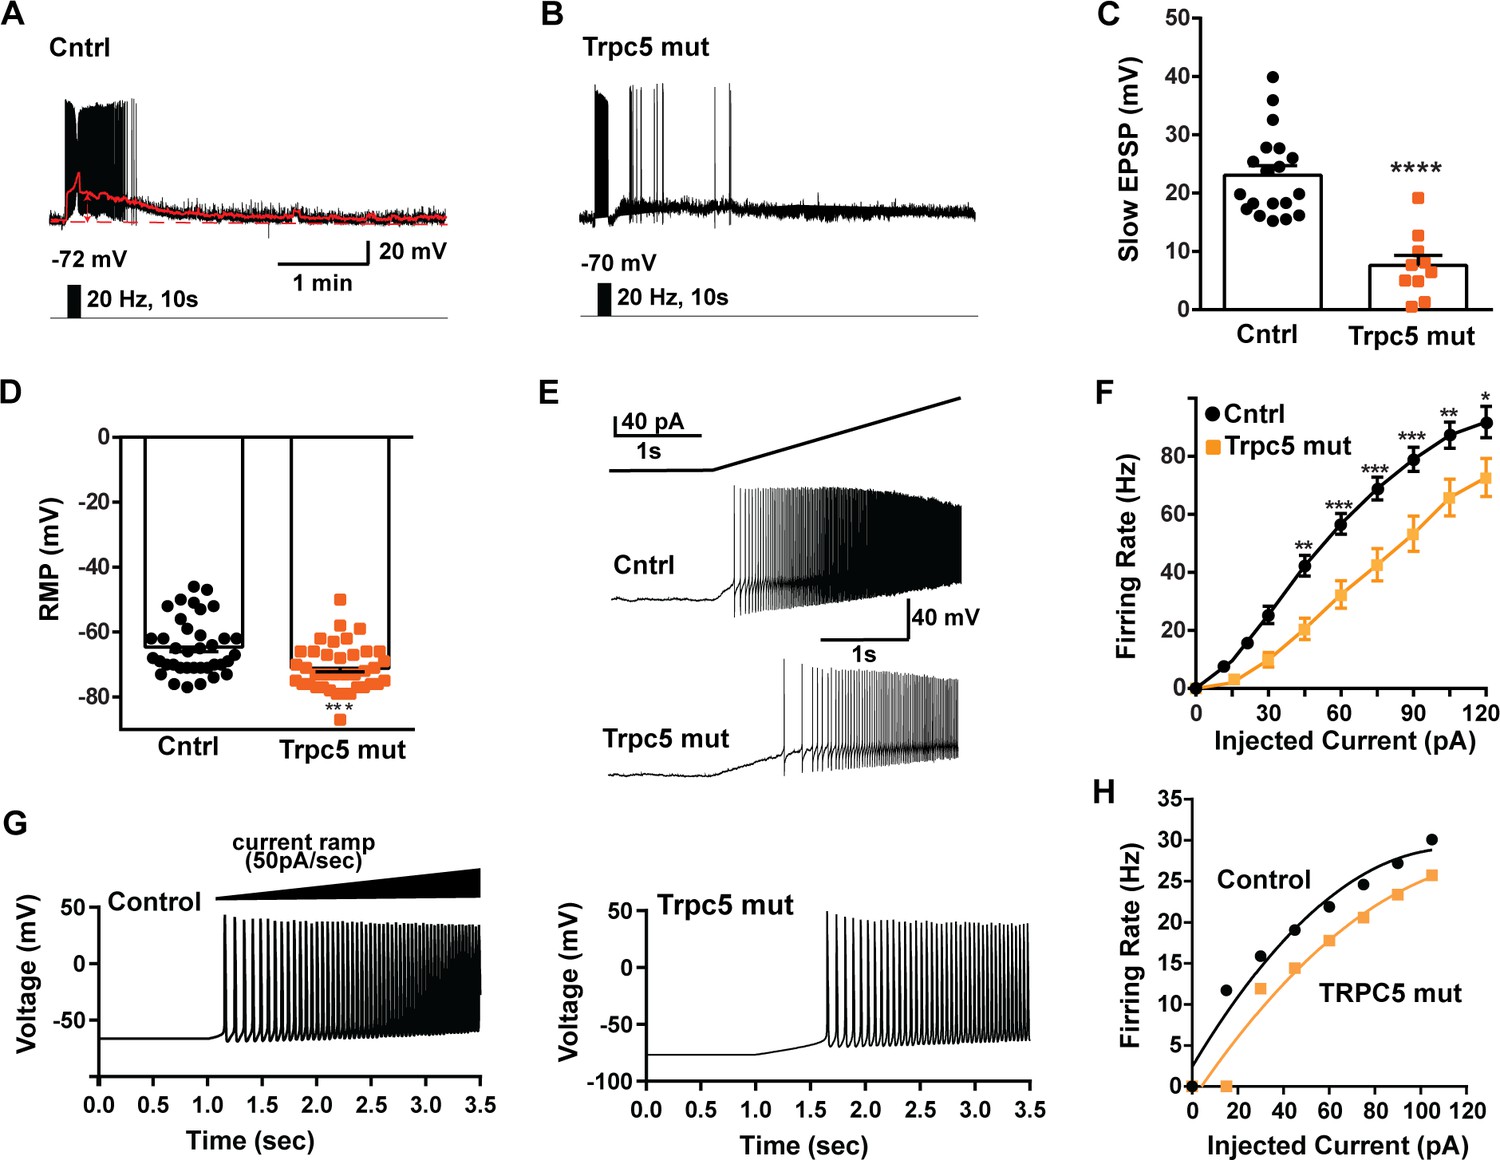
Double CRISPR mutagenesis of Trpc5 attenuates slow excitatory postsynaptic potential (EPSP), increases rheobase, and shifts the F-I curve.
(A) High-frequency photostimulation (20 Hz) generated slow EPSP in Kiss1ARH neuron from ovariectomized, control mouse. Red trace is slow EPSP after low-pass filtering. (B) Slow EPSP in Kiss1ARH neuron from OVX, double sgTrpc5 -targeted (Trpc5 mut) mouse. (C) Summary of the effects of Trpc5 mutagenesis on slow EPSP amplitude in female mice. Unpaired t-test, t(27) = 5.916, ****p<0.0001. Data are expressed as mean ± SEM, with data points representing individual cells. (D) Double sgRNA mutagenesis of Trpc5 channels in Kiss1ARH neurons significantly increased the RMP (control: –64.7 ± 1.4 mV versus Trpc5 mut: –71.1 ± 1.2 mV, unpaired t-test, t(73) = 3.524, ***p=0.0007). (E) Current ramp showing the increased rheobase in a Kiss1ARH neuron from Trpc5 mut mice (control: 31.1 ± 1.2 pA, n = 31, versus Trpc5 mut, 35.3 ± 1.0 pA, n = 33, unpaired t-test, t(62) = 2.777, **p=0.0073). (F) Firing frequency vs. current (F-I) curves for control versus Trpc5 mut (two-way ANOVA: main effect of treatment [F(1,52) = 13.04, p=0.0007], main effect of injected current [F(8,416) = 291.3, p<0.0001] and interaction [F(8,416) = 6.254, p<0.0001]; control, n = 26, Trpc5 mut, n = 28; post hoc Bonferroni test, *p<0.05; **p<0.01, and ***p<0.005, respectively). (G) Model simulations of the effects of a current ramp (50 pA/s) for OVX (left panel) and OVX female with reduced (muted) TRPC5 conductance (right panel), and (H) the associated firing frequency versus current curves. In the latter case, the TRCP5 conductance was halved, which is a conservative estimation of the CRISPR state in which the Trpc5 is much more mutated in Kiss1ARH neurons (Figure 11D).
-
Figure 12—source data 1
Data presented in Figure 12.
- https://cdn.elifesciences.org/articles/96691/elife-96691-fig12-data1-v1.xlsx
Figure 13
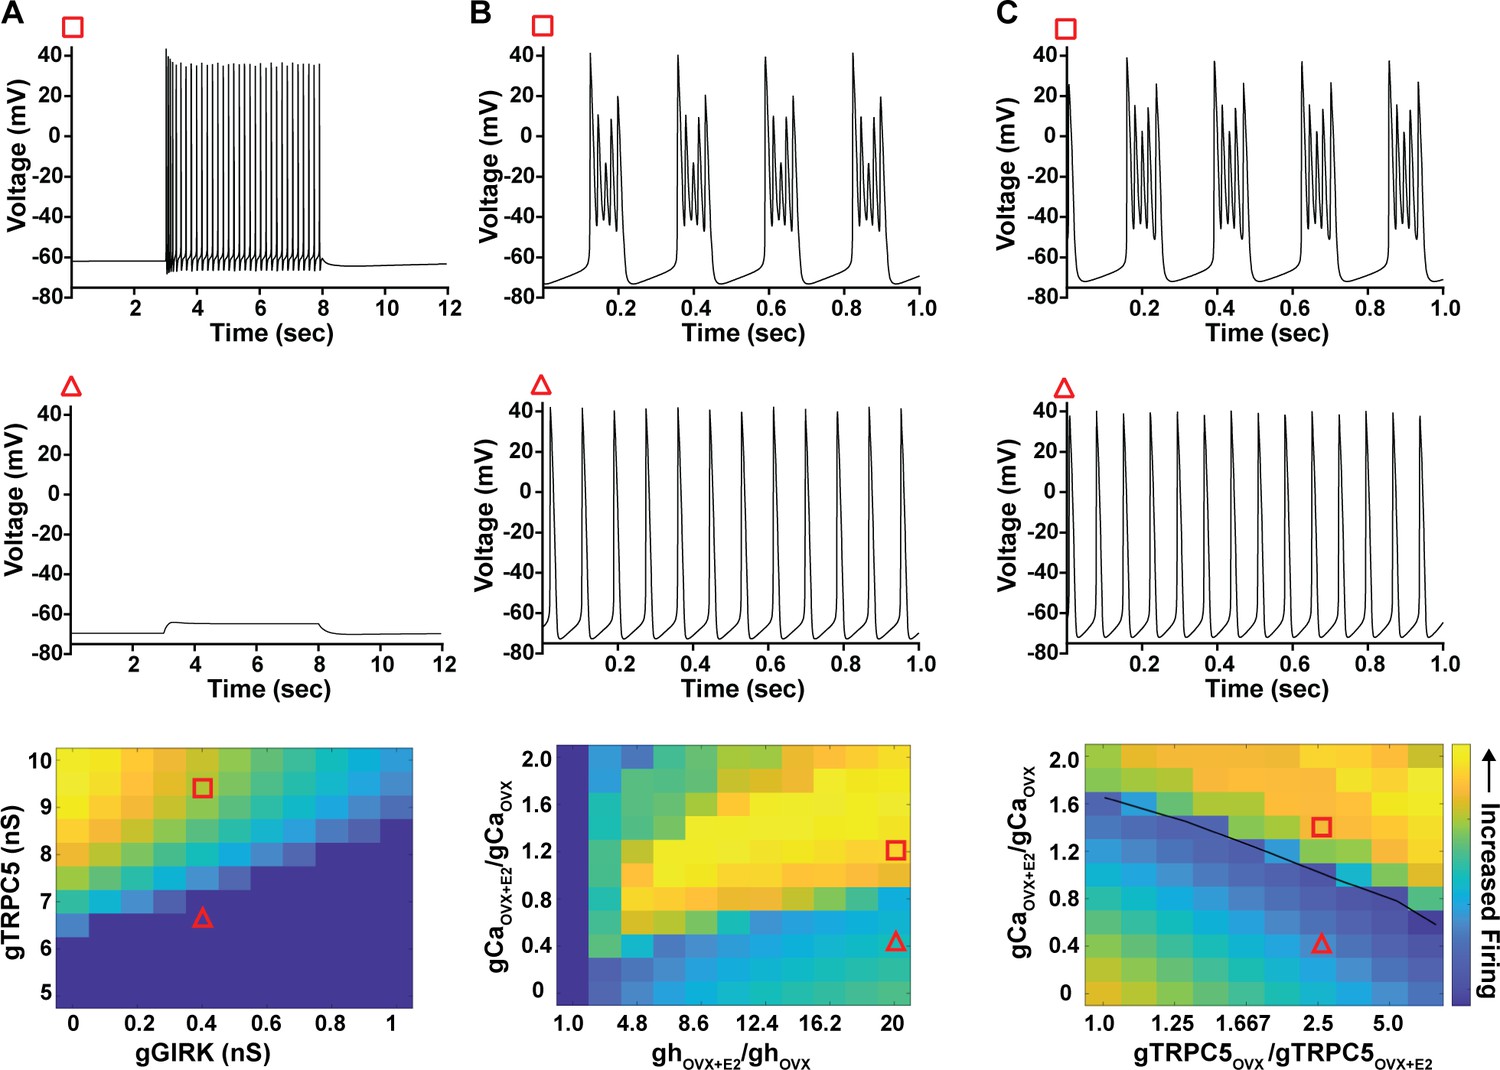
Computational modeling of a Kiss1ARH neuron in the OVX and OVX + E2 state demonstrates its distinct dynamic responses.
A model of the Kiss1ARH neuron was developed and calibrated using molecular data and electrophysiological recordings of Kiss1ARH neurons from OVX and OVX + E2 mice. (A) Simulations of the OVX-parameterized model demonstrating high-frequency activity in response to saturating levels of NKB stimulation. The balance between GIRK and TRCP5 conductance controls the response of the neuron to NKB stimulation, with neuronal response eliminated when TRPC5 conductance is low (red triangle) relative to the GIRK conductance. (B) The OVX + E2 parameterized models demonstrate sustained burst firing activity. The bursting activity that is supported by elevated h- and Ca2+ currents (red square) as observed in OVX + E2 mice. (C) In the OVX + E2 state, burst firing activity is also supported by high conductance of HVA Ca2+ channels relative to the conductance of TRPC5 channels. Representative points in the parameter space giving rise to burst firing activity are marked with red squares, whereas red triangles are used for points resulting in regular spiking. The black line separates these two regions of activity.
-
Figure 13—source data 1
Data presented in Figure 13.
- https://cdn.elifesciences.org/articles/96691/elife-96691-fig13-data1-v1.xlsx
Appendix 1—figure 1

Schematic diagram of the conductance-based mathematical model of arcuate nucleus Kiss1 neurons.
Author response image 1
Tables
Table 1
Primer table.
| Gene name (encodes for) | Accession number | Primer location (bp) | Product length (bp) | Annealing temperature (°C) | Efficiency slope | r2 | % |
|---|---|---|---|---|---|---|---|
| Cacna1c (Cav 1.2,L-type) | NM_009781 | 1331–1348 1390–1407 | 77 | 60 | –3.478 | 0.989 | 94 |
| Cacna1a (Cav 2.1,P/Q-type) | NM_007578 | 6035–6054 6090–6109 | 75 | 60 | –3.498 | 0.980 | 93 |
| Cacna1b (Cav 2.2,N-type) | NM_001042528 | 5405–5426 5467–5488 | 84 | 60 | –3.483 | 0.992 | 94 |
| Cacna1e (Cav 2.3,R-type) | NM_009782 | 530–549 617–636 | 107 | 60 | –3.441 | 0.983 | 95 |
| Cacna1g (Cav 3.1,T-type) | NM_009783 | 5004–5025 5060–5083 | 80 | 60 | –3.372 | 0.968 | 98 |
| Hcn1 (HCN1) | NM_010408 | 1527–1546 1641–1662 | 136 | 60 | –3.253 | 0.958 | 100 |
| Hcn2 (HCN2) | NM_008226 | 1122–1143 1199–1218 | 97 | 60 | –3.279 | 0.969 | 100 |
| Kcnd2 (KCND2) | NM_019697 | 2135–2156 2217–2238 | 104 | 60 | –3.312 | 0.972 | 100 |
| Kcnn3 (SK3) | NM_080466 | 1259–1277 1352–1370 | 112 | 60 | –3.369 | 0.952 | 98 |
| Kcnma1 (BKα1) | NM_001253358 | 2745–2762 2833–2852 | 108 | 60 | –3.338 | 0.971 | 99 |
| Kcnb1 (KCNB1) | NM_008420 | 691–710 759–780 | 119 | 60 | –3.375 | 0.983 | 98 |
| Kcnq2 (KCNQ2) | NM_010611 | 1079–1098 1151–1170 | 92 | 60 | –3.367 | 0.978 | 98 |
| Tac2 (NKB) | NM_009312 | 368–389 490–511 | 144 | 60 | –3.440 | 0.989 | 95 |
| Slc17a6 (VGLUT2) | NM_080853 | 1275–1296 1371–1390 | 116 | 60 | –3.374 | 0.997 | 98 |
| Trpc5 (TRPC5)* | NM_009428 | 734–753 832–851 | 118 | 60 | –3.161 | 0.952 | 100 |
| Trpc5 (TRPC5)† | NM_009428 | 616–637 772–792 | 177 | 60 | –3.407 | 0.987 | 97 |
| Trpc5 (TRPC5)† | NM_009428 | 2083–2100 2162–2179 | 97 | 60 | –3.255 | 0.963 | 100 |
| Kcnj6 (GIRK2) | NM_001025584 | 488–507 592–609 | 122 | 60 | –3.368 | 0.919 | 98 |
| Gapdh (GAPDH) | NM_008084 | 689–706 764–781 | 93 | 60 | –3.352 | 0.998 | 99 |
-
*
Trpc5 primers (Figure 10E).
-
†
Trpc5 primers flanking sgRNA and PAM sites in mutagenesis (Figure 11D).
Key resources table
| Reagent type (species) or resource | Designation | Source or reference | Identifiers | Additional information |
|---|---|---|---|---|
| Strain, strain background (Mus musculus) | C57BL/6J | The Jackson Laboratory | RRID:IMSR_JAX:000664 | |
| Genetic reagent (M. musculus) | Kiss1Cre:GFP version 2 (V2) | Dr. Richard D. Palmiter; University of Washington; PMID:29336844 | RRID:IMSR_JAX:033169 | |
| Genetic reagent (M. musculus) | Ai32 | The Jackson Laboratory | RRID:IMSR_JAX:024109 | |
| Genetic reagent (Adeno-associated virus) | AAV1-FLEX-SaCas9-U6-sgTrpc5-exon2 | Dr. Larry S. Zweifel; University of Washington | ||
| Genetic reagent (Adeno-associated virus) | AAV1-FLEX-SaCas9-U6-sgTrpc5-exon7 | Dr. Larry S. Zweifel; University of Washington | ||
| Genetic reagent (Adeno-associated virus) | AAV1-FLEX-SaCas9-U6-sgRosa26 | Dr. Larry S. Zweifel; University of Washington | ||
| Genetic reagent (Adeno-associated virus) | AAV1-Ef1α-DIO-ChR2:YFP | Dr. Stephanie L. Padilla; University of Washington; PMID:25429312 | ||
| Genetic reagent (Adeno-associated virus) | AAV1-Ef1α-DIO-ChR2:mCherry | Dr. Stephanie L. Padilla; University of Washington; PMID:25429312 |
Appendix 1—table 1
Table of model parameters.
| Model parameters | ||||||
|---|---|---|---|---|---|---|
| 23.13 nF (19.5 in OVX + E2) | ||||||
| Current parameters* | Reference | |||||
| 4.5 ms | –43.2 mV | Fry et al., 2007 | ||||
| –25 mV | 3 mV | |||||
| –8.2 mV | 90 nS | |||||
| 66.1 mV | ||||||
| 250 ms | –47.4 mV | Zhang et al., 2015; Moran et al., 2016 | ||||
| –41.5 mV | 3 mV | |||||
| –8.5 mV | 3.37 nS | |||||
| 66.1 mV | ||||||
| 10 ms | –55.1 mV | Mendonça et al., 2016; Mendonça et al., 2018 | ||||
| 20 ms | –30 mV | |||||
| –11.4 mV | 10 mV | |||||
| 60 nS in OVX 35 in OVX + E2 | –81 mV | |||||
| 10 mV | 18 mV | Tsaneva-Atanasova et al., 2007 | ||||
| –22.52 mV | 1.5 μM | |||||
| 13.50 nS in OVX; 20 nS in OVX + E2 | –81 mV | |||||
| 0.45 μM | 4 | Bond et al., 1999 | ||||
| 28.13 nS in OVX; 26.05 nS in OVX + E2 | –81 mV | |||||
| 10 ms | –50 mV | Nowacki et al., 2011; Conde and Roepke, 2020 | ||||
| 20 mV | 0.23 nS in OVX 1.23 ns in OVX + E2 | |||||
| –81 mV | ||||||
| 80 ms | –102 mV | Gottsch et al., 2011; Booth et al., 2016; Qiu et al., 2018 | ||||
| 310 ms | –102 mV | |||||
| 0.85 | –10 mV | |||||
| –10 mV | 0.56 nS (11.23 nS in OVX + E2) | |||||
| –27.8 mV | ||||||
| 1.94 ms | –69.1 mV | Zhang et al., 2015; Wang et al., 2016 | ||||
| 86.3 ms | –69.1 mV | |||||
| 0.5 | –54 mV | |||||
| –5.3 mV | –5.3 mV | |||||
| 3.3 mV | 0.66 nS (5 nS in OVX + E2) | |||||
| 10 ms | –48.9 | fitted | ||||
| 300 ms | –27.3 mV | |||||
| –18.2 | 4.62 mV | |||||
| 2.1 nS (2.8 nS in OVX + E2) | 121.6 mV | |||||
| 0.6 μM | 0.33 μM | Qiu et al., 2021 | ||||
| 0.006 ms–1 | 0.002 ms–1 | |||||
| 0.002 ms–1 | 8.4 nS (1.68 nS in OVX + E2) | |||||
| 32 μM | 2 | |||||
| 1 μM | –15 mV | |||||
| –70 mV | 20 mV | Tian et al., 2022 | ||||
| 0.8 | 0.0061 | |||||
| 100 mV | 0.0818 | |||||
| 0.4 nS | –81 mV | |||||
| 0 ms–1 | 10–3 ms–1 | |||||
| 1 μM | 1 μM | |||||
| 3.3⋅10–6 ms–1 | 2 | |||||
| 3.5 nS in OVX 3.65 nS in OVX + E2 | 4 nS | Fitted | ||||
| Intracellular calcium | ||||||
| 1.96 ⋅10–5μM nA–1 ms–1 | 0.008 ms–1 | Tsaneva-Atanasova et al., 2007 | ||||
| 0.9 | ||||||
-
*
Parameters g∙ denote the maximum conductance associated with each current.
Additional files
Download links
A two-part list of links to download the article, or parts of the article, in various formats.
Downloads (link to download the article as PDF)
Open citations (links to open the citations from this article in various online reference manager services)
Cite this article (links to download the citations from this article in formats compatible with various reference manager tools)
Estradiol elicits distinct firing patterns in arcuate nucleus kisspeptin neurons of females through altering ion channel conductances
eLife 13:RP96691.
https://doi.org/10.7554/eLife.96691.4


