Role of hepatocyte RIPK1 in maintaining liver homeostasis during metabolic challenges
- School of Environmental and Biological Engineering, Key Laboratory of Metabolic Engineering and Biosynthesis Technology, Ministry of Industry and Information Technology, Nanjing University of Science and Technology, China
- Department of Laboratory Medicine, Nanjing Drum Tower Hospital, Affiliated Hospital of Medical School, Nanjing University, China
- School of Medicine, Shenzhen Campus of Sun Yat-sen University, Sun Yat-sen University, China
- The First Affiliated Hospital, Basic Medical Sciences, University of South China, China
- Internal Medicine Department, Chengdu Jinniu District People's Hospital, China
- Affiliated Hospital of Nanjing University of Chinese Medicine, China
- CAS Key Laboratory of Nutrition, Metabolism and Food Safety, Shanghai Institute of Nutrition and Health, Shanghai Institutes for Biological Sciences, University of Chinese Academy of Sciences, China
Figures
Figure 1 with 2 supplements

RIPK1 deficiency in hepatocytes sensitizes the liver to short-term fasting-induced liver injury and hepatocyte apoptosis.
(A) Serum alanine amino-transferase (ALT) levels. (B) Serum aspartate amino-transferase (AST) levels. (C, D) Representative images and quantification of TUNEL staining. Scale bar, 100 μm. (E, F) Representative images and quantification of liver sections stained with anti-cleaved caspase-3 antibody (red) and DAPI (blue). Scale bar, 100 μm. (G) Representative images of liver sections stained with anti-phospho-MLKL antibody (red) and DAPI (blue). Scale bar, 100 μm. (H) Fluorescence microscopy images of the liver stained with anti-ALB antibody (red), TUNEL (green), and DAPI (blue). Scale bar, 100 μm. (I) Blood glucose levels. (J) Serum triglycerides (TG) levels. (K) Serum total cholesterol (TC) levels. (L) Serum free fatty acids (FFA) levels. (M) Serum β-hydroxybutyrate (BHB) levels. (N) Hepatic TG levels (mg/g tissue). (O) Liver tissue was stained by Oil Red O. Scale bar, 100 μm. The data was analyzed via two- or one-way ANOVA. Data are expressed as mean ± SEM (n = 6 per group). Asterisks denote statistical significance. ns, no significant, ***p < 0.001, ****p < 0.0001.
Figure 1—figure supplement 1
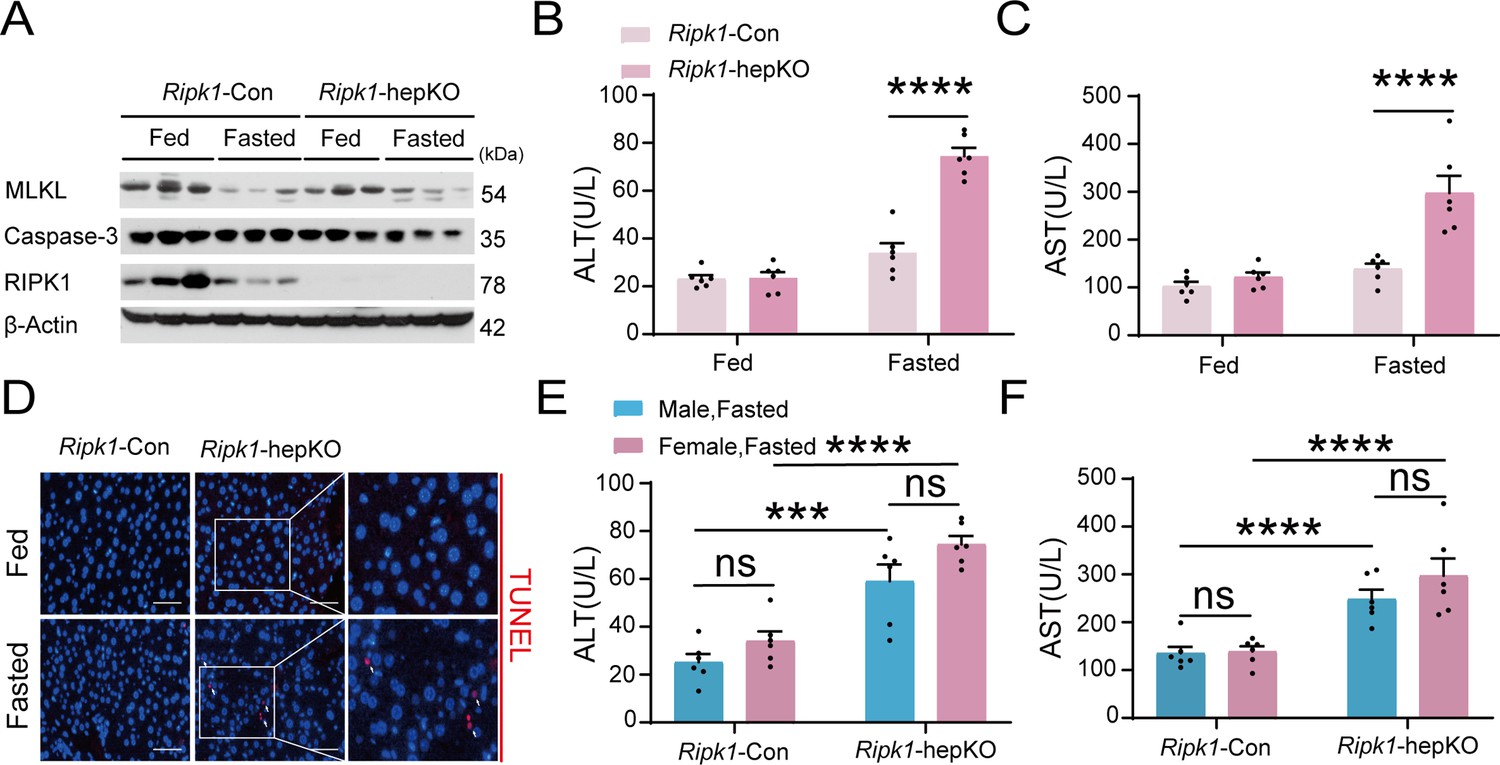
RIPK1 deficiency in hepatocytes sensitizes the liver to short-term fasting-induced liver injury and hepatocyte apoptosis in female mice.
(A) Western blot analysis of MLKL, Caspase-3, RIPK1, and β-Actin in liver tissue. (B) Serum alanine amino-transferase (ALT) levels. (C) Serum aspartate amino-transferase (AST) levels. (D) Representative fluorescence microscopy images of TUNEL staining. Scale bar, 50 μm. (E, F) There was no obvious difference between male and female mice in serum ALT (E) and AST (F) levels upon fasting. The data was analyzed via two- or one-way ANOVA. Data are expressed as mean ± SEM (n = 6 per group). Asterisks denote statistical significance. ns, no significant, ***p < 0.001, ****p < 0.0001.
-
Figure 1—figure supplement 1—source data 1
PDF file containing original western blots for Figure 1—figure supplement 1A, indicating the relevant bands and treatments.
- https://cdn.elifesciences.org/articles/96798/elife-96798-fig1-figsupp1-data1-v1.pdf
-
Figure 1—figure supplement 1—source data 2
Original files for western blot analysis displayed in Figure 1—figure supplement 1A.
- https://cdn.elifesciences.org/articles/96798/elife-96798-fig1-figsupp1-data2-v1.zip
Figure 1—figure supplement 2
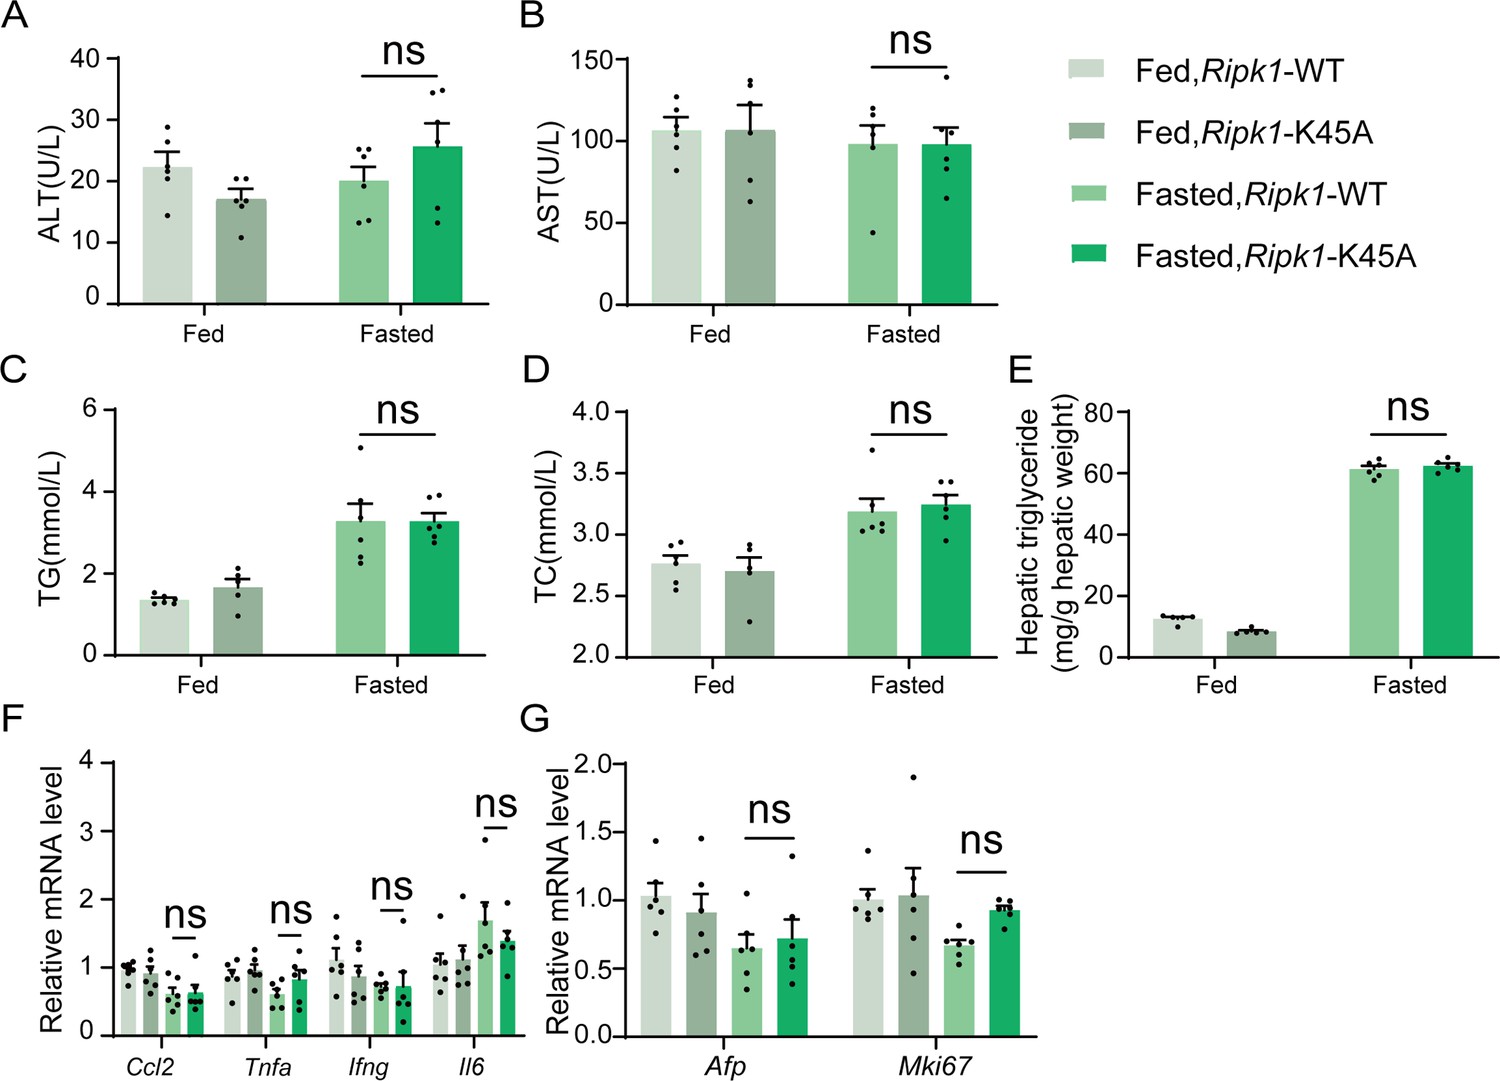
Analysis of Ripk1-WT and Ripk1-K45A mice before and after a 12-hr fasting period.
(A) Serum alanine amino-transferase (ALT) levels. (B) Serum aspartate amino-transferase (AST) levels. (C) Serum triglycerides (TG) levels. (D) Serum total cholesterol (TC) levels. (E) Hepatic TG levels (mg/g tissue). (F) Expression of inflammatory genes in the liver assessed by qPCR. (G) Transcriptional expression of Afp and Mki67 in liver tissue. The data was analyzed via two- or one-way ANOVA. Data are expressed as mean ± SEM (n = 6 per group). ns, no significant.
Figure 2
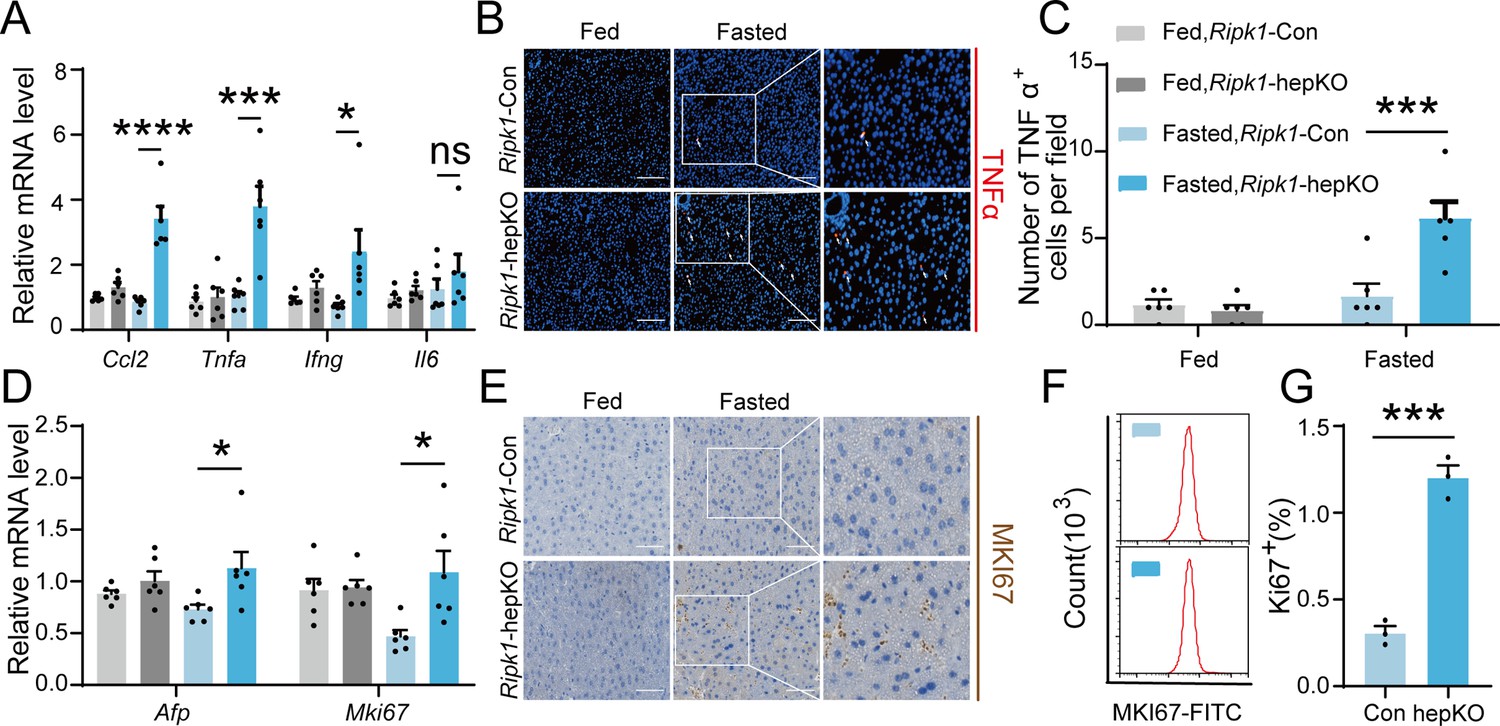
Short-term fasting-induced hepatic inflammation and compensatory proliferation in Ripk1-hepKO mice.
(A) Hepatic mRNA expression of the inflammatory molecules. (B, C) Representative images and quantification of the liver stained with anti-TNFα antibody (red) and DAPI (blue). Scale bar, 100 μm. (D) Transcriptional expression of Afp and Mki67 in liver tissue. (E) Representative images of the liver stained with anti-MKI67 antibody (brown) and hematoxylin (blue). Scale bar, 50 μm. (F) Representative flow cytometry plots showing MKI67-positive cells in the liver tissue (n = 3 per group). (G) Relative increase of MKI67-positive cells in the liver tissue of Ripk1-hepKO mice after 12 hr of fasting compared to that of Ripk1-Con mice (n = 3 per group). The data was analyzed via two- or one-way ANOVA. Data are expressed as mean ± SEM (n = 6 per group). ns, no significant, *p < 0.05, ***p < 0.001, ****p < 0.0001.
Figure 3 with 1 supplement
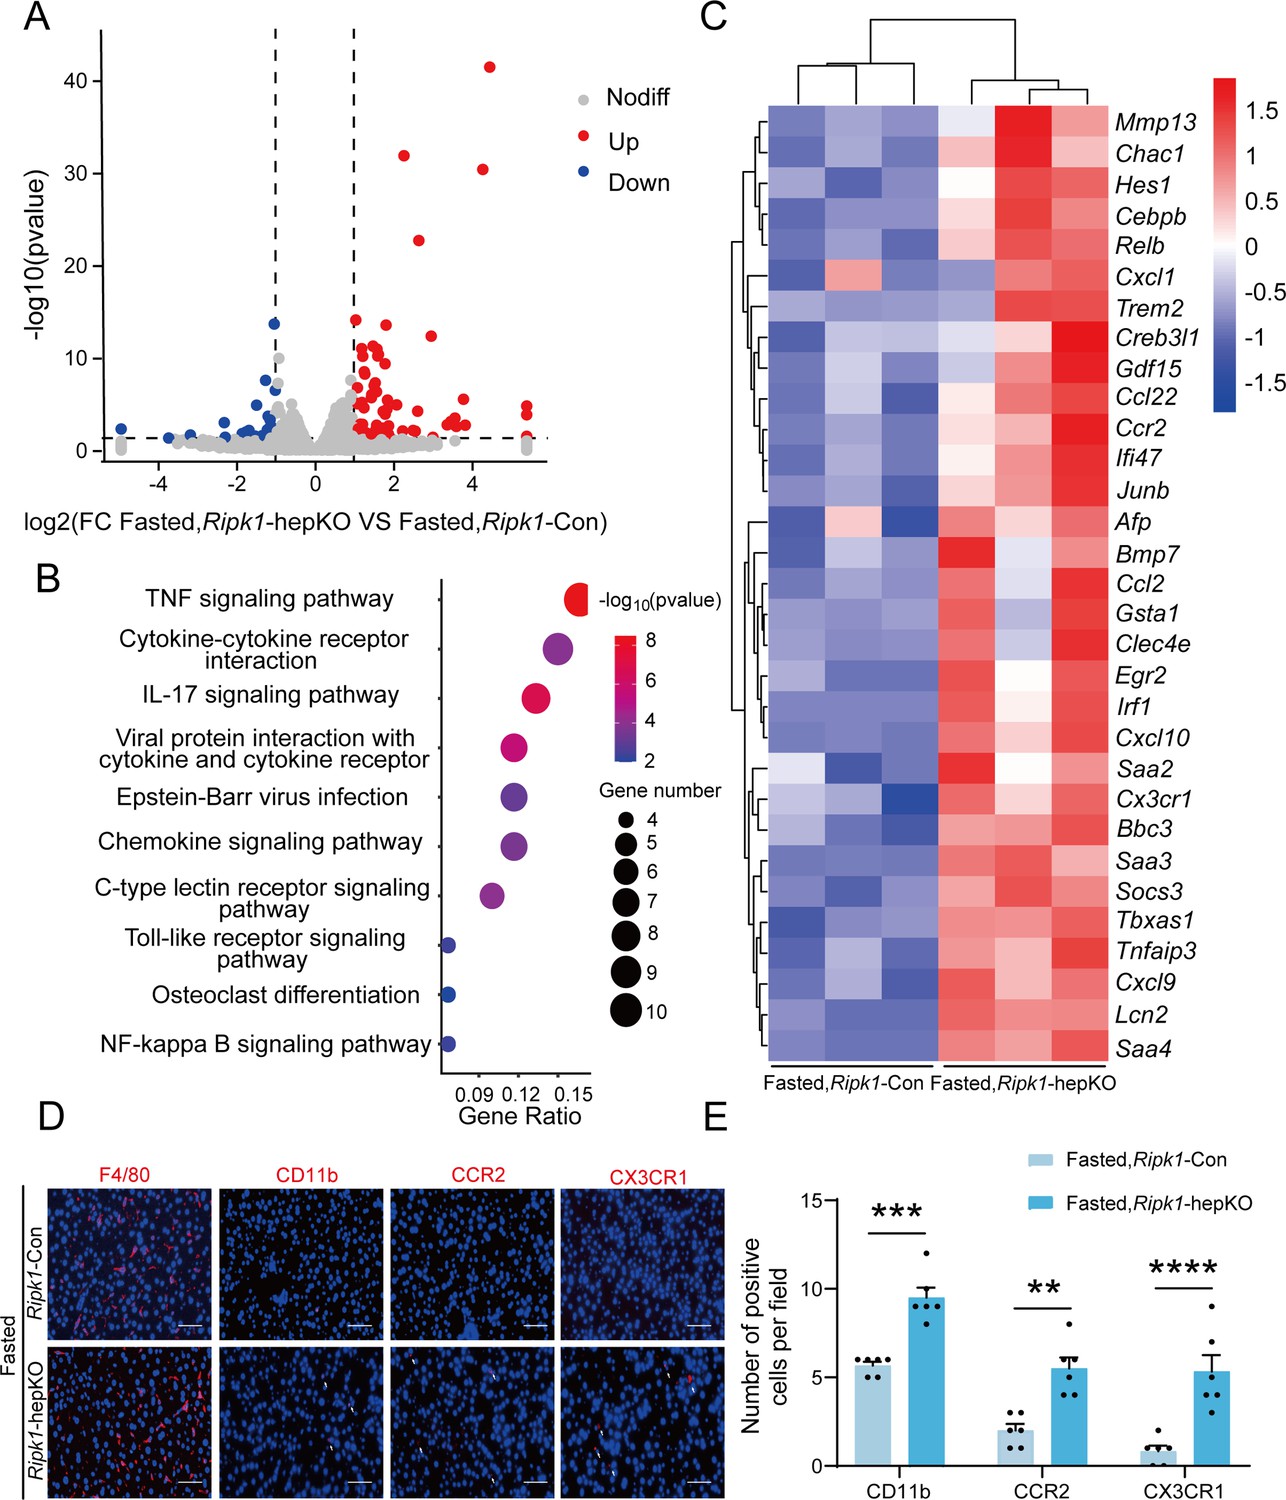
Transcriptome sequencing of the liver tissue from Ripk1-Con and Ripk1-hepKO mice.
(A) The volcano plot of differentially expressed genes was illustrated. The blue spots represent the down-regulated genes in Ripk1-hepKO group compared with control (Ripk1-Con) group, and the red spots represent the up-regulated genes in Ripk1-hepKO group. (B) The altered signaling pathways were enriched by Kyoto Encyclopedia of Genes and Genomes (KEGG) analysis. (C) The genes which expression were significantly altered in Ripk1-hepKO group were depicted in the heatmap. (D, E) Representative fluorescence microscopy images and quantification of the liver stained with anti-F4/80 antibody (red), anti-CD11b antibody (red), anti-CCR2 antibody (red), anti-CX3CR1 antibody (red), and DAPI (blue), respectively. Scale bar, 100 μm. The data was analyzed via two- or one-way ANOVA. Data are expressed as mean ± SEM (n = 6 per group). ns, no significant, **p < 0.01, ***p < 0.001, ****p < 0.0001.
Figure 3—figure supplement 1
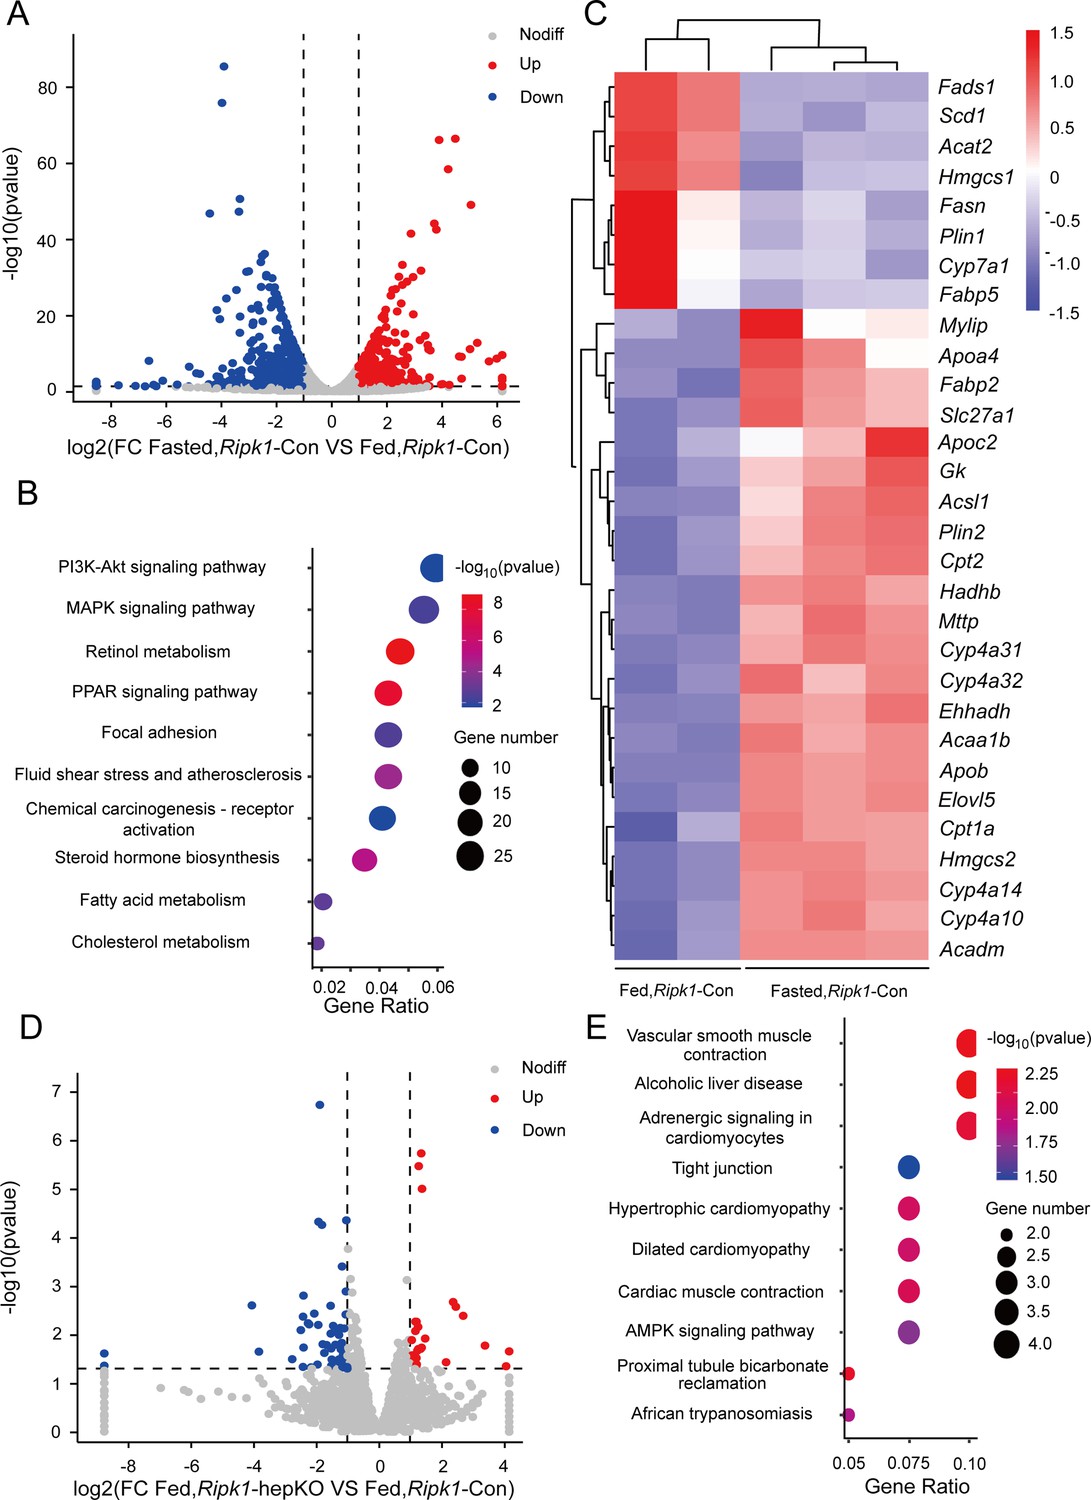
Transcriptome sequencing of the liver tissue from Ripk1-Con and Ripk1-hepKO mice.
(A) The volcano plot of differentially expressed genes was illustrated. The blue spots represent the down-regulated genes in fasted group compared with control (fed) group and the red spots represent the up-regulated genes in Ripk1-Con mice. (B) The altered signaling pathways were enriched by Kyoto Encyclopedia of Genes and Genomes (KEGG) analysis. (C) The genes which expression were significantly altered in fasted group were depicted in the heatmap. (D) The volcano plot of differentially expressed genes was illustrated. The blue spots represent the down-regulated genes in Ripk1-hepKO group compared with control (Ripk1-Con) group and the red spots represent the up-regulated genes in Ripk1-hepKO group. (E) The altered signaling pathways were enriched by KEGG analysis.
Figure 4 with 1 supplement
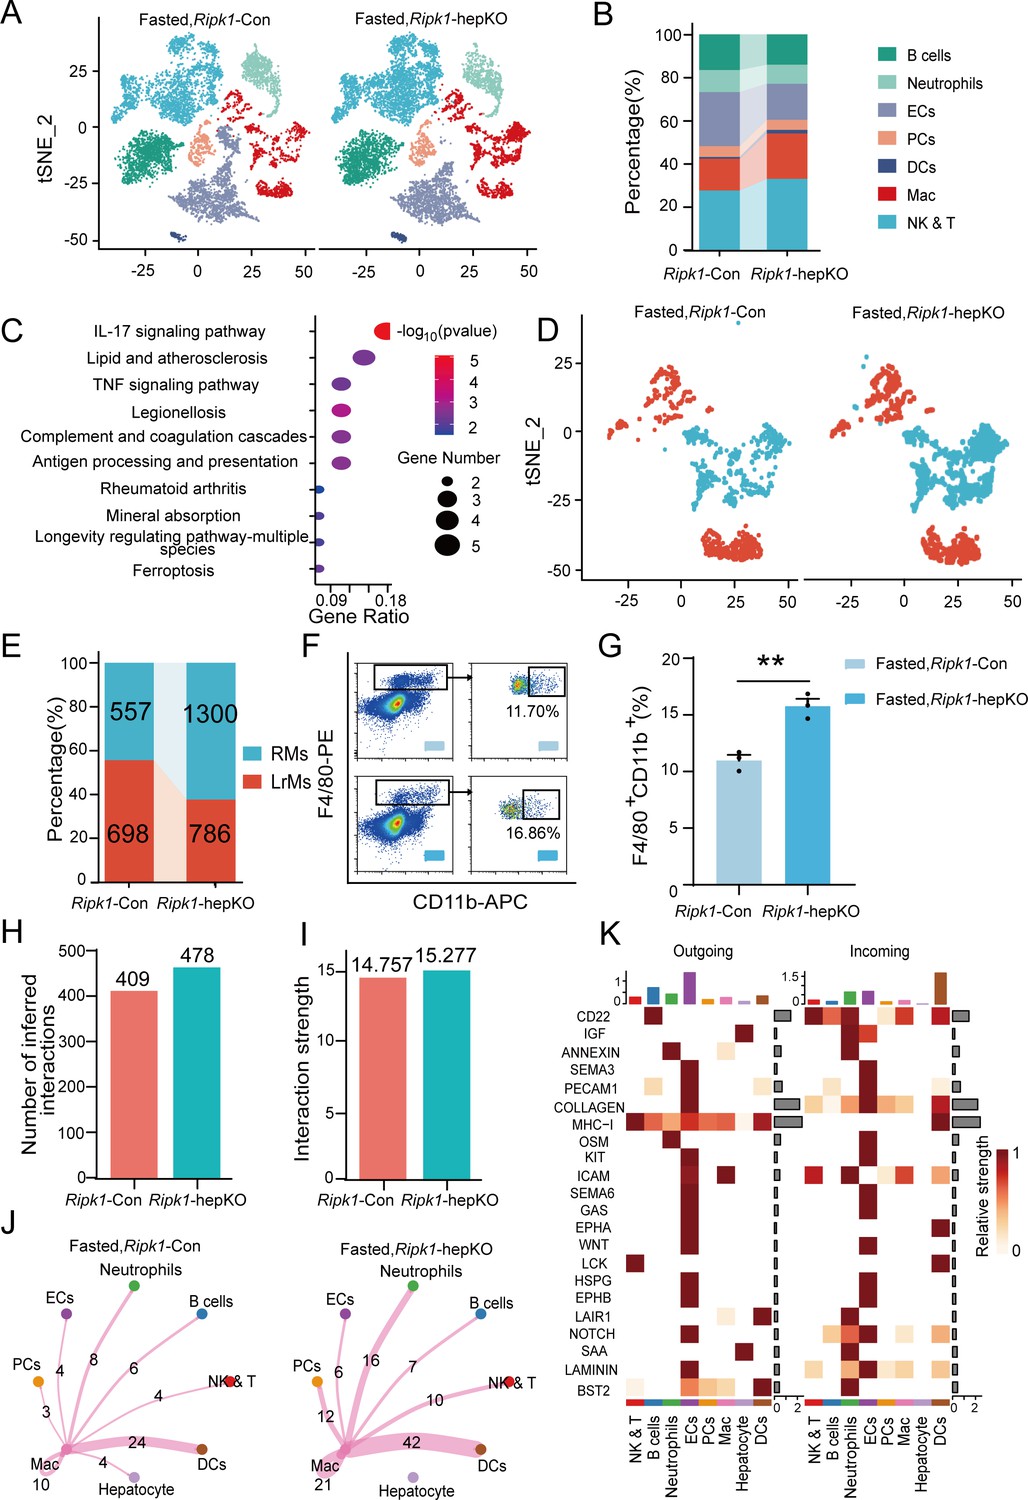
Single-cell RNA sequencing of liver tissue from Ripk1-Con and Ripk1-hepKO mice.
(A) T-distributed stochastic neighbor embedding (t-SNE) plots display color-coded cell subtypes of cells in the Ripk1-Con (left) and Ripk1-hepKO (right) mice liver tissues. (B) Bar charts display the proportion of major cell subtypes within all different genotypes after fasting. (C) The altered signaling pathways associated with differential gene changes in macrophages were enriched by Kyoto Encyclopedia of Genes and Genomes (KEGG) analysis. (D) t-SNE plots display color-coded cell subtypes of macrophages in the Ripk1-Con (left) and Ripk1-hepKO (right) mice liver tissues. (E) Bar charts display the proportion of major cell subtypes within macrophages after fasting. (F) Representative flow cytometry plots of F4/80- and CD11b-positive cells in the liver tissue (n = 3 per group). (G) Relative increase of F4/80- and CD11b-positive cells in the liver tissue of Ripk1-hepKO mice after 12 hr of fasting, compared to that in Ripk1-Con mice (n = 3 per group; unpaired t-test). (H) Bar charts display the number of interactions among cell types across the experiments. (I) Bar charts displaying the interaction strength among cell types across the experiments. (J) Circle plots displaying the brand link pairs between macrophages and other cell types, along with their corresponding event counts. (K) Heatmaps summarizing specific signals among interacting cell types in the liver tissue of Ripk1-hepKO mice after 12 hr of fasting, compared to that in Ripk1-Con mice. Interactions are categorized into outgoing and incoming events for specific cell types. The color gradient indicates the relative strength of these interactions (NK&T: natural killer cells and T cells; ECs: endothelial cells; PCs: plasma cells; Mac: macrophages; DCs: dendritic cells). The data was analyzed via two- or one-way ANOVA. Data are expressed as mean ± SEM (n = 6 per group). **p < 0.01.
Figure 4—figure supplement 1
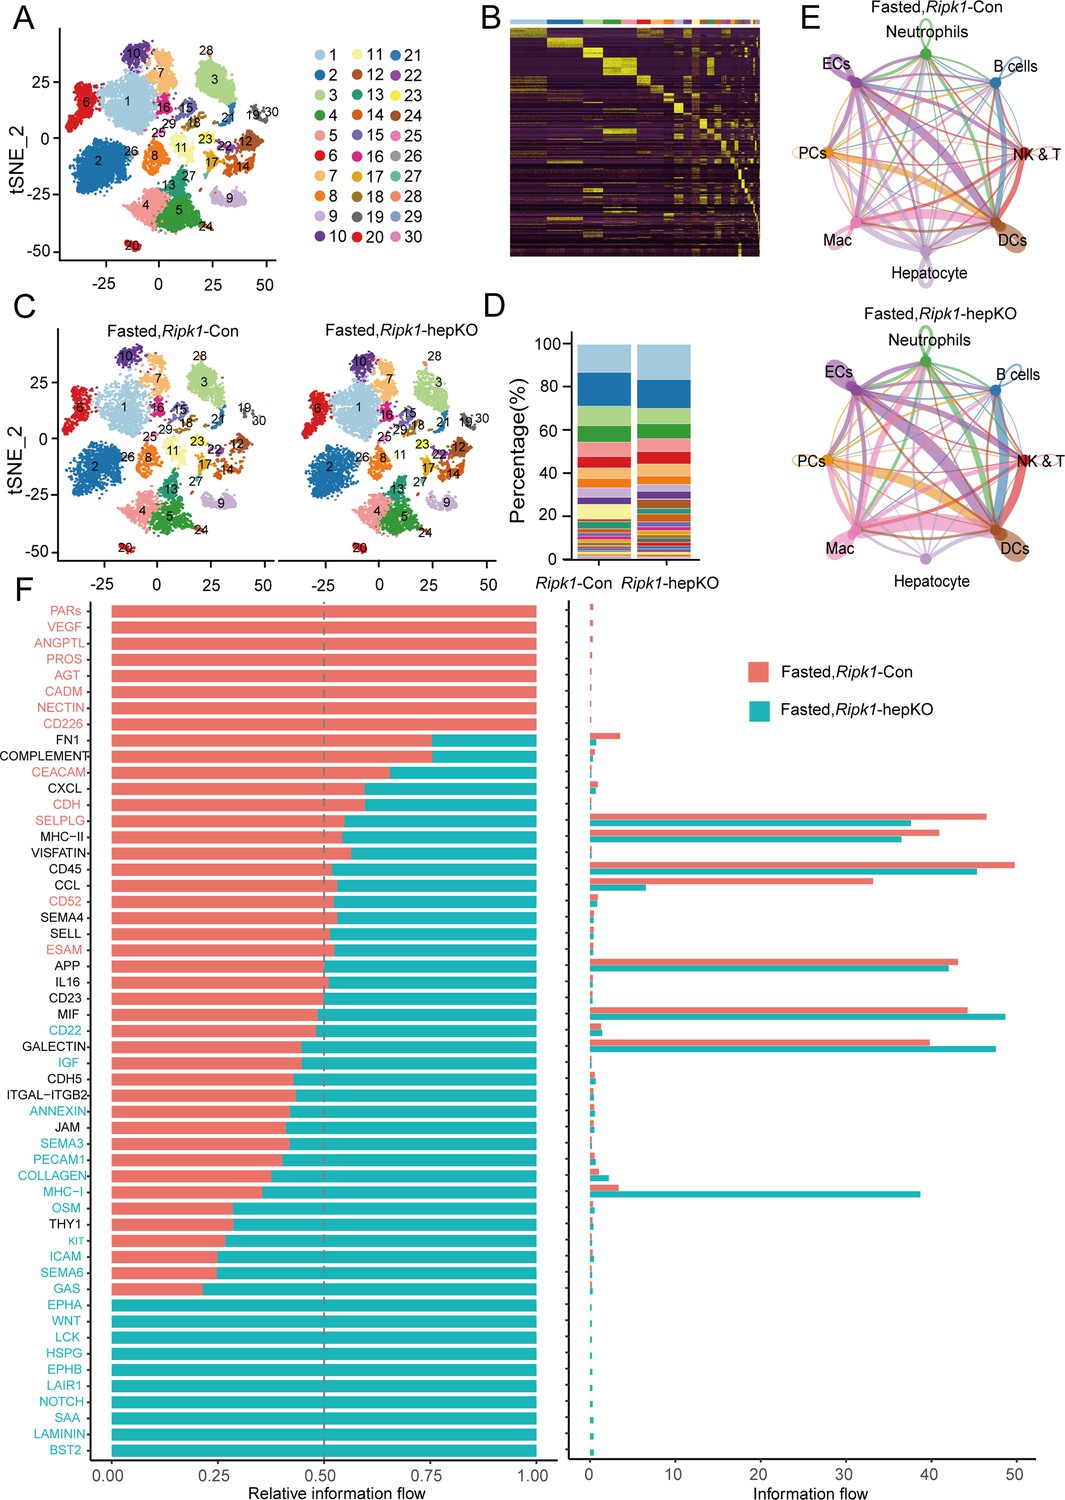
Single-cell RNA sequencing of liver tissue from Ripk1-Con and Ripk1-hepKO mice.
(A) T-distributed stochastic neighbor embedding (t-SNE) visualization depicting the clustering of liver cells based on 22,274 single-cell transcriptomes. (B) Heatmap illustrating the marker genes associated with each cluster. (C) t-SNE plots displaying color-coded cell clusters of cells in the Ripk1-Con (left) and Ripk1-hepKO (right) mice liver tissues. (D) Bar charts showing the proportion of major cell clusters among all cells at different genotypes after fasting by scRNA-seq. (E) Circle plots displaying putative ligand–receptor interactions among eight cell subtypes in the liver tissue of Ripk1-Con (top) and Ripk1-hepKO (bottom) mice. (F) All significant signaling pathways were ranked based on their differences in overall information flow within the inferred networks between Ripk1-Con and Ripk1-hepKO mice. The overall information flow of a signaling network was calculated by summing all the communication probabilities within that network.
Figure 5
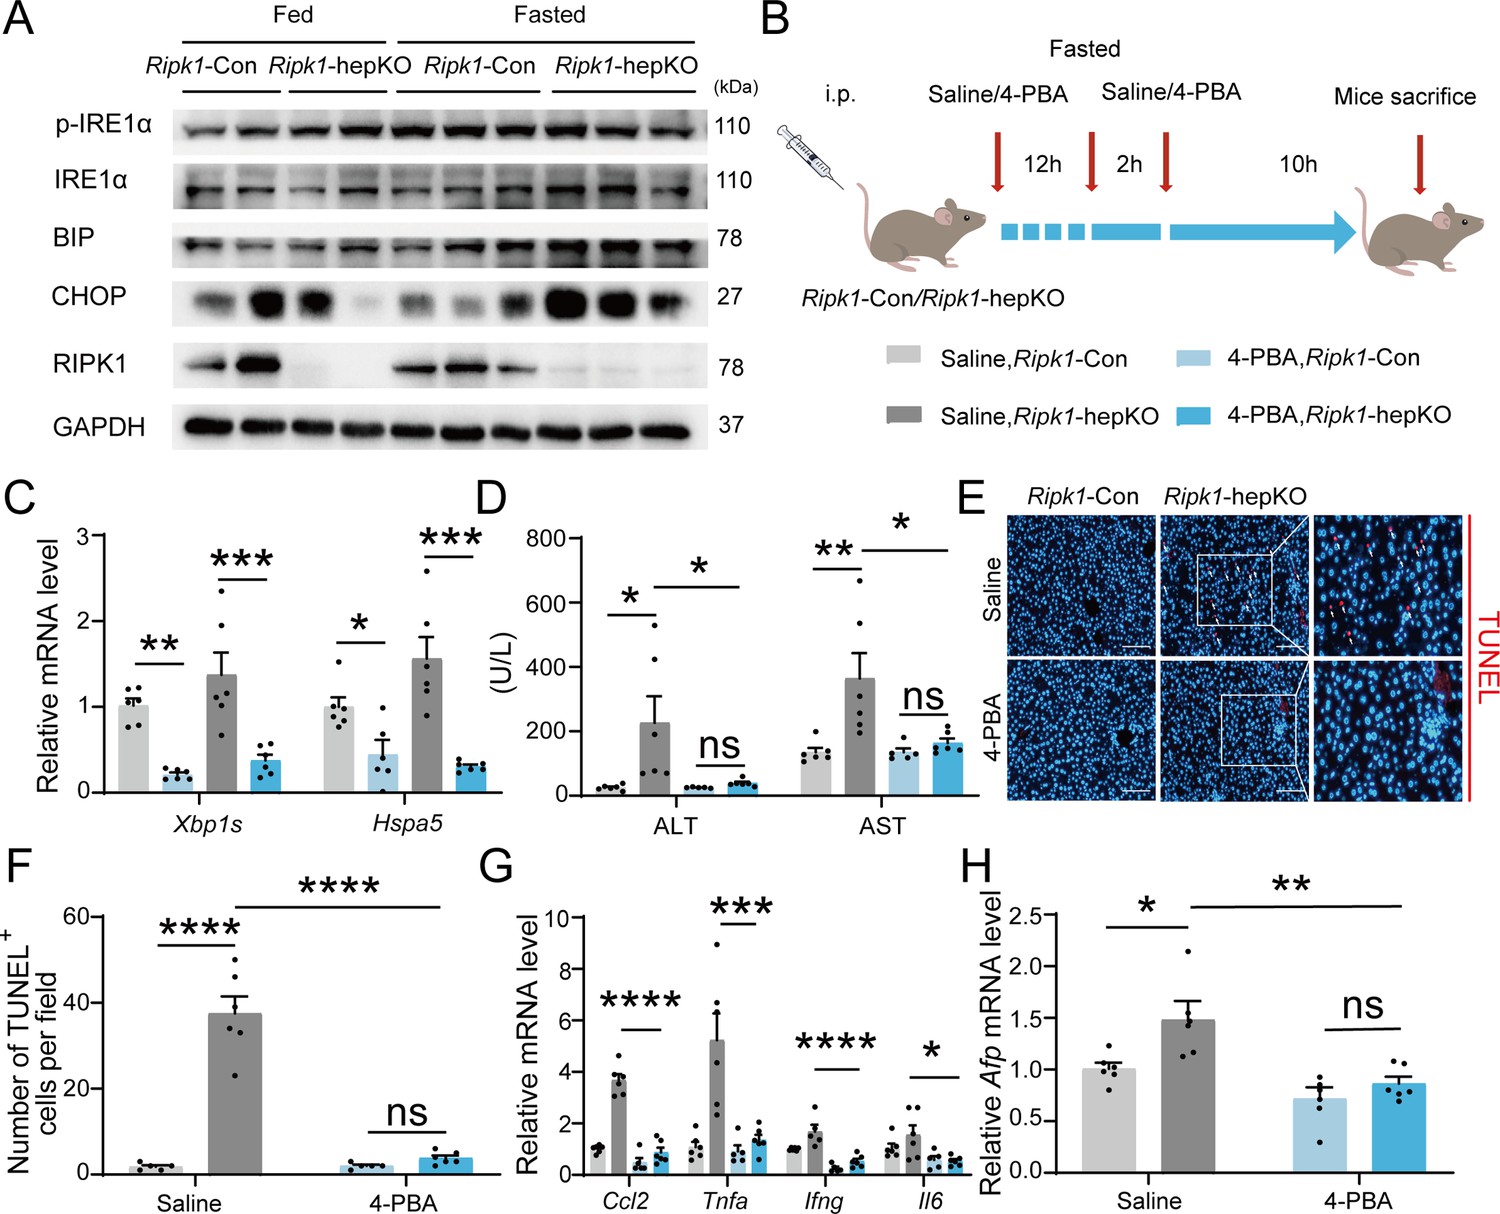
Inhibitor of ER stress 4-PBA effectively rescued the fasting-induced liver injury and inflammation in Ripk1-hepKO mice.
(A) Western blot analysis of p-IRE1α, IRE1α, BIP, CHOP, RIPK1, and GAPDH in liver tissue. (B) Experiment schema. (C) Transcriptional expression of ER stress genes in mouse liver. (D) Serum alanine amino-transferase (ALT) and aspartate amino-transferase (AST) levels. (E, F) Fluorescence microscopy image and quantification of TUNEL staining. Scale bar, 100 μm. (G) Expression (qPCR) of inflammatory genes in the livers. (H) Expression (qPCR) of Afp in the livers. The data was analyzed via two- or one-way ANOVA. Data are expressed as mean ± SEM (n = 6 per group). ns, no significant, *p < 0.05, **p < 0.01, ***p < 0.001, ****p < 0.0001.
-
Figure 5—source data 1
PDF file containing original western blots for Figure 5A, indicating the relevant bands and treatments.
- https://cdn.elifesciences.org/articles/96798/elife-96798-fig5-data1-v1.pdf
-
Figure 5—source data 2
Original files for western blot analysis displayed in Figure 5A.
- https://cdn.elifesciences.org/articles/96798/elife-96798-fig5-data2-v1.zip
Figure 6
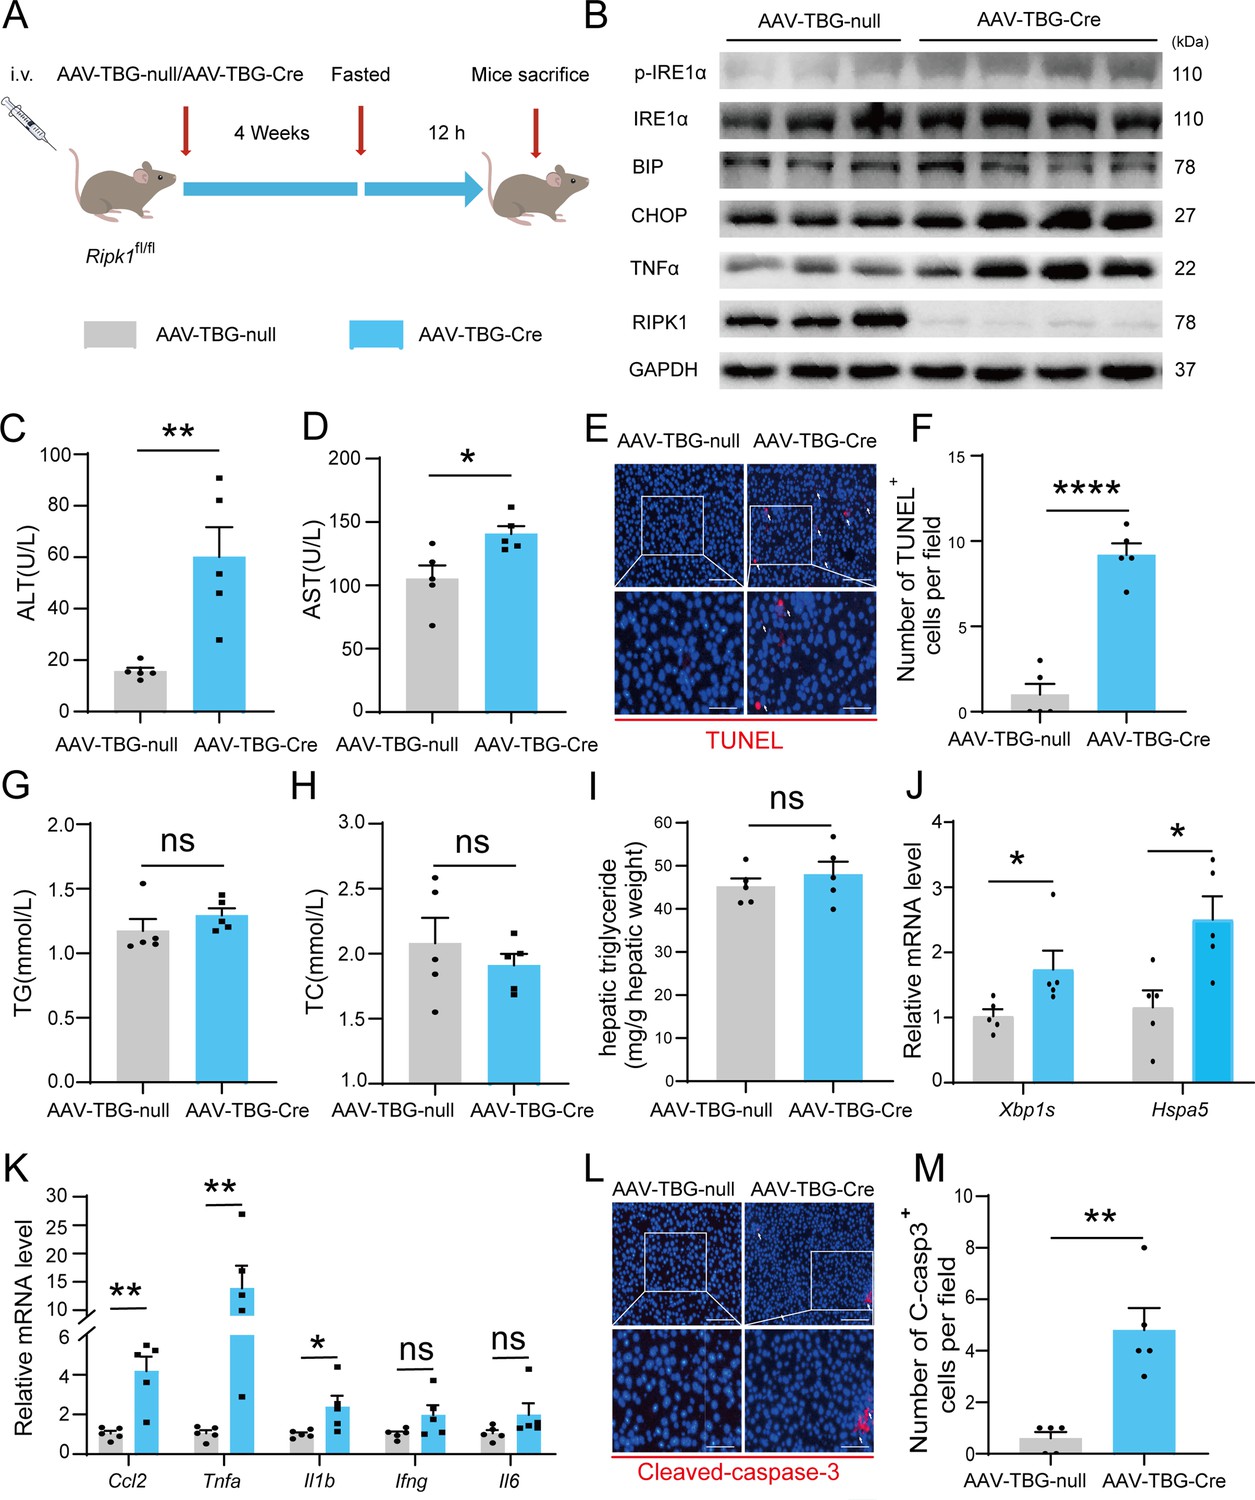
AAV-TBG-Cre-mediated liver-specific RIPK1 knockout confirms fasting-induced acute liver injury in mice.
(A) Schema of AAV8-TBG-Cre administration. (B) Western blot analysis of p-IRE1α, IRE1α, BIP, CHOP, TNFα, RIPK1, and GAPDH in liver tissue. (C) Serum alanine amino-transferase (ALT) levels. (D) Serum aspartate amino-transferase (AST) levels. (E, F) Fluorescence microscopy image and quantification of TUNEL staining. Scale bar, 100 μm. (G) Serum triglycerides (TG) levels. (H) Serum total cholesterol (TC) levels. (I) Hepatic TG levels (mg/g tissue). (J) Expression (qPCR) of ER stress genes in the livers. (K) Expression (qPCR) of inflammatory genes in the livers. (L, M) Fluorescence microscopy images and quantification of liver of Ripk1-hepKO and control mice stained with anti-cleaved caspase-3 antibody (red) and DAPI (blue). Scale bar, 100 μm. The data was analyzed via two- or one-way ANOVA. Data are expressed as mean ± SEM (n = 6 per group). ns, no significant, *p < 0.05, **p < 0.01, ****p < 0.0001.
-
Figure 6—source data 1
PDF file containing original western blots for Figure 6B, indicating the relevant bands and treatments.
- https://cdn.elifesciences.org/articles/96798/elife-96798-fig6-data1-v1.pdf
-
Figure 6—source data 2
Original files for western blot analysis displayed in Figure 6B.
- https://cdn.elifesciences.org/articles/96798/elife-96798-fig6-data2-v1.zip
Figure 7
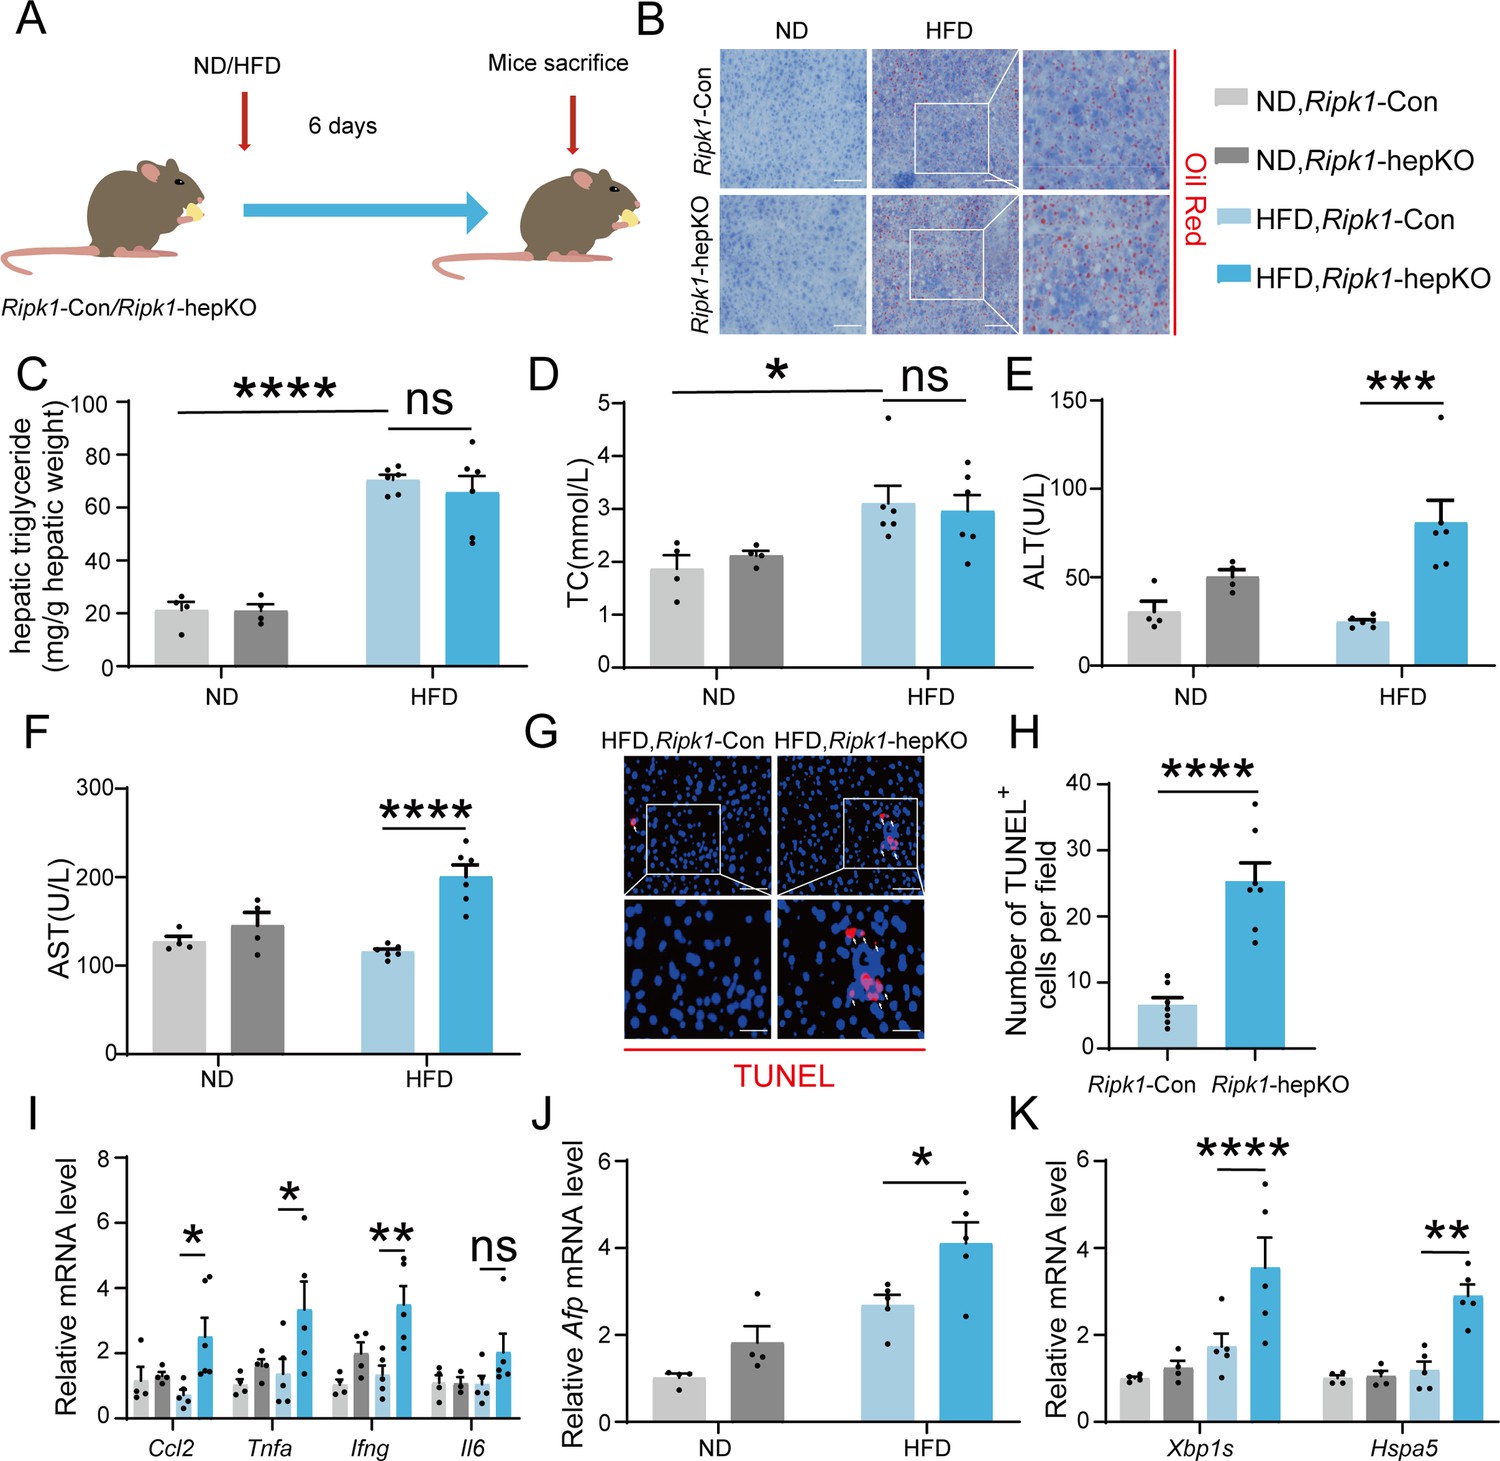
Short-term high-fat diet (HFD) feeding induced liver injury, hepatic apoptosis, inflammation, and endoplasmic reticulum stress in Ripk1-hepKO mice.
(A) Schema of HFD administration. (B) Liver tissue was stained by Oil Red O. Scale bar, 100 μm. (C) Hepatic triglyceride (TG) levels (mg/g tissue). (D) Serum total cholesterol (TC) levels. (E) Serum alanine amino-transferase (ALT) levels. (F) Serum aspartate amino-transferase (AST) levels. (G, H) Fluorescence microscopy image and quantification of TUNEL staining. Scale bar, 50 μm. (I) Expression (qPCR) of inflammatory genes in the livers. (J) Expression (qPCR) of Afp in the livers. (K) Expression (qPCR) of ER stress markers in the livers. The data was analyzed via two- or one-way ANOVA. Data are expressed as mean ± SEM (n = 6 per group). ns, no significant, *p < 0.05, **p < 0.01, ****p < 0.0001.
Author response image 1
Tables
Key resources table
| Reagent type (species) or resource | Designation | Source or reference | Identifiers | Additional information |
|---|---|---|---|---|
| Commercial assay or kit | Alanine aminotransferase Assay Kit | Nanjing Jiancheng Bioengineering Institute | C009-2-1 | |
| Commercial assay or kit | Aspartate aminotransferase Assay Kit | Nanjing Jiancheng Bioengineering Institute | C010-2-1 | |
| Commercial assay or kit | Triglyceride assay kit | Nanjing Jiancheng Bioengineering Institute | A110-1-1 | |
| Commercial assay or kit | Total cholesterol assay kit | Nanjing Jiancheng Bioengineering Institute | A111-1-1 | |
| Commercial assay or kit | Free fatty acids (FFA) Content Assay Kit | Solarbio | BC0595 | |
| Commercial assay or kit | Ketone Body Assay | Abcam | ab272541 | |
| Commercial assay or kit | Triglyceride (TG) Content Assay Kit | Solarbio | BC0625 | |
| Commercial assay or kit | TUNEL BrightRed Apoptosis Detection Kit | Vazyme | A113-02 | |
| Commercial assay or kit | Fixation/Permeabilization Buffer Set | ABclonal | RK50005 | |
| Antibody | anti-Caspase-3 (Rabbit polyclonal) | Cell Signaling Technology | Cat#: 9662S, RRID:AB_331439 | WB (1:1000) |
| Antibody | anti-MLKL (Rabbit monoclonal) | Cell Signaling Technology | Cat#: 37705S, RRID:AB_2799118 | WB (1:1000) |
| Antibody | anti-cleaved-Caspase-3 (Rabbit polyclonal) | Cell Signaling Technology | Cat#: 9661S, RRID:AB_2341188 | IF (1:400), WB (1:1000) |
| Antibody | anti-phospho-MLKL (S345) (Rabbit monoclonal) | Cell Signaling Technology | Cat#: 37333S, RRID:AB_2799112 | IF (1:1600), WB (1:1000) |
| Antibody | anti-F4/80 (Rabbit polyclonal) | Servicebio | Cat#: GB113373, RRID:AB_2938980 | IF (1:750) |
| Antibody | anti-CD11b (Rabbit polyclonal) | Servicebio | Cat#: GB11058, RRID:AB_2928112 | IF (1:750) |
| Antibody | anti-CCR2 (Rabbit polyclonal) | Servicebio | Cat#: GB11326 | IF (1:2000) |
| Antibody | anti-CX3CR1 (Rabbit polyclonal) | Servicebio | Cat#: GB11861 | IF (1:2500) |
| Antibody | anti-MKI67 (Rabbit monoclonal) | Bioss | Cat#: bs-2130R, RRID:AB_10857118 | IHC (1:500) |
| Antibody | anti-ALB (Mouse monoclonal) | Servicebio | Cat#: GB122080 | IF (1:1500) |
| Antibody | anti-TNF-alpha (Mouse monoclonal) | proteintech | Cat#: 60291-1-Ig, RRID:AB_2833255 | IF (1:250), WB (1:2500) |
| Antibody | anti-RIPK1 (Rabbit monoclonal) | Cell Signaling Technology | Cat#: 3493S, RRID:AB_2305314 | WB (1:1000) |
| Antibody | anti-phospho-IRE1α (S724) (Rabbit polyclonal) | Abcam | Cat#: ab48187, RRID:AB_873899 | WB (1:1000) |
| Antibody | anti-IRE1α (Rabbit monoclonal) | Cell Signaling Technology | Cat#: 3294S, RRID:AB_823545 | WB (1:1000) |
| Antibody | anti-BIP (Rabbit monoclonal) | Cell Signaling Technology | Cat#: 3177S, RRID:AB_2119845 | WB (1:1000) |
| Antibody | anti-CHOP (Mouse monoclonal) | Cell Signaling Technology | Cat#: 2895S, RRID:AB_2089254 | WB (1:1000) |
| Antibody | anti-CD11b-ABflo 647 (Rabbit monoclonal) | ABclonal | Cat#: A24095 | FACS (5 µl per test) |
| Antibody | anti-F4/80-PE (Rabbit monoclonal) | ABclonal | Cat#: A25659 | FACS (5 µl per test) |
| Antibody | anti-Ki67-ABflo 488 (Rabbit monoclonal) | ABclonal | Cat#: A26239 | FACS (5 µl per test) |
| Antibody | anti-beta Actin (Mouse monoclonal) | Servicebio | Cat#: GB12001, RRID:AB_2904016 | WB (1:1000) |
| Antibody | anti-GAPDH (Mouse monoclonal) | Servicebio | Cat#: GB12002, RRID:AB_3206256 | WB (1:1000) |
| Sequence-based reagent | Ccl2_F | This paper | PCR primers | CACTCACCTGCTGCTACTCA |
| Sequence-based reagent | Ccl2_R | This paper | PCR primers | AGACCTTAGGGCAGATGCAG |
| Sequence-based reagent | Tnfa_F | This paper | PCR primers | GTAGCCCACGTCGTAGCAAA |
| Sequence-based reagent | Tnfa_R | This paper | PCR primers | TAGCAAATCGGCTGACGGTG |
| Sequence-based reagent | Il1b_F | This paper | PCR primers | GCCACCTTTTGACAGTGATGAG |
| Sequence-based reagent | Il1b_R | This paper | PCR primers | ACGGGAAAGACACAGGTAGC |
| Sequence-based reagent | Ifng_F | This paper | PCR primers | ATGAACGCTACACACTGCATC |
| Sequence-based reagent | Ifng_R | This paper | PCR primers | CCATCCTTTTGCCAGTTCCTC |
| Sequence-based reagent | Il6_F | This paper | PCR primers | TGATGGATGCTACCAAACTGGA |
| Sequence-based reagent | Il6_R | This paper | PCR primers | GGAAATTGGGGTAGGAAGGACT |
| Sequence-based reagent | Afp_F | This paper | PCR primers | ACCTCCAGGCAACAACCATT |
| Sequence-based reagent | Afp_R | This paper | PCR primers | GTTTGACGCCATTCTCTGCG |
| Sequence-based reagent | Mki67_F | This paper | PCR primers | AACCATCATTGACCGCTCCT |
| Sequence-based reagent | Mki67_R | This paper | PCR primers | AGGCCCTTGGCATACACAAA |
| Sequence-based reagent | Hspa5_F | This paper | PCR primers | CGAGGAGGAGGACAAGAAGG |
| Sequence-based reagent | Hspa5_R | This paper | PCR primers | TCAAGAACGGGCAAGTTCCAC |
| Sequence-based reagent | Xbp1s_F | This paper | PCR primers | GAGTCCGCAGCAGGTG |
| Sequence-based reagent | Xbp1s_R | This paper | PCR primers | AGGGTACCTGAGACTGTG |
| Sequence-based reagent | Ddit3_F | This paper | PCR primers | CTGCCTTTCACCTTGGAGAC |
| Sequence-based reagent | Ddit3_R | This paper | PCR primers | ATAGAGTAGGGGTCCTTTGC |
| Sequence-based reagent | Gapdh_F | This paper | PCR primers | AGGTCGGTGTGAACGGATTTG |
| Sequence-based reagent | Gapdh_R | This paper | PCR primers | TGTAGACCATGTAGTTGAGGTCA |
Additional files
Download links
A two-part list of links to download the article, or parts of the article, in various formats.
Downloads (link to download the article as PDF)
Open citations (links to open the citations from this article in various online reference manager services)
Cite this article (links to download the citations from this article in formats compatible with various reference manager tools)
Role of hepatocyte RIPK1 in maintaining liver homeostasis during metabolic challenges
eLife 13:RP96798.
https://doi.org/10.7554/eLife.96798.3


