Propionyl-CoA carboxylase subunit B regulates anti-tumor T cells in a pancreatic cancer mouse model
- Department of Physiology and Biophysics, Stony Brook University, Stony Brook, United States
- Department of Biomedical Engineering, Stony Brook University, Stony Brook, United States
- Department of Chemical Biology, Ernest Mario School of Pharmacy, Rutgers-The State University of New Jersey, United States
- Department of Microbiology and Immunology, Renaissance School of Medicine at Stony Brook University, Stony Brook, United States
- Center for Infectious Diseases, Renaissance School of Medicine at Stony Brook University, Stony Brook, United States
- Northport Veteran Affair Medical Center, Northport, United States
Figures
Figure 1
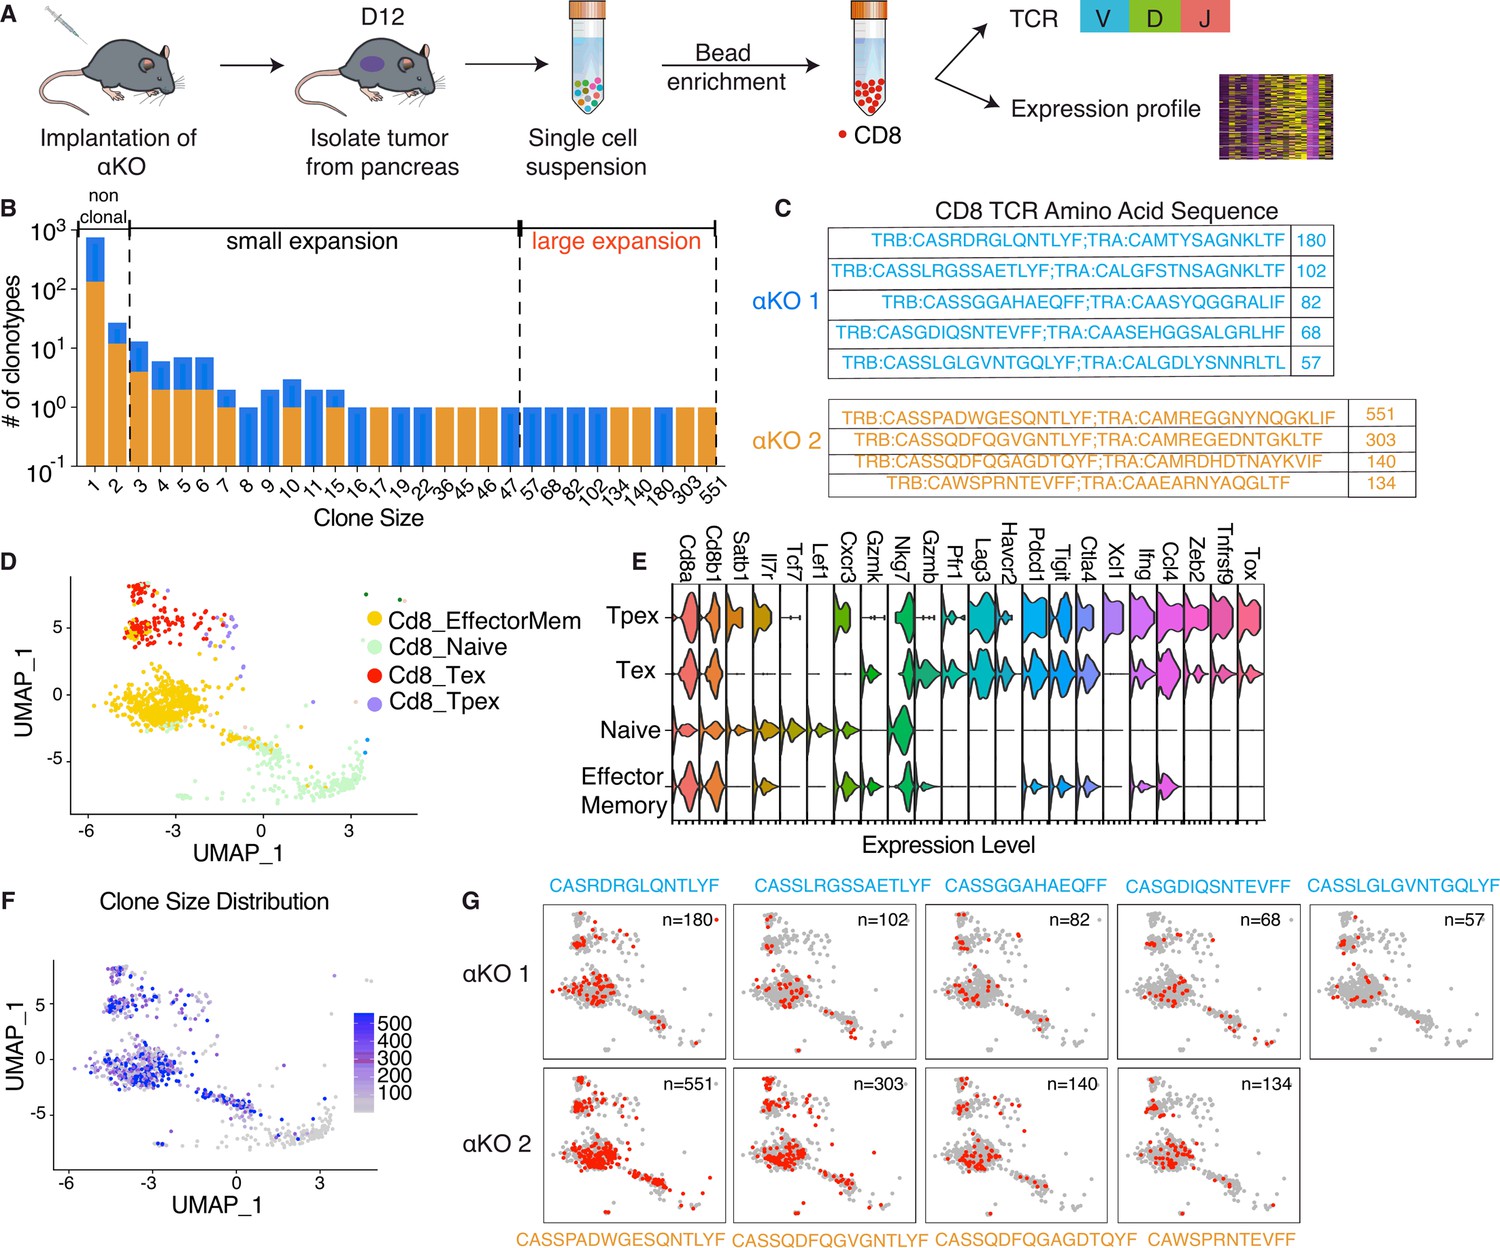
Clonal enrichment of cytotoxic T cells infiltrating the αKO pancreatic tumors.
(A) Experimental design schema for single-cell RNA sequencing of infiltrating CD8+ T cells in αKO tumors. Cells were implanted in the pancreas of two B6 mice and tumors were harvested at 12 days post-implantation. Single-cell suspensions were enriched with CD8+ beads followed by concurrent single-cell transcriptional and T-cell receptor (TCR) profiling using 10× Genomics protocols. In total, 5075 CD8+ cells were identified after quality control. (B) Size distribution for CD8+ T-cell clonal types in αKO tumors. Non-clonal: N ≤ 2 cells; small expansion: 3 cells ≤ N < 50 cells; large expansion: N ≥ 50 cells. (C) Amino acid sequences of the CDR3 region for large expansion clonotypes. αKO1 tumor has five and αKO2 tumor has four large expansion clonotypes (full list shown in Supplementary file 1). (D) Uniform manifold approximation and projection (UMAP) of all CD8+ T-cell clonotypes. Principle component analysis of gene expression profiles generated four-cell clusters annotated based by ProjectTILs. EffectorMem: effector memory; Tex: exhausted; Tpex: precursor exhausted; Naive: naive like or central memory. Each dot corresponds to a single cell. (E) Major markers used for cell type annotation by Projectils. (F) Clonal size distribution mapped to the gene expression UMAP showing that the largest clonotypes are mostly effector memory T cells. (G) The gene expression profile distribution of individual large expansion clonotypes are shown. The majority of cells for each clone mapped to the effector memory T-cell functional group.
-
Figure 1—source data 1
Clone size counts containing data for Figure 1B.
- https://cdn.elifesciences.org/articles/96925/elife-96925-fig1-data1-v1.xlsx
-
Figure 1—source data 2
TCR clonotype CDR3 sequences and counts from two αKO tumors for Figure 1C.
- https://cdn.elifesciences.org/articles/96925/elife-96925-fig1-data2-v1.xlsx
Figure 2
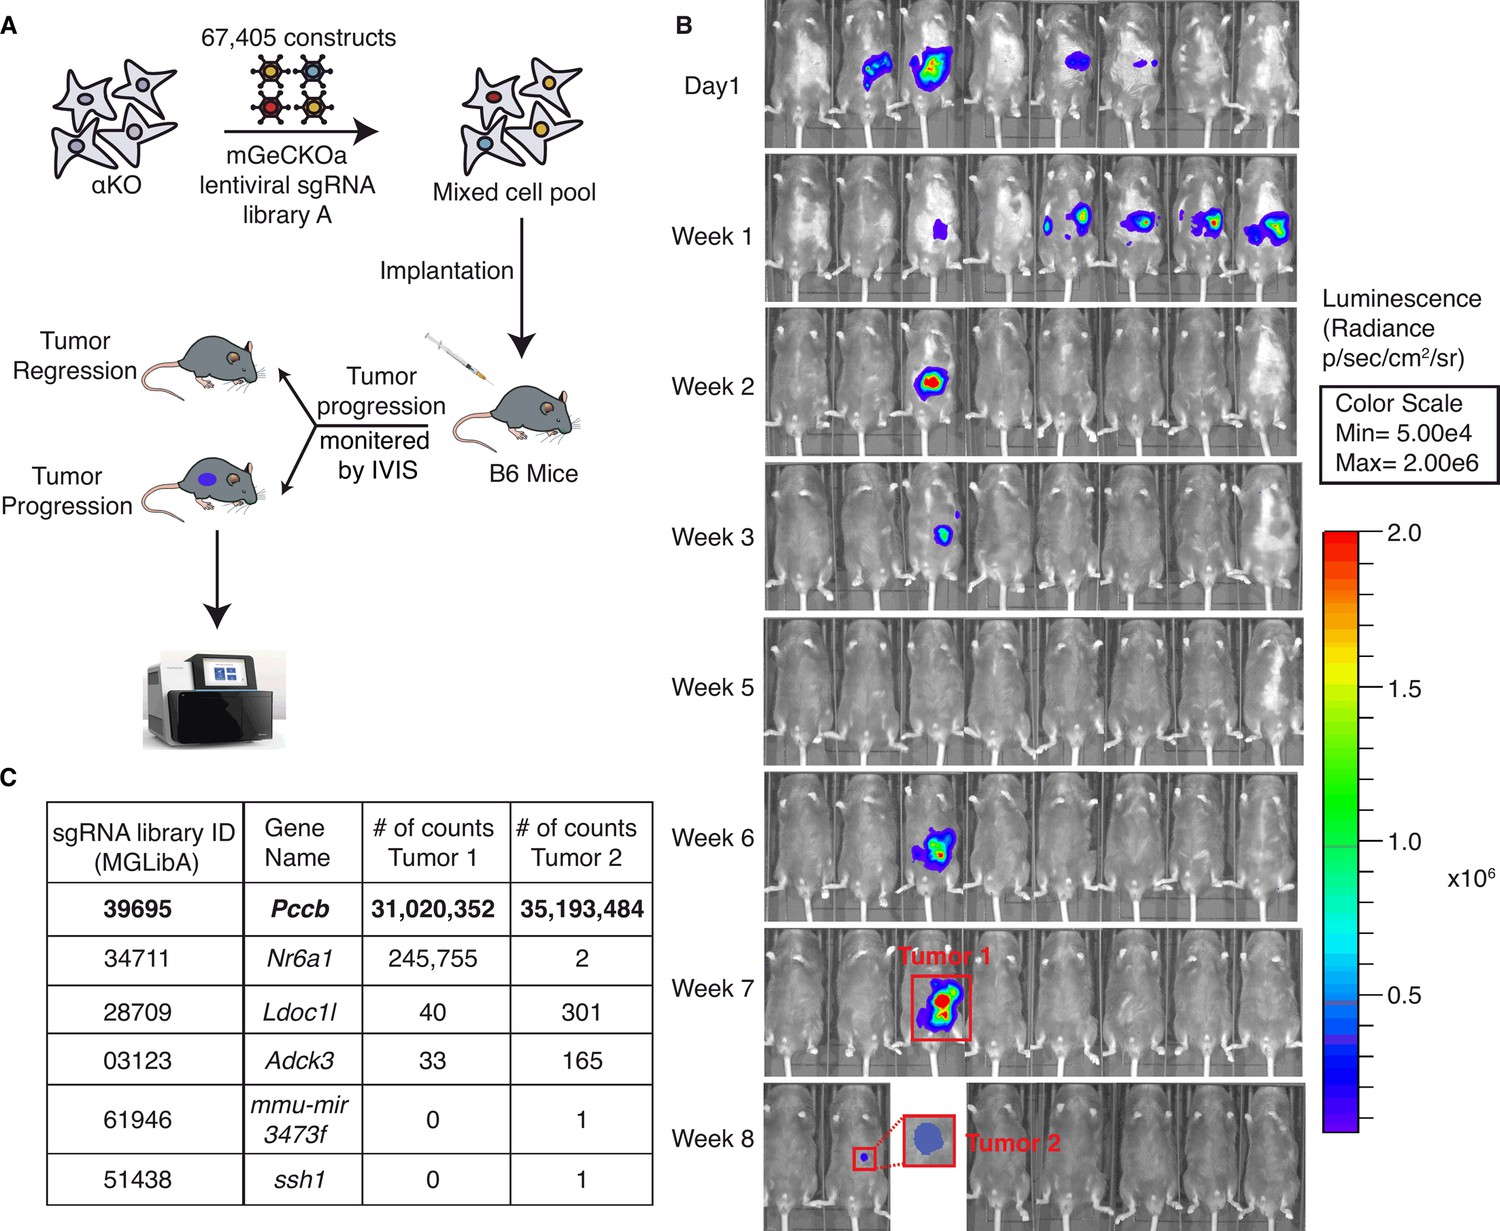
A genome-wide CRISPR gene-deletion screen identifies Pccb contributing to PIK3CA-mediated pancreatic tumor immune evasion.
(A) A schema for the genetic screen. Mouse genome-scale CRISPR/Cas9 knockout library (mGeCKO v2A) containing three sgRNA each for 20,611 genes was transduced into KrasG12D/+;Tp53R172H/+;Pik3ca−/− (αKO) cells. Pooled cells were implanted in the pancreas of eight C57BL/6J mice. (B) IVIS imaging was performed to monitor tumor progression in these mice. In two animals, tumors were still present at the end of the screen (annotated as tumors 1 and 2). (C) Harvested DNAs prepared from the tumors were subjected to next-generation sequencing (NGS) to identify enriched sgRNAs barcodes. Sequences corresponding to only six genes in the mGeCKO v2A library have detectable NGS counts as shown in the table. In both tumors, sgRNA sequences mapping to the Pccb gene are most numerous (full list shown in Supplementary file 2).
-
Figure 2—source data 1
sgRNA counts containing data for Figure 2C.
- https://cdn.elifesciences.org/articles/96925/elife-96925-fig2-data1-v1.txt
Figure 3 with 2 supplements
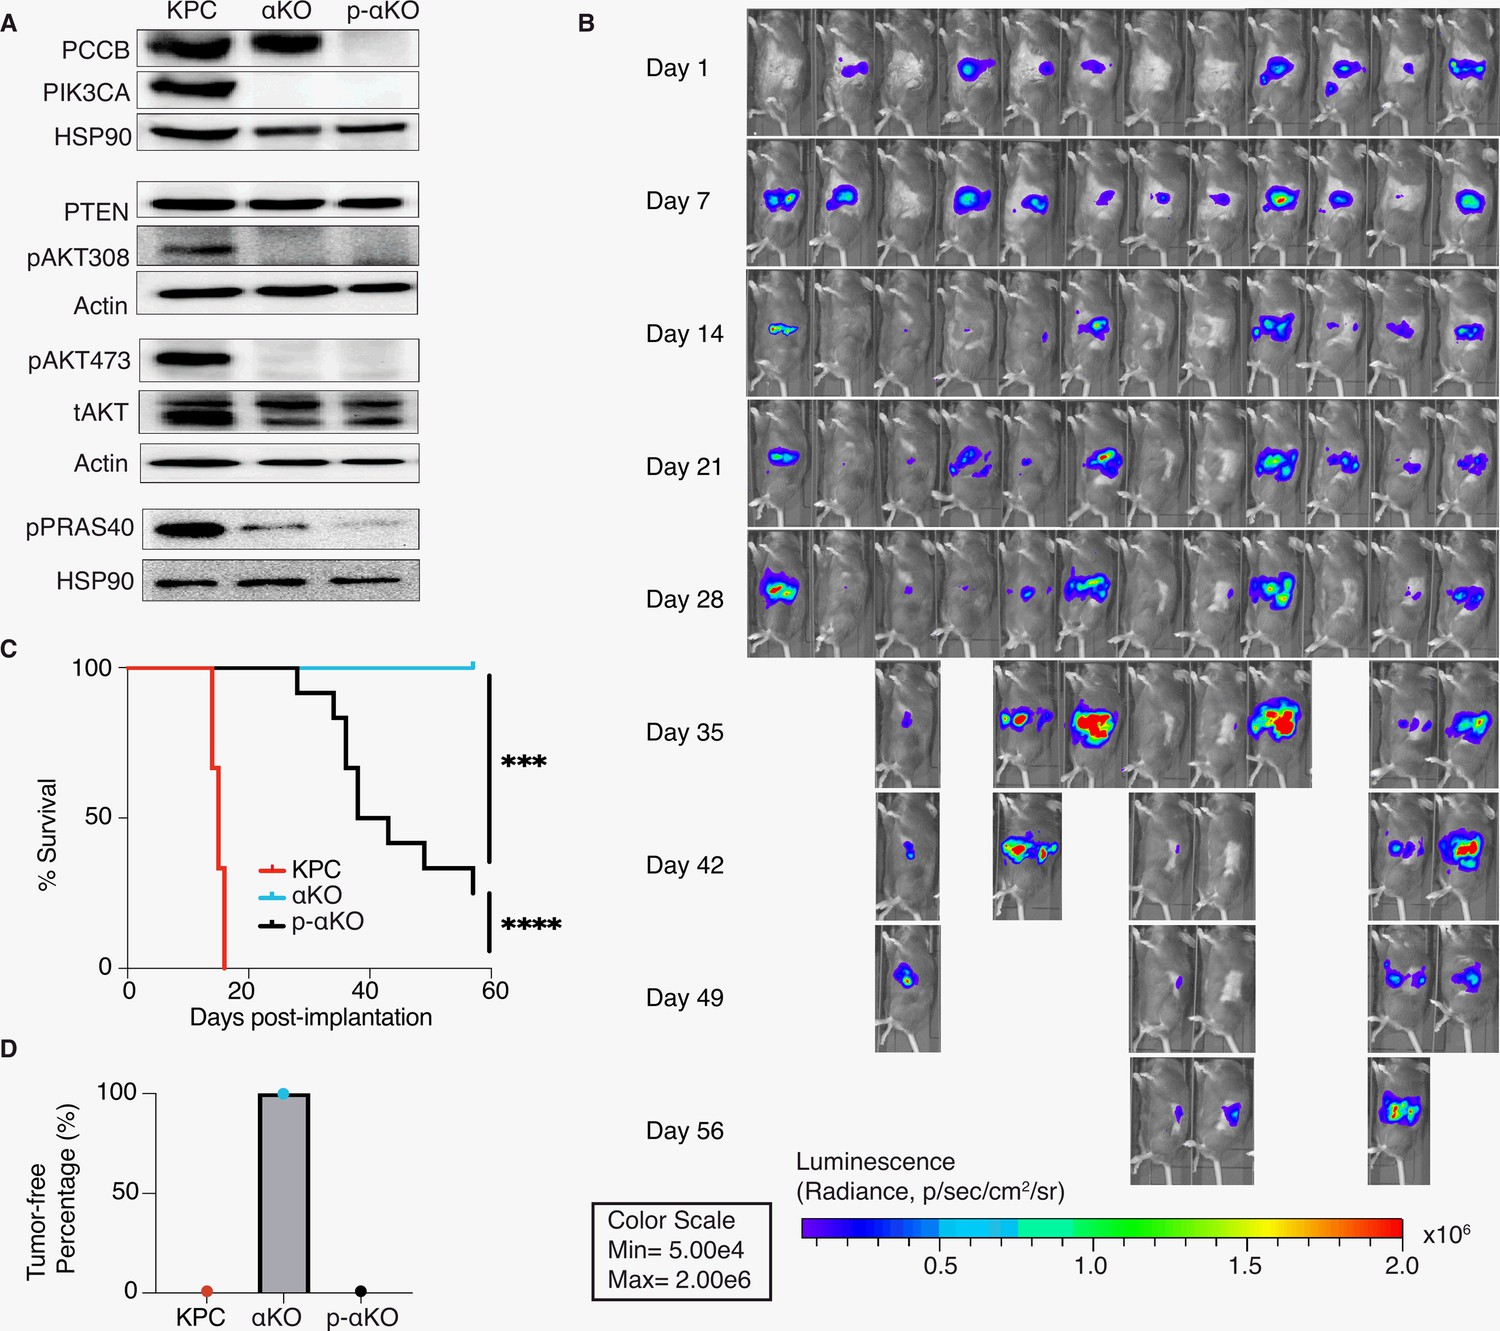
Ablation of propionyl-CoA carboxylase subunit B (PCCB) reverses the immune recognition of αKO cells.
(A) Pccb was deleted in αKO cells by CRISPR/Cas9 to generate p-αKO cells. Western blotting confirmed PCCB and PIK3CA loss in p-αKO cells. Additionally, western blotting was performed for PTEN, phospho-Thr308 AKT, phospho-Ser473 AKT, and phospho-PRAS40, with Actin and HSP90 used as loading controls. (B) Orthotopic implantation of p-αKO tumors in the pancreas of C57BL/6J mice was monitored by IVIS imaging of the luciferase signal weekly for 8 weeks. (C) Kaplan–Meier survival curves for mice implanted with KPC, αKO, and p-αKO cells. Median survival KPC: 15.5 days (N = 8); αKO, all alive (N = 9); p-αKO, 40.5 days (N = 12). ****p < 0.0001 for KPC vs. αKO; ***p = 0.0009 for αKO vs. p-αKO; ****p < 0.0001 for KPC vs. p-αKO (log-rank test). (D) Percentage of B6 mice that are tumor free at 8 weeks after implantation with KPC (0%), αKO (100%), and p-αKO (0%) cells.
-
Figure 3—source data 1
Original western blot files for Figure 3A.
Numbers in front of each file indicate if they are from the same gel.
- https://cdn.elifesciences.org/articles/96925/elife-96925-fig3-data1-v1.zip
-
Figure 3—source data 2
Mice survival record containing data for Figure 3C.
- https://cdn.elifesciences.org/articles/96925/elife-96925-fig3-data2-v1.xlsx
Figure 3—figure supplement 1
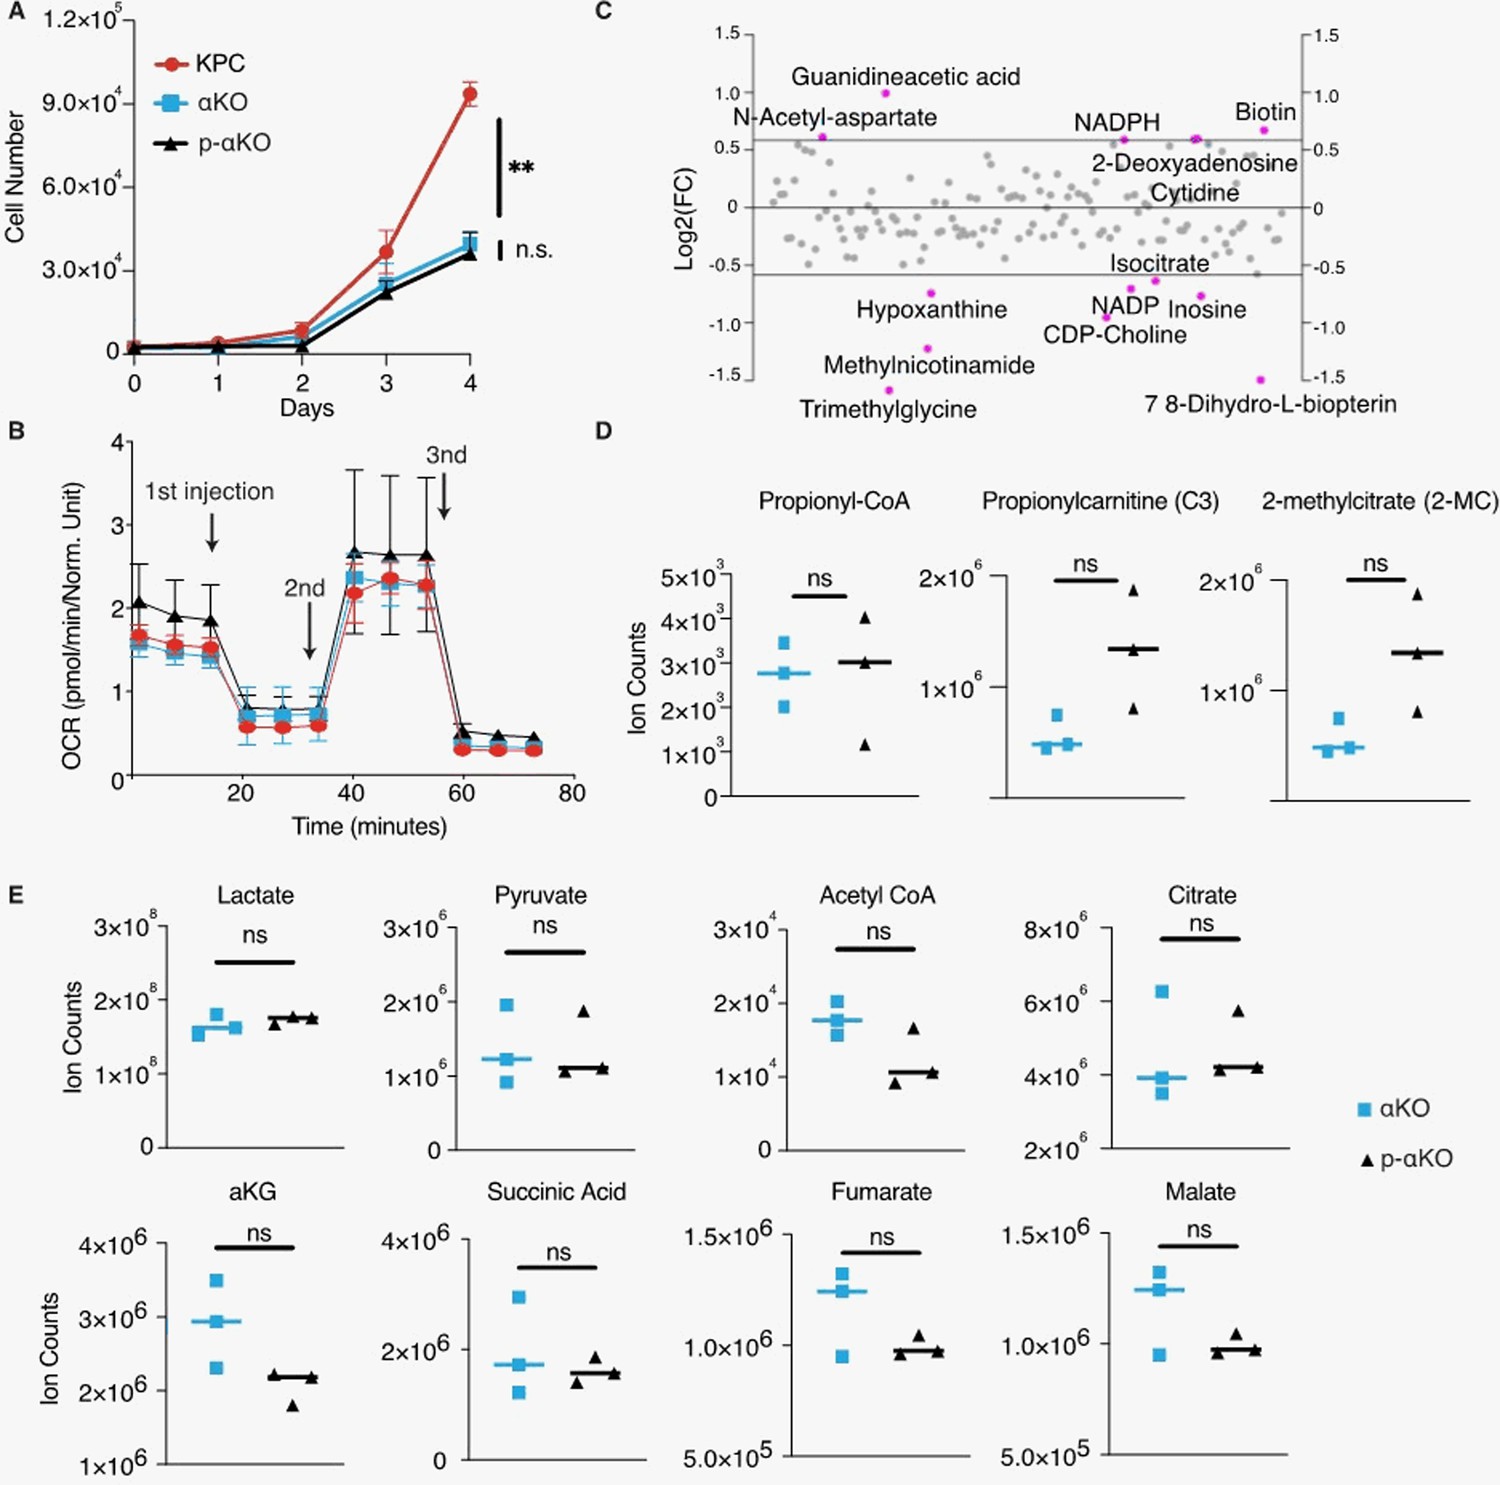
In vitro characterization of p-αKO cells.
(A) Growth rates of KPC, αKO, and p-αKO cell lines in culture were measured from days 1 to 4 (mean ± SD, n = 3). **p = 0.0009 for KPC vs. p-αKO; not significant (ns) for αKO vs. p-αKO (one-way ANOVA). (B) Mitochondria function was evaluated by measuring the oxygen consumption rate (OCR) with Seahorse. First injection: oligomycin; second injection: FCCP; third injection: antimycin A and rotenone. (C) Metabolic changes between p-αKO and αKO revealed by non-targeted liquid chromatography–mass spectrometry (LC–MS) analysis. Each data point represents the Log2 fold change of p-αKO over αKO, with a threshold set at 1.5-fold changes. Metabolites with differences exceeding this threshold were depicted in red. (D) LC–MS exploring changes of propionyl-CoA, propionylcarnitine, and 2-methylcitrate. Data are represented as ion counts ± SD (N = 3 for all groups). ns: not significant. (E) LC–MS exploring changes of metabolites of the tricarboxylic acid cycle (TCA). Data are represented as ion counts ± SD (N = 3 for all groups). ns: not significant.
Figure 3—figure supplement 2
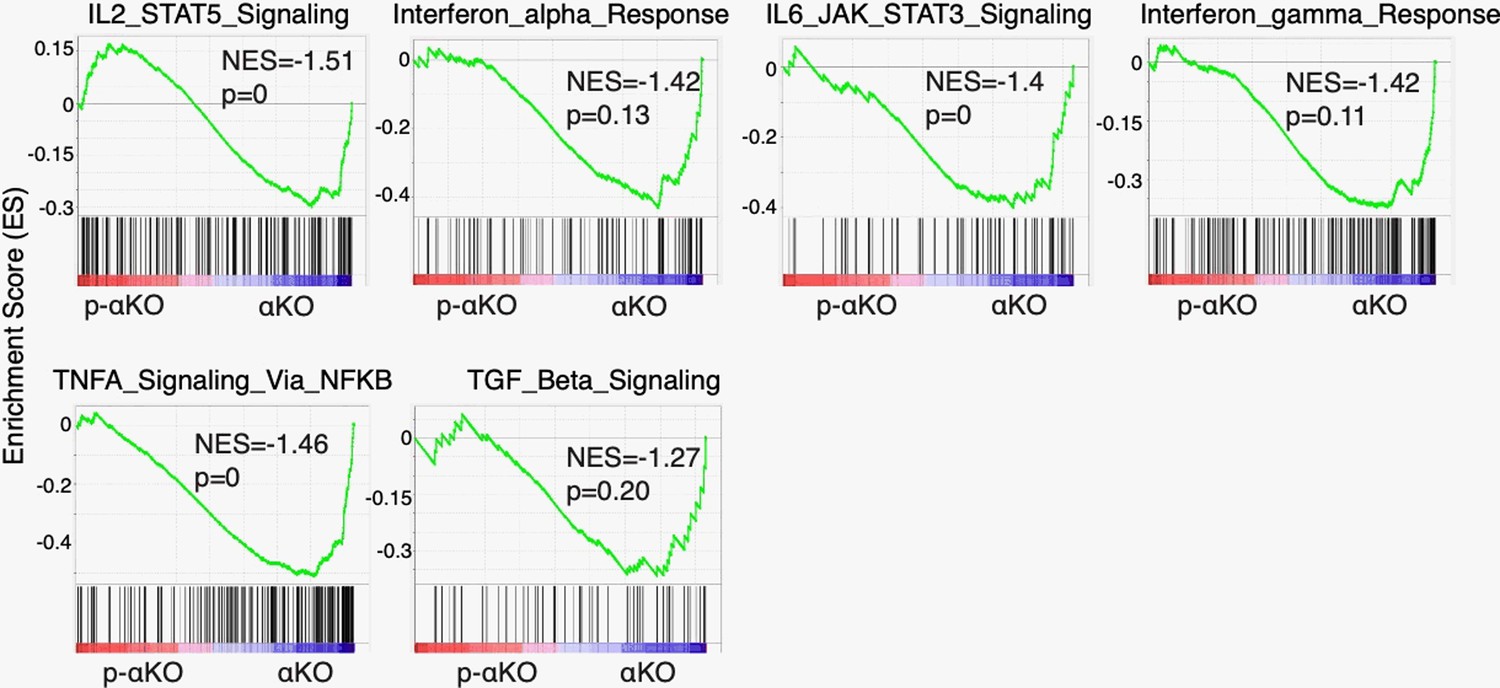
Gene set enrichment analysis (GSEA) of cytokine-related pathways in αKO cells (n = 3) vs. p-αKO cells (n = 3).
These pathways include IL2–STAT5 signaling pathway, interferon α response, IL6–JAK–STAT3 signaling pathway, interferon γ response, TNFA signaling via NF-κB, and TGF β signaling pathway. NES: normalized enrichment score.
Figure 4 with 1 supplement
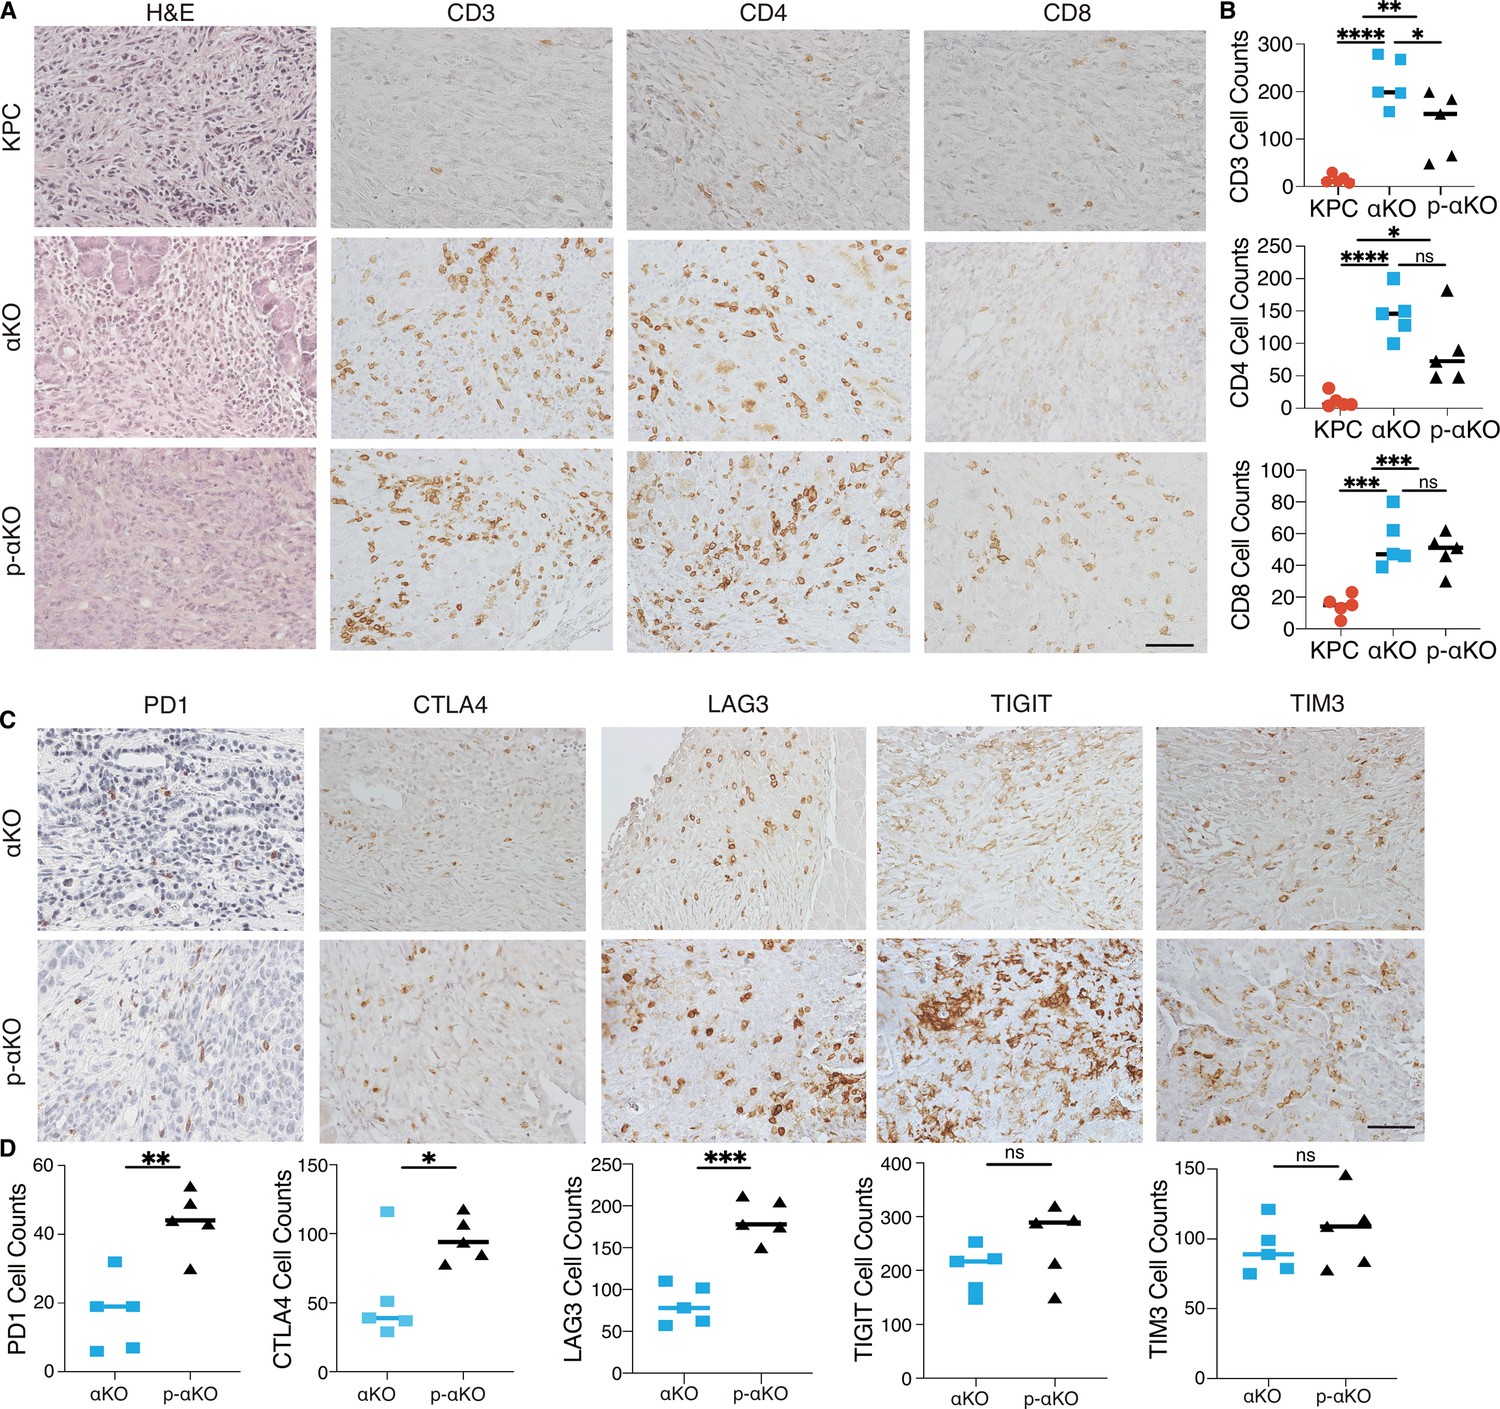
T cells infiltrate p-αKO tumors with increased expression of immune checkpoints.
(A) Pancreatic tissue sections prepared from C57BL/6J mice implanted with KPC, αKO, and p-αKO cells. Tumor sections were stained with hematoxylin and eosin (H&E) and immunohistochemistry (IHC) with CD3, CD4, and CD8 antibodies. Representative sections are shown. Scale bar: 60 μm. (B) Quantification of tumor-infiltrating T cells in five representative tumor sections for each group (mean ± SD, n = 3). CD3: ****p < 0.0001 for KPC vs. αKO; **p = 0.0063 for KPC vs. p-αKO; *p = 0.0471 for αKO vs. p-αKO. CD4: ****p < 0.0001 for KPC vs. αKO; *p = 0.0164 for KPC vs. p-αKO; ns for αKO vs. p-αKO. CD8: ***p = 0.0009 for KPC vs. αKO; ***p = 0.0005 for KPC vs. p-αKO; and ns for αKO vs. p-αKO (two-tailed t-test). ns: not significant. (C) αKO and p-αKO cells were implanted in the head of pancreas of C57BL/6J mice. Tumor sections were stained with checkpoint markers: PD1, CTLA4, LAG3, TIGIT, and TIM3. Representative sections are shown. Scale bars: 60 μm. (D) Quantifications of cells positive for each checkpoint marker at representative tumor sections (mean ± SD, N = 5). αKO vs. p-αKO: **p = 0.0023 for PD1; *p = 0.0371 for CTLA4; ***p = 0.0002 for LAG3; ns for TIGIT and TIM3.
-
Figure 4—source data 1
Immunohistochemistry (IHC) counts data for CD3, CD4, CD8, and for PD1, CTLA4, LAG3, TIGIT, and TIM3 for Figure 4B, D.
- https://cdn.elifesciences.org/articles/96925/elife-96925-fig4-data1-v1.xlsx
Figure 4—figure supplement 1
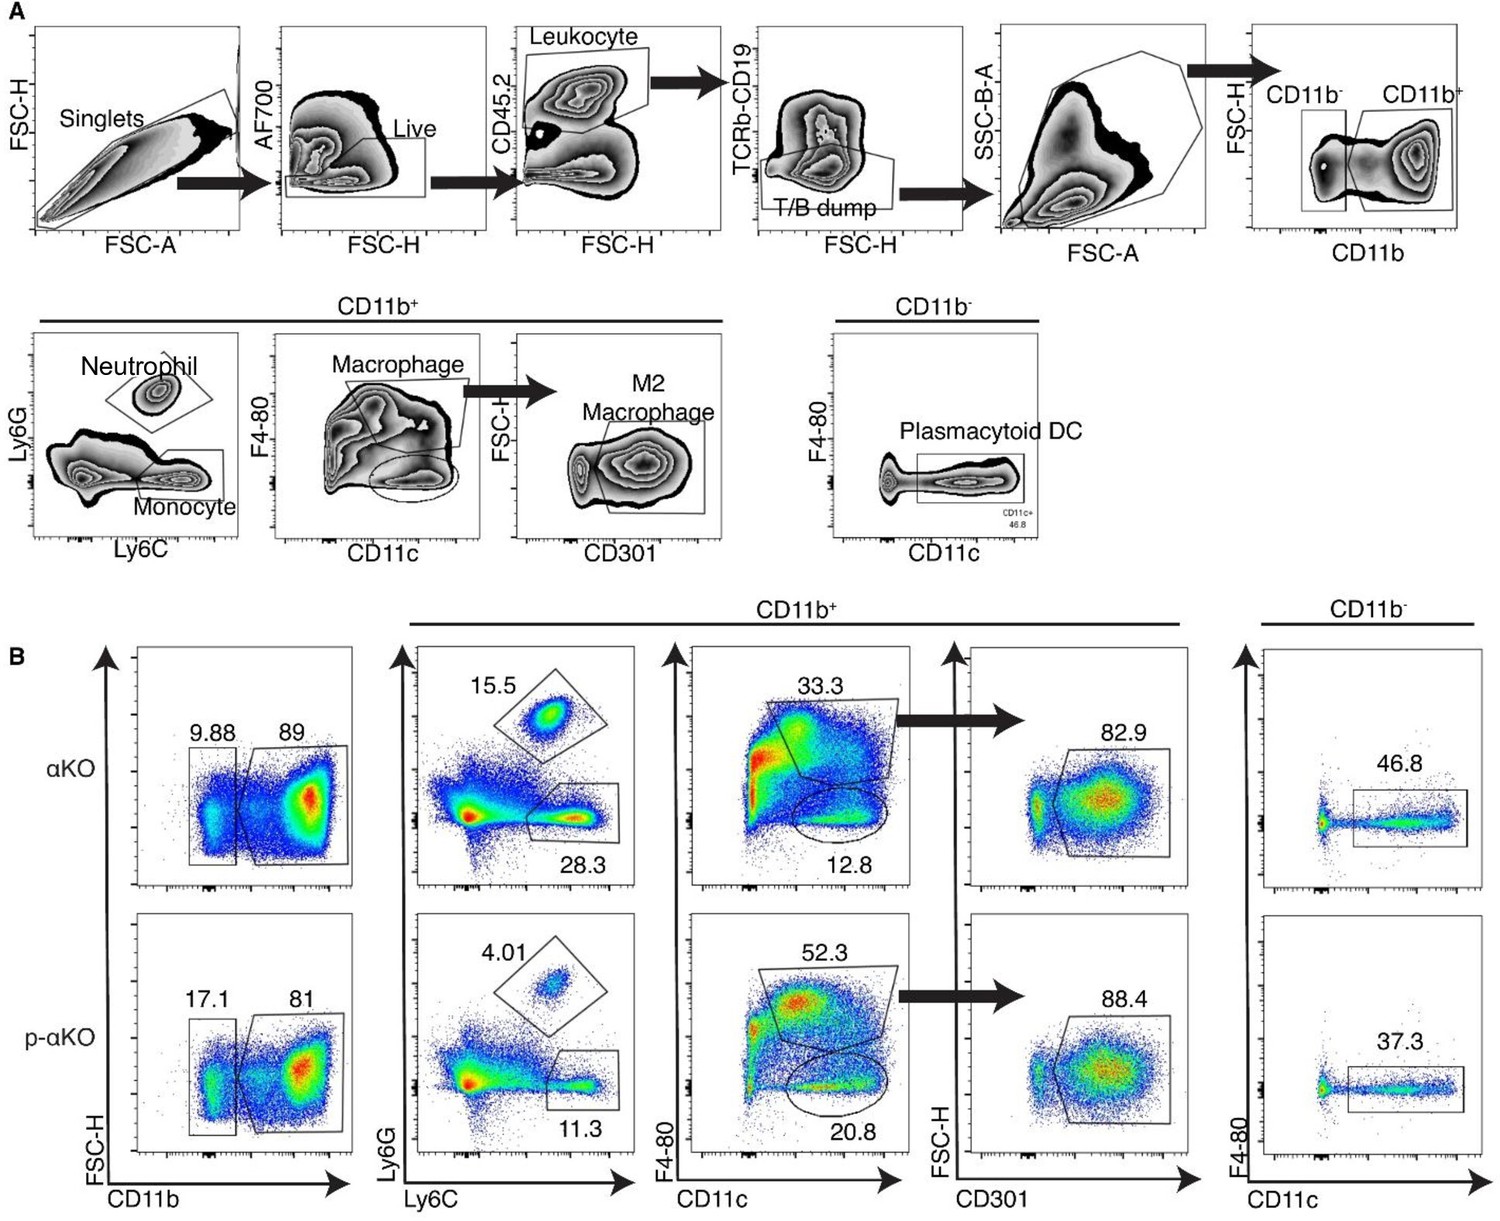
Flow cytometry of myeloid cells infiltrated in αKO vs. p-αKO.
(A) The gating strategy of the myeloid panel. (B) Flow cytometry analysis of the cells isolated from αKO and p-αKO tumors implanted in C57BL/6J mice. The numbers presented in the figures represent cell percentages relative to the total cell counts from the respective previous groups.
Figure 5
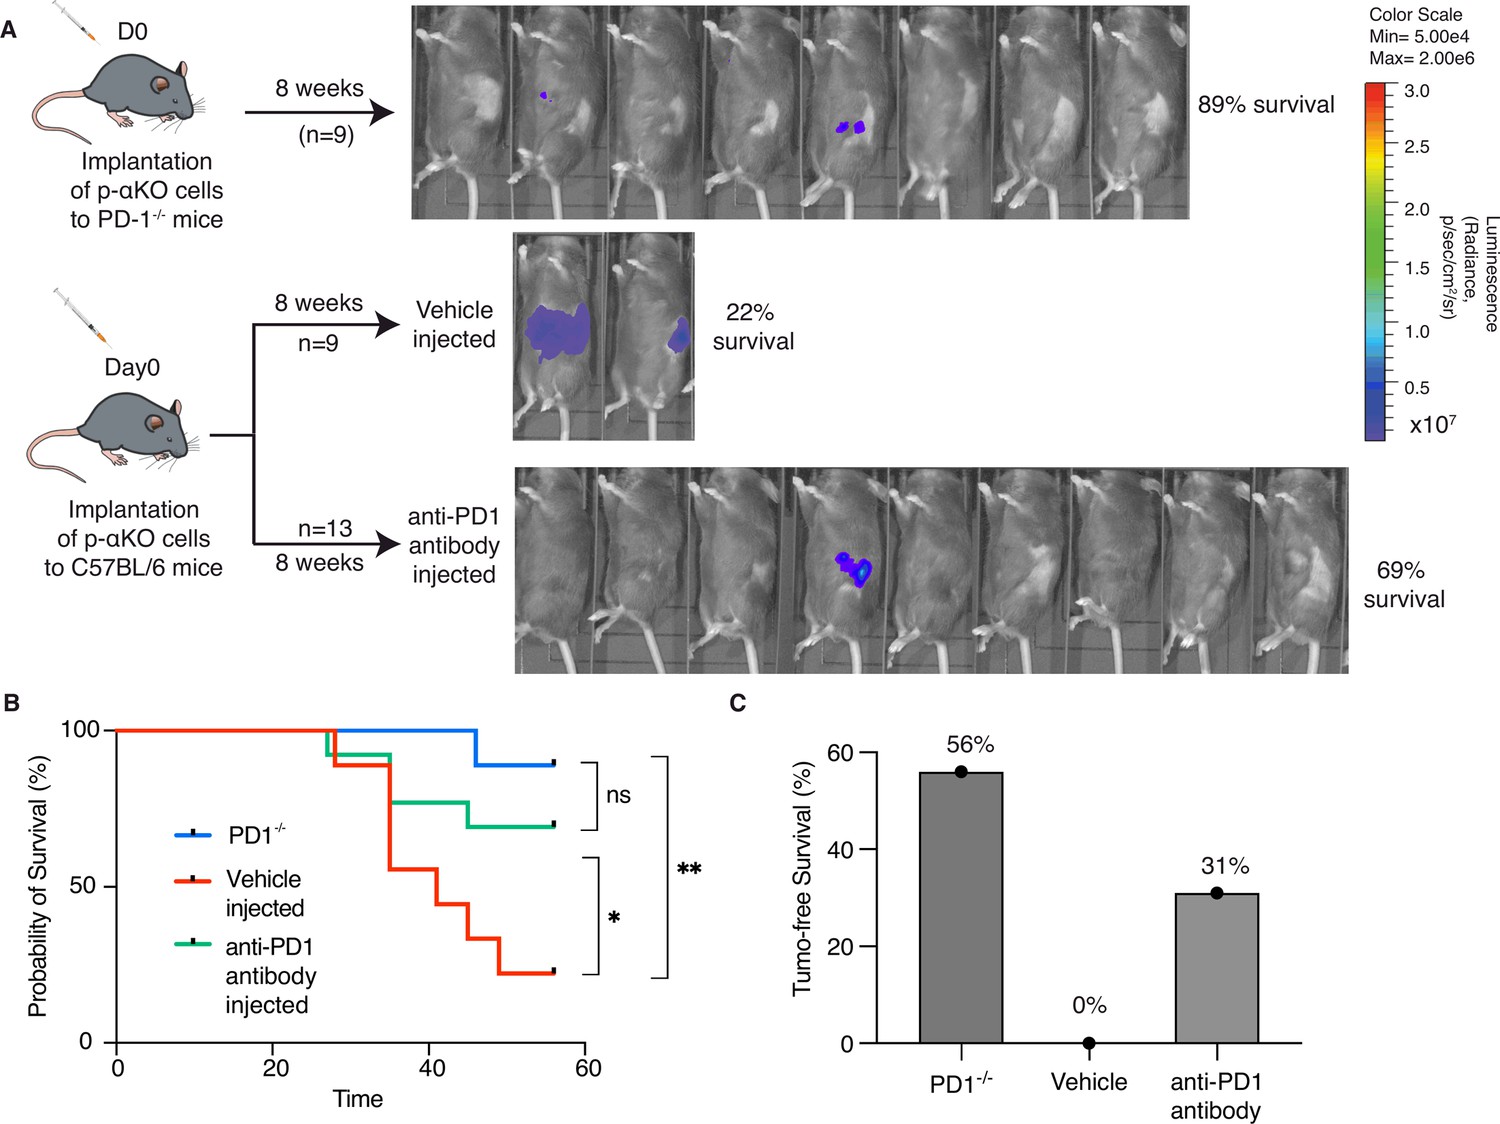
Inhibition of PD-1/PD-L1 checkpoint interaction leads to elimination of most p-αKO tumors.
(A) PD1−/− mice (N = 9) were implanted with p-αKO cells in the pancreas and were monitored for 8 weeks. IVIS imaging was performed to assess tumor size at the end of the experiment. C57BL/6J mice (N = 22) were implanted with p-αKO cells in the pancreas and randomly divided into two groups. One group was injected with 12.5 mg/mg of PD1 neutralizing antibody weekly for 8 weeks, and the vehicle group was injected with the inVivo Pure dilution buffer. IVIS imaging was performed to assess tumor size at the end of the experiment. (B) Kaplan–Meier survival curves for PD1−/− mice implanted with p-αKO cells, and vehicle- and anti-PD1-treated C57BL/6J mice implanted with p-αKO cells. Survival rate for PD1−/− group is 89% and median survival undefined; survival rate for vehicle injected group is 22% and median survival is 41 days; survival rate for anti-PD1 injected group is 69% and median survival undefined. *p = 0.0436 for vehicle vs. anti-PD1 antibody injection. **p = 0.003 for vehicle vs. PD1−/− group. (C) Tumor-free survival percentage of PD1−/− (56%), vehicle injected (0%), and anti-PD1 antibody injected (31%) groups.
-
Figure 5—source data 1
Mice survival record containing data for Figure 5B.
- https://cdn.elifesciences.org/articles/96925/elife-96925-fig5-data1-v1.xlsx
Figure 6
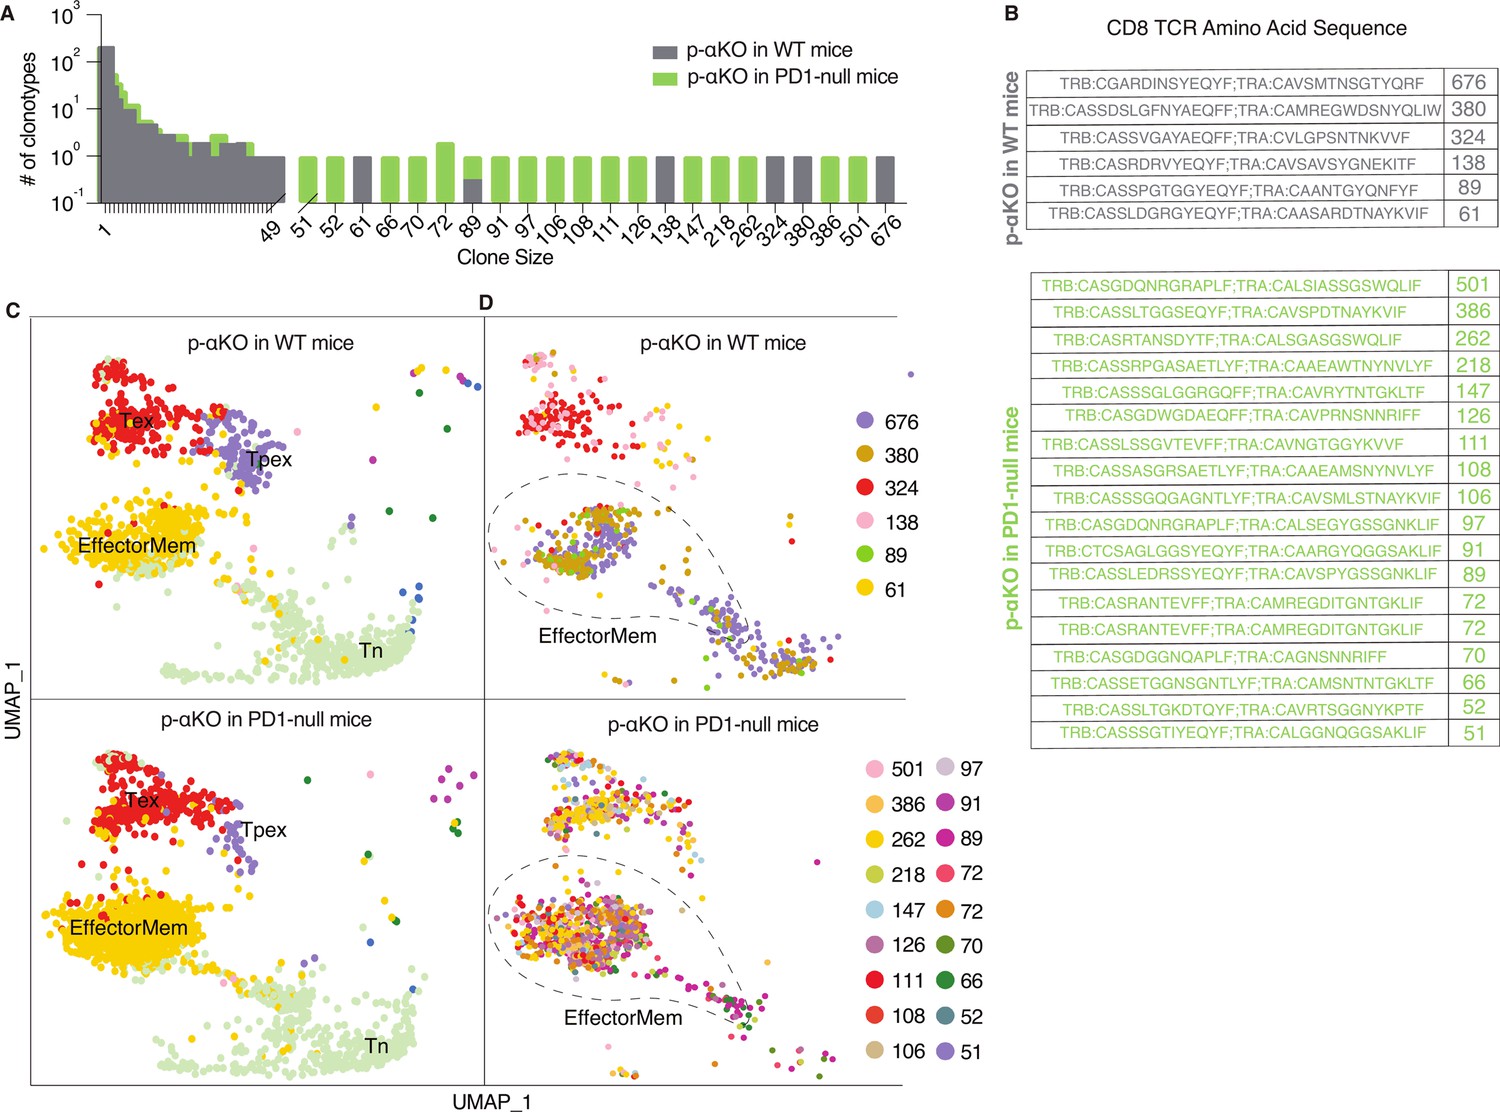
Increased number of anti-tumor cytotoxic T cells infiltrating p-αKO tumors implanted in PD1-null vs. WT mice.
WT and PD1-null mice in B6 genetic background were implanted with p-αKO cells in the pancreas (n = 2 for each group). Tumors were harvested from these animals 12 days post-implantation. T-cell suspensions prepared from these tumors were subjected to single-cell RNA sequencing (scRNA-seq) and T-cell receptor (TCR) sequencing analysis using the same protocol as Figure 1. (A) The bar graph shows size distribution of CD8+ T-cell clonotypes found in WT vs. PD1-null tumors. (B) CDR3 sequences of clonotypes with size ≥50 (defined as large expansion). Tumors in WT mice had six clonotypes with size ≥50 cells and tumors in PD1-null mice had 18 clonotypes with size ≥50 cells. (C) Uniform manifold approximation and projection (UMAP) showing gene expression profiles of all CD8+ T clonotypes found in both groups. EffectorMem: effector memory; Tex: exhausted; Tpex: precursor exhausted; Tn: naive-like or central memory. Each dot corresponds to a single cell. (D) UMAP showing gene expression profiles of large expansion CD8+ T-cell clonotypes. Each clonotype is color coded showing the functional mapping of individual cells. The dash line marks where effector memory T cells are located on the UMAP.
-
Figure 6—source data 1
Clone size counts for Figure 6A.
- https://cdn.elifesciences.org/articles/96925/elife-96925-fig6-data1-v1.xlsx
-
Figure 6—source data 2
T-cell receptor (TCR) clonotype CDR3 sequences and counts from p-αKO tumors implanted in B6 and PD1KO mice.
- https://cdn.elifesciences.org/articles/96925/elife-96925-fig6-data2-v1.xlsx
Figure 7
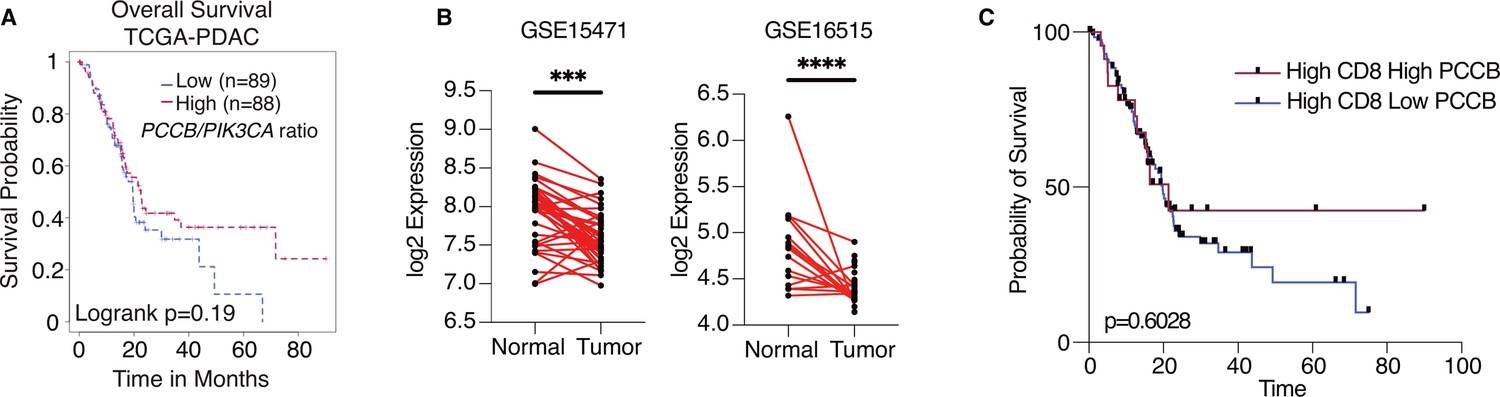
Propionyl-CoA carboxylase subunit B (PCCB) regulates pancreatic ductal adenocarcinoma (PDAC) survival in a TIL-dependent manner.
(A) Overall survival between patients with high PCCB/PIK3CA ratio vs. patients with low PCCB/PIK3CA of 177 PDAC patients from TCGA database. p = 0.19. (B) Two PDAC clinical data GSE15471 and GSE16515 illustrating PCCB mRNA expression in tumor sections vs. adjacent normal tissues. ***p = 0.0001 for GSE15471, N = 36 for tumor, and N = 36 for normal; and ****p < 0.0001 for GSE16515, n = 36 for tumor, and N = 16 for normal. (C) The overall survival comparisons among PDAC patients with high infiltrating CD8 T-cell level with high or low PCCB expression in TCGA dataset analyzed with TIDE algorithm. High vs. low PCCB expression was defined as 80% percentile.
Additional files
-
Supplementary file 1
T-cell receptor (TCR) clonotype, CDR3 sequences, and counts from two αKO tumors, two p-αKO tumors, and two p-αKO implanted in PD1KO mice tumors.
- https://cdn.elifesciences.org/articles/96925/elife-96925-supp1-v1.xlsx
-
Supplementary file 2
Sequencing-based counting of sgRNA frequencies with respective gene name from our CRISPR screen for the two tumors named T1 and T2.
- https://cdn.elifesciences.org/articles/96925/elife-96925-supp2-v1.txt
-
Supplementary file 3
Seahorse data measuring oxygen consumption rate (OCR) for KPC, αKO, and p-αKO cells.
- https://cdn.elifesciences.org/articles/96925/elife-96925-supp3-v1.xlsx
-
Supplementary file 4
Metabolic changes for αKO and p-αKO cells measured by liquid chromatography–mass spectrometry (LC–MS).
- https://cdn.elifesciences.org/articles/96925/elife-96925-supp4-v1.xlsx
-
MDAR checklist
- https://cdn.elifesciences.org/articles/96925/elife-96925-mdarchecklist1-v1.pdf
Download links
A two-part list of links to download the article, or parts of the article, in various formats.
Downloads (link to download the article as PDF)
Open citations (links to open the citations from this article in various online reference manager services)
Cite this article (links to download the citations from this article in formats compatible with various reference manager tools)
Propionyl-CoA carboxylase subunit B regulates anti-tumor T cells in a pancreatic cancer mouse model
eLife 13:RP96925.
https://doi.org/10.7554/eLife.96925.2


