Blood metabolomic profiling reveals new targets in the management of psychological symptoms associated with severe alcohol use disorder
- Laboratory of Nutritional Psychiatry, Institute of Neuroscience, UCLouvain, Université catholique de Louvain, Belgium
- Food Sciences Unit, Department of Life Technologies, University of Turku, Finland
- Metabolism and Nutrition Research Group, Louvain Drug Research Institute, UCLouvain, Université catholique de Louvain, Belgium
- Department of Adult Psychiatry, Cliniques Universitaires Saint-Luc and Institute of Neuroscience, UCLouvain, Université catholique de Louvain, Belgium
- School of Medicine, Institute of Public Health and Clinical Nutrition, University of Eastern Finland, Finland
- Université de Bordeaux, INRAE, Bordeaux INP, NutriNeurO, UMR 1286, France
- Department of gastro-enterology, Cliniques Universitaires Saint Luc, Belgium
- Department of Pathology, University of Helsinki, Finland
- Faculty of Medicine and Health Technology, Tampere University and Fimlab Laboratories, Finland
- School of Pharmacy, University of Eastern Finland, Finland
Figures
Figure 1 with 2 supplements
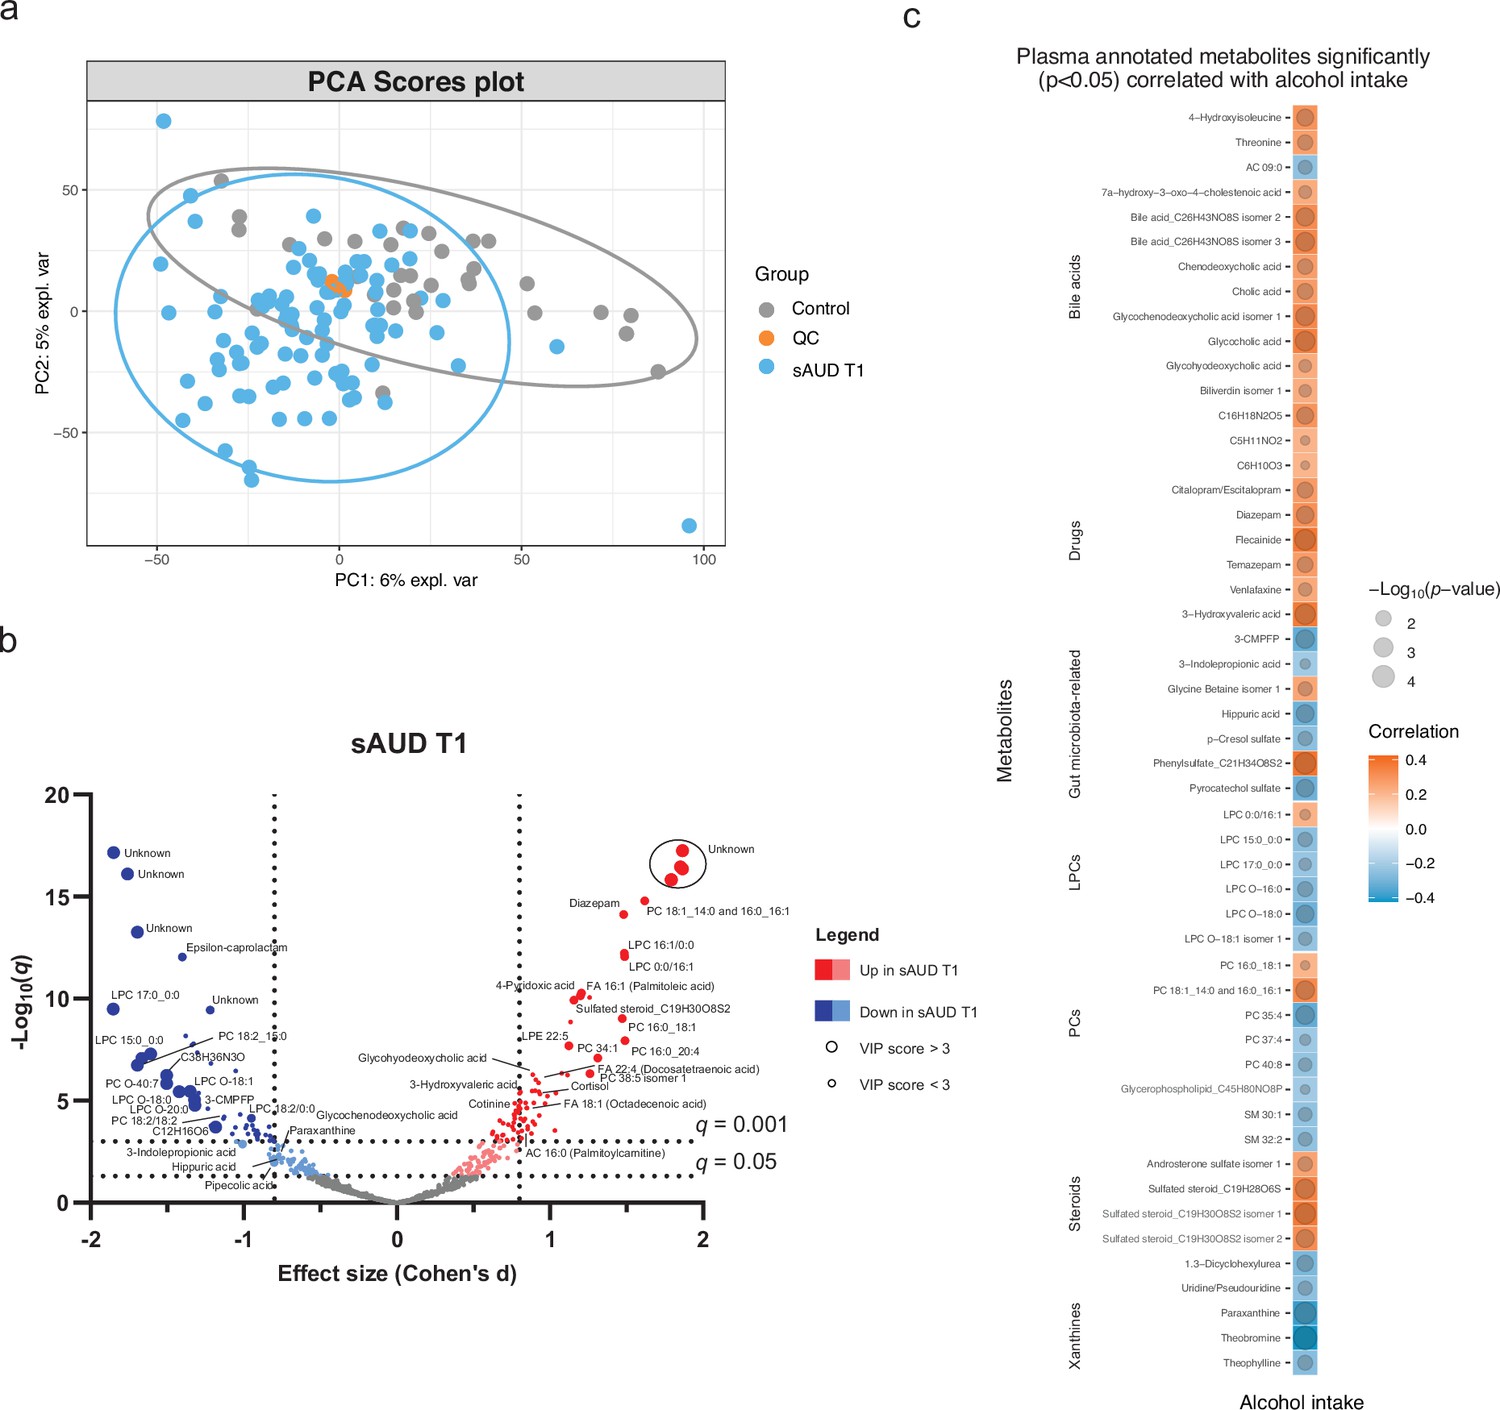
Chronic alcohol intake alters the plasma metabolome compared to healthy controls.
(a) Principal component analysis score plot of the plasma metabolomic features between healthy controls and persons with sAUD at T1. QC samples are colored in orange. (b) Volcano plot depicting the effect size (Cohen’s D) and -Log10 transformed q values derived from Welch’s t-test analysis of the metabolomic features different between healthy controls and persons with sAUD at T1. Circle size represent the variable importance in projections (VIP) scores derived from the sPLS-DA model for the plasma metabolomic features between persons with sAUD at T1 and healthy controls. (c) Annotated metabolites having significant association (Spearman p<0.05) with alcohol intake (g/day) in persons with AUD at T1. Circle size refers to the level of significance, blue gradient color to the strength of negative while red to the strength of positive correlation coefficients. 3-CMPFP 3-carboxy-4-methyl-5-propyl-2-furanpropionic acid; AC acylcarnitine; FA fatty acid; LPC lysophosphatidylcholine; LPE lysophosphatidylethanolamine; PC phosphatidylcholine; PE phosphatidylethanolamine; SM sphingomyelin.
Figure 1—figure supplement 1

Scores plot of the sparse partial least square discriminant analysis (sPLS-DA) separates the plasma metabolome of healthy controls and persons with AUD at the start of the withdrawal (T1).
Figure 1—figure supplement 2

Performance of the sPLS-DA model separating plasma metabolome of healthy controls and persons with AUD at T1.
Dotted line represents the optimal number of components included in the final model.
Figure 2 with 3 supplements
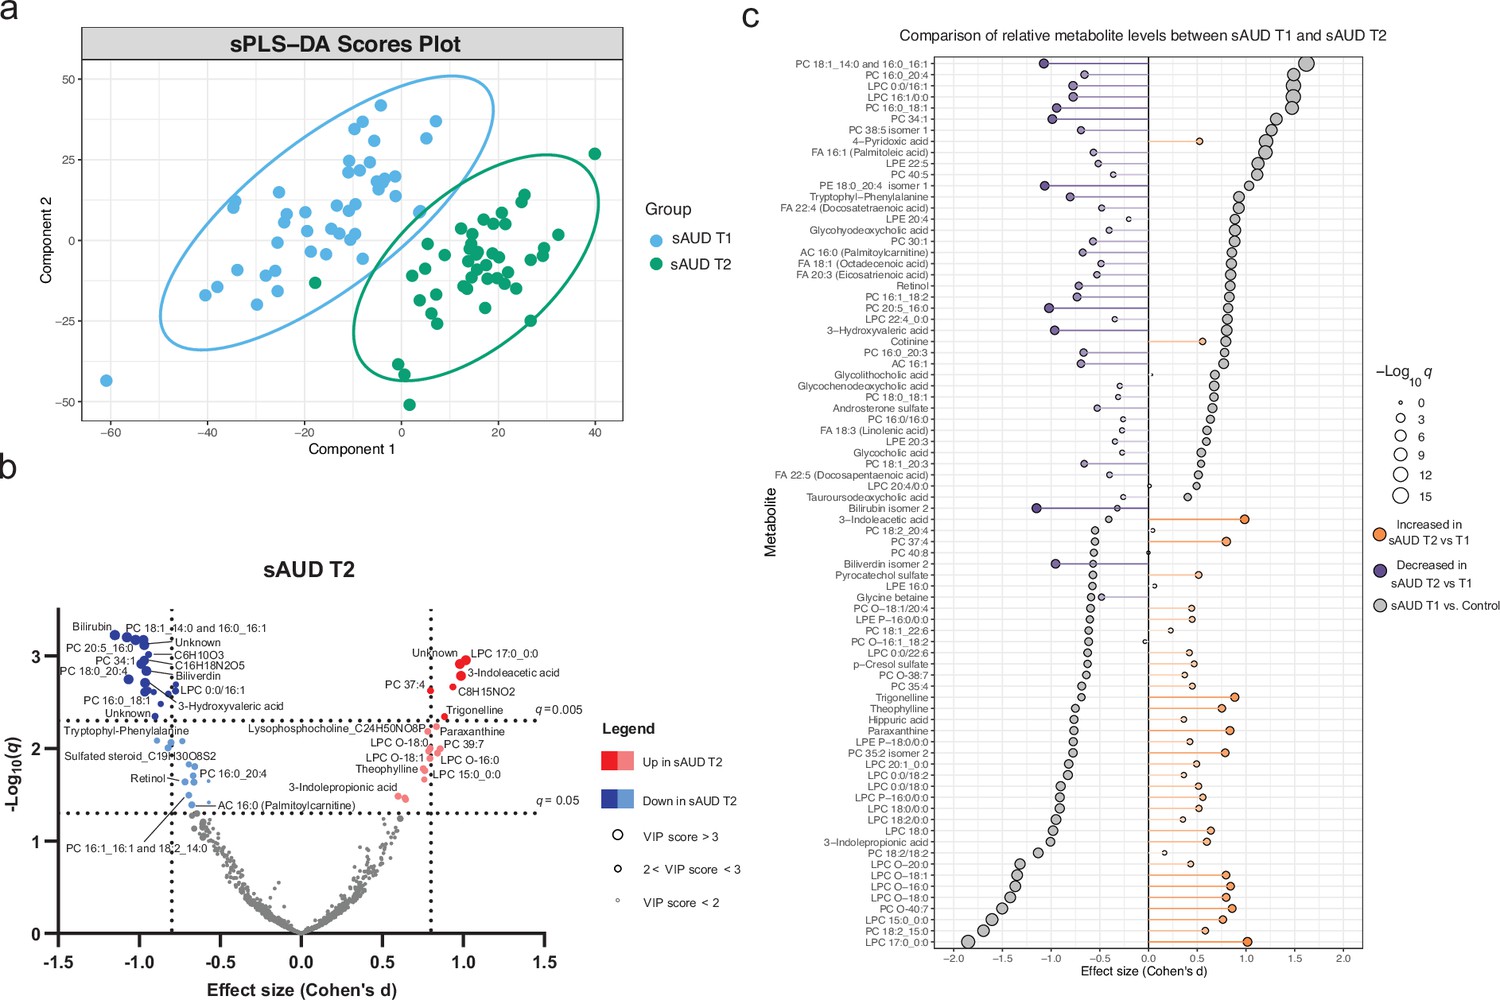
3-week alcohol withdrawal shapes the plasma metabolome.
(a) Scores plot of the sparse partial least square discriminant analysis (sPLS-DA) of the plasma metabolomes at the start (T1) and end (T2) of the alcohol withdrawal in persons with sAUD. (b) Volcano plot depicting the effect size (Cohen’s D) and -Log10 transformed q values derived from paired t-test analysis of the metabolomic features different between in persons with sAUD at T1 and T2. Circle size represent the variable importance in projections (VIP) scores for the plasma metabolomic features in the sPLS-DA model of persons with sAUD at T1 and T2. (c) Lollipop plot of the effect size (Cohen’s D) and -Log10 transformed q values of the altered annotated metabolites between sAUD T1 and healthy controls as well as sAUD T1 and sAUD T2. Circle size refers to the level of significance, grey color to the comparison between controls and sAUD T1, orange color to relative increase while violet to relative decrease towards the end of alcohol withdrawal (T2). AC acylcarnitine; FA fatty acid; LPC lysophosphatidylcholine; LPE lysophosphatidylethanolamine; PC phosphatidylcholine.
Figure 2—figure supplement 1

Principal component analysis score plot between the plasma metabolomic features in persons with AUD at the beginning (T1) and end (T2) of alcohol withdrawal.
Figure 2—figure supplement 2

Performance of the sPLS-DA model discriminating plasma metabolome of persons with AUD between the beginning (T1) and end (T2) of alcohol withdrawal.
Dotted line represents the optimal number of components included in the final model.
Figure 2—figure supplement 3
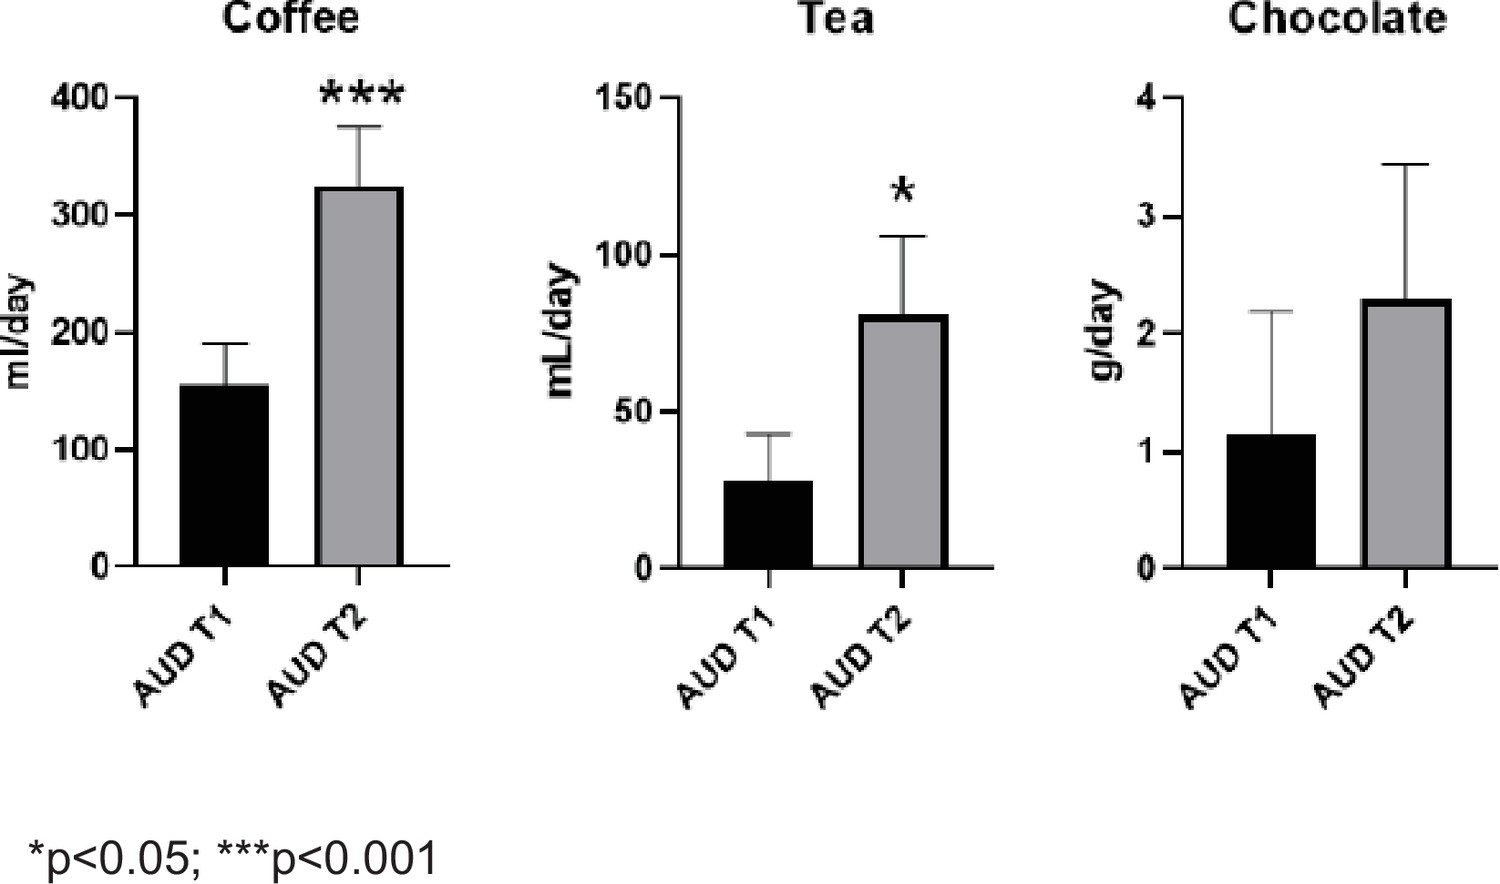
Changes in dietary intake of coffee, tea, and chocolate during alcohol withdrawal.
Data are means ± SEM, n = 48, paired t-test.
Figure 3
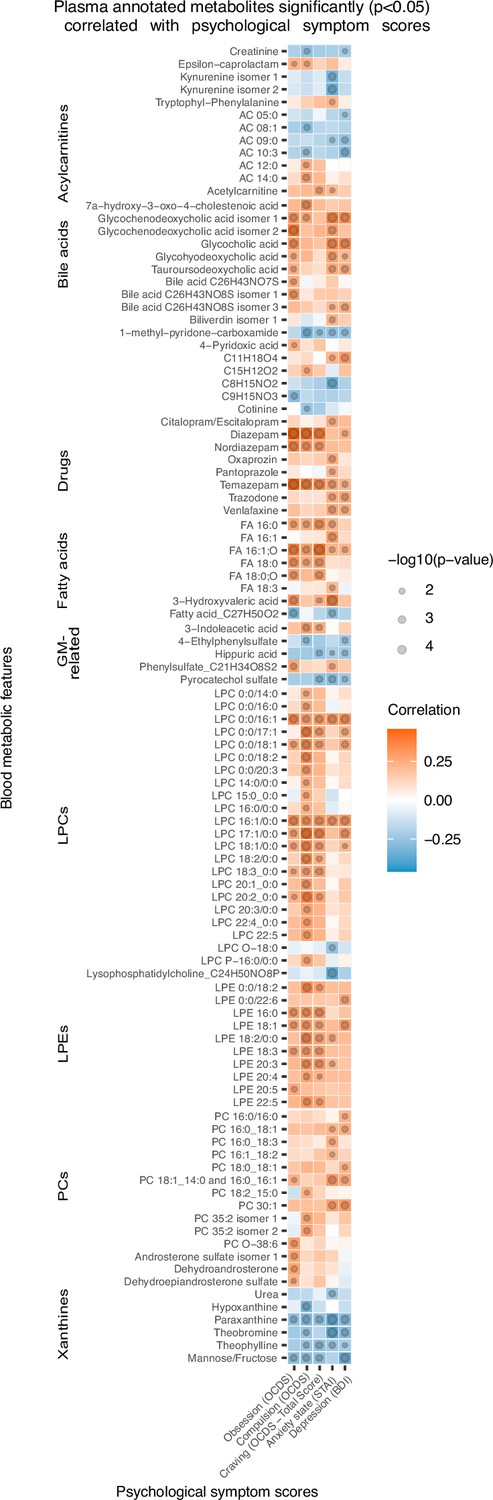
Plasma metabolites associated with psychological symptom scores.
Heatmap of the annotated metabolites having significant (p<0.05) Spearman correlation with one or more psychological symptom score of obsession, compulsion, alcohol craving, anxiety state or depression. Circle size refers to the level of significance, blue gradient color to the strength of negative while red to the strength of positive correlation coefficients. AC acylcarnitine; FA fatty acid; GM gut microbiota; LPC lysophosphatidylcholine; LPE lysophosphatidylethanolamine; PC phosphatidylcholine.
Figure 4
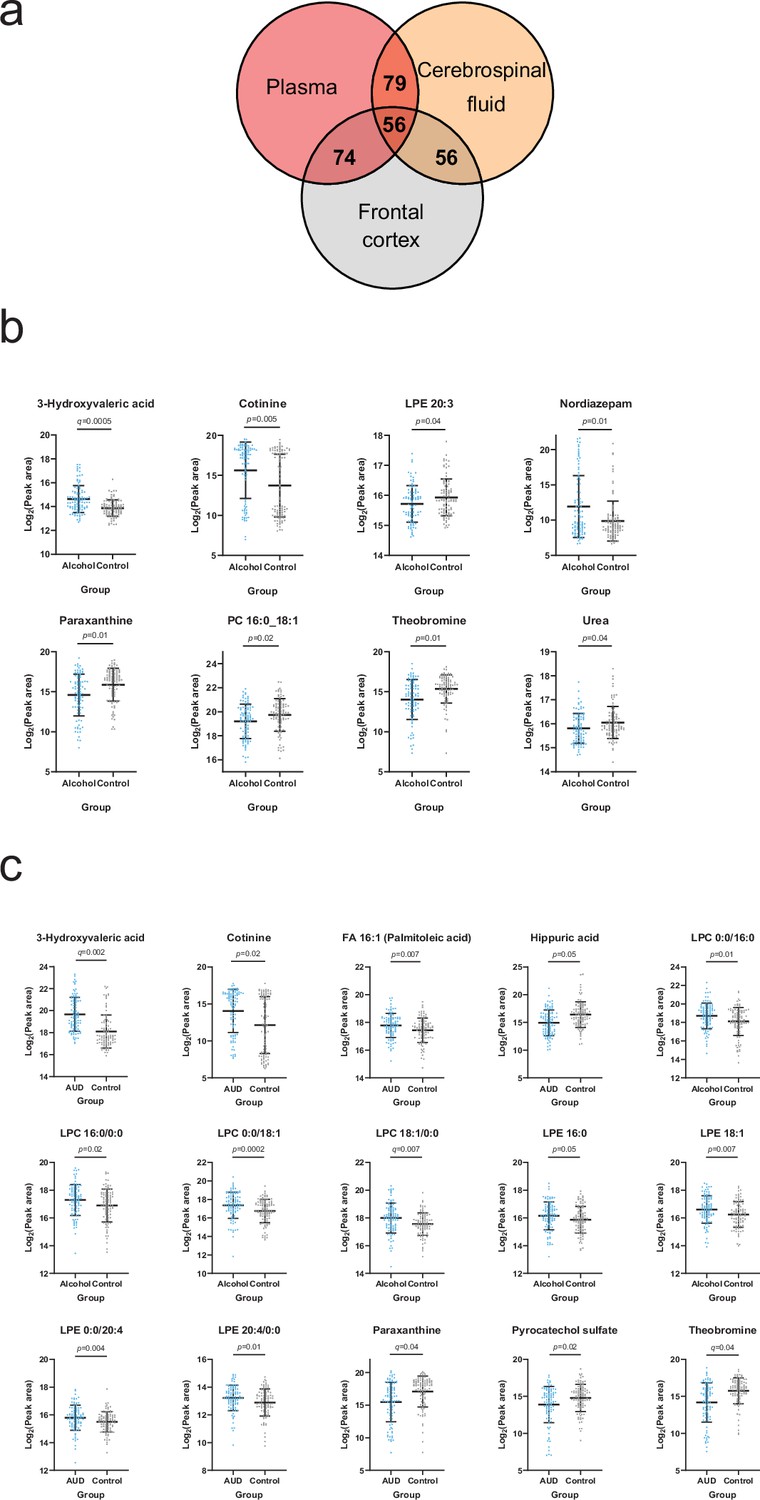
Overlapping metabolites within the plasma and brain metabolome.
(a) Venn diagram of the annotated plasma metabolites that are also present in the frontal cortex and cerebrospinal fluid metabolome. (b) Significantly altered (p<0.05) frontal cortex metabolites with a corresponding plasma metabolite showing an association with one or more psychological symptom score. (c) Significantly altered (p<0.05) cerebrospinal fluid metabolite with a corresponding plasma metabolite showing an association with one or more psychological symptom score. Data expressed as mean ± SD with individual values shown. Statistical values derived from Welch’s t-test comparing metabolomic features between control and alcohol groups.
Author response image 1

Schematic representation of the protocol.
Author response image 2

Data are described as median ± SEM.
AST, Aspartate transaminase; ALT, Alanine transaminase; gGT: gamma glutamyltranspeptidase. ** p<0.01 vs T1, *** p<0.001 vs T1
Tables
Table 1
Clinical features of the study participants.
| Alcoholbis cohort | GUT2BRAIN cohort | All | p-value | |
|---|---|---|---|---|
| Number of subjects | 48 | 48 | 96 | |
| Age | 46±10 | 48±9 | 47±10 | 0.24 |
| Gender Men, n (%) Women, n (%) | 34 (71%) 14 (29%) | 30 (62.5%) 18 (37.5%) | 64 (67%) 32 (33%) | 0.39* |
| Smoking status Active smoker (%) Non-smoker (%) | 77 23 | 79 21 | 78 22 | 0.83* |
| Alcohol history Alcohol consumption (g/day) Duration of drinking habits (years) Number of withdrawal cures AUDIT score DSM5 score | 151±112 17±10 1±2 31±7 | 139±73 16±11 2±2 8±2 | 145±94 16±11 1.8±2.3 | 0.54 0.76 0.015† |
| Depression Score at T1 | 23±11 | 26±12 | 25±12 | 0.26 |
| Anxiety Score at T1 | 44±11 | 46±15 | 45±13 | 0.27 |
| Alcohol craving Total score at T1 Obsession score at T1 Compulsion score at T1 | 20±7 9±5 11±3 | 25±6 11±4 14±3 | 22±7 10±4 13±3 | 0.00† 0.26 0.00† |
-
Results are means ± standard deviations. Independent t-tests to compare ALCOHOLBIS versus GUT2BRAIN cohorts.
-
*
chi-square test for categorical variables.
-
†
p<0.05.
Additional files
-
Supplementary file 1
biological features of healthy controls and background characteristics of the selected subjects from the TSDS cohort.
- https://cdn.elifesciences.org/articles/96937/elife-96937-supp1-v1.docx
-
Supplementary file 2
List of identified metabolites and unknown features and related statistics.
- https://cdn.elifesciences.org/articles/96937/elife-96937-supp2-v1.pdf
-
Supplementary file 3
EICs, retention times and reference spectra for level 1 identifications.
- https://cdn.elifesciences.org/articles/96937/elife-96937-supp3-v1.docx
-
MDAR checklist
- https://cdn.elifesciences.org/articles/96937/elife-96937-mdarchecklist1-v1.docx
Download links
A two-part list of links to download the article, or parts of the article, in various formats.
Downloads (link to download the article as PDF)
Open citations (links to open the citations from this article in various online reference manager services)
Cite this article (links to download the citations from this article in formats compatible with various reference manager tools)
Blood metabolomic profiling reveals new targets in the management of psychological symptoms associated with severe alcohol use disorder
eLife 13:RP96937.
https://doi.org/10.7554/eLife.96937.3


