The epididymis contributes to sperm DNA integrity and early embryo development through Cysteine-Rich Secretory Proteins
- Instituto de Biología y Medicina Experimental (IByME-CONICET), Argentina
Figures
Figure 1
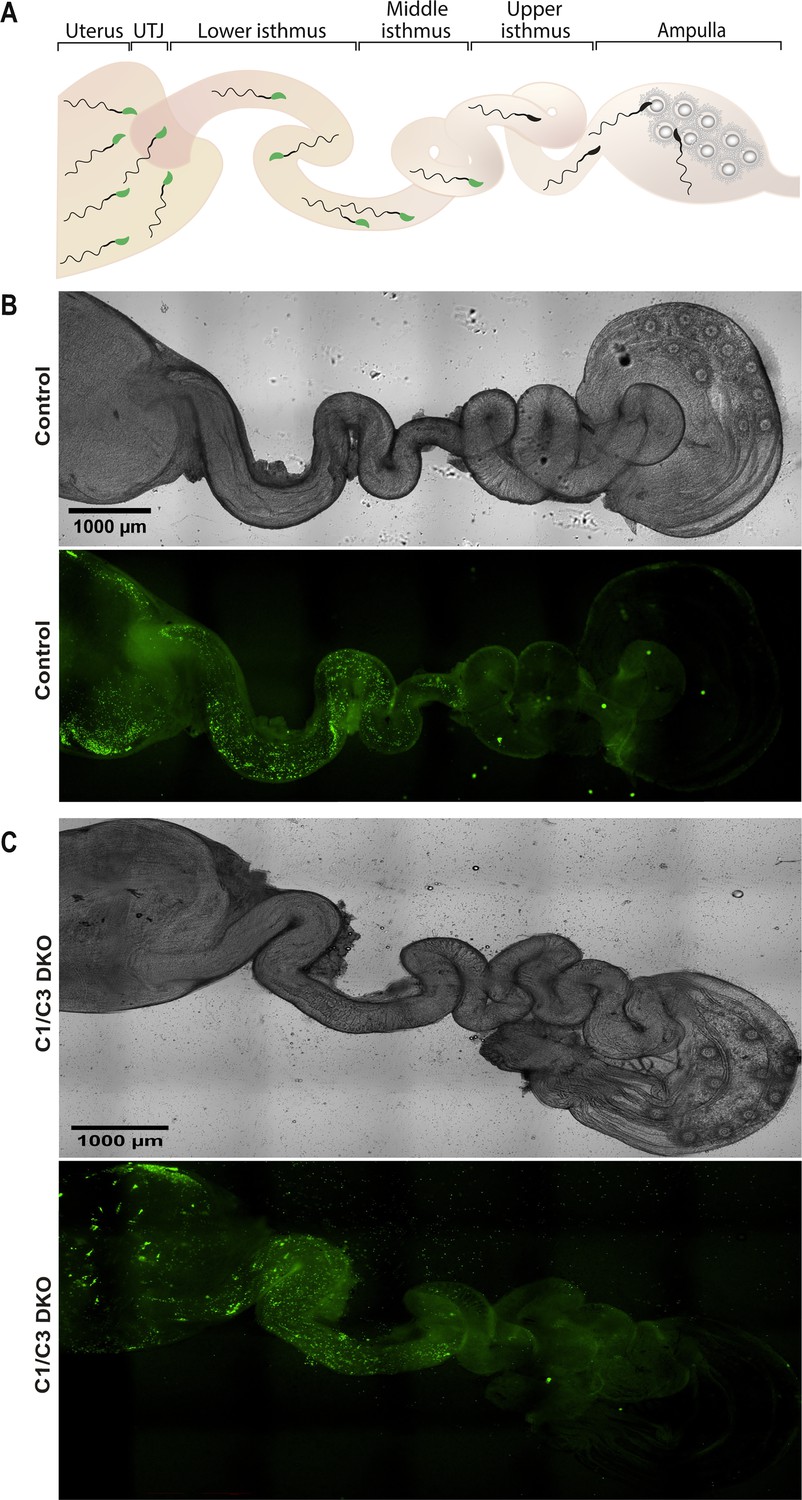
Sperm migration through the female reproductive tract.
(A) Representative diagram showing sperm within the different regions of the female reproductive tract. UTJ, utero-tubal junction. Superovulated females were mated with Acrosine-GFP control or C1/C3 DKO males and, 4 hr after mating, sperm were analyzed inside the tract by fluorescence microscopy. (B) Bright field (upper panel) and fluorescence (lower panel) images of the reproductive tract of a female mated with a control male (×40). (C) Bright field (upper panel) and fluorescence (lower panel) images of the reproductive tract of a female mated with C1/C3 DKO male (×40). Figures are representative of at least three independent experiments.
-
Figure 1—source data 1
Raw DIC picture of the reproductive tract of a female mouse mated with a control male (Figure 1B).
- https://cdn.elifesciences.org/articles/97105/elife-97105-fig1-data1-v1.pdf
-
Figure 1—source data 2
Raw fluorescence picture of the reproductive tract of a female mouse mated with a control male (Figure 1B).
- https://cdn.elifesciences.org/articles/97105/elife-97105-fig1-data2-v1.pdf
-
Figure 1—source data 3
Raw DIC picture of the reproductive tract of a female mouse mated with a C1C3 DKO male (Figure 1C).
- https://cdn.elifesciences.org/articles/97105/elife-97105-fig1-data3-v1.pdf
-
Figure 1—source data 4
Raw fluorescence picture of the reproductive tract of a female mouse mated with a C1C3 DKO male (Figure 1C).
- https://cdn.elifesciences.org/articles/97105/elife-97105-fig1-data4-v1.pdf
Figure 2

In vivo fertilization and embryo development.
(A) Control and C1/C3 DKO males were mated with superovulated females and the percentage of fertilized eggs recovered from the ampulla 4 hr after mating was evaluated. Eggs were considered fertilized when they reached the two-cell embryo stage 24 hr after in vitro incubation. (B) Two-cell embryos from (A) were incubated in vitro for an additional 3 days, and the percentage reaching the blastocyst stage was determined. (C) Control or C1/C3 DKO cauda epididymal sperm were inseminated into the uterus of superovulated females. After 15 hr, eggs were recovered from the ampulla, incubated for 24 hr in vitro and were considered fertilized when reaching the two-cell embryo stage. (D) Two-cell embryos from (C) were incubated in vitro for an additional 3 days and the percentage reaching the blastocyst stage was determined. Data are mean ± SEM; n = 5, *p < 0.05; **p < 0.01. Percentages of two-cell embryos were determined by dividing the number of two-cell embryos by the total number of eggs examined and percentages of blastocysts as the number of eggs reaching the blastocyst stage divided by the total number of two-cell embryos recovered.
-
Figure 2—source data 1
Raw data and statistical analysis of the percentage of fertilized eggs recovered from the ampulla 4 hr after copulatory plug formation (Figure 2A).
- https://cdn.elifesciences.org/articles/97105/elife-97105-fig2-data1-v1.txt
-
Figure 2—source data 2
Raw data and statistical analysis of the percentage of embryos reaching the blastocyst stage in vitro from two-cell embryos obtained after in vitro incubation of fertilized eggs recovered from the ampulla 4hs after copulatory plug formation (Figure 2B).
- https://cdn.elifesciences.org/articles/97105/elife-97105-fig2-data2-v1.txt
-
Figure 2—source data 3
Raw data and statistical analysis of the percentage of fertilized egg recovered from the ampulla after intrauterine insemination of cauda epididymal sperm (Figure 2C).
- https://cdn.elifesciences.org/articles/97105/elife-97105-fig2-data3-v1.txt
-
Figure 2—source data 4
Raw data and statistical analysis of the percentage of embryos reaching the blastocyst stage in vitro from two-cell embryos obtained after in vitro incubation of eggs recovered from the ampulla after intrauterine insemination of cauda epididymal sperm (Figure 2D).
- https://cdn.elifesciences.org/articles/97105/elife-97105-fig2-data4-v1.txt
Figure 3
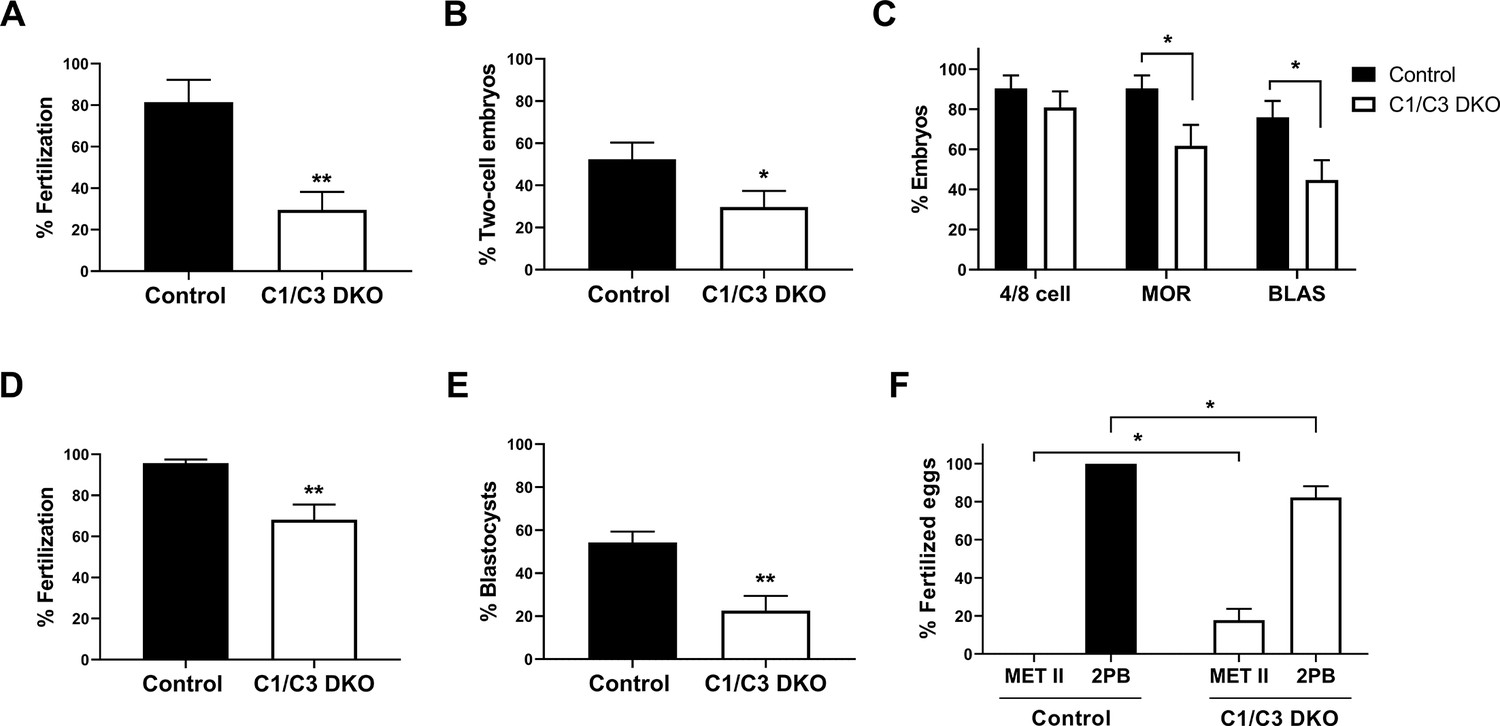
In vitro fertilization and embryo development.
(A, B) In vitro capacitated control or C1/C3 DKO cauda epididymal sperm were co-incubated with cumulus–oocyte complexes (COC) for 3.5 hr. Eggs were either analyzed at that moment and considered fertilized when at least one decondensing sperm nucleus or two pronuclei were found in the ooplasm (n = 3) (A) or incubated for additional 24 hr to determine the percentage reaching the two-cell embryo stage (n = 7) (B). (C) Two-cell embryos from (B) were incubated for 3 days in vitro and the percentage reaching 4/8 cells (day 1), morula (day 2), or blastocyst (day 3) stages determined (n = 7). (D) In vitro capacitated control or C1/C3 DKO epididymal sperm were co-incubated with zona pellucida (ZP)-free eggs for 1 hr and fertilization was evaluated by DNA staining. Eggs were considered fertilized when at least one decondensing sperm nucleus was found in the ooplasm (n ≥ 5). (E) Fertilized ZP-free eggs obtained as in D were incubated for an additional 3 days in vitro and the percentage progressing to blastocysts was determined (n = 5). (F) Fertilized eggs from (D) were analyzed for maternal DNA status and classified as arrested in Metaphase II (Met II) or exhibiting 2nd polar body (2PB) (n ≥ 5). Data are the mean ± SEM; *p < 0.05; **p < 0.01. Percentages of fertilization were determined by dividing the number of fertilized eggs by the total number of eggs examined. Percentages of two-cell embryos were determined by dividing the number of two-cell embryos by the total number of eggs examined. Percentages of either 4/8 cell embryos, morula and blastocysts were calculated as the number of embryos reaching each of these stages divided by the total number of two-cell embryos obtained.
-
Figure 3—source data 1
Raw data and statistical analysis of the percentage of eggs exhibiting a decondensed sperm head after in vitro co-incubation of cumulus–oocyte complexes (COC) with cauda epididymal sperm (Figure 3A).
- https://cdn.elifesciences.org/articles/97105/elife-97105-fig3-data1-v1.txt
-
Figure 3—source data 2
Raw data and statistical analysis of the percentage of two-cell embryos after in vitro co-incubation of cumulus–oocyte complexes (COC) and cauda epididymal sperm (Figure 3B).
- https://cdn.elifesciences.org/articles/97105/elife-97105-fig3-data2-v1.txt
-
Figure 3—source data 3
Raw data and statistical analysis of the percentage of embryos reaching the blastocyst stage in vitro from two-cell eggs obtained after in vitro co incubation of cumulus–oocyte complexes (COC) and cauda epididymal sperm (Figure 3C).
- https://cdn.elifesciences.org/articles/97105/elife-97105-fig3-data3-v1.txt
-
Figure 3—source data 4
Raw data and statistical analysis of the percentage of eggs exhibiting a decondensed sperm head after in vitro co-incubation of zona pellucida-free oocytes with cauda epididymal sperm (Figure 3D).
- https://cdn.elifesciences.org/articles/97105/elife-97105-fig3-data4-v1.txt
-
Figure 3—source data 5
Raw data and statistical analysis of the percentage of embryos reaching the blastocyst stage in vitro from two-cell eggs obtained after in vitro co-incubation of zona pellucida-free oocytes with cauda epididymal sperm (Figure 3E).
- https://cdn.elifesciences.org/articles/97105/elife-97105-fig3-data5-v1.txt
-
Figure 3—source data 6
Raw data and statistical analysis of maternal DNA status after in vitro co-incubation of zona pellucida-free oocytes with cauda epididymal sperm (Figure 3F).
- https://cdn.elifesciences.org/articles/97105/elife-97105-fig3-data6-v1.txt
Figure 4
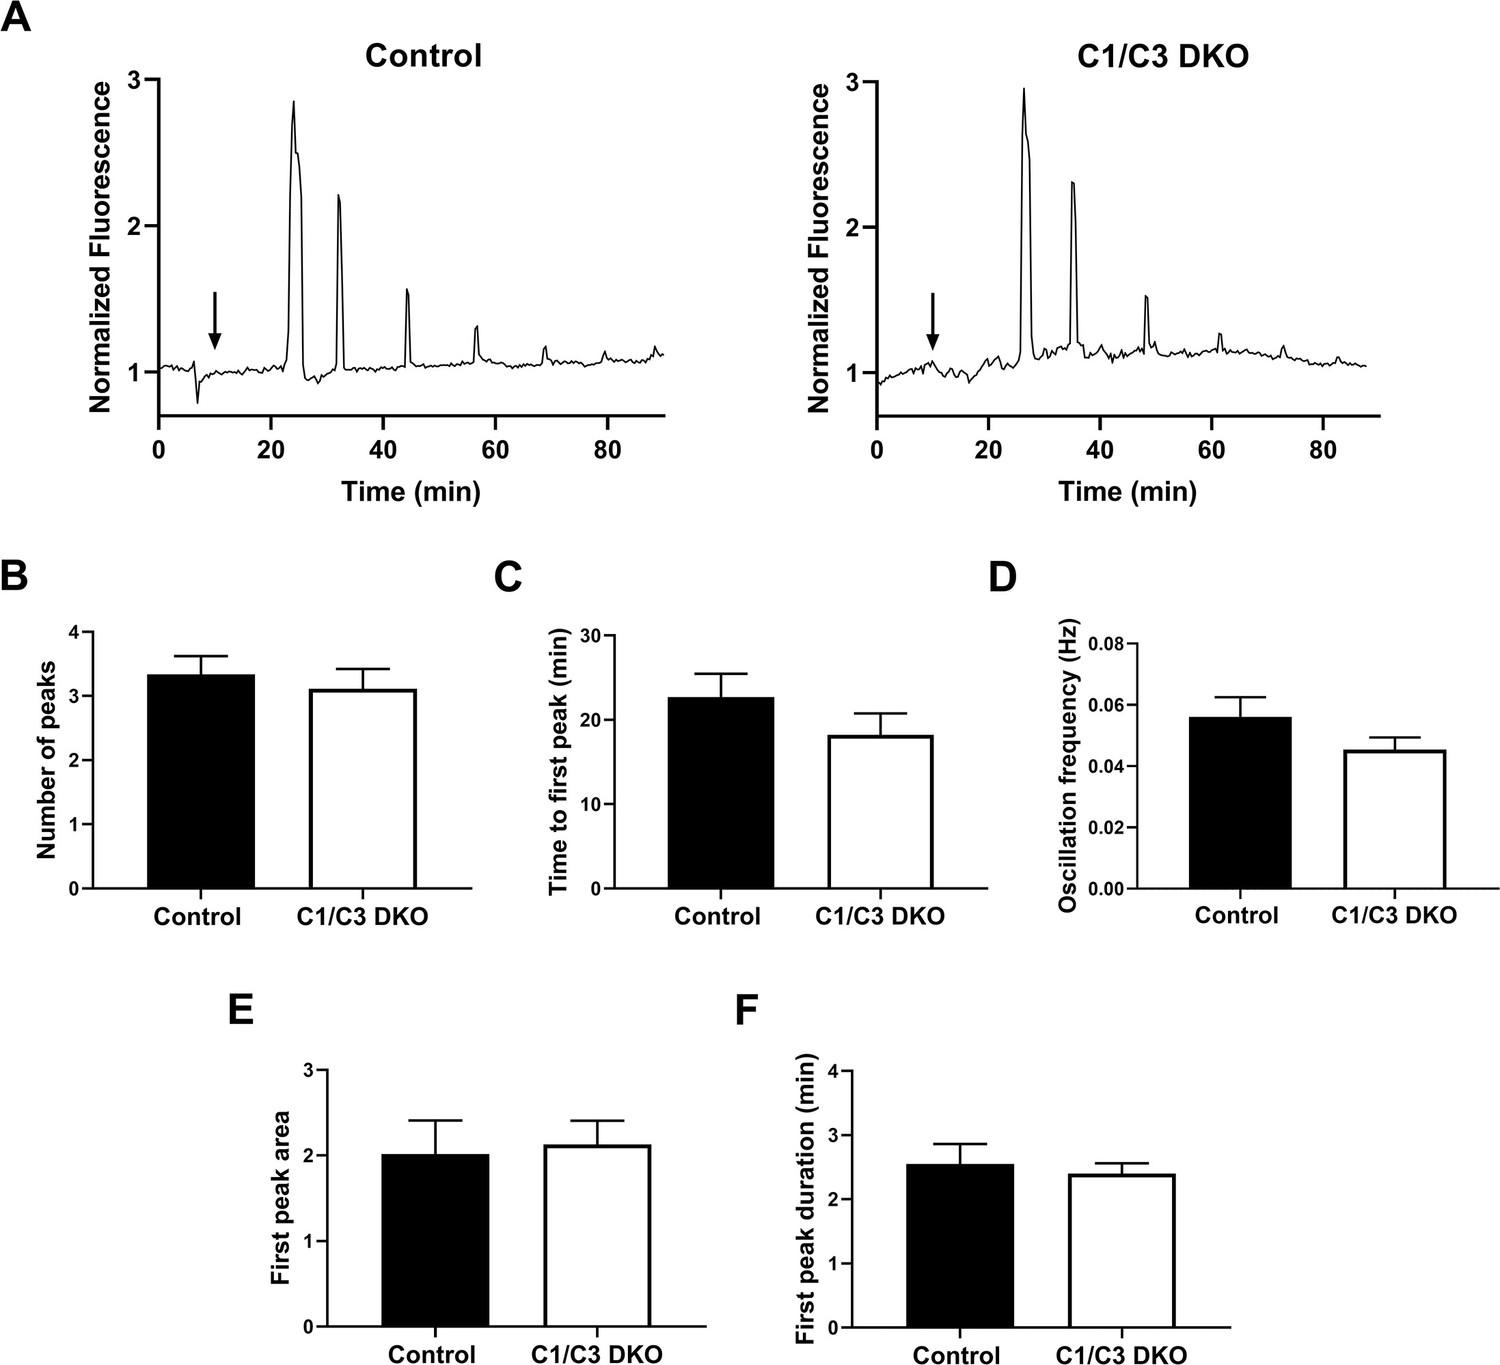
Egg Ca2+ oscillations in in vitro fertilized eggs.
(A) Representative traces of Ca2+ oscillation patterns following in vitro fertilization of zona pellucida (ZP)-free eggs with control or C1/C3 DKO sperm. Arrows indicate the time of sperm addition. (B) Number of peaks within 90 min, (C) time to first peak, (D) oscillation frequency, (E) first peak area under the curve, and (F) first transient duration. Values were normalized to basal Ca2+ levels recorded prior to sperm addition. Data are mean ± SEM of at least nine oocytes from three independent experiments; (A–F) ns.
-
Figure 4—source data 1
Raw data and statistical analysis of the numbers of peaks corresponding to Ca2+ oscillations analyzed by fluorescence microscopy (Figure 4B).
- https://cdn.elifesciences.org/articles/97105/elife-97105-fig4-data1-v1.txt
-
Figure 4—source data 2
Raw data and statistical analysis of the time to the first peak corresponding to Ca2+ oscillations analyzed by fluorescence microscopy (Figure 4C).
- https://cdn.elifesciences.org/articles/97105/elife-97105-fig4-data2-v1.txt
-
Figure 4—source data 3
Raw data and statistical analysis of the frequency of Ca2+ oscillations analyzed by fluorescence microscopy (Figure 4D).
- https://cdn.elifesciences.org/articles/97105/elife-97105-fig4-data3-v1.txt
-
Figure 4—source data 4
Raw data and statistical analysis of the first peak area corresponding to Ca2+ oscillations analyzed by fluorescence microscopy (Figure 4E).
- https://cdn.elifesciences.org/articles/97105/elife-97105-fig4-data4-v1.txt
-
Figure 4—source data 5
Raw data and statistical analysis of the duration of the first peak corresponding to Ca2+ oscillations analyzed by fluorescence microscopy (Figure 4F).
- https://cdn.elifesciences.org/articles/97105/elife-97105-fig4-data5-v1.txt
Figure 5
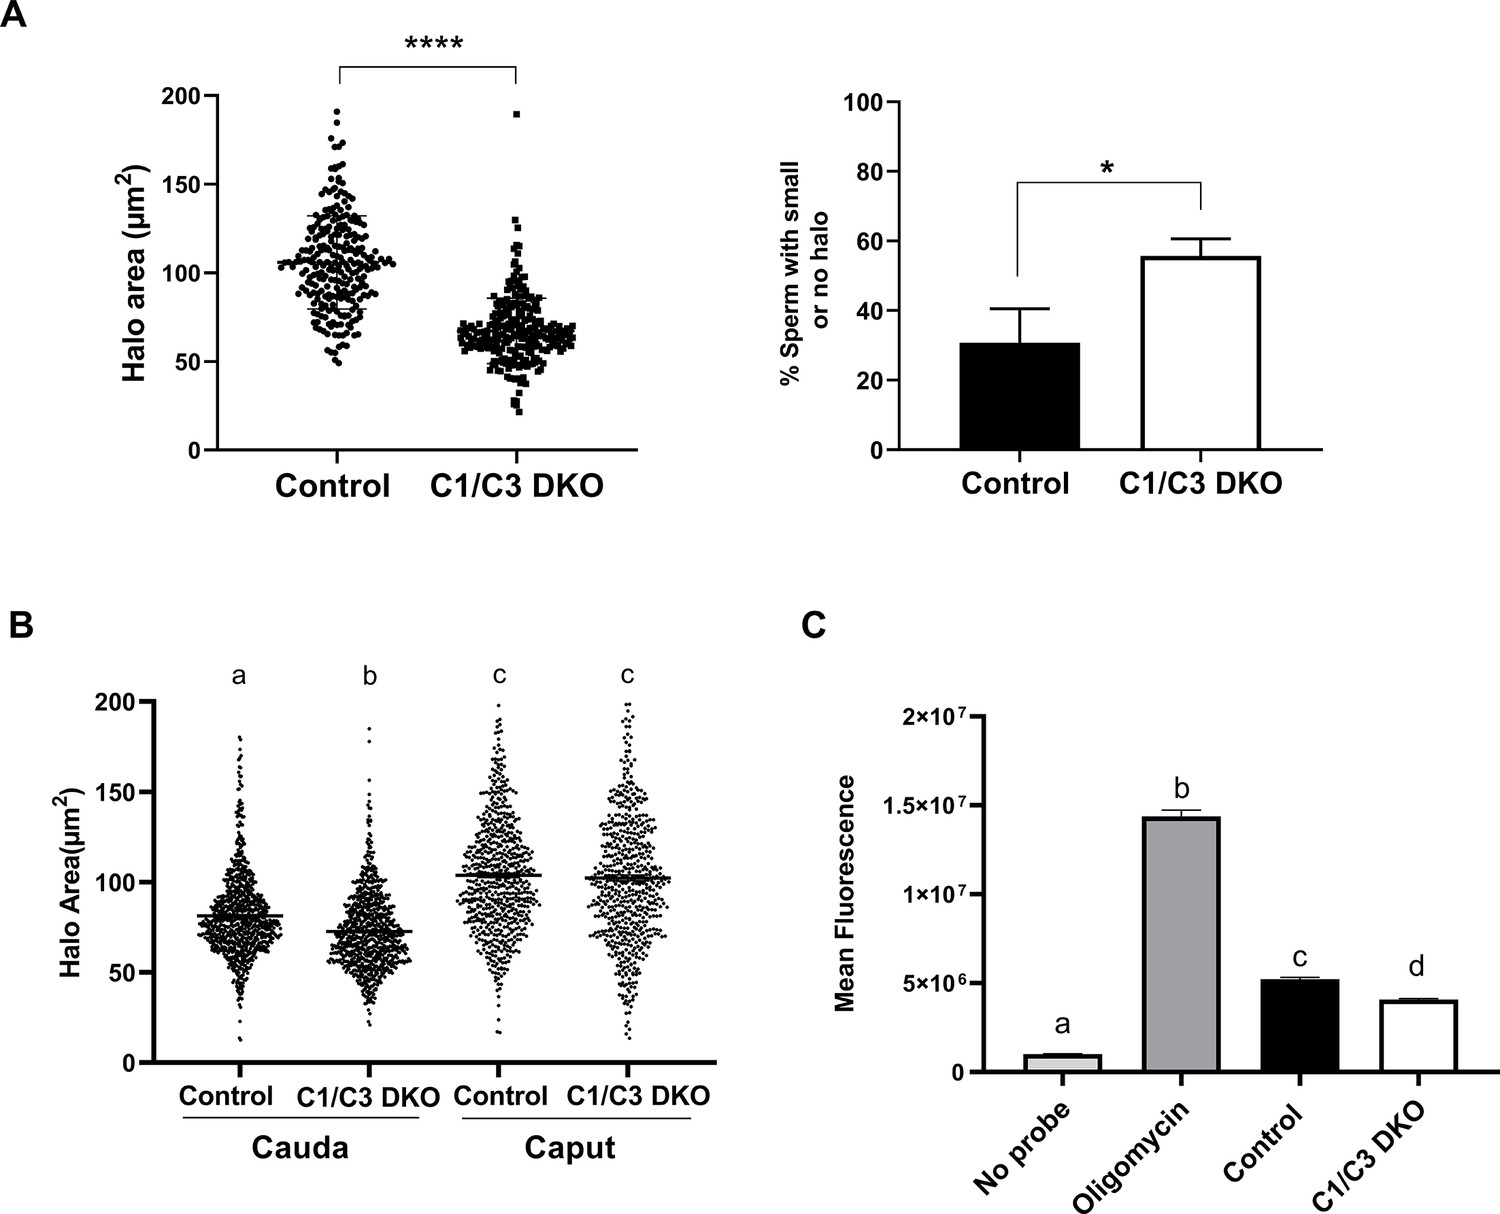
Sperm DNA fragmentation and reactive oxygen species (ROS) levels.
(A) DNA fragmentation of control or C1/C3 DKO cauda epididymal sperm was analyzed by sperm chromatin dispersion (SCD) assay and both the area of DNA halo in each individual cell (left panel) and the percentage of sperm heads with small or no halo (right panel) determined. (B) DNA fragmentation of cauda and caput epididymal control or C1/C3 DKO sperm was analyzed by SCD assay and the area of DNA halo in each individual cell determined. (C) ROS levels in control and C1/C3 DKO cauda sperm analyzed by fluorescence confocal microscopy. Absence of probe and presence of Oligomycin were used as negative and positive controls, respectively. In all cases, n = 4. *p < 0.05; ****p < 0.0001, different letters indicate significant differences between treatments, p < 0.0001.
-
Figure 5—source data 1
Raw data and statistical analysis of the DNA halo area corresponding to sperm analyzed by sperm chromatin dispersion (SCD) assay (Figure 5A).
- https://cdn.elifesciences.org/articles/97105/elife-97105-fig5-data1-v1.txt
-
Figure 5—source data 2
Raw data and statistical analysis of the percentage of DNA fragmentation corresponding to cauda sperm analyzed by sperm chromatin dispersion (SCD) assay (Figure 5A).
- https://cdn.elifesciences.org/articles/97105/elife-97105-fig5-data2-v1.txt
-
Figure 5—source data 3
Raw data and statistical analysis of the DNA halo area corresponding to caput and cauda sperm analyzed by SCD assay (Figure 5B).
- https://cdn.elifesciences.org/articles/97105/elife-97105-fig5-data3-v1.txt
-
Figure 5—source data 4
Raw data and statistical analysis of reactive oxygen species (ROS) levels in fresh cauda sperm analyzed by fluorescence microscopy (Figure 5C).
- https://cdn.elifesciences.org/articles/97105/elife-97105-fig5-data4-v1.txt
Figure 6
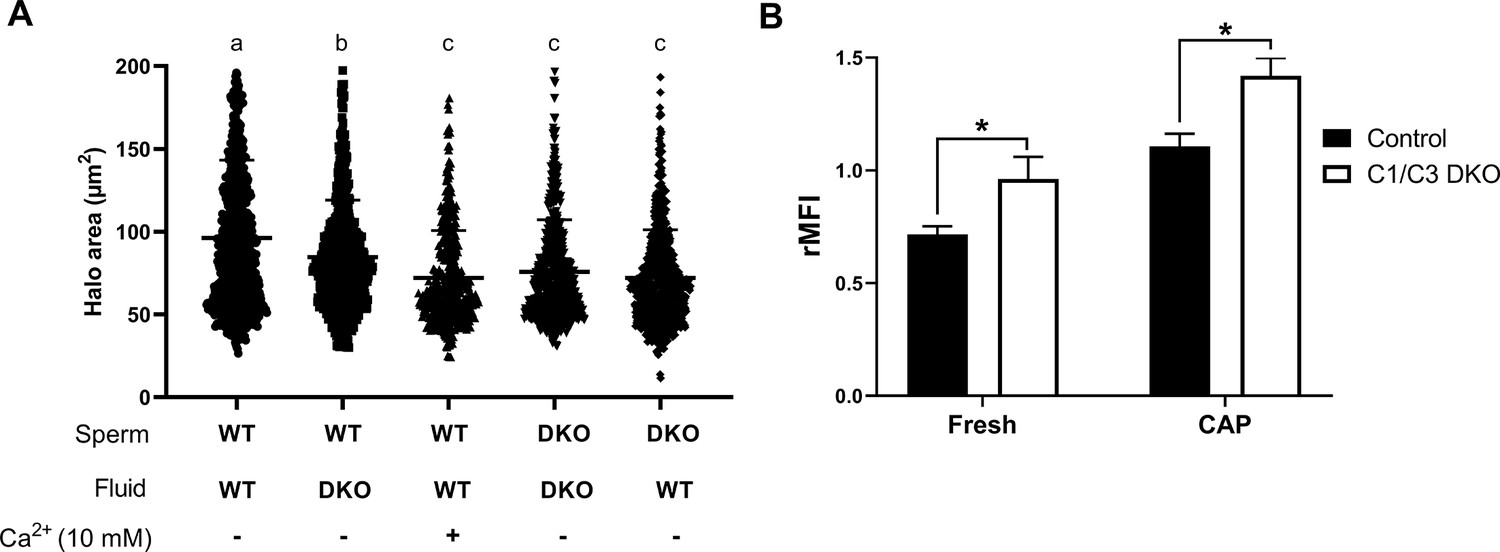
Influence of epididymal fluid on sperm DNA integrity and intracellular Ca2+ levels.
(A) DNA fragmentation of control or C1/C3 DKO cauda epididymal sperm incubated for 1 hr with their own or the other genotype epididymal fluid in the presence or absence of 10 mM Ca2+ was analyzed by sperm chromatin dispersion (SCD) assay and the area of DNA halo in each individual cell determined. Different letters indicate significant differences between treatments (p < 0.05). (B) Intracellular Ca2+ levels were evaluated by flow cytometry using Fluo-4-AM probe. Results are shown as normalized mean fluorescence intensity (rMFI) of Fluo-4-AM compared to the control condition in each experiment for non-capacitated (fresh) and capacitated (CAP) sperm. Data are mean ± SEM, n = 5; *p < 0.05.
-
Figure 6—source data 1
Raw data and statistical analysis of the DNA halo area corresponding to sperm incubated in vitro with epididymal fluids and Ca2+ (Figure 6A).
- https://cdn.elifesciences.org/articles/97105/elife-97105-fig6-data1-v1.txt
-
Figure 6—source data 2
Raw data and statistical analysis of the normalized intensity of Fluo-4-AM fluorescence obtained by flow cytometry of fresh and capacitated cauda epididymal sperm (Figure 6B).
- https://cdn.elifesciences.org/articles/97105/elife-97105-fig6-data2-v1.txt
Tables
Table 1
Analysis of embryo development corresponding to C1/C3 and C1/C4 DKO males.
| Control | C1/C3 DKO | Control | C1/C4 DKO | |
|---|---|---|---|---|
| Total two-cell embryos (N°) | 53 | 53 | 80 | 76 |
| Blastocysts (N°) | 38 | 23 | 52 | 46 |
| Embryo development (%) | 75.2 ± 8.3% | 37.4 ± 10.7%** | 67.7 ± 12.1% | 66.9 ± 13.4% |
-
Note: Percentage of embryo development was calculated as the mean of at least five independent experiments, n = 5. **p < 0.01 vs control.
-
Table 1—source data 1
Raw data and statistical analisys for C1/C3 DKO in vivo fertilization.
- https://cdn.elifesciences.org/articles/97105/elife-97105-table1-data1-v1.txt
-
Table 1—source data 2
Raw data and statistical analisys for C1/C3 DKO embryo development.
- https://cdn.elifesciences.org/articles/97105/elife-97105-table1-data2-v1.txt
-
Table 1—source data 3
Raw data and statistical analisys for C1/C4 DKO in vivo fertilization.
- https://cdn.elifesciences.org/articles/97105/elife-97105-table1-data3-v1.txt
-
Table 1—source data 4
Raw data and statistical analisys for C1/C4 DKO embryo development.
- https://cdn.elifesciences.org/articles/97105/elife-97105-table1-data4-v1.txt
Key resources table
| Reagent type (species) or resource | Designation | Source or reference | Identifiers | Additional information |
|---|---|---|---|---|
| Gene (Mus musculus) | Crisp1 | Ensembl | ENSMUSG00000025431 | |
| Gene (Mus musculus) | Crisp3 | Ensembl | ENSMUSG00000025433 | |
| Gene (Mus musculus) | Crisp1 | Ensembl | ENSMUSG00000025431 | |
| Gene (Mus musculus) | Crisp4 | Ensembl | ENSMUSG00000025774 | |
| Strain, strain background (Mus musculus) | C57BL/6J | IBYME Animal Facility, Buenos Aires, Argentina | https://doi.org/10.1096/fj.202001406R | |
| Strain, strain background (Mus musculus) | C57BL/6*DBA | IBYME Animal Facility, Buenos Aires, Argentina | https://doi.org/10.1038/s41598-018-35719-3 | |
| Chemical compound, drug | Equine chorionic gonadotropin | Zoetis, Buenos Aires, Argentina | Novormon | 5 UI |
| Chemical compound, drug | Human chorionic gonadotropin (hCG) | Zoetis, Buenos Aires, Argentina | Ovusyn | 5 UI |
| Chemical compound, drug | BSA | Sigma-Aldrich | A6003 | 3 mg/ml (capacitation medium) 1 mg/ml (KSOM médium) |
| Chemical compound, drug | Xylazine/ketamine | Holliday/Richmond Vet Pharma | 10:100 mg/kg | |
| Chemical compound, drug | Eosin B | Sigma-Chemical company | E-2629 | 0.5% (vol/vol) |
| Chemical compound, drug | Fluo-4 AM | Invitrogen | F14201 | 1 μM |
| Chemical compound, drug | Pluronic(R) F-127 Low UV | Invitrogen | P6867 | 0.02% (p/vol) |
| Chemical compound, drug | Vectashield | Vector | H-1000-10 | |
| Chemical compound, drug | CellROX-Green | Invitrogen | C10444 | 25 μM |
| Chemical compound, drug | Hoechst 33342 | Invitrogen | H1398 | 10 μg/ml |
Additional files
-
Supplementary file 1
Analysis of different parameters in fresh and capacitated cauda epididymal sperm.
- https://cdn.elifesciences.org/articles/97105/elife-97105-supp1-v1.docx
-
MDAR checklist
- https://cdn.elifesciences.org/articles/97105/elife-97105-mdarchecklist1-v1.pdf
Download links
A two-part list of links to download the article, or parts of the article, in various formats.
Downloads (link to download the article as PDF)
Open citations (links to open the citations from this article in various online reference manager services)
Cite this article (links to download the citations from this article in formats compatible with various reference manager tools)
The epididymis contributes to sperm DNA integrity and early embryo development through Cysteine-Rich Secretory Proteins
eLife 13:RP97105.
https://doi.org/10.7554/eLife.97105.3


