MicroRNA-26b protects against MASH development in mice and can be efficiently targeted with lipid nanoparticles
- Institute for Molecular Cardiovascular Research (IMCAR), RWTH Aachen University, Germany
- Aachen-Maastricht Institute for CardioRenal Disease (AMICARE), RWTH Aachen University, Germany
- Department of Pathology, Cardiovascular Research Institute Maastricht (CARIM), Maastricht University, Netherlands
- Institute for Cardiovascular Prevention (IPEK), Ludwig-Maximilians-Universität München, Germany
- Department of Rheumatology and Shanghai Institute of Rheumatology, Renji, China
- Department of Medicine III, University Hospital Aachen, Germany
- Department of Pharmaceutical Technology and Biopharmacy, Groningen Research Institute of Pharmacy, University of Groningen, Netherlands
- Department of Medical Biochemistry, Amsterdam Cardiovascular Sciences: Atherosclerosis & Ischemic Syndrome; Amsterdam Infection and Immunity: Inflammatory diseases; Amsterdam UMC location University of Amsterdam, Netherlands
- Department of Surgery, NUTRIM, School of Nutrition and Translational Research in Metabolism, Maastricht University, Netherlands
- Department of Laboratory Medicine, Medical University Vienna, Austria
- Department of Gastroenterology, Hepatology and Transplant Medicine, Medical Faculty, University of Duisburg, Germany
- Department of Medicine II, Saarland University Medical Center, Saarland University, Germany
- DZHK (German Center for Cardiovascular Research), Partner Site Munich Heart Alliance, Germany
- Department of Biochemistry, Cardiovascular Research Institute Maastricht (CARIM), Maastricht University, Netherlands
- Munich Cluster for Systems Neurology (SyNergy), Germany
- Cluster for Nucleic Acid Therapeutics Munich (CNATM), Germany
- Department of Genetics and Cell Biology, School of Nutrition and Translational Research in Metabolism (NUTRIM), University of Maastricht, Netherlands
- Swiss Cardiovascular Center, Division of Angiology, Inselspital, Bern University Hospital, University of Bern, Switzerland
- DWI – Leibniz Institute for Interactive Materials, Germany
- Institute of Technical and Macromolecular Chemistry, RWTH Aachen University, Germany
- Department of Internal Medicine I - Cardiology, University Hospital, RWTH Aachen University, Germany
Figures
Figure 1
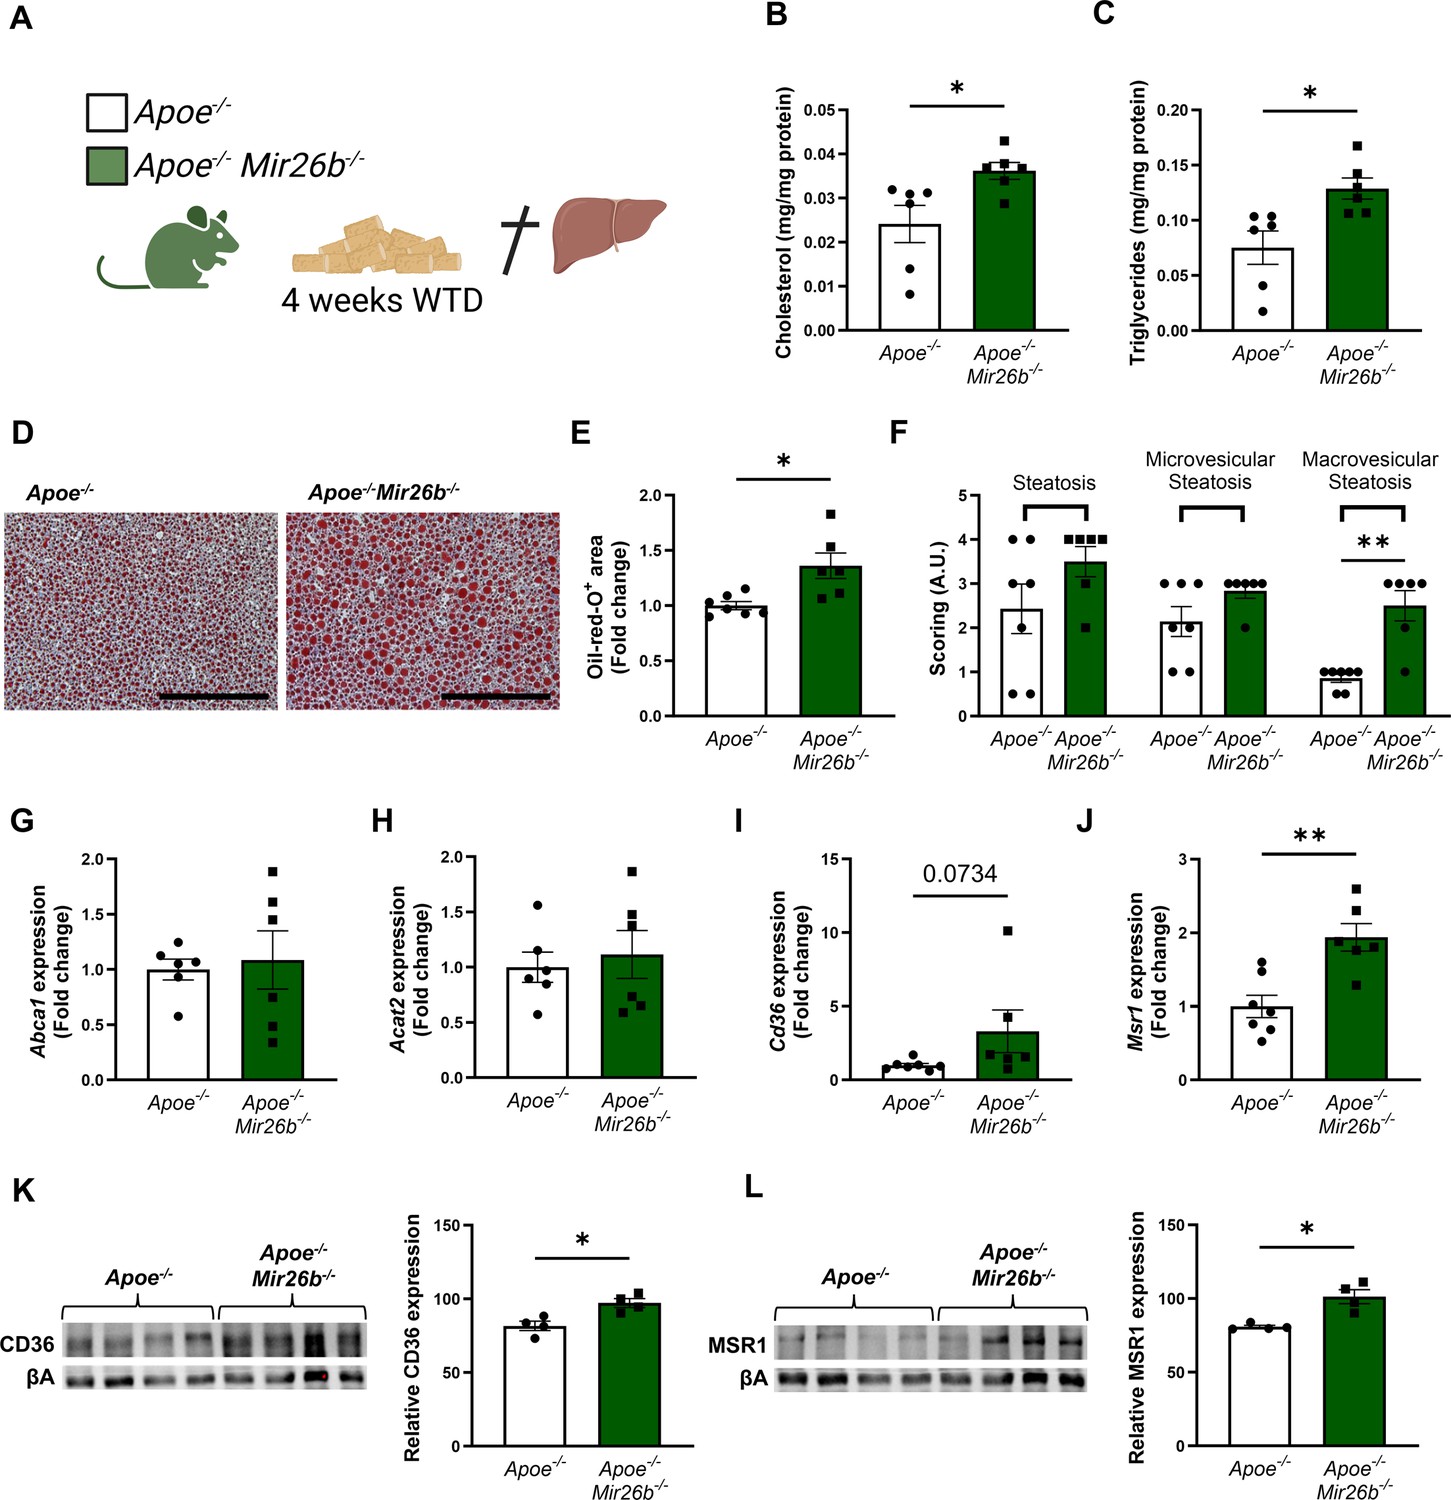
Hepatic lipid levels and the expression of lipid uptake receptors are increased by a whole-body knockout of Mir26b in mice.
(A) Schematic overview of the experimental approach. This panel was created using BioRender.com. (B–C) Hepatic total cholesterol (B) and triglyceride (C) measurements normalized against total protein. (D) Representative pictures of Oil-red-O staining of liver sections. Scale bar = 200 µm. (E) Quantification of the Oil-red-O staining. (F) Pathological scoring of the Oil-red-O staining. (G–J) Gene expression analysis of (G) Abca1, (H) Acat2, (I) Cd36, and (J) Msr1. (K–L) Western-blot analysis and quantification of (K) CD36 and (L) MSR1. Fold change is corrected for sex. *p<0.05; **p<0.01. n=4–7 animals per group.
-
Figure 1—source data 1
Raw data from Figure 1.
- https://cdn.elifesciences.org/articles/97165/elife-97165-fig1-data1-v1.xlsx
Figure 2
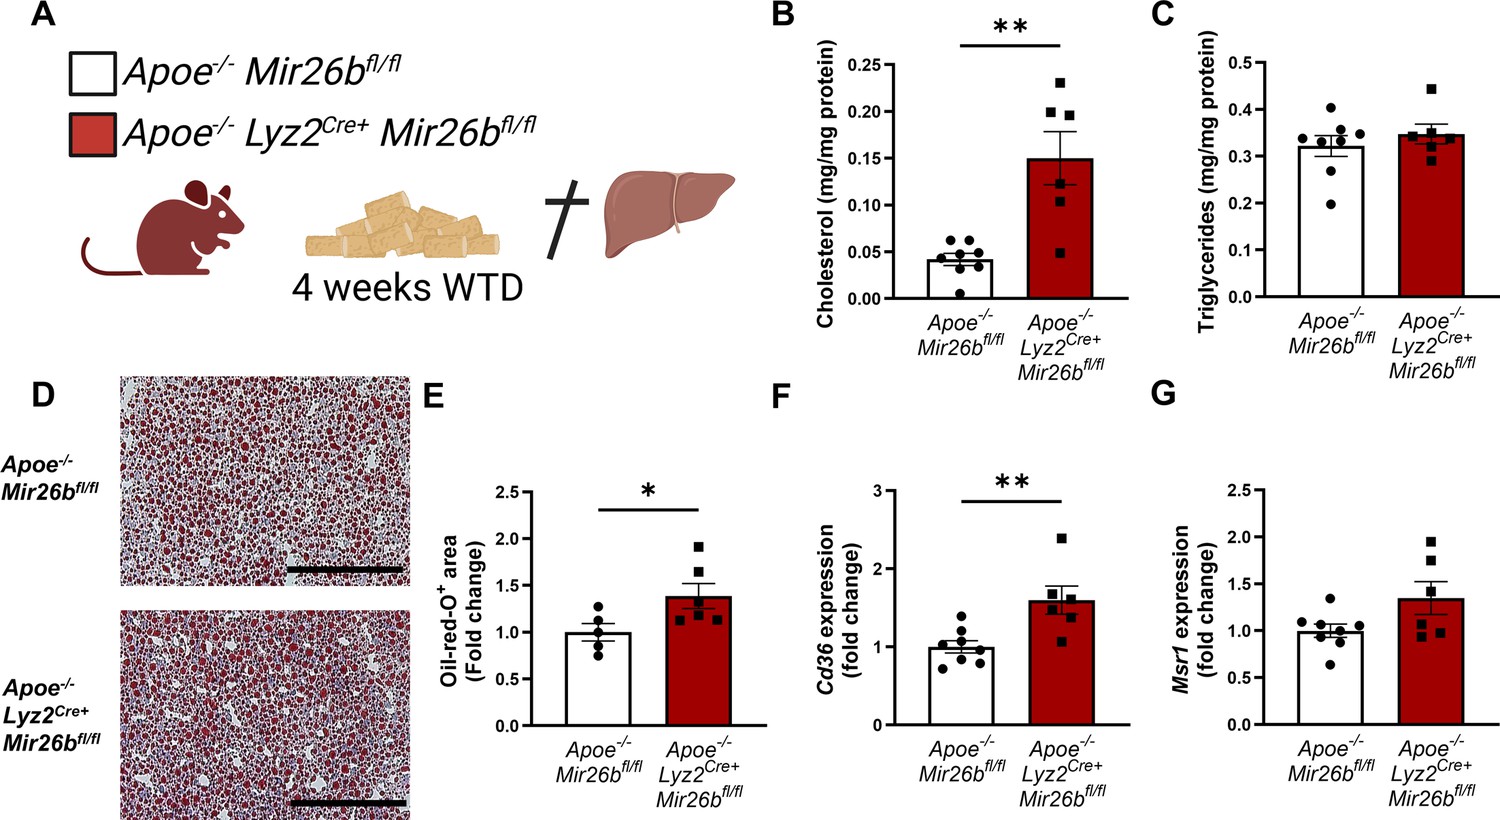
Hepatic lipid levels and the expression of lipid uptake receptors are increased by a myeloid-specific Mir26b deficiency in mice.
(A) Schematic overview of the experimental approach. This panel was created using BioRender.com. (B–C) Hepatic total cholesterol (B) and triglyceride (C) measurements normalized against total protein. (D) Representative pictures of Oil-red-O staining of liver sections. Scale bar = 200 µm. (E) Quantification of the Oil-red-O staining. (F–G) Gene expression analysis of (F) Cd36 and (G) Msr1. Fold change is corrected for sex. *p<0.05; **p<0.01. n=6–8 animals per group.
-
Figure 2—source data 1
Raw data from Figure 2.
- https://cdn.elifesciences.org/articles/97165/elife-97165-fig2-data1-v1.xlsx
Figure 3

Livers of Apoe-/-Mir26b-/- mice show elevated pro-inflammatory cytokine levels and an increased number of Mac-1-positive cells.
(A–D) Cytokine levels of (A) IL-6, (B) TNF, (C) CCL2, and (D) CXCL1 were measured in liver protein lysates. (E–H) Representative images and quantification of immunofluorescent stainings for (E) infiltrating macrophages and neutrophils (Mac-1), (F) neutrophils (Ly6G), (G) resident monocytes/macrophages (CD68), and (H) T-cells (CD3). Scale bar = 50 μm. *p<0.05; **p<0.01. n=6–7 animals per group.
-
Figure 3—source data 1
Raw data from Figure 3.
- https://cdn.elifesciences.org/articles/97165/elife-97165-fig3-data1-v1.xlsx
Figure 4

Livers of Apoe-/-Mir26b-/- mice show increased hepatic fibrosis.
(A) Representative pictures of Sirius-red staining of liver sections. Scale bar = 100 µm. (B) Quantification of the Sirius-red staining. (C–E) Gene expression of (C) Tgfb, (D) Acta2, and (E) Mmp13. Fold change is corrected for sex. *p<0.05. n=6–7 animals per group.
-
Figure 4—source data 1
Raw data from Figure 4.
- https://cdn.elifesciences.org/articles/97165/elife-97165-fig4-data1-v1.xlsx
Figure 5
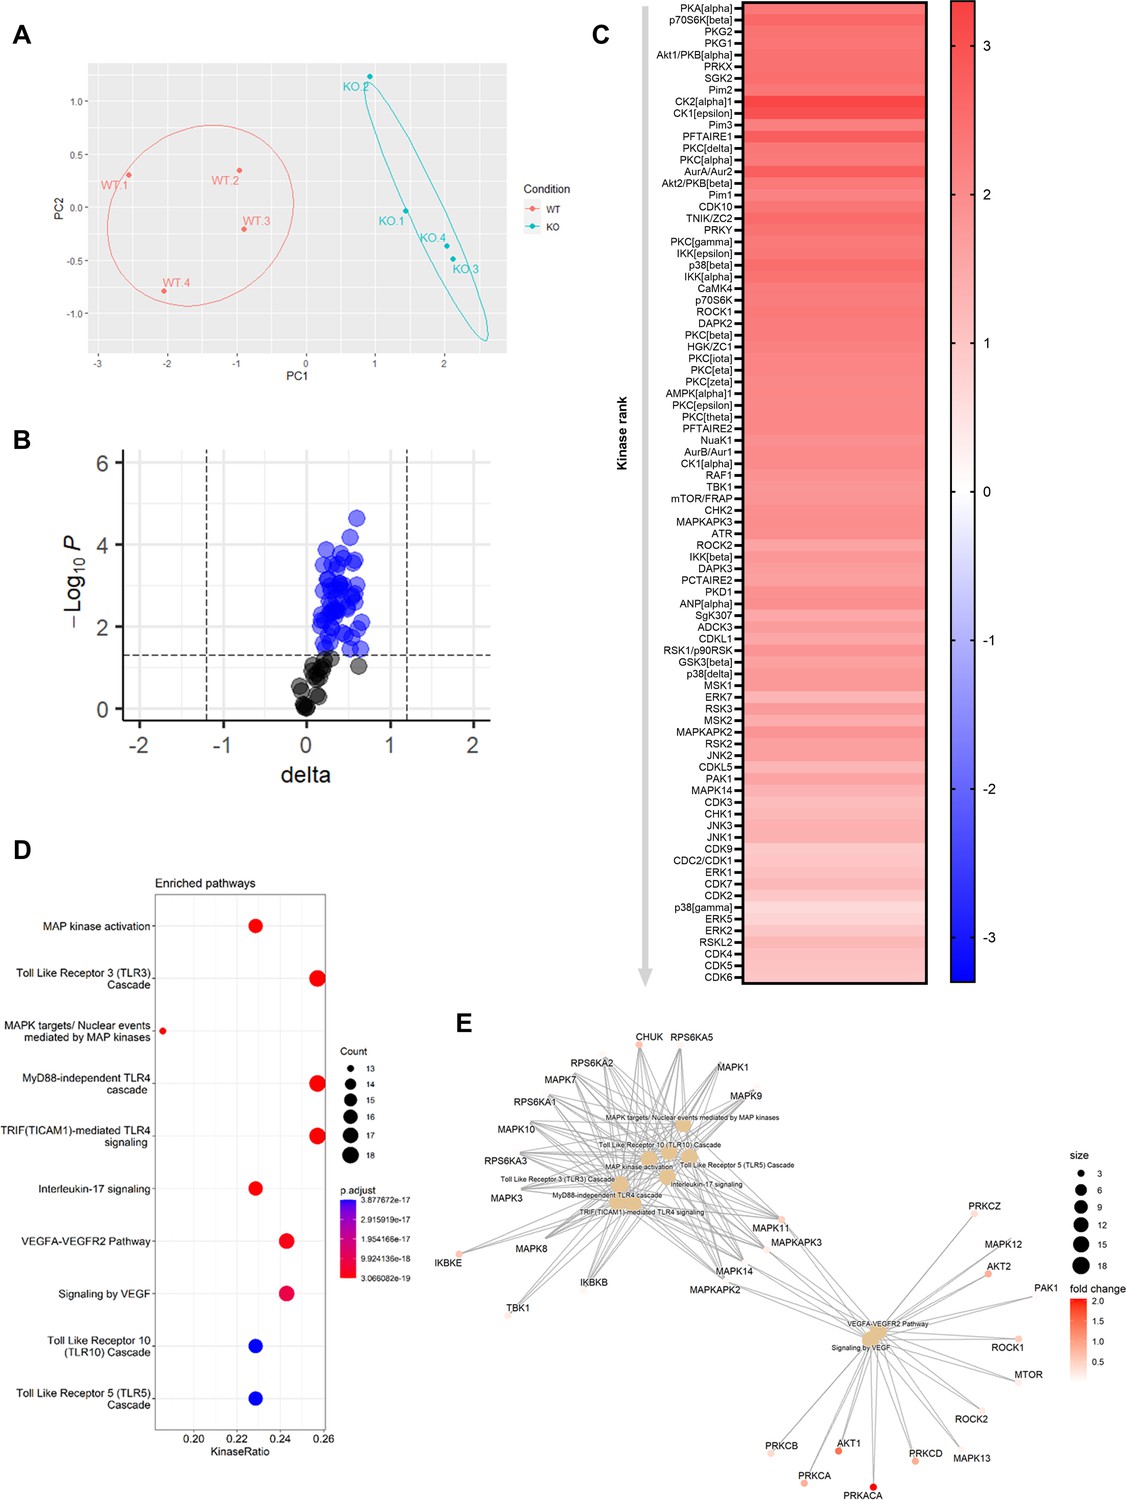
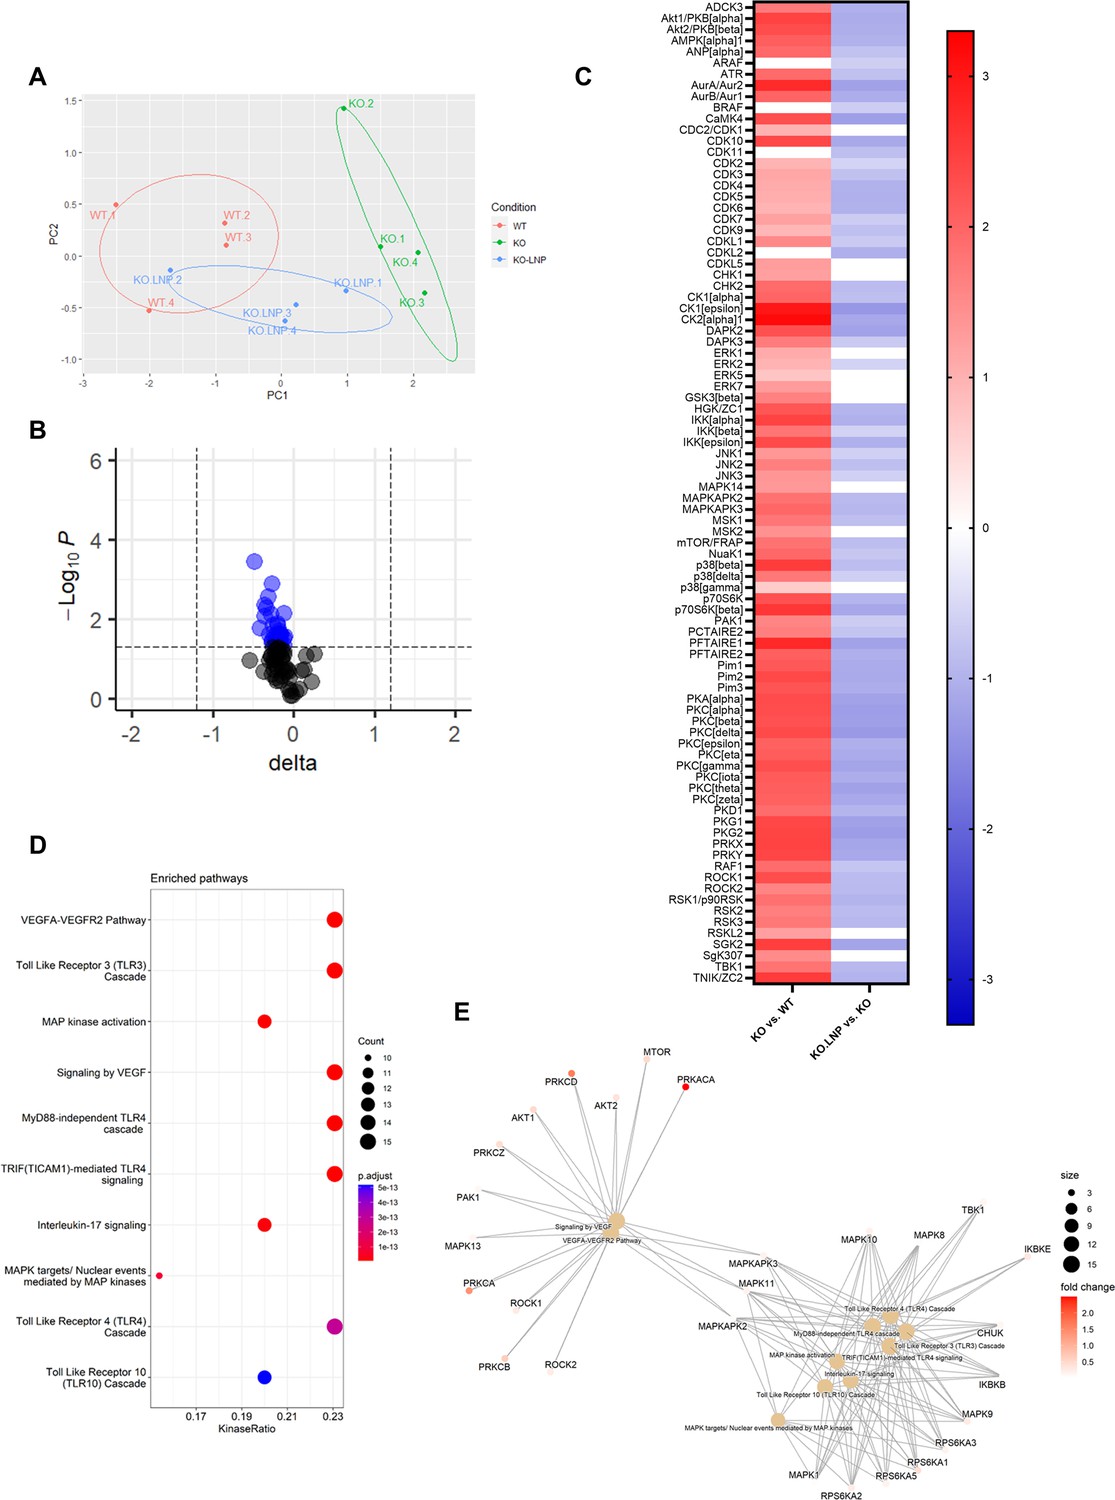
Knockout of Mir26b results in an increased hepatic inflammatory kinase activity.
(A) Principal component analysis (PCA) of phosphorylated peptides from STK array (n=4) of liver lysates from Apoe-/-Mir26b-/- mice (KO) or Apoe-/- (WT) mice. (B) Volcano plot visualizing fold change and p-value for phosphorylated peptides from STK array. Blue dots represent significantly altered phosphopeptides. (C) Heatmap of significantly changed kinases are ranked based on Median Final Score (cut-off value of 1.2), STK array performed on liver lysates from Apoe-/-Mir26b-/- mice (KO) compared to Apoe-/- (WT) mice. Color corresponds to the Median Kinase Statistic, which represents effect size and directionality (red = increased activity in KO vs. WT mice). (D) Enriched pathways based on STK array. (E) Network diagram of the pathway enrichment analysis.
-
Figure 5—source data 1
Raw data from Figure 5.
- https://cdn.elifesciences.org/articles/97165/elife-97165-fig5-data1-v1.xlsx
Figure 6 with 1 supplement
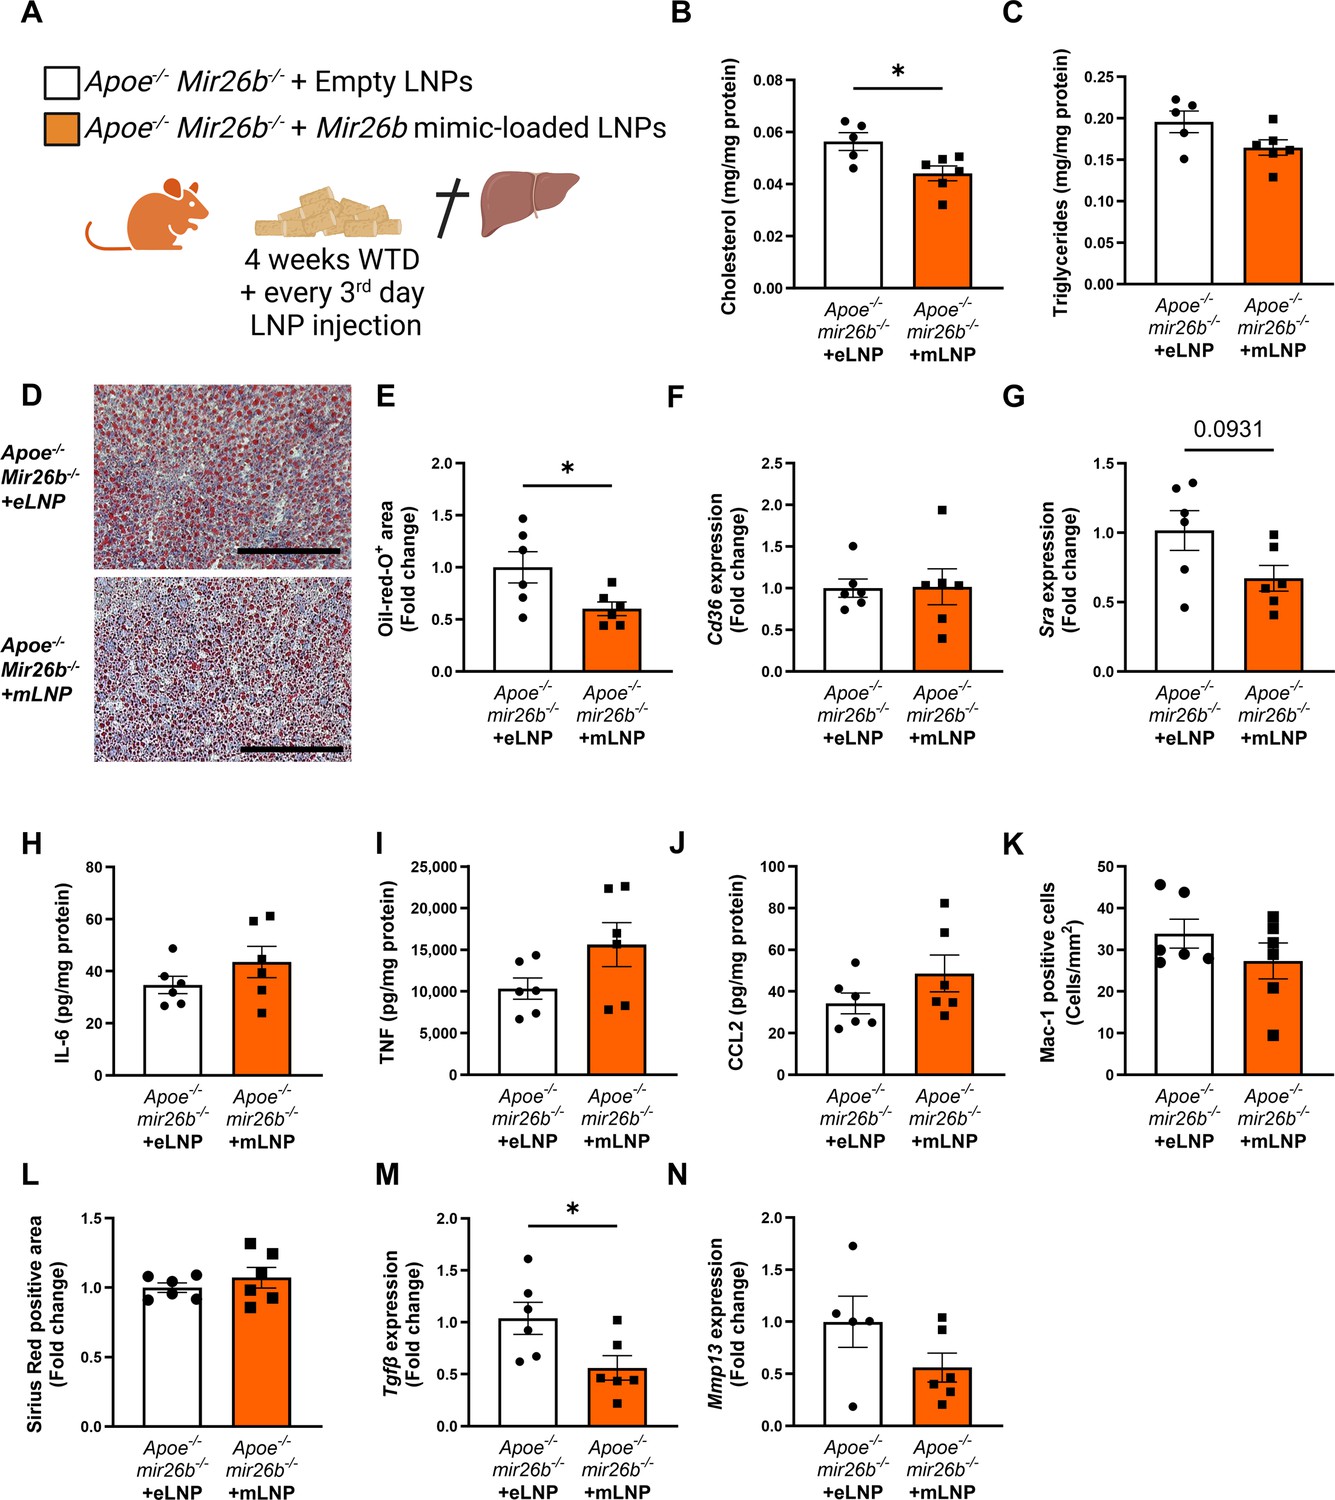
Apoe-/-Mir26b-/- mice injected with LNPs containing Mir26b mimics show decreased hepatic lipid levels compared to vehicle control injected mice.
(A) Schematic overview of the experimental approach in which mice on 4 week WTD were simultaneously injected every 3 days with either empty LNPs as vehicle control (eLNP) or LNPs containing Mir26b mimics (mLNP). This panel was created using BioRender.com. (B–C) Hepatic total cholesterol (B) and triglyceride (C) measurements normalized against total protein. (D) Representative pictures of Oil-red-O staining of liver sections. Scale bar = 200 µm. (E) Quantification of the Oil-red-O staining. (F–G) Gene expression analysis of (F) Cd36 and (G) Msr1. (H–J) Cytokine levels of (H) IL-6, (I) TNF, and (J) CCL2 were measured in liver protein lysates. (K) Quantification of immunofluorescent staining for infiltrating macrophages and neutrophils (Mac-1). (L) Quantification of the Sirius-red staining. (M–N) Gene expression of (M) Tgfb, and (N) Mmp13. Fold change is corrected for sex. *p<0.05. n=6 animals per group.
-
Figure 6—source data 1
Raw data from Figure 6.
- https://cdn.elifesciences.org/articles/97165/elife-97165-fig6-data1-v1.tif
Figure 6—figure supplement 1
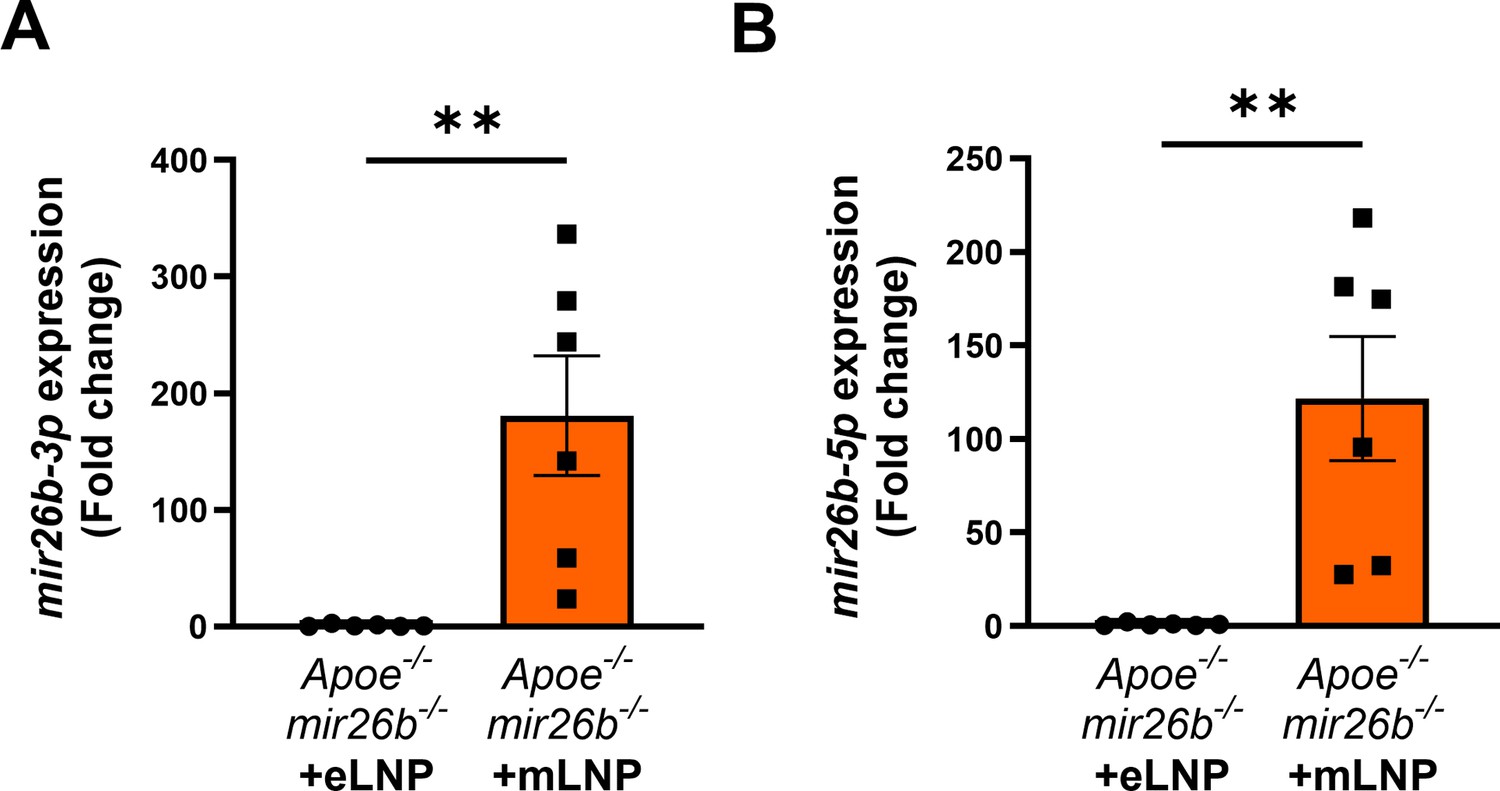
mLNP treatment overexpresses Mir26b-3p and –5 p in murine livers.
(A–B) Gene expression analysis of (A) Mir26b-3p and (B) Mir26b-3p in livers from mice after 4-week WTD with simultaneous injection with either empty LNPs as vehicle control (eLNP) or LNPs containing Mir26b mimics (mLNP) every 3 days. **p<0.01. n=6 animals per group.
-
Figure 6—figure supplement 1—source data 1
Source data contains the raw data from Figure 6—figure supplement 1.
- https://cdn.elifesciences.org/articles/97165/elife-97165-fig6-figsupp1-data1-v1.xlsx
Figure 7 with 1 supplement
mLNP treatment of Mir26b knockout mice results in a decreased hepatic inflammatory kinase activity.
(A) Principal component analysis (PCA) of phosphorylated peptides from STK array (n=4) of liver lysates from mLNP treated Apoe-/-Mir26b-/- mice (KO.LNP), Apoe-/-Mir26b-/- mice (KO) or Apoe-/- mice (WT) mice. (B) Volcano plot visualizing fold change and p value for phosphorylated peptides from STK array. Blue dots represent significantly altered phosphopeptides. (C) The heatmap of significantly changed kinases is ranked based on the Median Final Score (cut-off value of 1.2). Color is corresponding to Median Kinase Statistic, which represents effect size and directionality (red = increased activity in KO vs. WT mice; blue = decreased activity in KO.LNP vs. KO mice; average of n=4 is shown). (D) Enriched pathways based on STK array. (E) Network diagram of the pathway enrichment analysis.
-
Figure 7—source data 1
Raw data from Figure 7.
- https://cdn.elifesciences.org/articles/97165/elife-97165-fig7-data1-v1.xlsx
Figure 7—figure supplement 1

mLNP treatment rescues the inflammatory kinase activity effect of Mir26b knockout.
(A) Heatmap demonstrating the level of peptide phosphorylation (numbers behind peptides indicate exact amino-acids that are spotted on the STK array). Red color reflects a high degree of phosphorylation, while blue color represents a low degree of phosphorylation (average of n=4 is shown). (B) Principal component analysis (PCA) of phosphorylated peptides from STK array (n=4) of liver lysates from mLNP-treated Apoe-/-Mir26b-/- mice (KO.LNP) or Apoe-/-Mir26b-/- mice (KO) mice. (C) The heatmap of significantly changed kinases is ranked based on Median Final Score (cut-off value of 1.2), STK array performed on liver lysates from mLNP treated Apoe-/-Mir26b-/- mice (KO.LNP) compared to Apoe-/-Mir26b-/- mice (KO) mice. Color corresponds to the Median Kinase Statistic, which represents effect size and directionality (blue = decreased activity in KO.LNP vs. KO mice).
-
Figure 7—figure supplement 1—source data 1
Raw data from Figure 7—figure supplement 1.
- https://cdn.elifesciences.org/articles/97165/elife-97165-fig7-figsupp1-data1-v1.xlsx
Figure 8
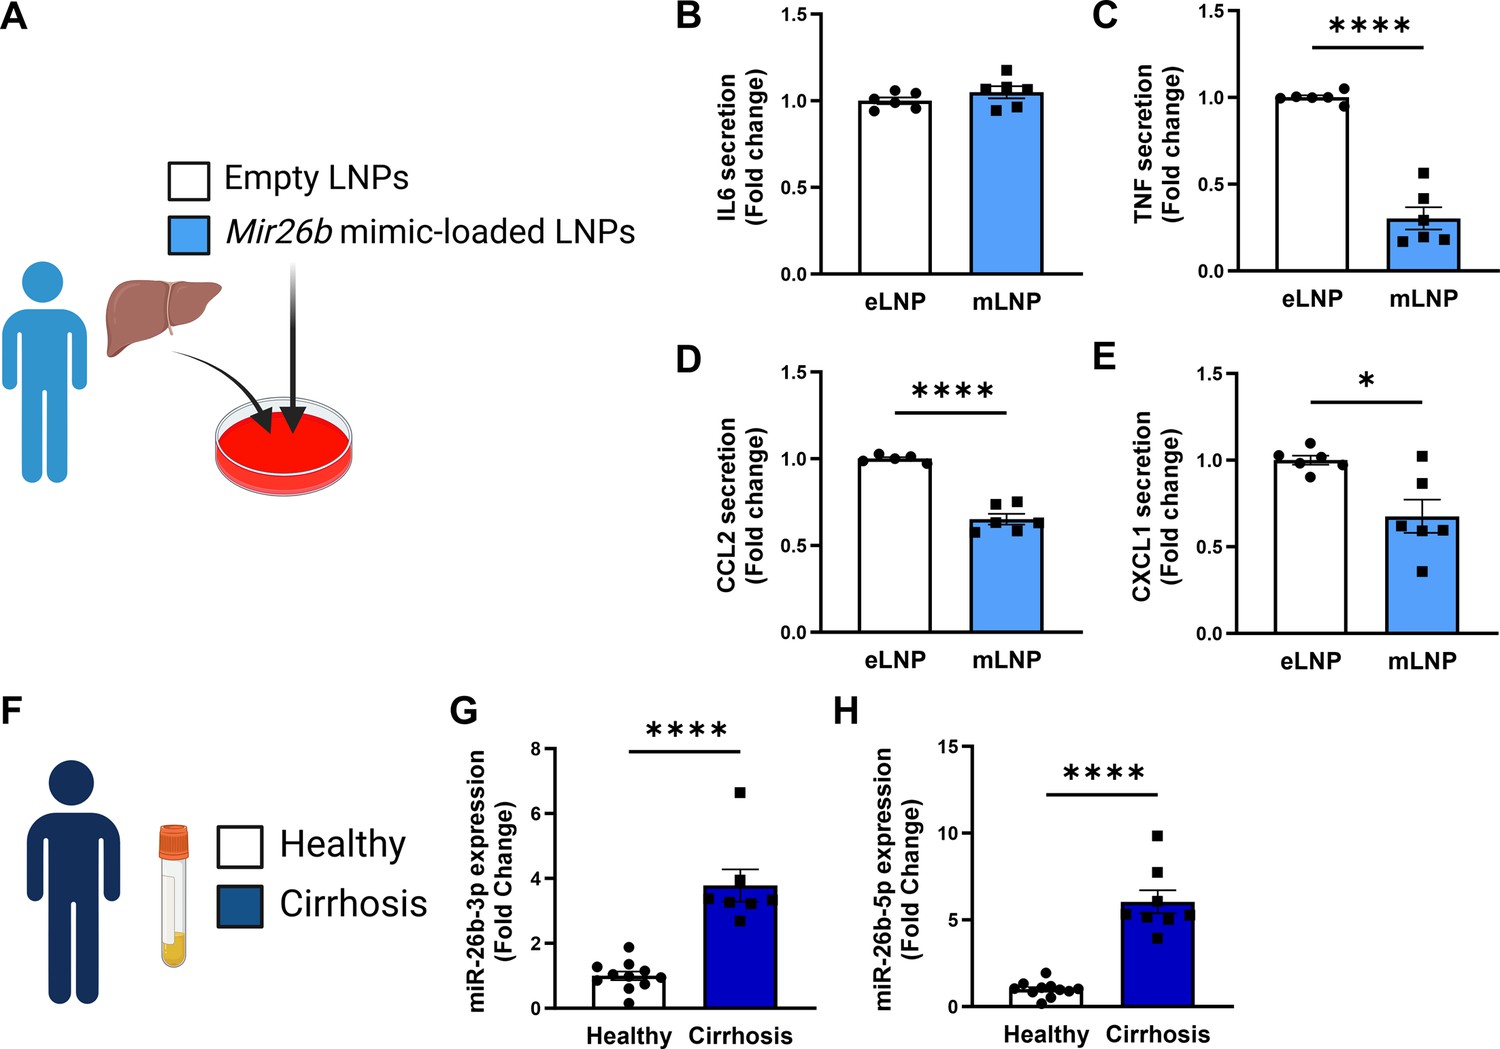
Mir26b-loaded LNPs have anti-inflammatory effects on human liver slices and Mir26b plasma levels are significantly increased in patients with liver cirrhosis.
(A) Schematic overview of the experimental approach. (B–E) Cytokine levels of (B) IL-6, (C) TNF, (D) CCL2, and (E) CXCL1 measured in the supernatant of human precision-cut liver slices after 24 hr (for IL-6/TNF) or 48 hr (for CCL2/CXCL1) incubation with mLNPs or eLNPs (3 individual donors, cultured in duplicates). (F–G) Plasma was isolated from patients with liver cirrhosis or healthy volunteers (F) and Mir26b-3p (G) and Mir26b-5p (H) plasma levels were measured. *p<0.05; ****p<0.0001. n=8–11 patients per group. Panels A and F were created using BioRender.com.
-
Figure 8—source data 1
Source data contains the raw data from Figure 8.
- https://cdn.elifesciences.org/articles/97165/elife-97165-fig8-data1-v1.xlsx
Tables
Key resources table
| Reagent type (species) or resource | Designation | Source or reference | Identifiers | Additional information |
|---|---|---|---|---|
| Strain, strain background (Mus musculus) | Apoe-/-Mir26b-/- | van der Vorst et al., 2021 | - | - |
| Strain, strain background (M. musculus) | Apoe-/- | Jackson | Strain #:002052 | - |
| Strain, strain background (M. musculus) | Apoe-/-Mir26bfl/fl | Generated in house | - | - |
| Strain, strain background (M. musculus) | Apoe-/-Mir26bfl/fl Lyz2Cre+ | Generated in house | - | - |
| Other | Western-type diet | Sniff | TD88137 | Mouse diet |
Table 1
Primer sequences for genes measured with qPCR.
| Sequence in 5'–3'- direction | ||
|---|---|---|
| Primer | Forward | Reverse |
| Abca1 | CCCAGAGCAAAAAGCGACTC | GGTCATCATCACTTTGGTCCTTG |
| Acat2 | ACCAATTCCAGCCATAAAGCA | GGTTTAATCCAAGTTCTTTAGCTATTGC |
| Acta2 | ACGAACGCTTCCGCTGC | GATGCCCGCTGACTCCAT |
| Cd36 | GCCAAGCTATTGCGACATGA | AAAAGAATCTCAATGTCCGAGACTTT |
| Cyclophilin | TTCCTCCTTTCACAGAATTATTCCA | CCGCCAGTGCCATTATGG |
| Mmp13 | ACAAAGATTATCCCCGCCTCATA | CACAATGCGATTACTCCAGATACTG |
| Msr1 | CATACAGAAACACTGCATGTCAGAGT | TTCTGCTGATACTTTGTACACACGTT |
| Tgfb | GCCCTTCCTGCTCCTCATG | CCGCACACAGCAGTTCTTCTC |
Additional files
Download links
A two-part list of links to download the article, or parts of the article, in various formats.
Downloads (link to download the article as PDF)
Open citations (links to open the citations from this article in various online reference manager services)
Cite this article (links to download the citations from this article in formats compatible with various reference manager tools)
MicroRNA-26b protects against MASH development in mice and can be efficiently targeted with lipid nanoparticles
eLife 13:RP97165.
https://doi.org/10.7554/eLife.97165.3


