Receptor tyrosine kinases CAD96CA and FGFR1 function as the cell membrane receptors of insect juvenile hormone
- Shandong Provincial Key Laboratory of Animal Cells and Developmental Biology, School of Life Sciences, Shandong University, China
Figures
Figure 1 with 4 supplements
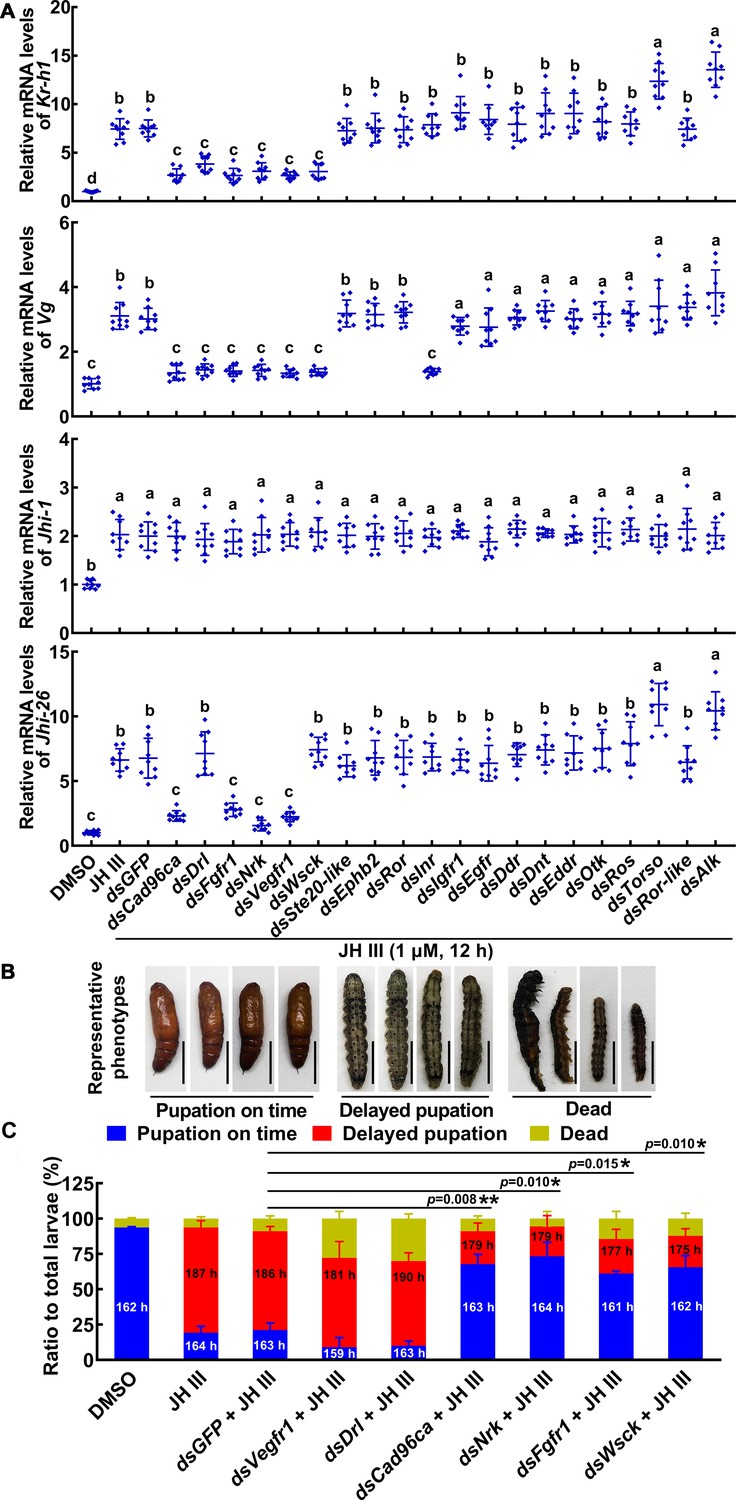
RTKs were screened to determine their involvement in the JH signal pathway in HaEpi cells and larvae.
(A) The roles of RTKs in JH III-induced Kr-h1, Vg, Jhi-1, and Jhi-26 expression were determined by RNAi of Rtk genes (1 μg/mL dsRNA, 48 hr, 1 μM JH III for 12 hr). DMSO as solvent control. The relative mRNA levels were calculated via the 2–ΔΔCT method and the bars indicate the mean ± SD. n=3. Multiple sets of data were compared by ANOVA. The different lowercase letters show significant differences. (B) The examples of phenotype after Vegfr1, Drl, Cad96ca, Nrk, Fgfr1, and Wsck knockdown in larvae. Scale = 1 cm. (C) Phenotype percentage and pupation time after Vegfr1, Drl, Cad96ca, Nrk, Fgfr1, and Wsck knockdown in larvae. The time was recorded from the bursting of the head shell of the 5th instar to pupal development. Images were collected after more than 80% of the larvae had pupated in the DMSO control group. Two-group significant differences were calculated using Student’s t test (*p<0.05, **p<0.01 indicate the significant difference between the percentages of the delayed pupation in dsGFP +JH III control group and gene knockdown) based on three replicates, n=30 × 3 larvae.
-
Figure 1—source data 1
Statistical data for Figure 1A and C.
- https://cdn.elifesciences.org/articles/97189/elife-97189-fig1-data1-v1.xlsx
Figure 1—figure supplement 1
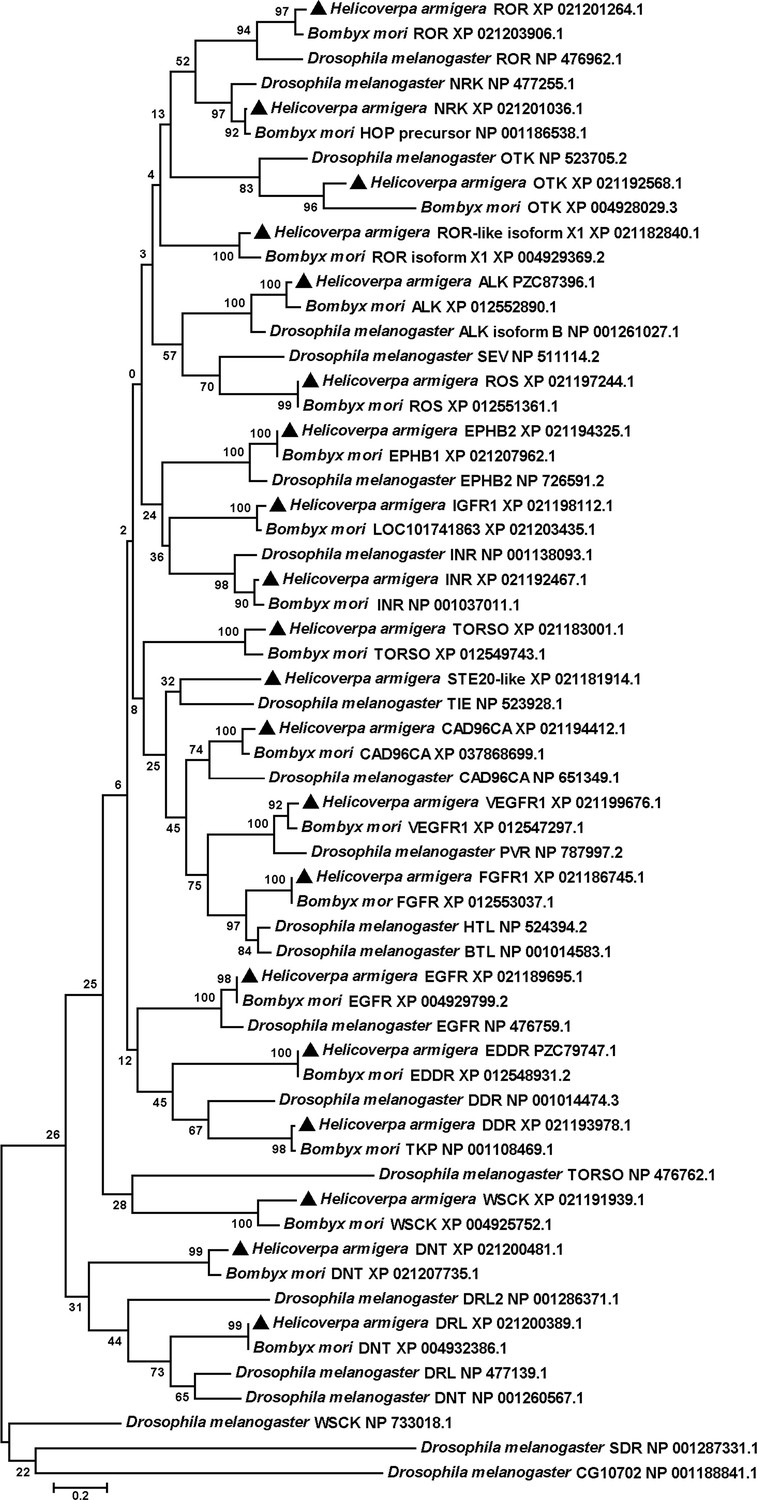
Phylogenetic tree analysis to identify RTKs of H. armigera.
The phylogenetic tree was analyzed with MEGA 5.0, Corresponding amino acid sequences in RTKs of H. armigera, B. mori, and D. melanogaster obtained from NCBI. The tree shows clustering and the clades of various RTK in H. armigera, B. mori, and D. melanogaster. Black triangles represent RTKs in H. armigera. NRK was renamed based on the phylogenetic tree. The other RTKs were named based on the H. armigera genome.
Figure 1—figure supplement 2
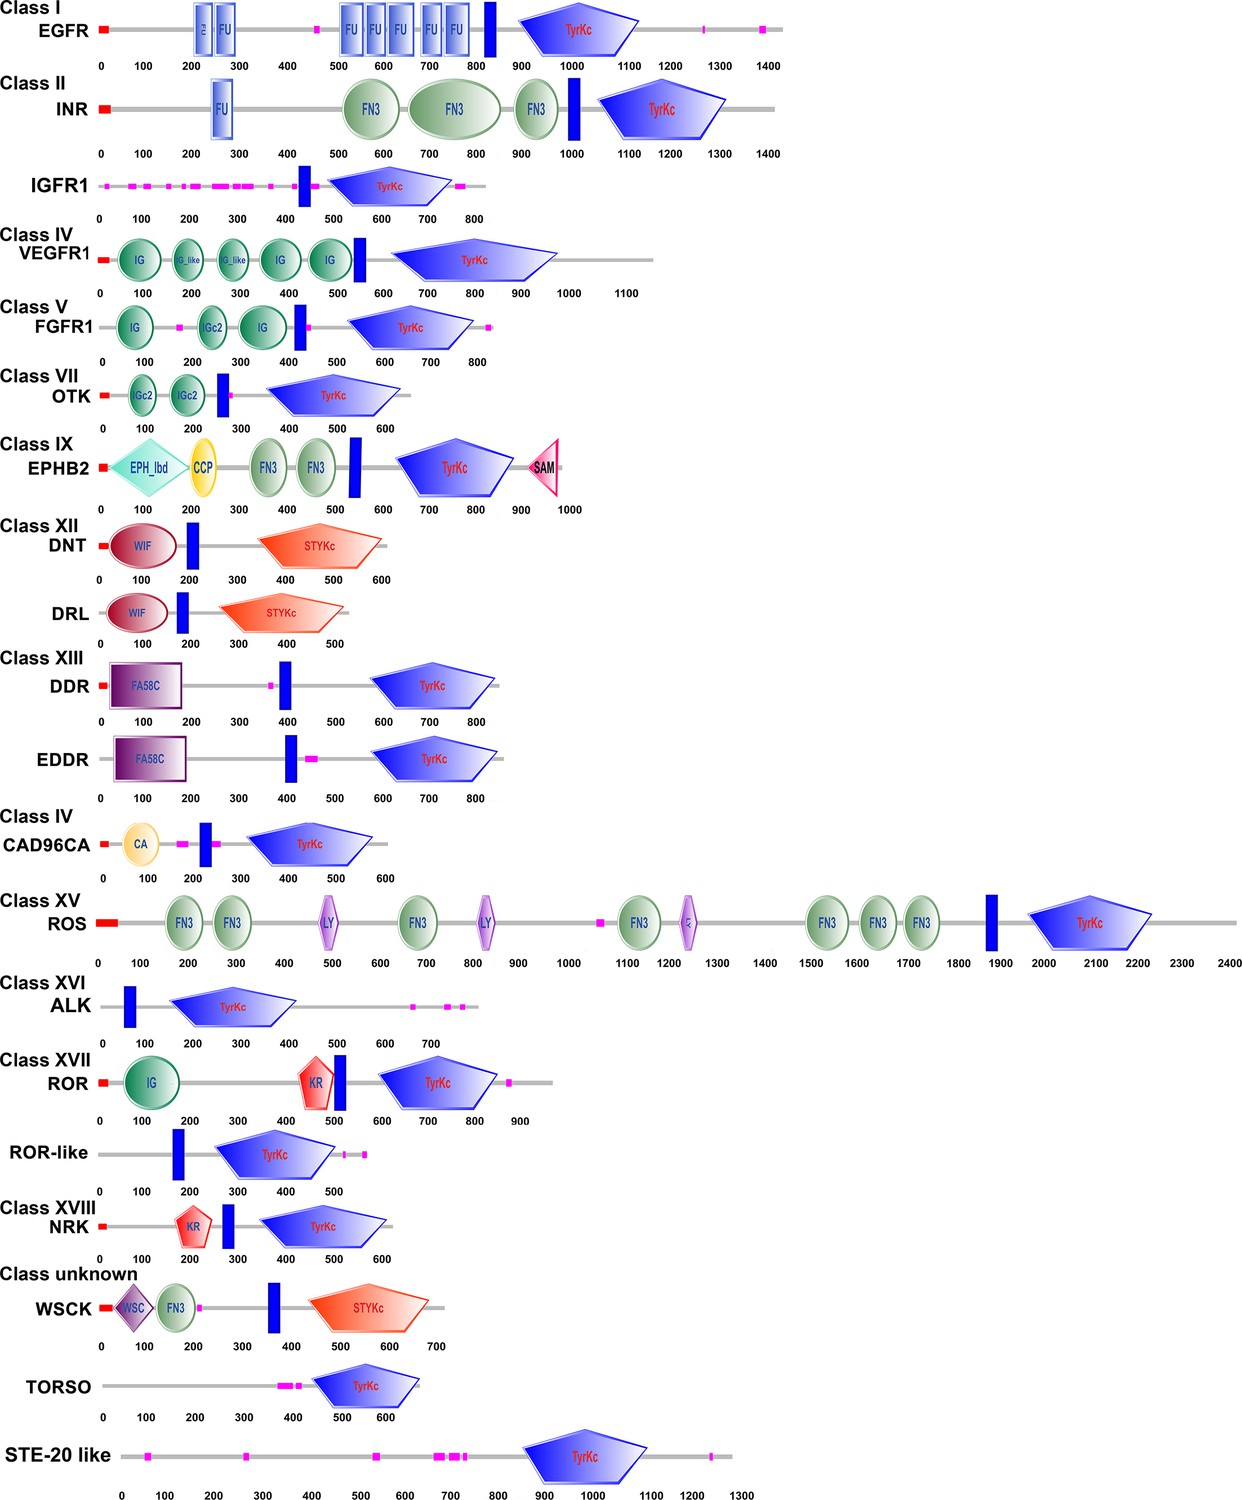
Structural characteristics of the RTK domains.
The SMART tool was used to analyze the RTKs of H. armigera.
Figure 1—figure supplement 3
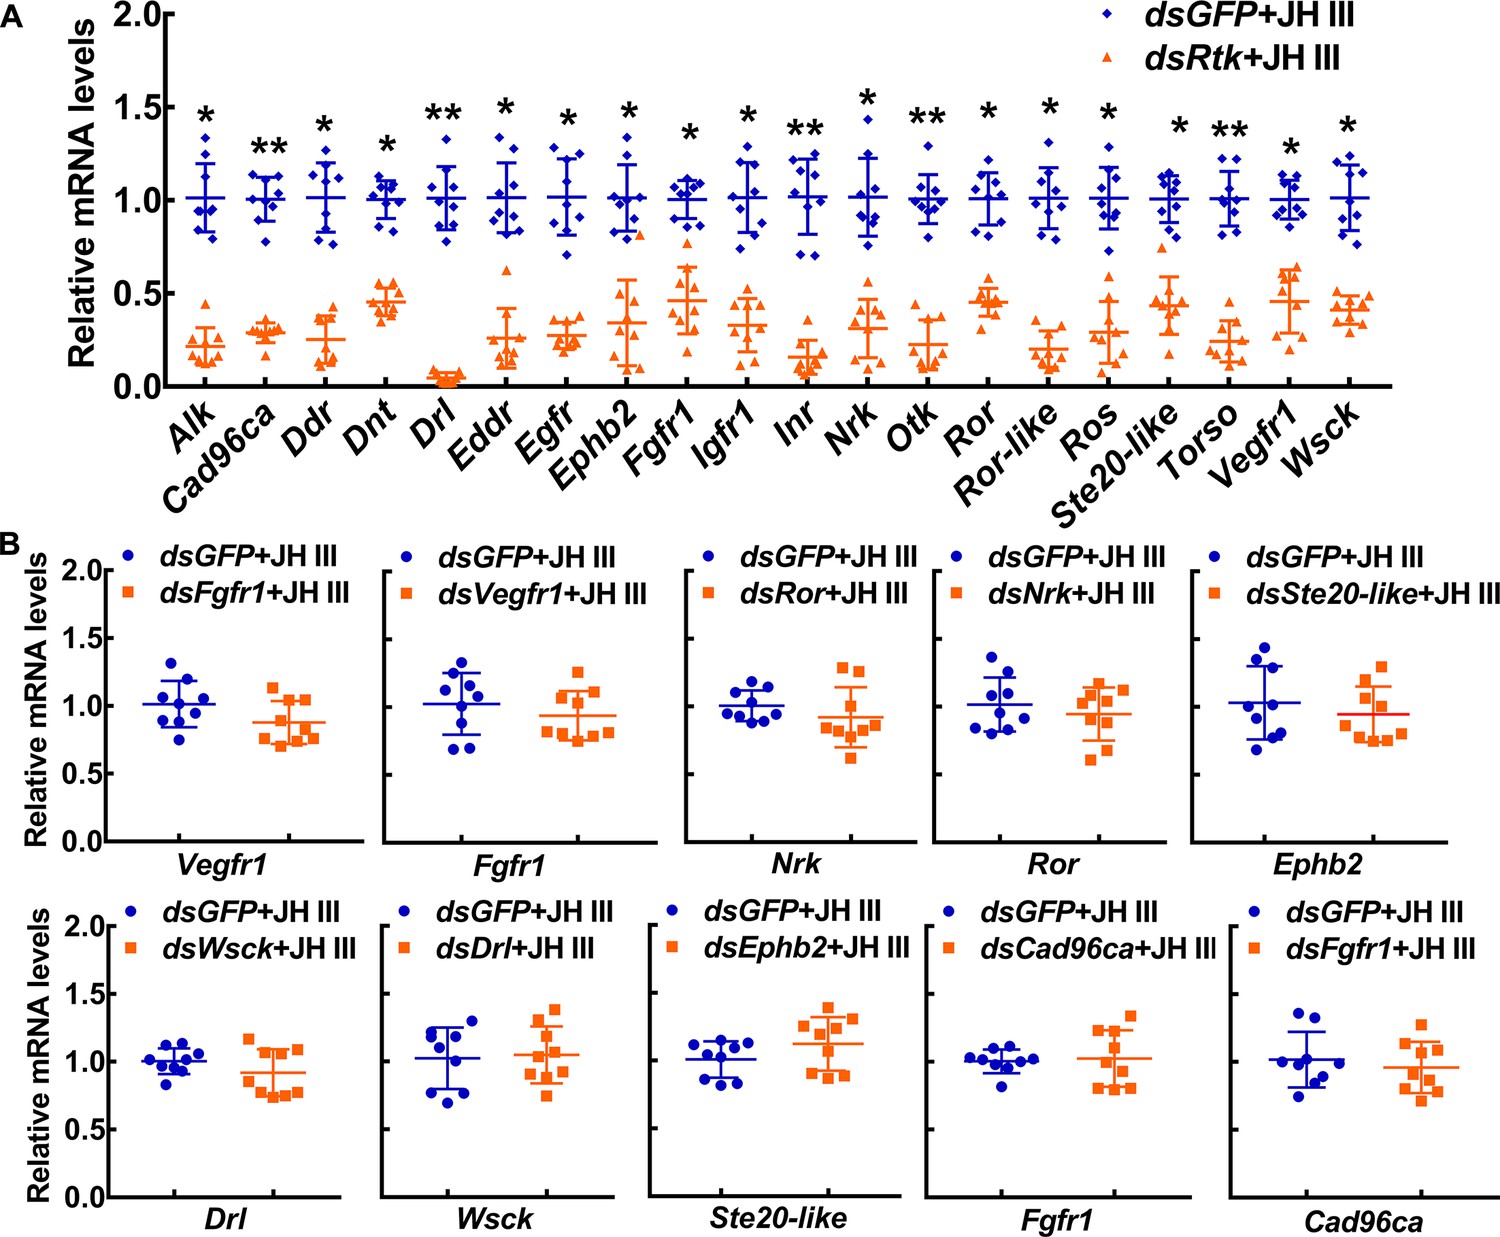
The interference efficiency of dsRNA and off‒target detection.
(A) The interference efficiency of dsRNA in HaEpi cells. (B) The qRT‒PCR was performed to analyze the off‒target genes. All the relative mRNA levels were calculated via the 2–ΔΔCT method, and the bars indicate the mean ± SD according to three biological replicates and three technical replicates. Asterisks manifest significant differences by Student’s t test (*p<0.05; **p<0.01).
-
Figure 1—figure supplement 3—source data 1
Statistical data for Figure 1—figure supplement 3.
- https://cdn.elifesciences.org/articles/97189/elife-97189-fig1-figsupp3-data1-v1.xlsx
Figure 1—figure supplement 4
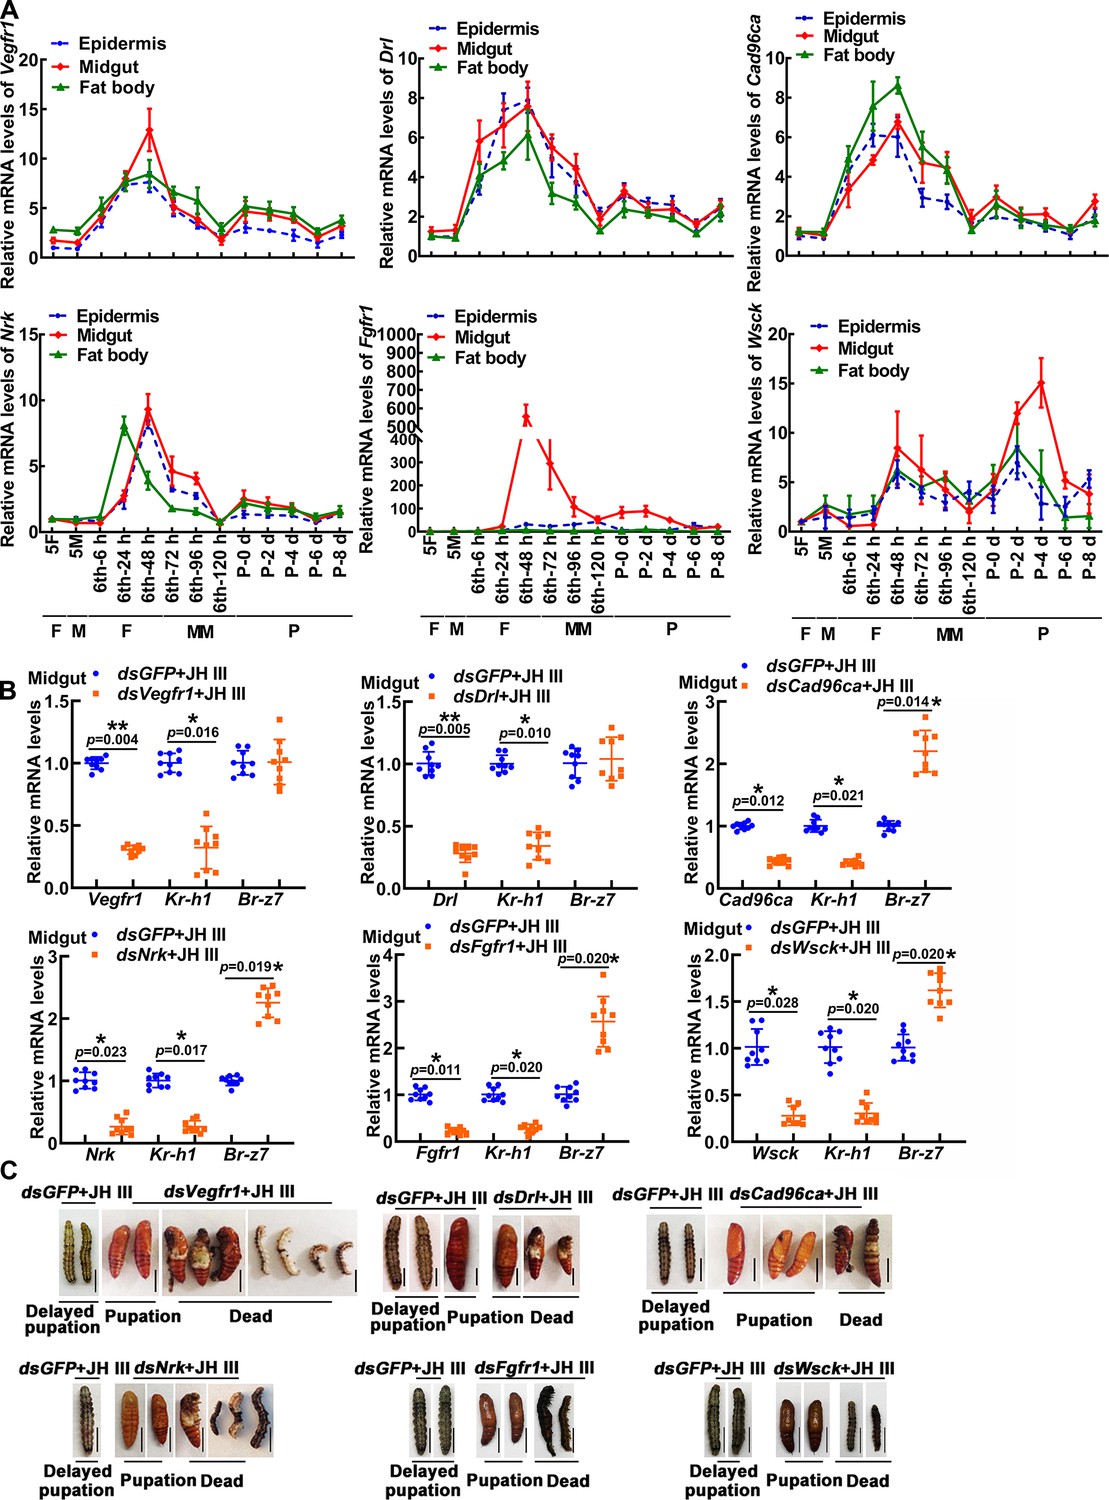
Expression profiles, interference efficiency and phenotype of 6 Rtks in larvae.
(A) The expression profiles of Vegfr1, Drl, Cad96ca, Nrk, Fgfr1, and Wsck during development. 5 F: fifth instar feeding larvae; 5 M: fifth instar molting larvae; 6th-6 h to 6th-120 h: sixth instar at 6 h to sixth instar 120 h larvae; P0 d to P8 d: pupal stage at 0 day to pupal stage at 8 day F: feeding stage; M: molting stage; MM: metamorphic molting stage; P: pupae. (B) qRT‒PCR showed the interference efficiency of Vegfr1, Drl, Cad96ca, Nrk, Fgfr1, and Wsck, and the mRNA level of Kr-h1 and Br-z7. The relative mRNA levels were calculated via the 2–ΔΔCT method, and the bars indicate the mean ± SD. Asterisks manifest significant differences by Student’s t test (*p<0.05; **p<0.01) based on three biological replicates, n=3. (C) The phenotype after Vegfr1, Drl, Cad96ca, Nrk, Fgfr1, and Wsck knockdown. Scale bars: 1 cm.
-
Figure 1—figure supplement 4—source data 1
Statistical data for Figure 1—figure supplement 4A and B.
- https://cdn.elifesciences.org/articles/97189/elife-97189-fig1-figsupp4-data1-v1.xlsx
Figure 2
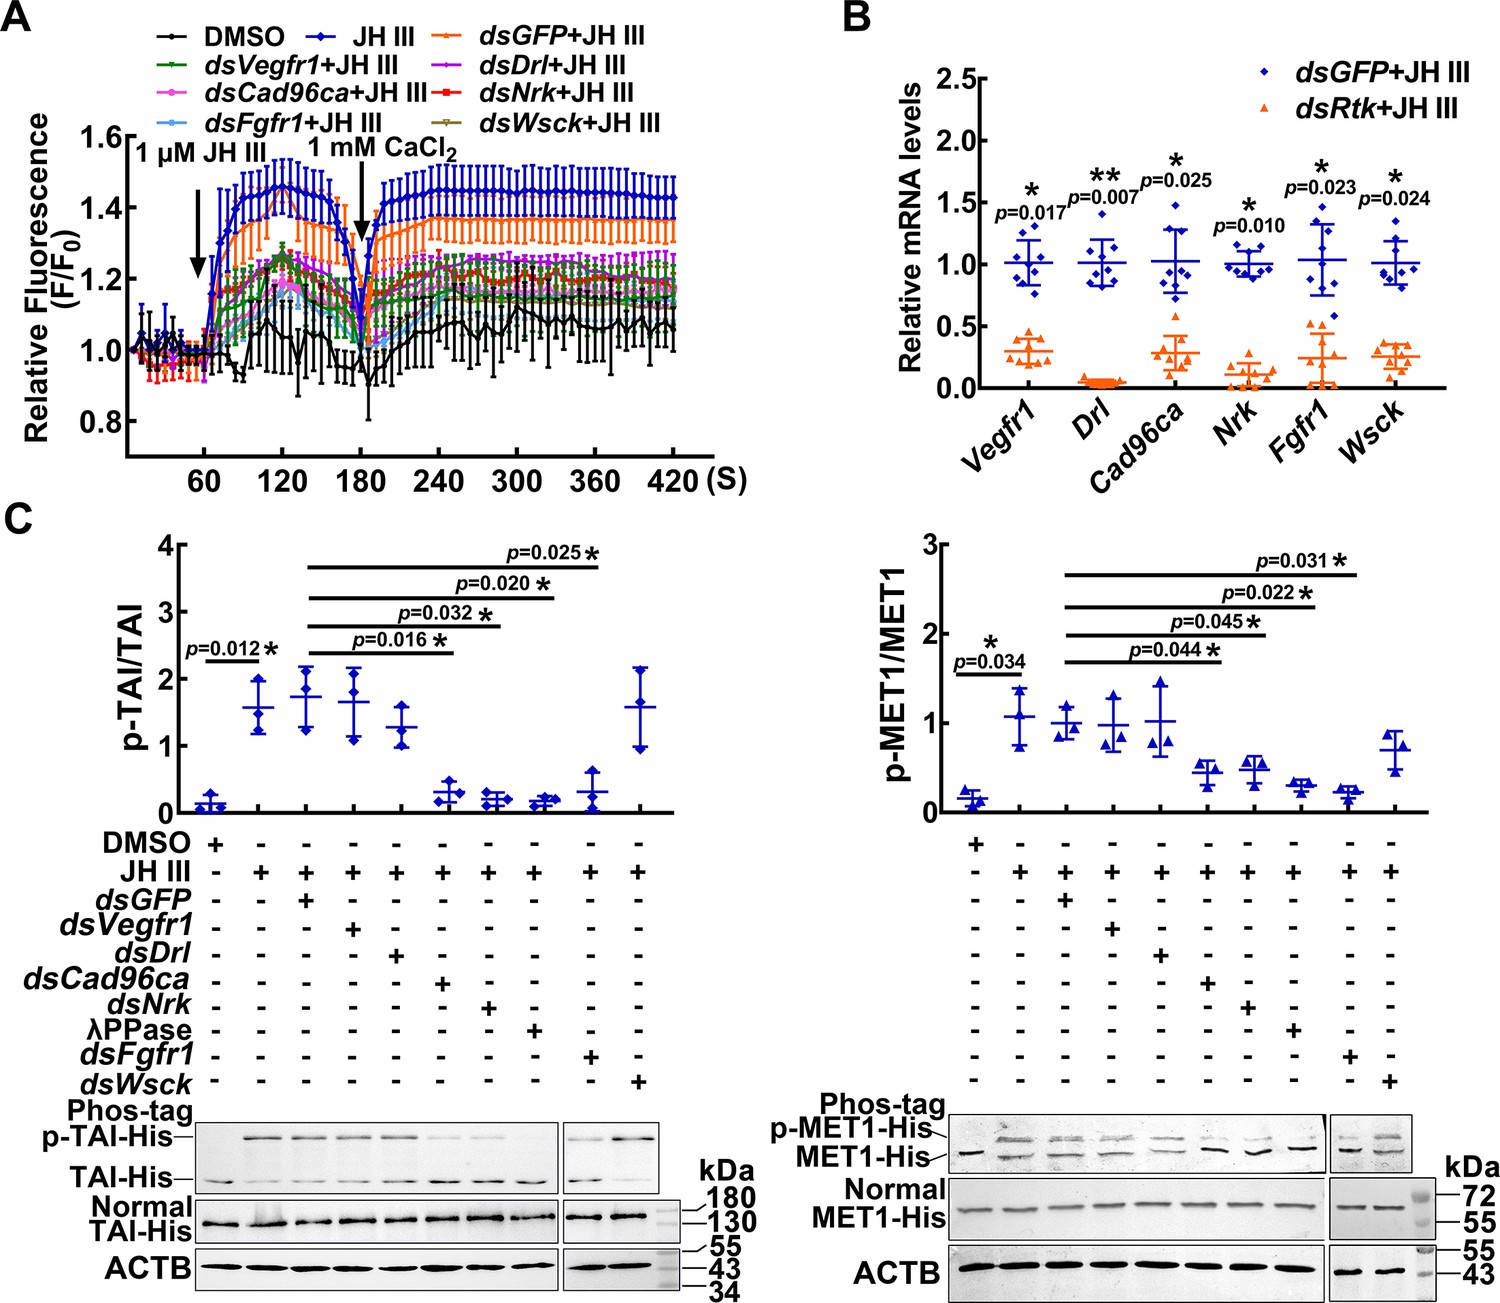
RTKs involved in JH III-regulated Ca2+ increase and protein phosphorylation.
(A) The level of Ca2+ after Vegfr1, Drl, Cad96ca, Nrk, Fgfr1, and Wsck knockdown in HaEpi cells. The cells were incubated with dsRNA (the final concentration was 1 μg/mL for 48 hr) and AM ester calcium crimson dye (3 μM, 30 min). F0: the fluorescence intensity of HaEpi cells without treatment. F: the fluorescence intensity of HaEpi cells after different treatments. DMSO as solvent control. (B) The interference efficiency of dsRNA in HaEpi cells. (C) Western blotting was performed to analyze TAI-His and MET1-His phosphorylation after treatment with dsRNA and JH III (1 μM, 3 hr). Phos-tag: phosphate affinity SDS‒PAGE gel, Normal: normal SDS‒PAGE gel, which was a 7.5 or 10% SDS‒PAGE gel. The results of three independent repeated western blots were statistically analyzed by ImageJ software. The p value was calculated by Student’s t test based on three independent replicate experiments, n=3. The error bar indicates the mean ± SD.
-
Figure 2—source data 1
Statistical data for Figure 2A, B and C.
- https://cdn.elifesciences.org/articles/97189/elife-97189-fig2-data1-v1.xlsx
-
Figure 2—source data 2
PDF file containing original western blots for Figure 2C, indicating the relevant bands and treatments.
- https://cdn.elifesciences.org/articles/97189/elife-97189-fig2-data2-v1.pdf
-
Figure 2—source data 3
Original files for western blot analysis displayed in Figure 2C.
- https://cdn.elifesciences.org/articles/97189/elife-97189-fig2-data3-v1.zip
Figure 3 with 2 supplements
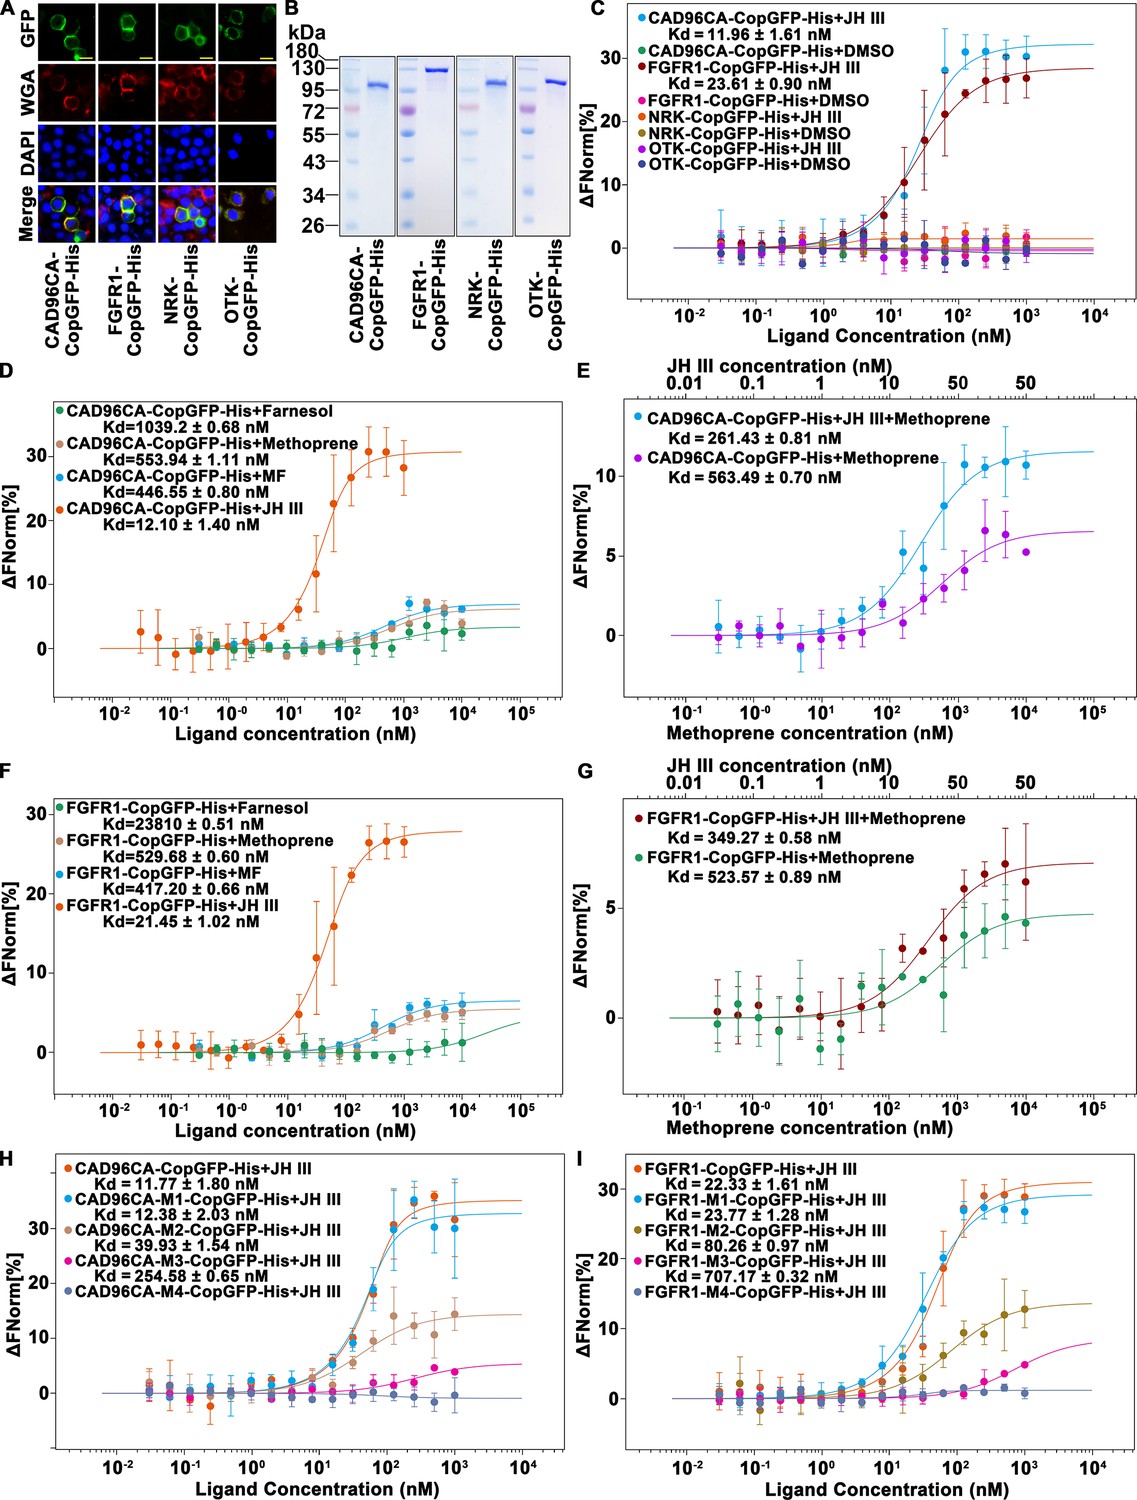
CAD96CA and FGFR1 could bind JH III.
(A) Cell membrane localization of the overexpressed CAD96CA-CopGFP-His, FGFR1-CopGFP-His, NRK-CopGFP-His and OTK-CopGFP-His. GFP: green fluorescence of RTKs fused with a green fluorescent protein. WGA: red fluorescence, the cell membrane was labeled with wheat germ agglutinin. DAPI: nuclear staining. Merge: the pictures of different fluorescent-labeled cells were combined. The cells were observed with a fluorescence microscope. Scale bar = 20 μm. (B) Coomassie brilliant blue staining of the SDS‒PAGE gel showed the purity of the separated CAD96CA-CopGFP-His, FGFR1-CopGFP-His, NRK-CopGFP-His, and OTK-CopGFP-His proteins. (C) Saturation binding curves of CAD96CA-CopGFP-His, FGFR1-CopGFP-His, NRK-CopGFP-His and OTK-CopGFP-His. (D) Saturation binding curves of CAD96CA-CopGFP-His were incubated with the indicated compounds. (E) The binding and competition curves of CAD96CA and methoprene. (F) Saturation binding curves of FGFR1-CopGFP-His were incubated with the indicated compounds. (G) The binding and competition curves of FGFR1 and methoprene. (H) The binding curves of CAD96CA mutants and JH III. (I) The binding curves of FGFR1 mutants with JH III. Data are mean ± SE of three replicates. n=3.
-
Figure 3—source data 1
Statistical data for Figure 3C-I.
- https://cdn.elifesciences.org/articles/97189/elife-97189-fig3-data1-v1.xlsx
-
Figure 3—source data 2
PDF file containing original gels for Figure 3B, indicating the relevant bands and treatments.
- https://cdn.elifesciences.org/articles/97189/elife-97189-fig3-data2-v1.pdf
-
Figure 3—source data 3
Original files for gel analysis displayed in Figure 3B.
- https://cdn.elifesciences.org/articles/97189/elife-97189-fig3-data3-v1.zip
Figure 3—figure supplement 1
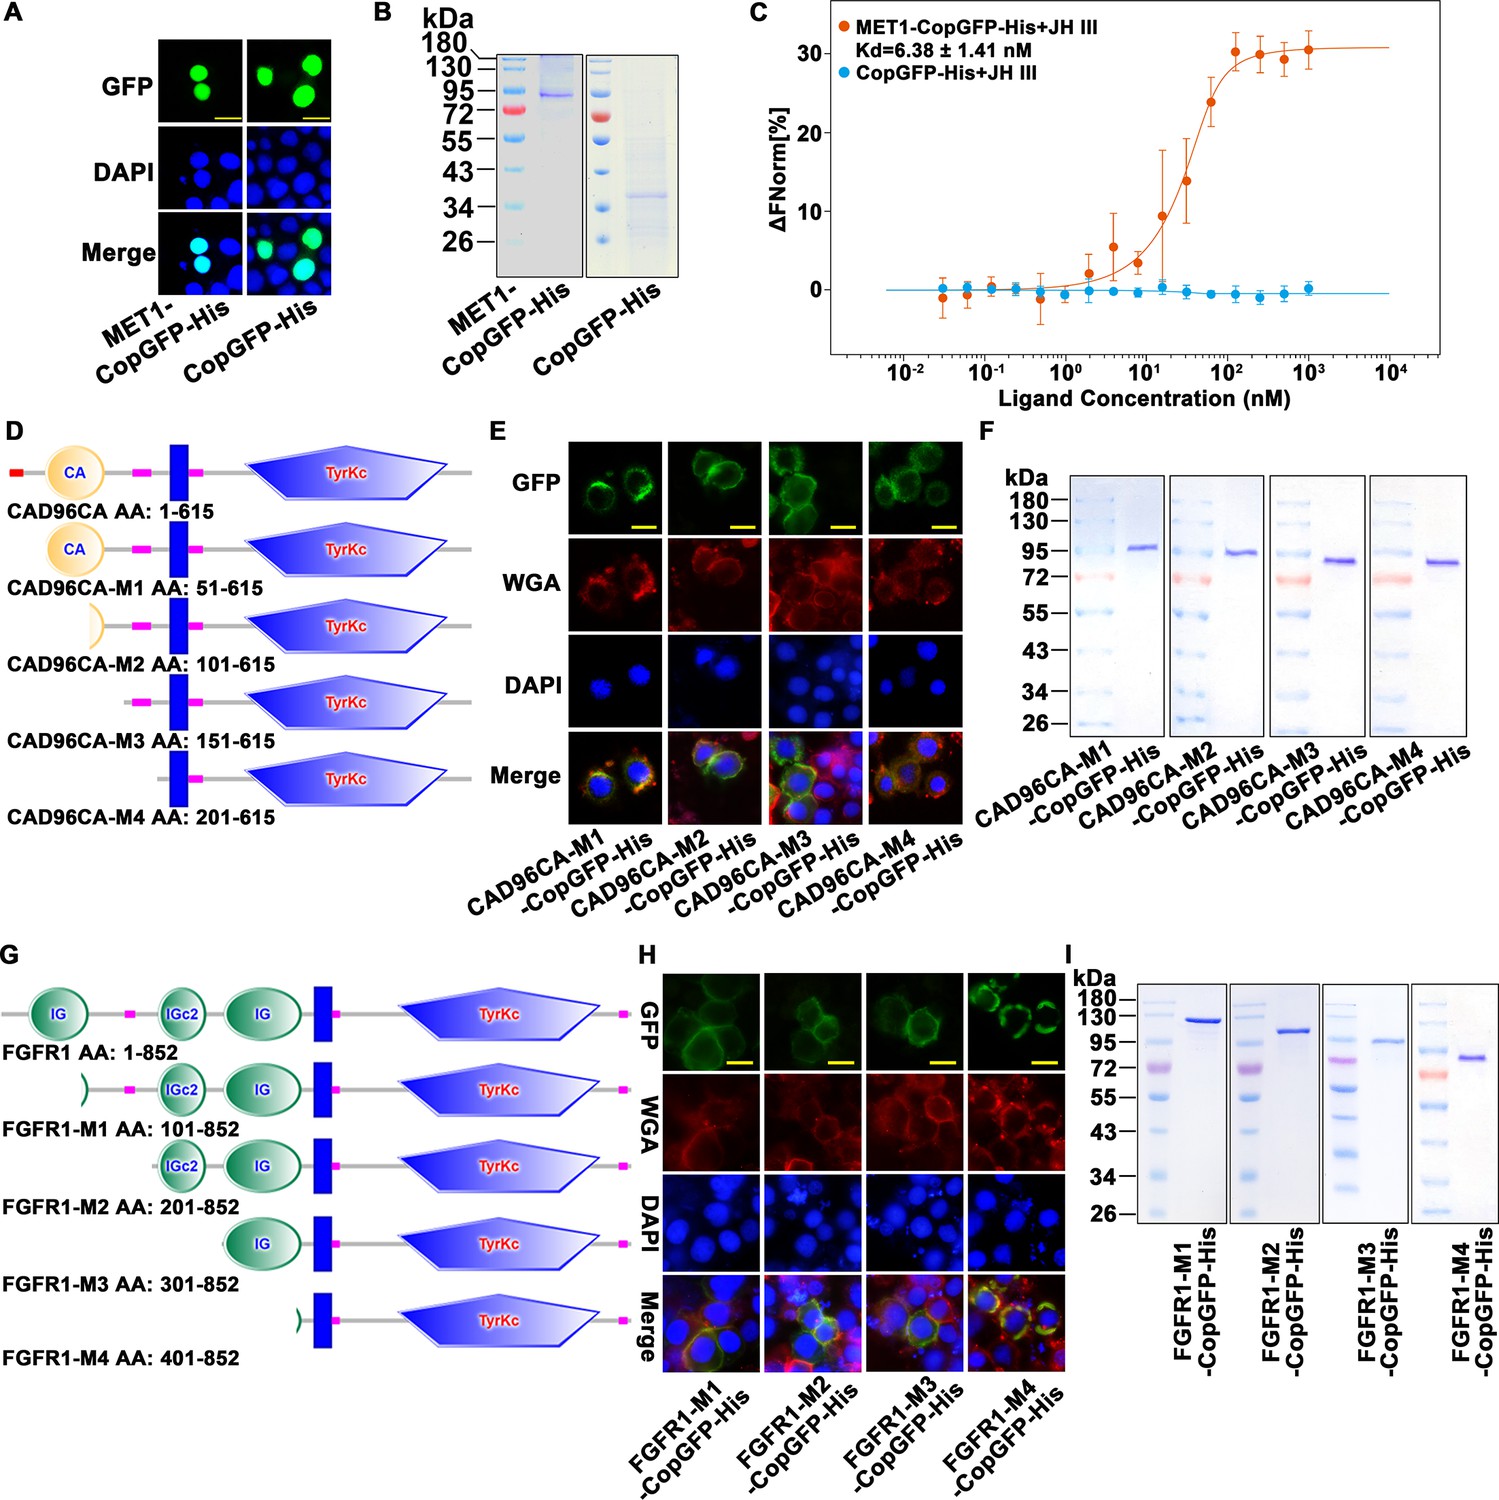
MET1 bound JH III, and CAD96CA and FGFR1 mutants.
(A) The subcellular localization of overexpressed MET1-CopGFP-His and CopGFP-His in the cells. Green: green fluorescence from MET1-CopGFP-His and CopGFP-His. DAPI: nuclear staining. Merge: the pictures of different fluorescence-labelled cells were combined. The cells were observed with a fluorescence microscope. Scale bar = 20 μm. (B) Coomassie brilliant blue staining of SDS‒PAGE gel showing the purity of the separated MET1-CopGFP-His and CopGFP-His proteins. (C) Saturation binding curves of MET1-CopGFP-His and CopGFP-His. Data are mean ± SE of three replicates. (D) The diagram of CAD96CA mutation. (E) Subcellular localization of the CAD96CA mutants. Green: green fluorescence of mutants fused with a green fluorescent protein. Red: the cell membrane stained with wheat germ lectin (WGA). Blue: nuclei stained with DAPI. Scale bar = 20 μm. (F) Coomassie brilliant blue staining of the SDS‒PAGE gel showed the purity of the separated CAD96CA mutant proteins. (G) The diagram of FGFR1 mutation. (H) Subcellular localization of the FGFR1 mutants. Green: green fluorescence of mutants fused with a green fluorescent protein. Red: the cell membrane stained with wheat germ lectin (WGA). Blue: nuclei stained with DAPI. Scale bar = 20 μm. (I) Coomassie brilliant blue staining of the SDS‒PAGE gel showed the purity of the separated FGFR1 mutant proteins.
-
Figure 3—figure supplement 1—source data 1
Statistical data for Figure 3—figure supplement 1C.
- https://cdn.elifesciences.org/articles/97189/elife-97189-fig3-figsupp1-data1-v1.xlsx
-
Figure 3—figure supplement 1—source data 2
PDF file containing original gels for Figure 3—figure supplement 1B, F and I, indicating the relevant bands and treatments.
- https://cdn.elifesciences.org/articles/97189/elife-97189-fig3-figsupp1-data2-v1.pdf
-
Figure 3—figure supplement 1—source data 3
Original files for gel analysis displayed in Figure 3—figure supplement 1B, F and I.
- https://cdn.elifesciences.org/articles/97189/elife-97189-fig3-figsupp1-data3-v1.zip
Figure 3—figure supplement 2
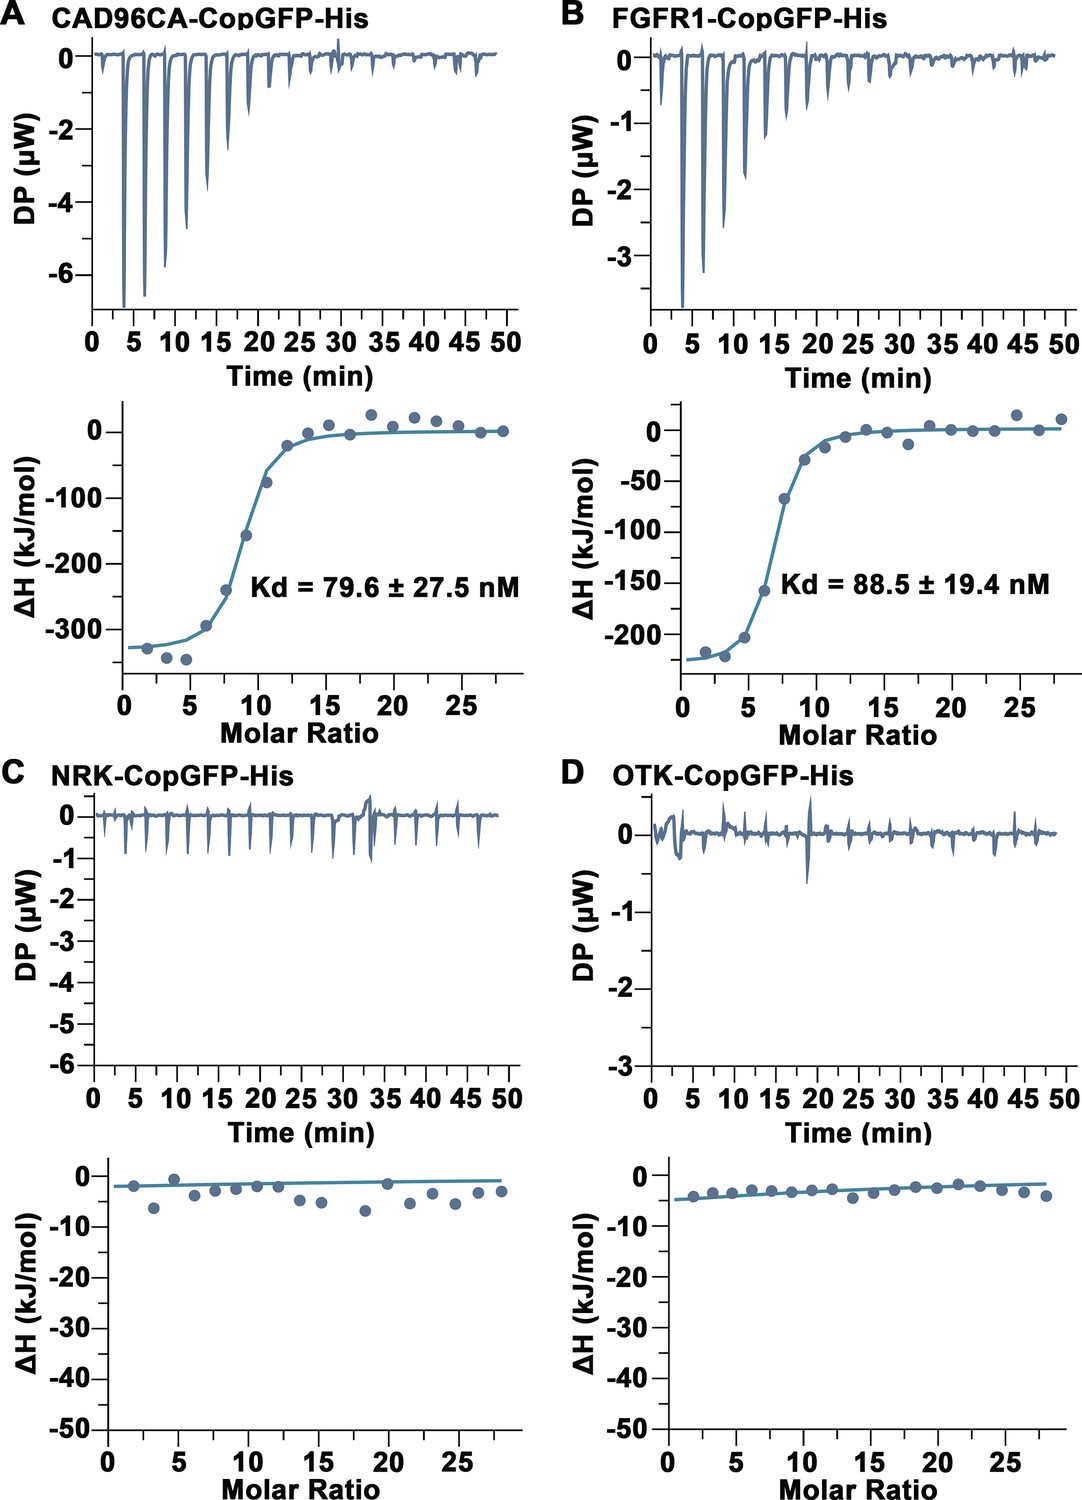
CAD96CA and FGFR1 bound JH III were analyzed using ITC.
(A) Saturation binding curves of CAD96CA-CopGFP-His. (B) Saturation binding curves of FGFR1-CopGFP-His. (C) The binding curves of NRK-CopGFP-His. (D) The binding curves of OTK-CopGFP-His. The data were subtracted with that from the control test by the analysis software.
-
Figure 3—figure supplement 2—source data 1
Statistical data for Figure 3—figure supplement 2.
- https://cdn.elifesciences.org/articles/97189/elife-97189-fig3-figsupp2-data1-v1.xlsx
Figure 4 with 2 supplements
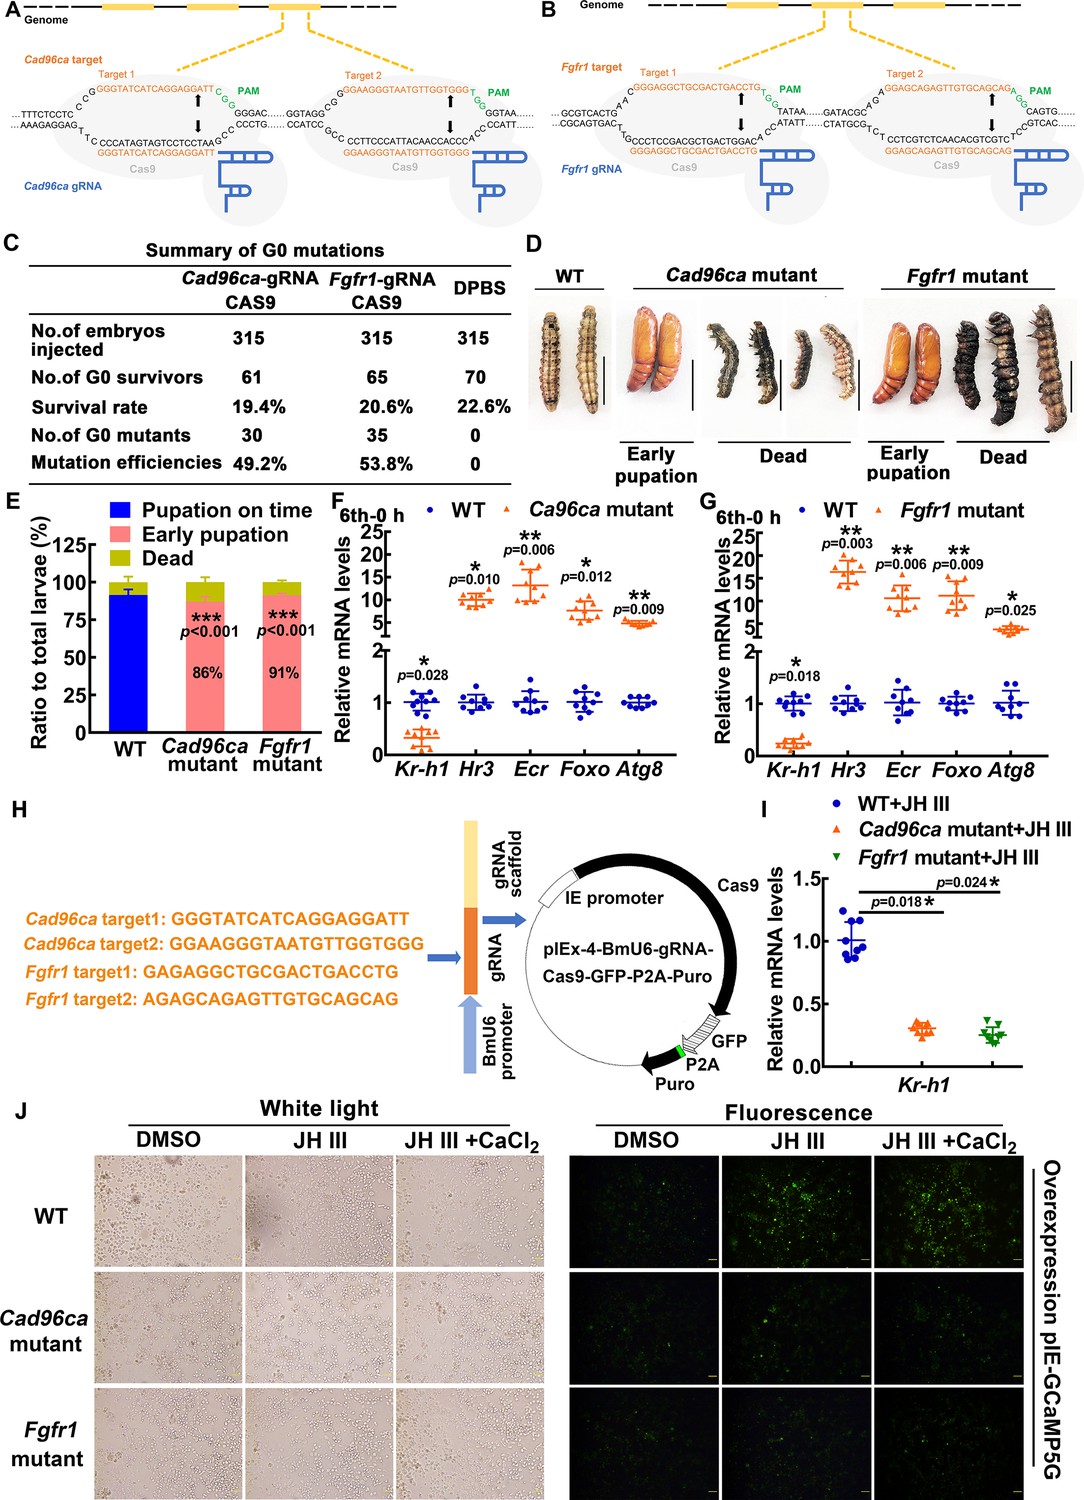
The roles of CAD96CA and FGFR1 in larval development were determined by CRISPR/Cas9 system-mediated mutants.
(A, B) Schematic showing the injection mixture of the CRISPR/Cas9 system. The black line refers to the genome of H. armigera; the yellow blocks correspond to exons. The Cas9 nuclease (in grey) was targeted to genomic DNA by Cad96ca-gRNA or Fgfr1-gRNA with an ~20 nt guide sequence (orange) and a scaffold (blue). The guide sequence pairs with the DNA target (orange sequence on the top strand), which requires the upstream sequence of the 5'-CGG-3' adjacent motif (PAM; green). Cas9 induces a double-strand break (DSB) ~3 bp upstream of the PAM (black triangle). (C) Summary of G0 mutations. (D) Images showing WT and mutant H. armigera phenotypes. The scale represents 1 cm. (E) Morphology and statistical analysis of WT and mutant H. armigera. Both Cad96ca and Fgfr1 mutant larvae showed earlier pupation than WT controls. (F, G) qRT‒PCR showing the mRNA levels of the JH/20E response genes in WT and mutant H. armigera. (H) Schematic showing the CRISPR/Cas9 editing in HaEpi cells by pIEx-4-BmU6-Cad96ca-gRNA-Cas9-GFP-P2A-Puro and pIEx-4-BmU6-Fgfr1-gRNA-Cas9-GFP-P2A-Puro recombination vectors. (I) qRT‒PCR showing the mRNA levels of Kr-h1 in WT and mutant HaEpi cells. (J) pIEx-GCaMP5G was overexpressed in WT and mutant HaEpi cells, and calcium mobilization was detected. Green fluorescence shows the calcium signal. The concentration of JH III was 1 μM, and that of CaCl2 was 1 mM. The scale bar represents 100 μm.
-
Figure 4—source data 1
Statistical data for Figure 4E, F, G, and I.
- https://cdn.elifesciences.org/articles/97189/elife-97189-fig4-data1-v1.xlsx
Figure 4—figure supplement 1
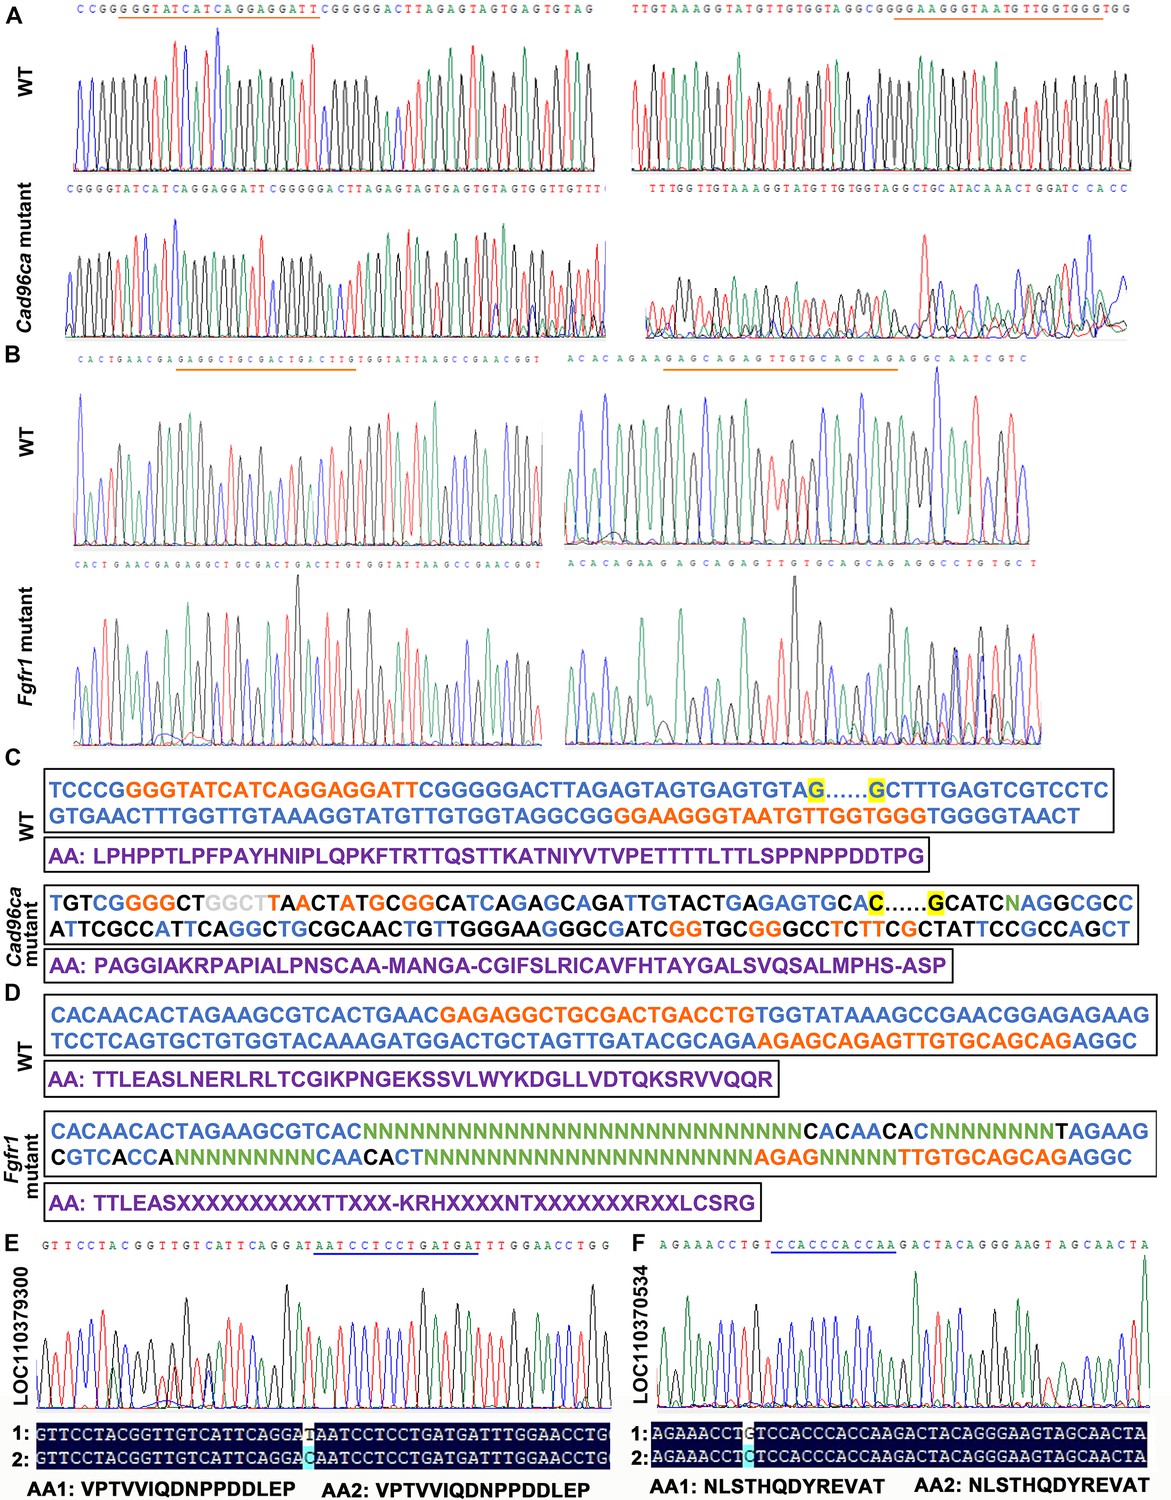
Targeted mutagenesis of Cad96ca and Fgfr1 in H. armigera.
(A, B) Mutations were detected by Sanger sequencing. Representative chromatograms of the PCR products of G0 H. armigera showing mutations induced by the CRISPR/Cas9 system. The gRNA target sequence was marked with an orange line. (C, D) Examples of G0 mutations identified by TA cloning and Sanger sequencing. The gRNA target sequence was marked in orange. Nucleotide insertions were shown in grey; nucleotide deletions were shown in green (N); and substitutions were shown in black. The purple sequence represents the amino acid sequence. (E, F) Off‒target genes detected by Sanger sequencing. The chromatograms of the PCR products of G0 H. armigera showed mutations. The gRNA target sequence was marked with a blue line. 1: mutant sequence, 2: normal sequence.
Figure 4—figure supplement 2
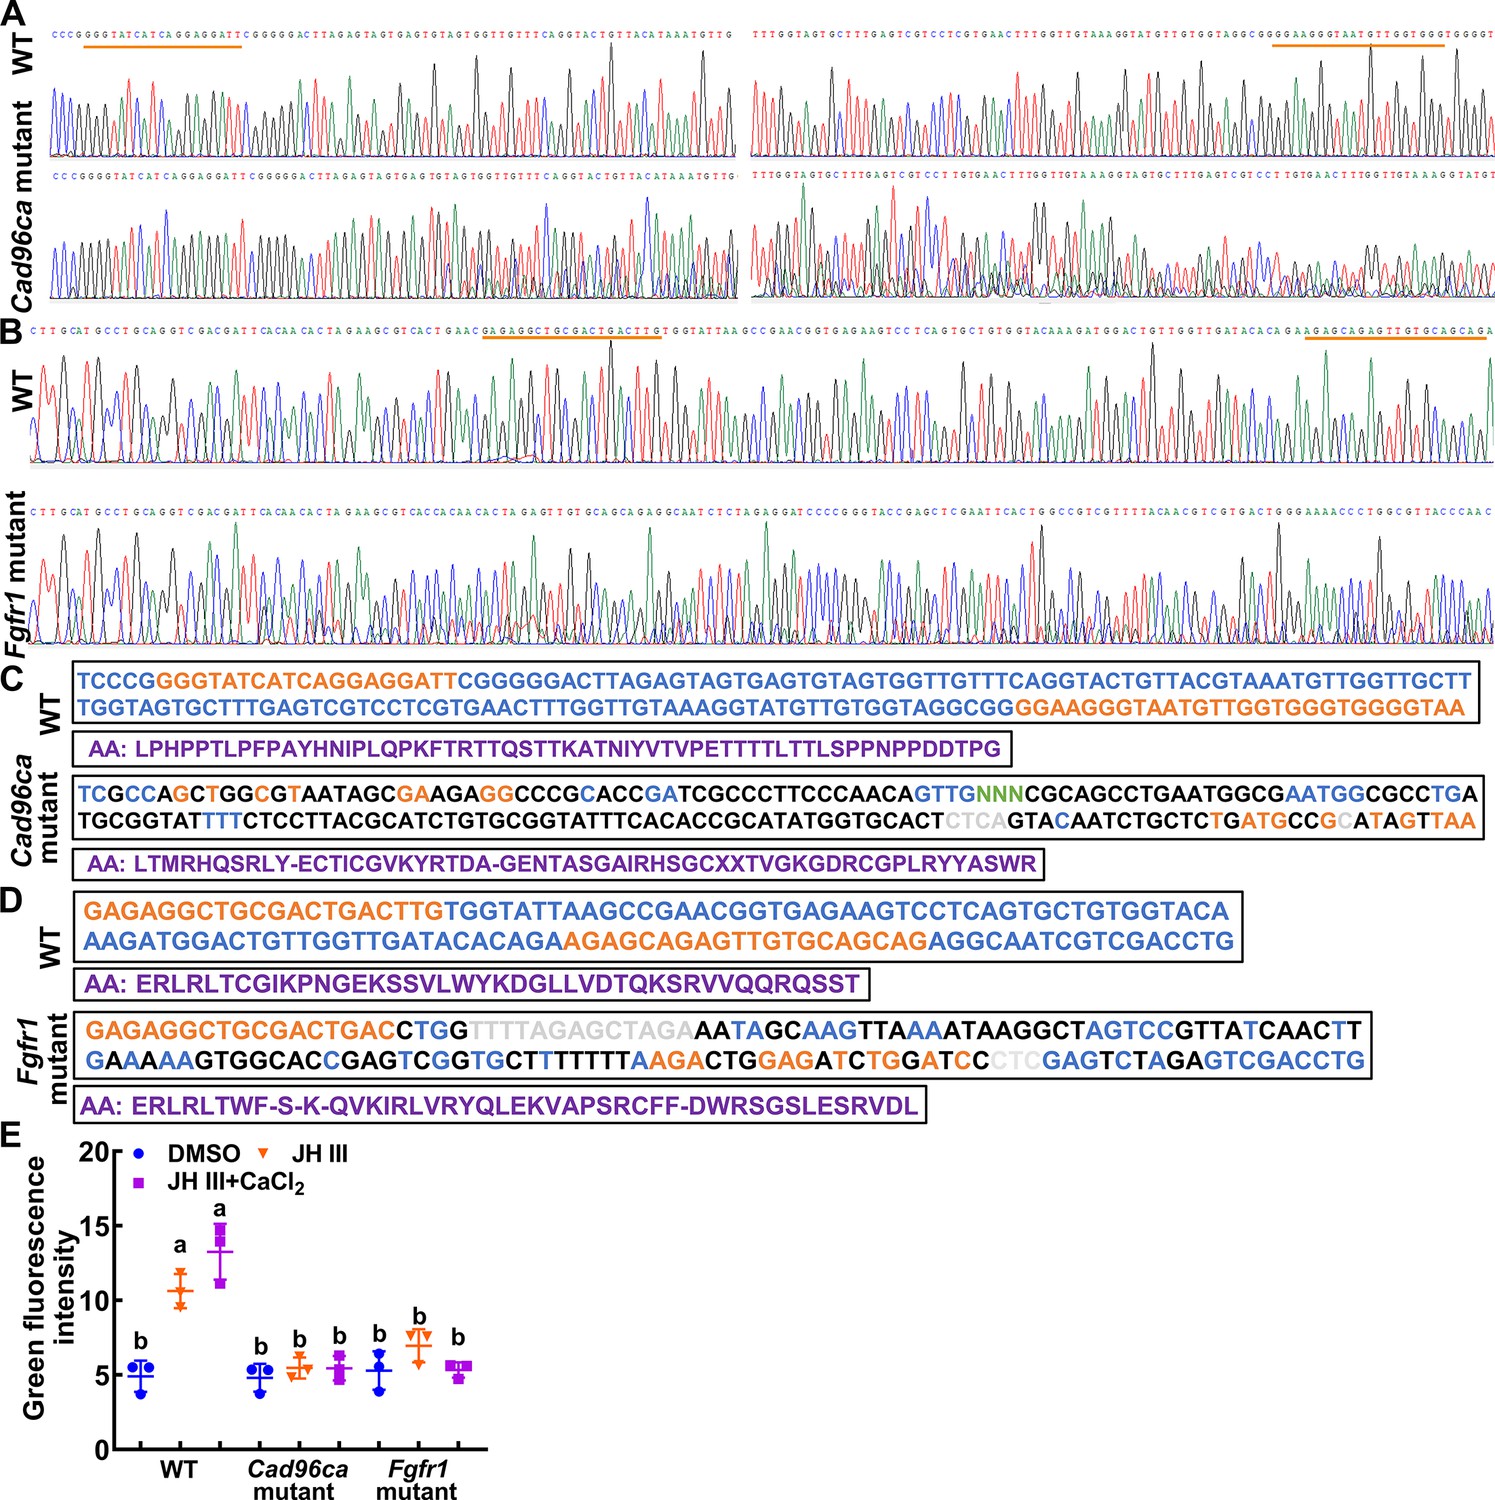
Targeted mutagenesis of Cad96ca and Fgfr1 in HaEpi cells.
(A, B) Mutations were detected by Sanger sequencing. Representative chromatograms of the PCR products of mutations. The gRNA target sequence was marked with an orange line. (C, D) Examples of mutations identified by TA cloning and Sanger sequencing. The gRNA target sequence was marked in orange. Nucleotide insertions were shown in grey, nucleotide deletions were shown in green (N), and substitutions were shown in black. The purple sequence represents the amino acid sequence. (E) Statistical analysis of the green fluorescence signal intensity by ImageJ software. The statistical analysis was performed using three independent replicates by ANOVA. n=3.
-
Figure 4—figure supplement 2—source data 1
Statistical data for Figure 4—figure supplement 2E.
- https://cdn.elifesciences.org/articles/97189/elife-97189-fig4-figsupp2-data1-v1.xlsx
Figure 5 with 1 supplement
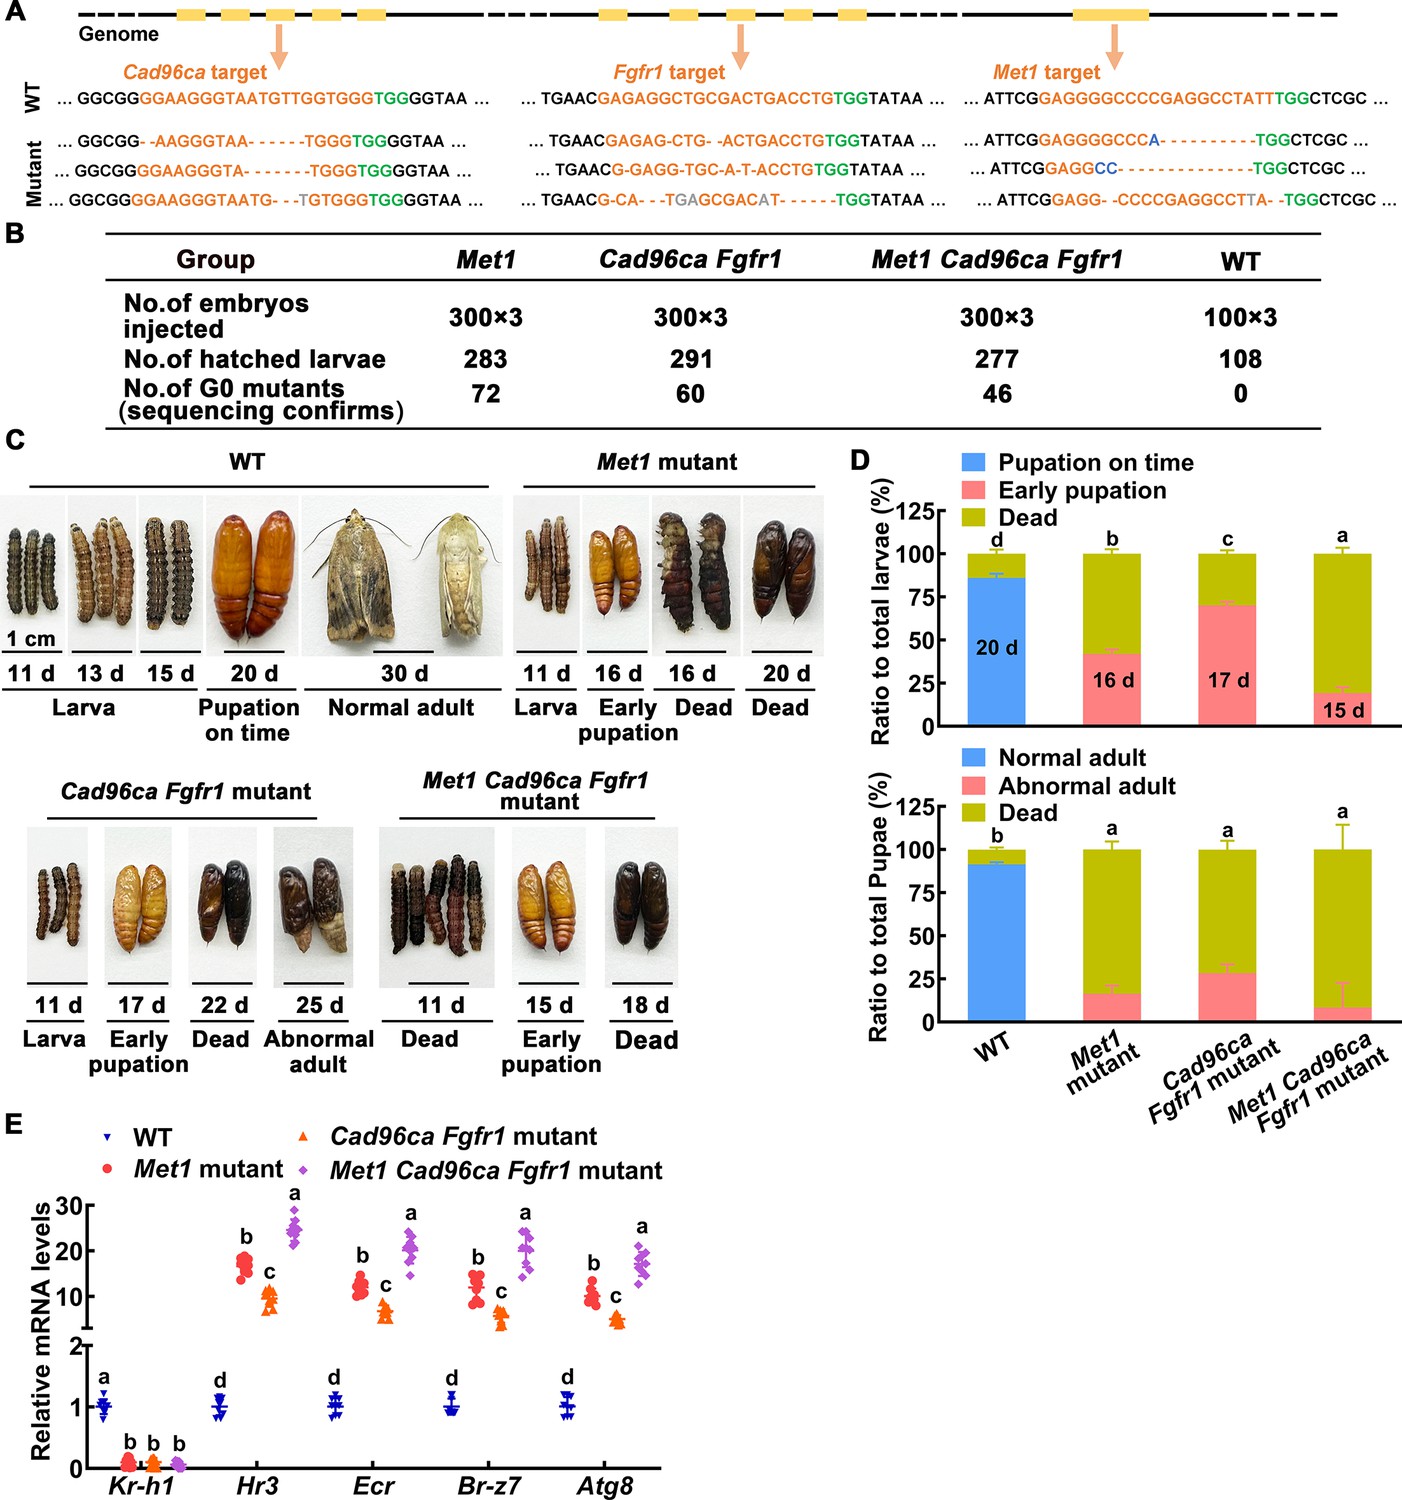
The roles of MET1, CAD96CA, and FGFR1 in larval development were determined by CRISPR/Cas9 system-mediated mutants.
(A) Various types of mutations caused by CRISPR/Cas9 system. Deletions were indicated by hyphens; insertions were shown by gray letters; substitutions were shown in blue letters. (B) The number of individuals in the G0 generation of the three experiments. (C) Images showing WT and mutant H. armigera phenotypes. The scale represents 1 cm. (D) Morphology and statistical analysis of WT and mutant H. armigera. (E) qRT‒PCR showing the mRNA levels of the JH/20E response genes in WT and mutant H. armigera.
-
Figure 5—source data 1
Statistical data for Figure 5D and E.
- https://cdn.elifesciences.org/articles/97189/elife-97189-fig5-data1-v1.xlsx
Figure 5—figure supplement 1
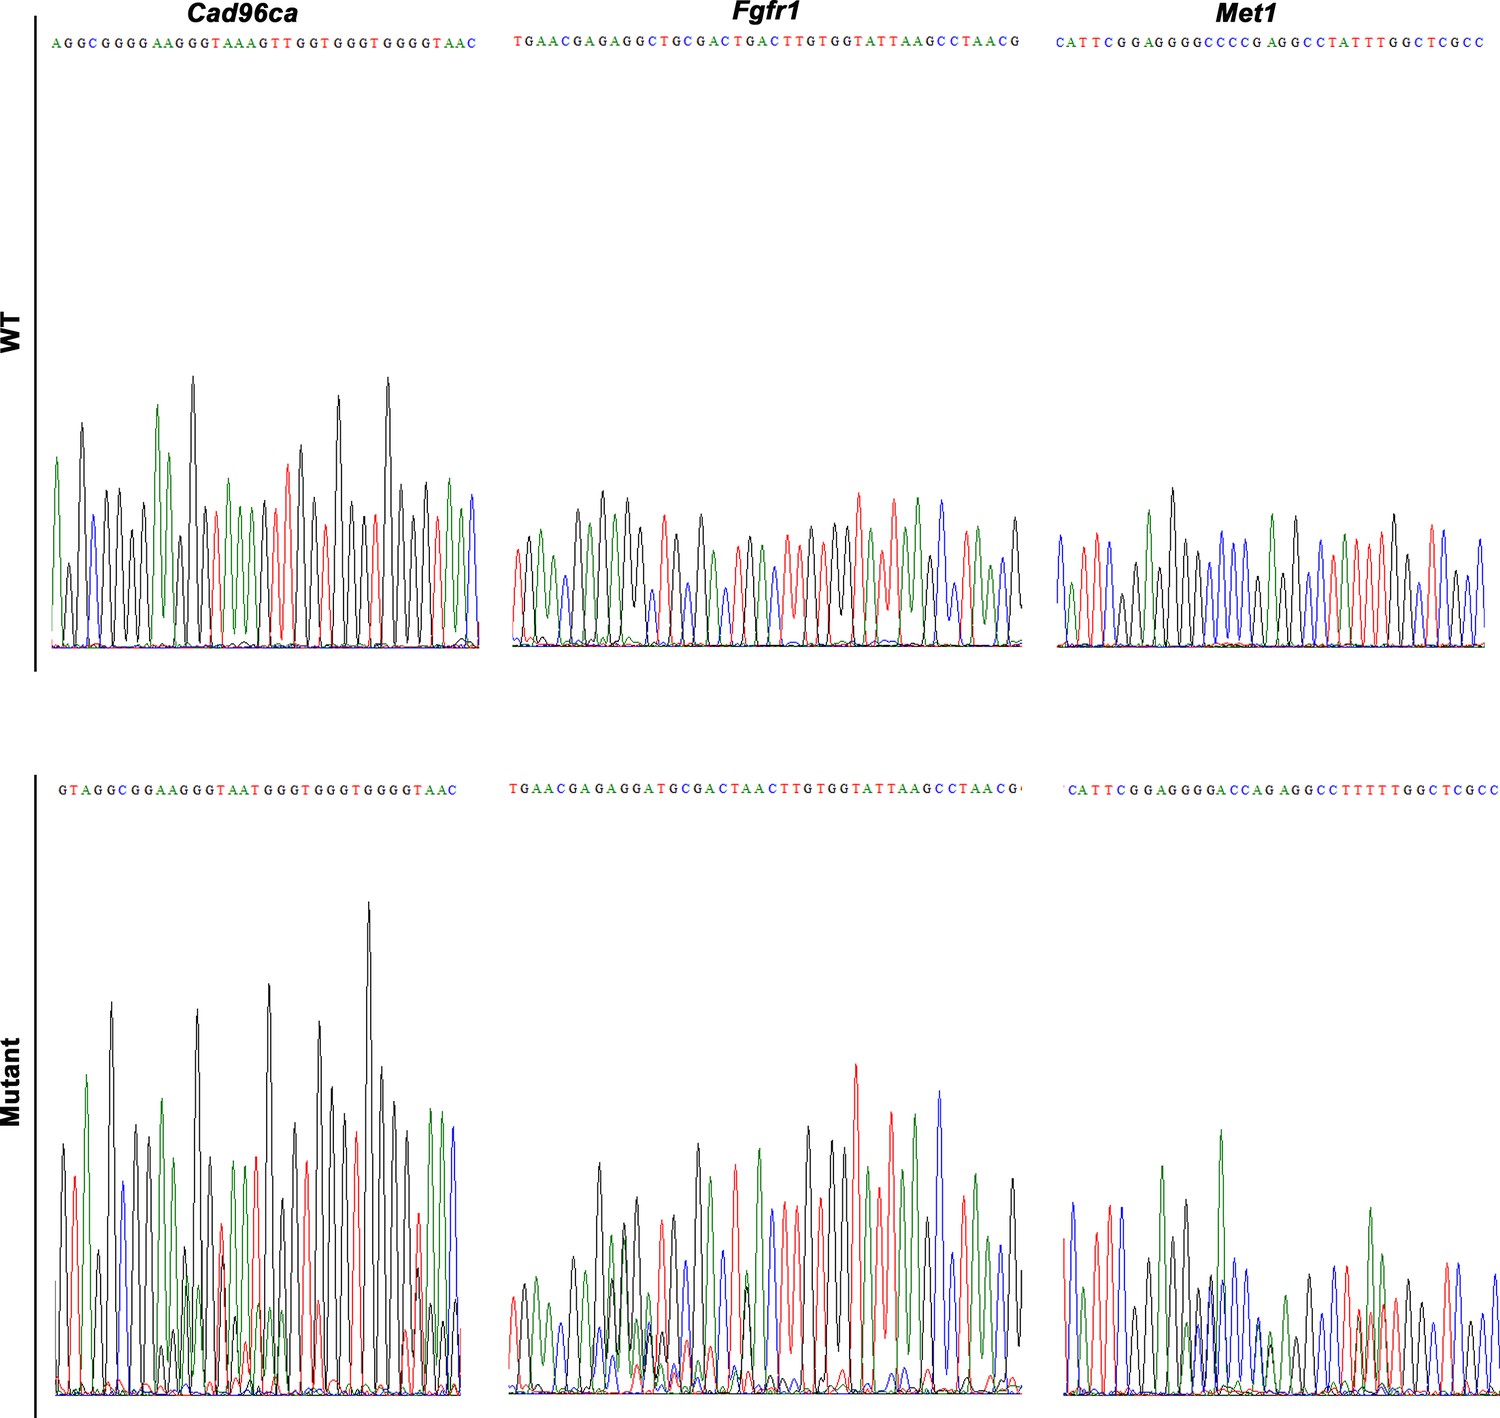
Targeted mutagenesis of Cad96ca, Fgfr1, and Met1 in H. armigera.
Mutations were detected by Sanger sequencing. Representative chromatograms of the PCR products of G0 H. armigera showing mutations induced by the CRISPR/Cas9 system.
Figure 6 with 2 supplements
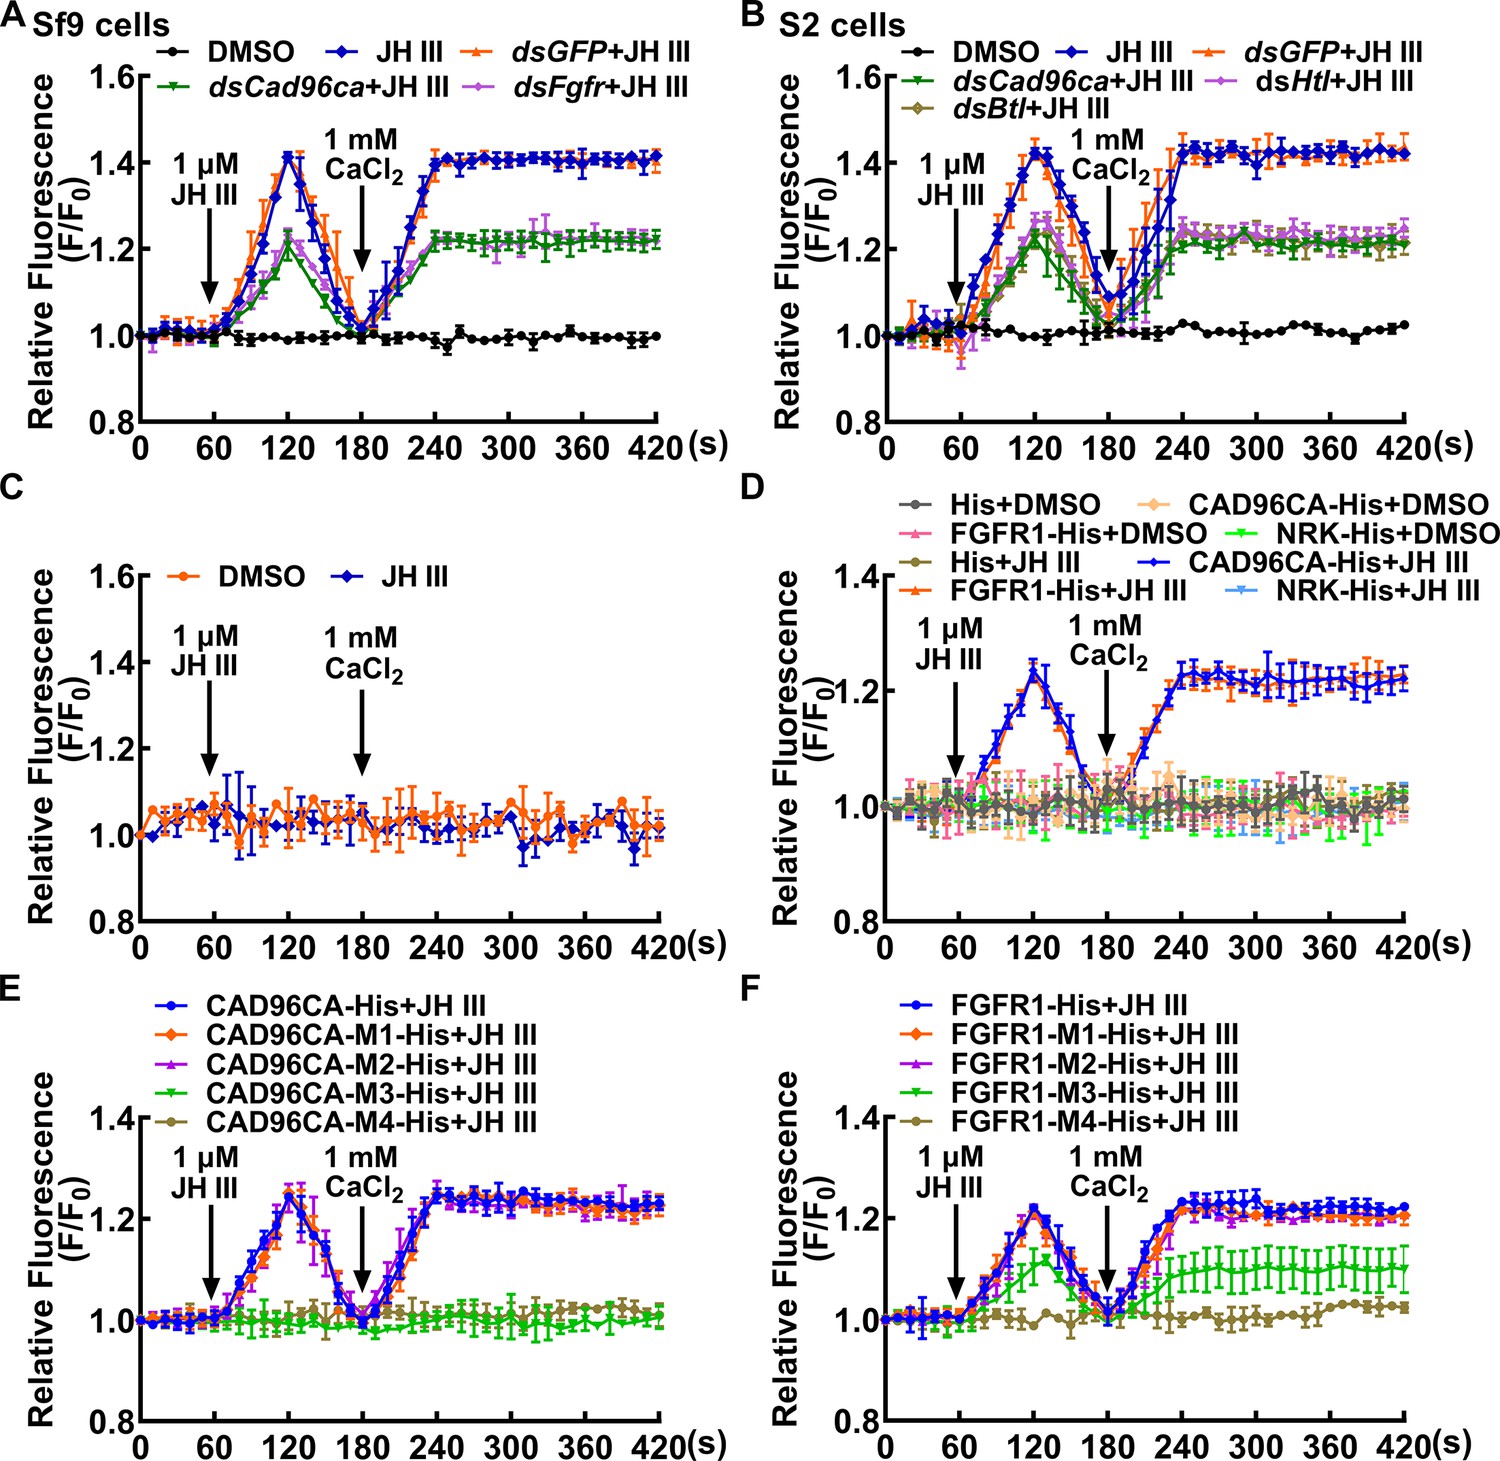
CAD96CA and FGFR1 participated in JH-induced calcium ion mobilization.
(A) The level of Ca2+ after Cad96ca and Fgfr knockdown in Sf9 cells. The cells were incubated with dsRNA (the final concentration was 1 μg/mL for 48 hr). F0: the fluorescence intensity of Sf9 cells without treatment. F: the fluorescence intensity of Sf9 cells after different treatments. DMSO as solvent control. (B) Effect of JH III on calcium ion levels in S2 cells after Cad96ca and Htl knockdown. (C) The response of calcium ion levels to JH III in HEK-293T cells. (D) The analysis of calcium ion flow after HEK-293T cells overexpressed RTK. DMSO as solvent control. His as tag control. (E, F) The calcium was quantitated after HEK-293T cells overexpressed CAD96CA-His, FGFR1-His, and mutants. The error bar indicates the mean ± SD. n=3.
-
Figure 6—source data 1
Statistical data for Figure 6A-F.
- https://cdn.elifesciences.org/articles/97189/elife-97189-fig6-data1-v1.xlsx
Figure 6—figure supplement 1
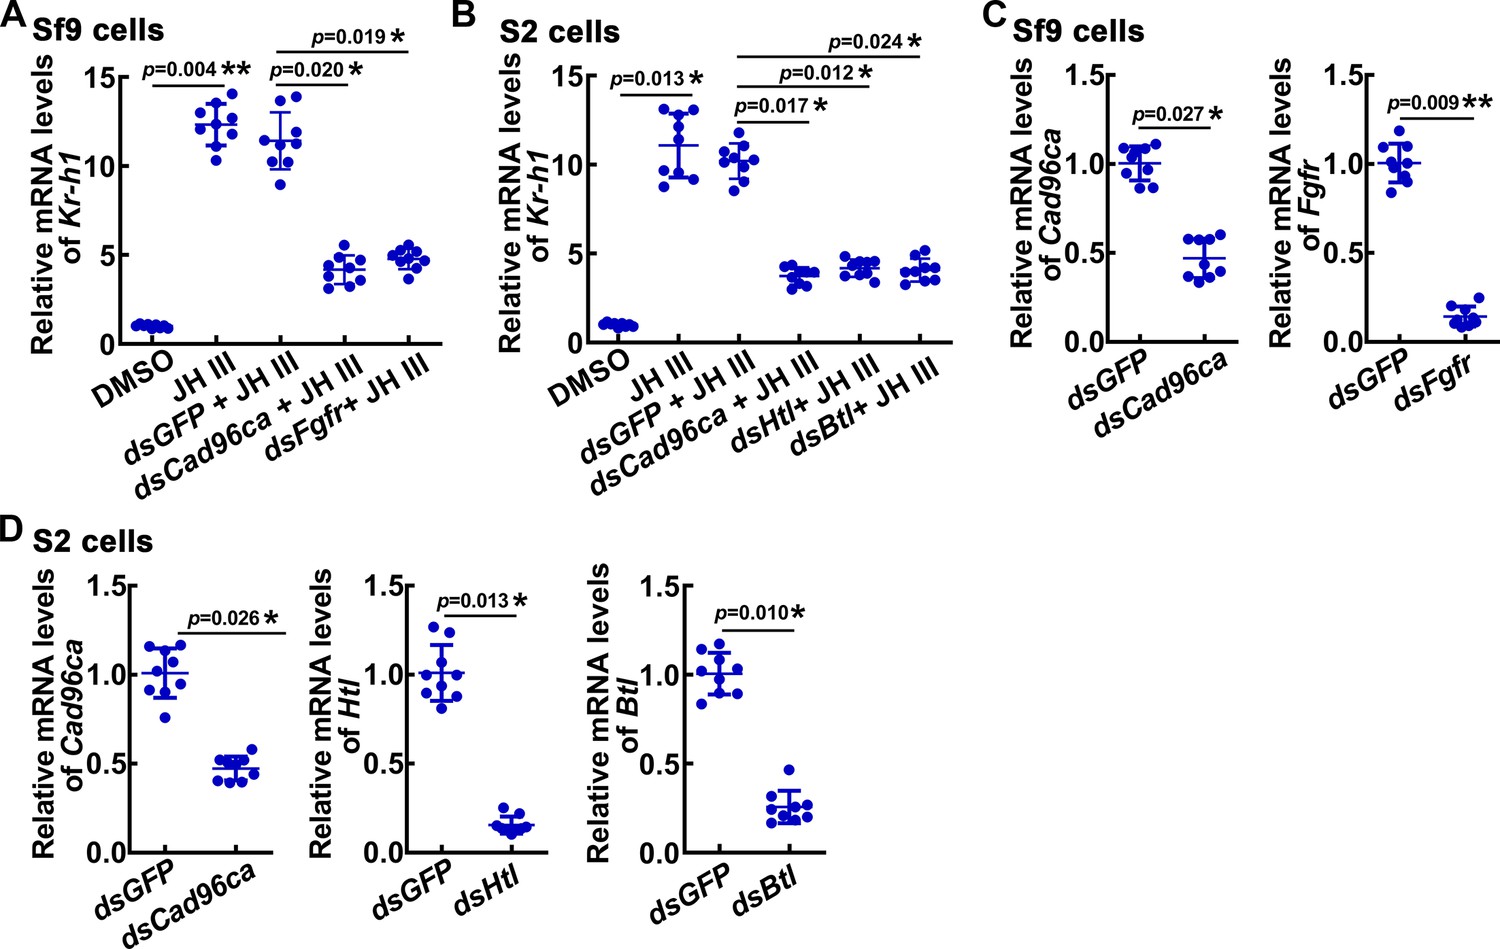
The gene expression was analyzed by qPCR.
(A) The mRNA level of Kr-h1 after genes knockdown in Sf9 cells. (B) The mRNA level of Kr-h1 after genes knockdown in S2 cells. (C) Interference efficiency of Cad96ca and Fgfr in Sf9 cell lines. (D) Interference efficiency of Cad96ca, Htl and Btl in S2 cell lines. The relative mRNA levels were calculated via the 2–ΔΔCT method, and the bars indicate the mean ± SD. Asterisks manifest significant differences by Student’s t test (*p<0.05; **p<0.01) based on three biological replicates, n=3.
-
Figure 6—figure supplement 1—source data 1
Statistical data for Figure 6—figure supplement 1.
- https://cdn.elifesciences.org/articles/97189/elife-97189-fig6-figsupp1-data1-v1.xlsx
Figure 6—figure supplement 2
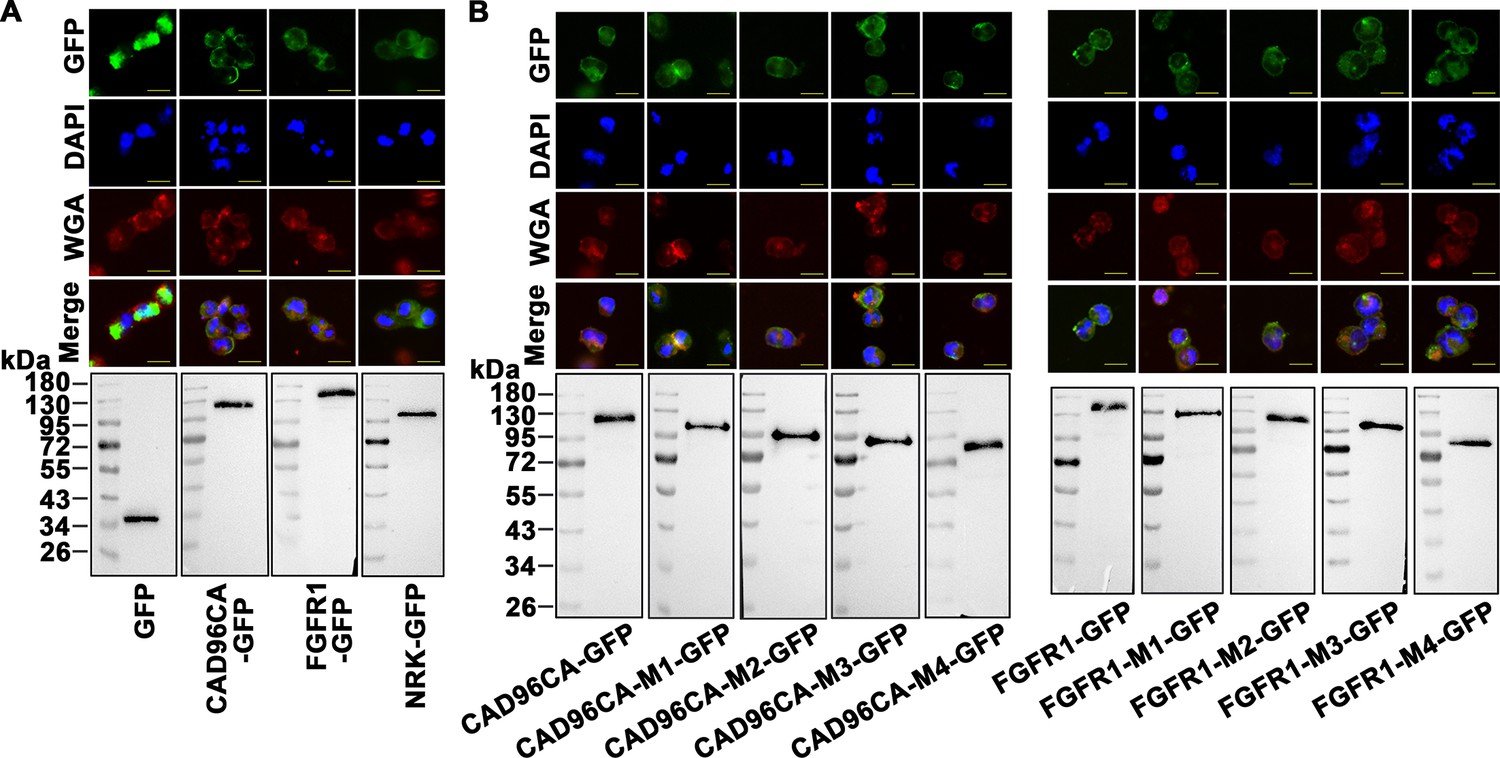
CAD96CA, FGFR1 and mutants overexpressed in HEK-293T cells.
(A) Subcellular localization of overexpressed GFP, CAD96CA-GFP, FGFR1-GFP, and NRK-GFP. GFP: green fluorescence of RTKs fused with a green fluorescent protein. WGA: wheat germ agglutinin, a cell membrane label. DAPI: nuclear staining. Merge: the pictures of different fluorescence-labelled cells were combined. The cells were observed with a fluorescence microscope. Scale bar = 20 μm. Western blotting showed the expression of the target protein. (B) Subcellular localization of the CAD96CA and FGFR1 mutants. Green: green fluorescence of mutants fused with a green fluorescent protein. Red: the cell membrane stained with wheat germ lectin (WGA). Blue: nuclei stained with DAPI. Scale = 20 μm. The protein level of the mutant was detected by western blotting.
-
Figure 6—figure supplement 2—source data 1
PDF file containing original western blots for Figure 6—figure supplement 2, indicating the relevant bands and treatments.
- https://cdn.elifesciences.org/articles/97189/elife-97189-fig6-figsupp2-data1-v1.pdf
-
Figure 6—figure supplement 2—source data 2
Original files for western blot analysis displayed in Figure 6—figure supplement 2.
- https://cdn.elifesciences.org/articles/97189/elife-97189-fig6-figsupp2-data2-v1.zip
Figure 7
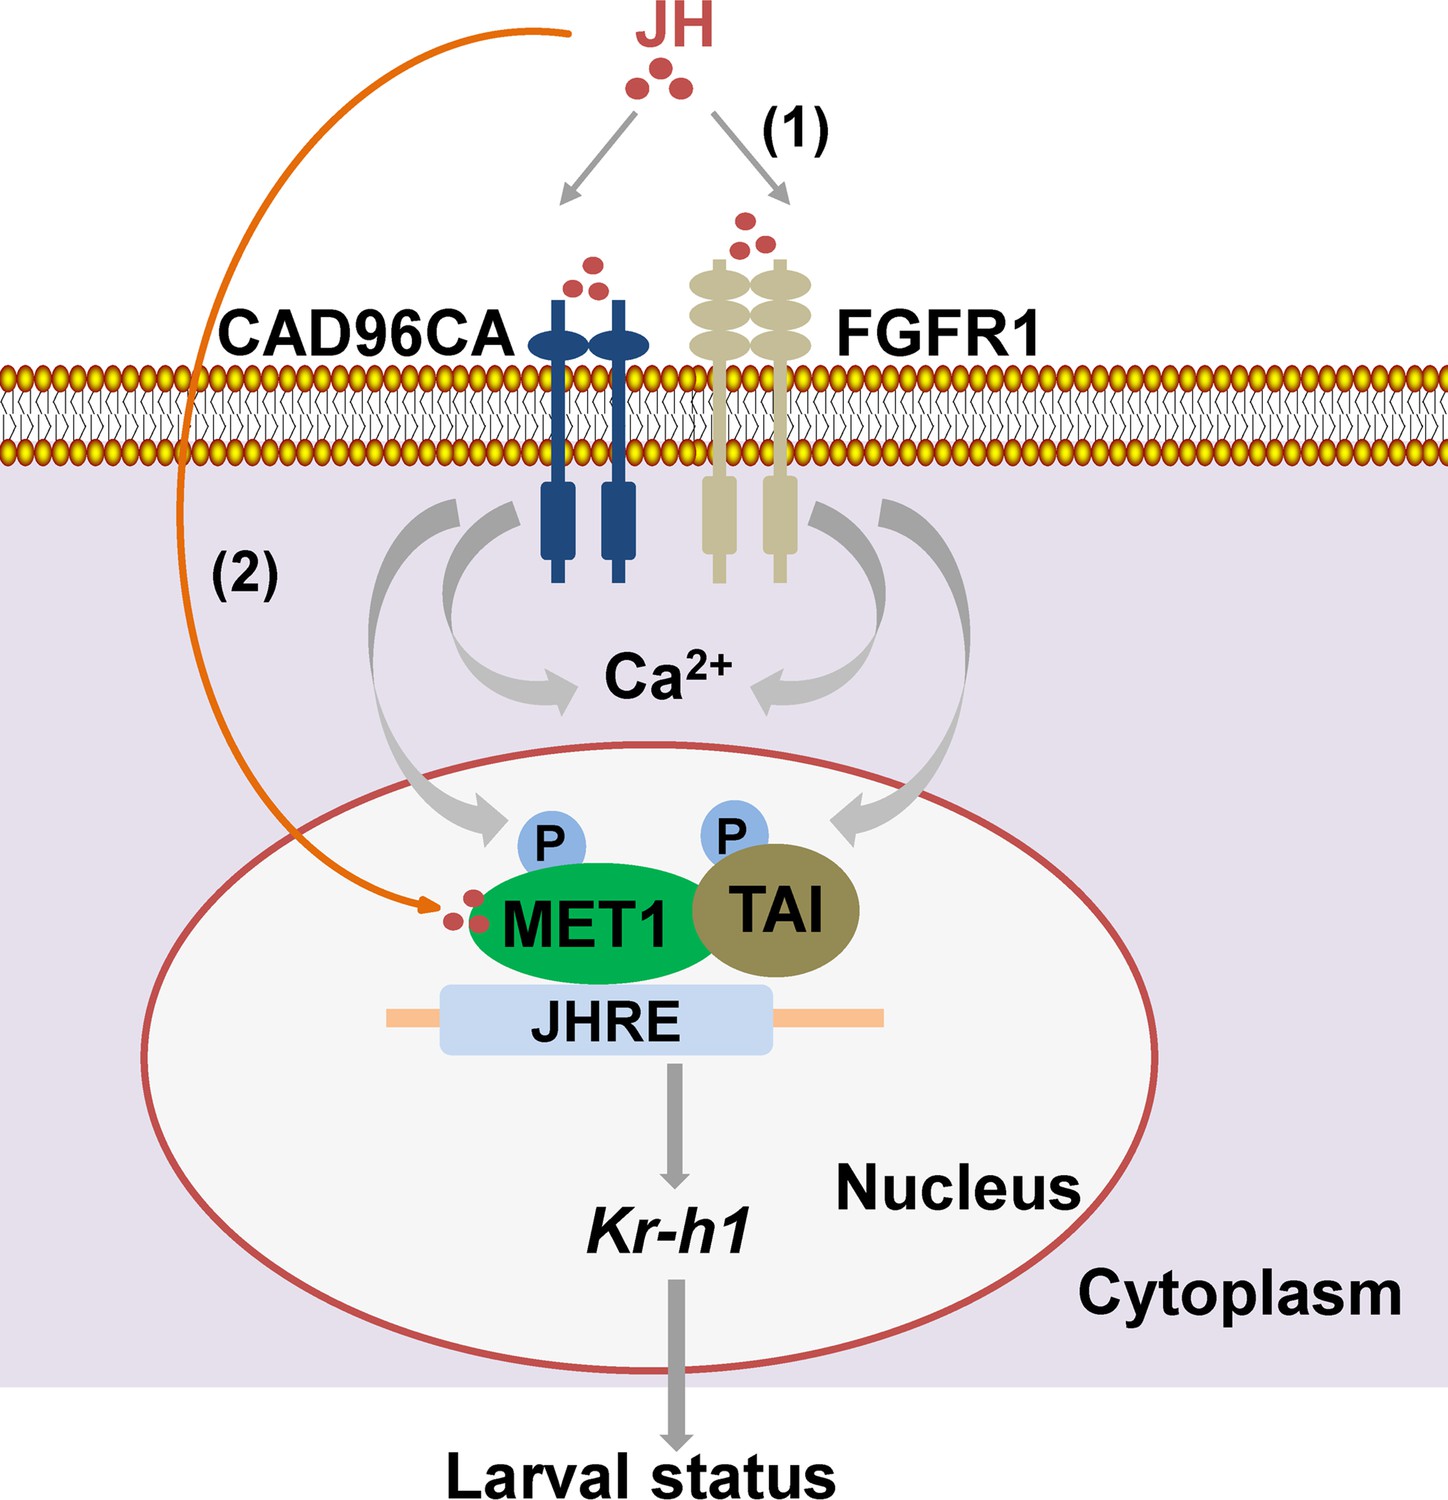
A diagram illustrating CAD96CA and FGFR1 transmitting juvenile hormone signal for gene expression.
(1) JH binds to cell membrane receptors CAD96CA and FGFR1 to trigger an increase in intracellular calcium and the phosphorylation of MET1 and TAI to enhance their function in gene expression to maintain larval status. (2) On the other hand, JH enters cells freely via diffusion to bind its intracellular receptor MET. MET interacts with TAI and then binds to the JH response element (JHRE, containing the E-box core sequence, in the Kr-h1 promoter region) to promote gene expression to maintain larval status. Therefore, JH III transmits signal by either cell membrane receptor or intracellular receptor at different stages in the signaling.
Additional files
-
Supplementary file 1
Names of RTKs identified in H. armigera genome.
- https://cdn.elifesciences.org/articles/97189/elife-97189-supp1-v1.doc
-
Supplementary file 2
Oligonucleotide sequences of PCR primers.
- https://cdn.elifesciences.org/articles/97189/elife-97189-supp2-v1.docx
-
MDAR checklist
- https://cdn.elifesciences.org/articles/97189/elife-97189-mdarchecklist1-v1.pdf
Download links
A two-part list of links to download the article, or parts of the article, in various formats.
Downloads (link to download the article as PDF)
Open citations (links to open the citations from this article in various online reference manager services)
Cite this article (links to download the citations from this article in formats compatible with various reference manager tools)
Receptor tyrosine kinases CAD96CA and FGFR1 function as the cell membrane receptors of insect juvenile hormone
eLife 13:RP97189.
https://doi.org/10.7554/eLife.97189.4


