ATG6 interacting with NPR1 increases Arabidopsis thaliana resistance to Pst DC3000/avrRps4 by increasing its nuclear accumulation and stability
- MOE Key Laboratory of Laser Life Science & Institute of Laser Life Science, Guangdong Provincial Key Laboratory of Laser Life Science, Guangzhou Key Laboratory of Spectral Analysis and Functional Probes, College of Biophotonics, School of Optoelectronic Science and Engineering, South China Normal University, China
- State Key Laboratory of Reproductive Regulation and Breeding of Grassland Livestock, College of Life Sciences, Inner Mongolia University, China
- Key Laboratory of Herbage and Endemic Crop Biotechnology, and College of Life Sciences, Inner Mongolia University, China
Figures
Figure 1 with 2 supplements
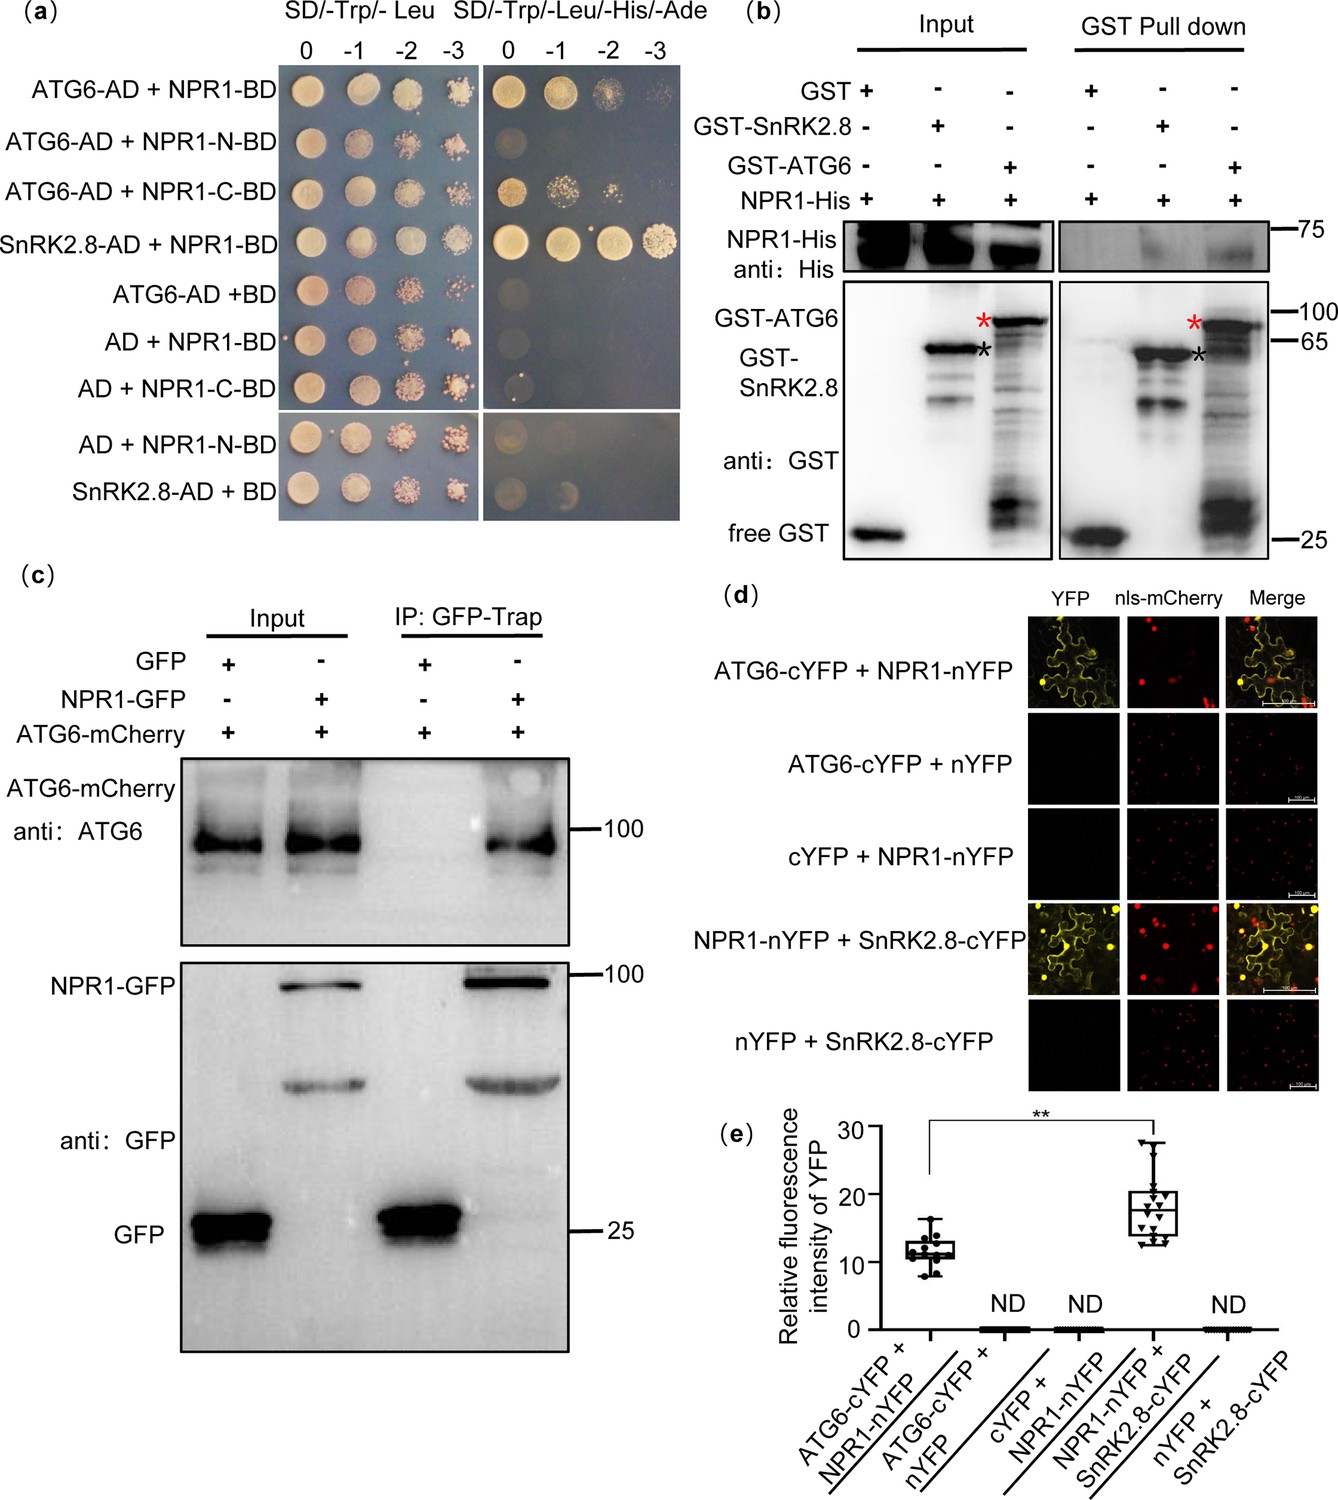
Physical interaction between NPR1 and ATG6.
(a) Interaction of NPR1 with ATG6 in yeast. The CDS of ATG6, NPR1, NPR1-N (1–984 bp), NPR1-C (984–1782 bp), and SnRK2.8 were fused to pGADT7 (AD) and pGBKT7 (BD), respectively. Co-transformation of NPR1-BD + AD, BD + ATG6-AD, BD + SnRK2.8-AD, NPR1-N-BD + AD, and NPR1-C-BD + AD were used as negative controls. The interaction of NPR1-BD and SnRK2.8-AD was used as a positive control. Yeast growth on SD/-Trp-Leu-His-Ade media represents interaction. Numbers represent the dilution fold of yeast. 0, –1 (10-fold dilution), –2 (100-fold dilution), and –3 (1000-fold dilution). (b) In vitro pull-down assays of NPR1-His with GST-ATG6 fusion protein. NPR1-His prokaryotic proteins were incubated with GST-tag Purification Resin conjugated with GST-ATG6, GST, and SnRK2.8-GST. Western blotting analysis with anti-GST and anti-His. Black asterisk indicates SnRK2.8-GST bands. Red asterisk indicates GST-ATG6 bands. (c) Co-immunoprecipitation of NPR1 with ATG6 in vivo. Total protein was extracted from Nicotiana benthamiana transiently transformed with ATG6-mCherry + GFP and ATG6-mCherry + NPR1-GFP, followed by IP with GFP-Trap. Western blots analysis with ATG6 and GFP antibodies. (d) Bimolecular fluorescence complementation assay of NPR1 with ATG6 in N. benthamiana leaves. Agrobacterium carrying ATG6-cYFP and NPR1-nYFP was co-expressed in leaves of N. benthamiana for 3 days. As a positive control, NPR1-nYFP and SnRK2.8-cYFP were co-expressed. As negative controls, nYFP and ATG6-cYFP, NPR1-nYFP and cYFP, nYFP and SnRK2.8-cYFP were co-expressed. Confocal images were obtained from mCherry, YFP. nls-mCherry as a nuclear localization mark. Scale bar = 100 μm. (e) Relative fluorescence intensity of YFP in (d) using ImageJ software, ND means not detected, n = 15 independent images were analyzed to quantify YFP fluorescence. ** indicates that the significant difference compared to the control is at the level of 0.01 (Student’s t-test p value, **p < 0.01). All experiments were performed with three biological replicates.
-
Figure 1—source data 1
Original files for western blot analysis displayed in Figure 1b, c.
- https://cdn.elifesciences.org/articles/97206/elife-97206-fig1-data1-v1.zip
-
Figure 1—source data 2
PDF file containing original western blots for Figure 1b, c, indicating the relevant bands and treatments.
- https://cdn.elifesciences.org/articles/97206/elife-97206-fig1-data2-v1.zip
-
Figure 1—source data 3
Numerical source data files for Figure 1e.
- https://cdn.elifesciences.org/articles/97206/elife-97206-fig1-data3-v1.zip
Figure 1—figure supplement 1
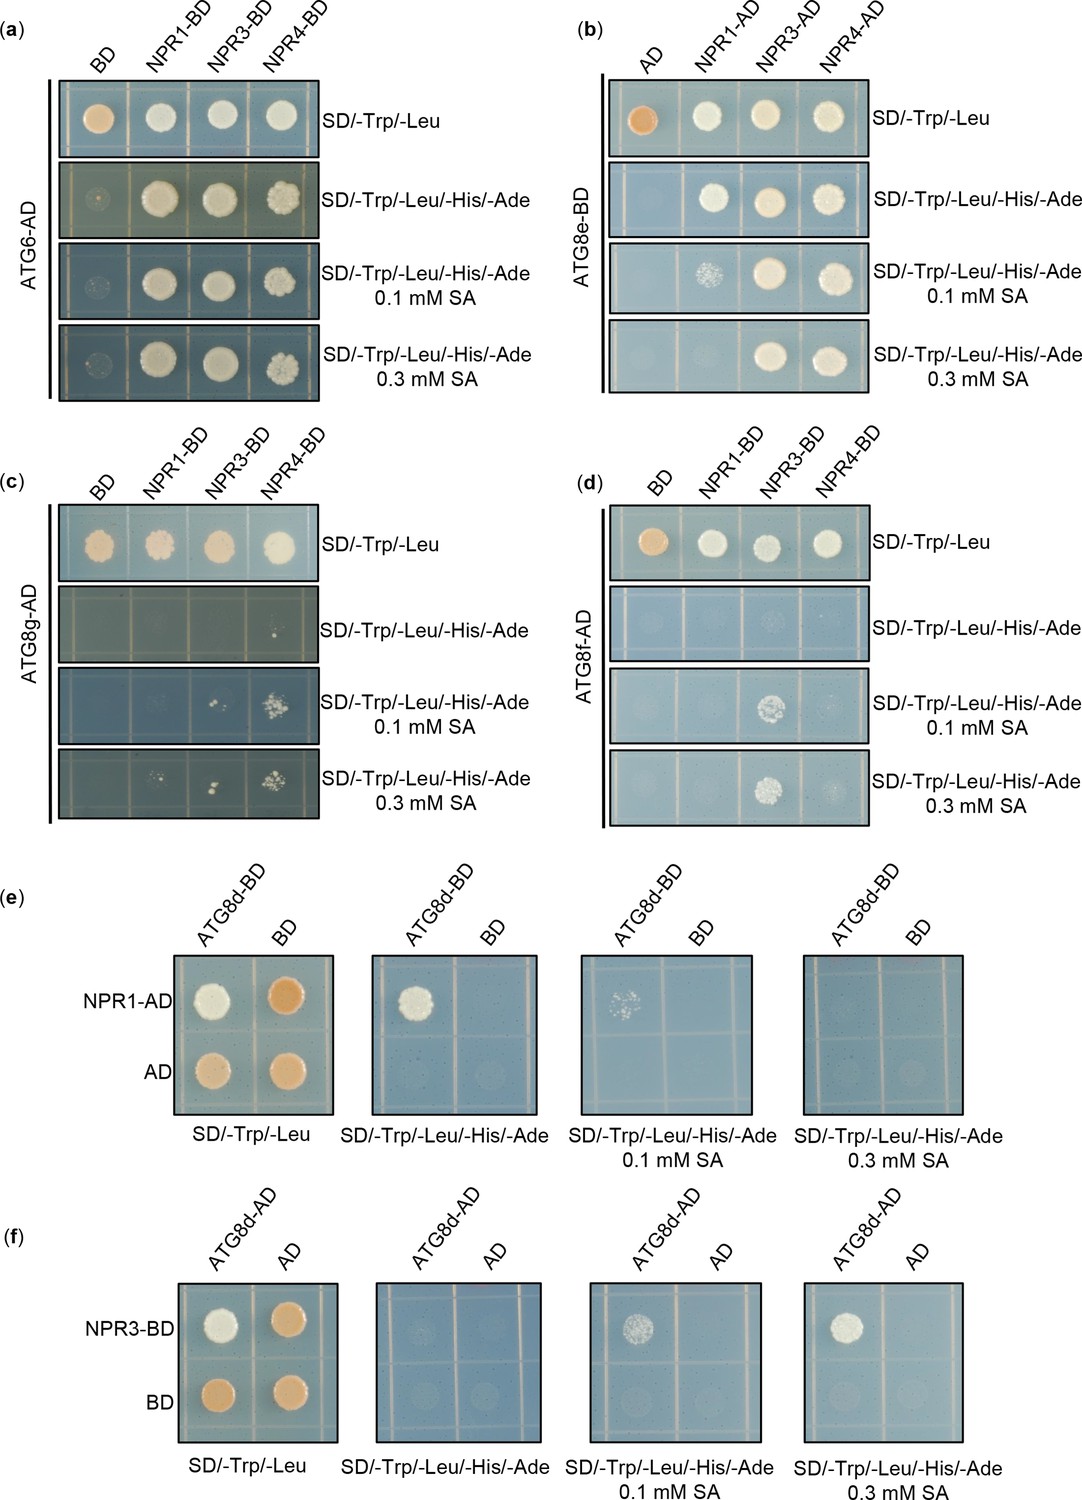
Physical interaction between NPRs and ATGs in yeast.
(a) Interaction of NPR1、NPR3 and NPR4 with ATG6 in yeast, respectively. (b) Interaction of NPR1、NPR3 and NPR4 with ATG8e in yeast, respectively. (c) Interaction of NPR1、NPR3 and NPR4 with ATG8g in yeast, respectively. (d) Interaction of NPR1、NPR3 and NPR4 with ATG8f in yeast, respectively. (e) Interaction of NPR1 with ATG8d in yeast. (f) Interaction of NPR3 with ATG8d in yeast. The CDS of NPR1, NPR3, NPR4, ATG6, and ATG8d-g were fused to the AD and BD domains, respectively, and co-expressed with yeast cells. Yeast cell growth on SD/-Trp-Leu-His-Ade media represents interaction. Add different concentrations of SA to SD/-Trp-Leu-His-Ade medium to verify the effect of SA on their interactions. All experiments were performed with three biological replicates.
Figure 1—figure supplement 2
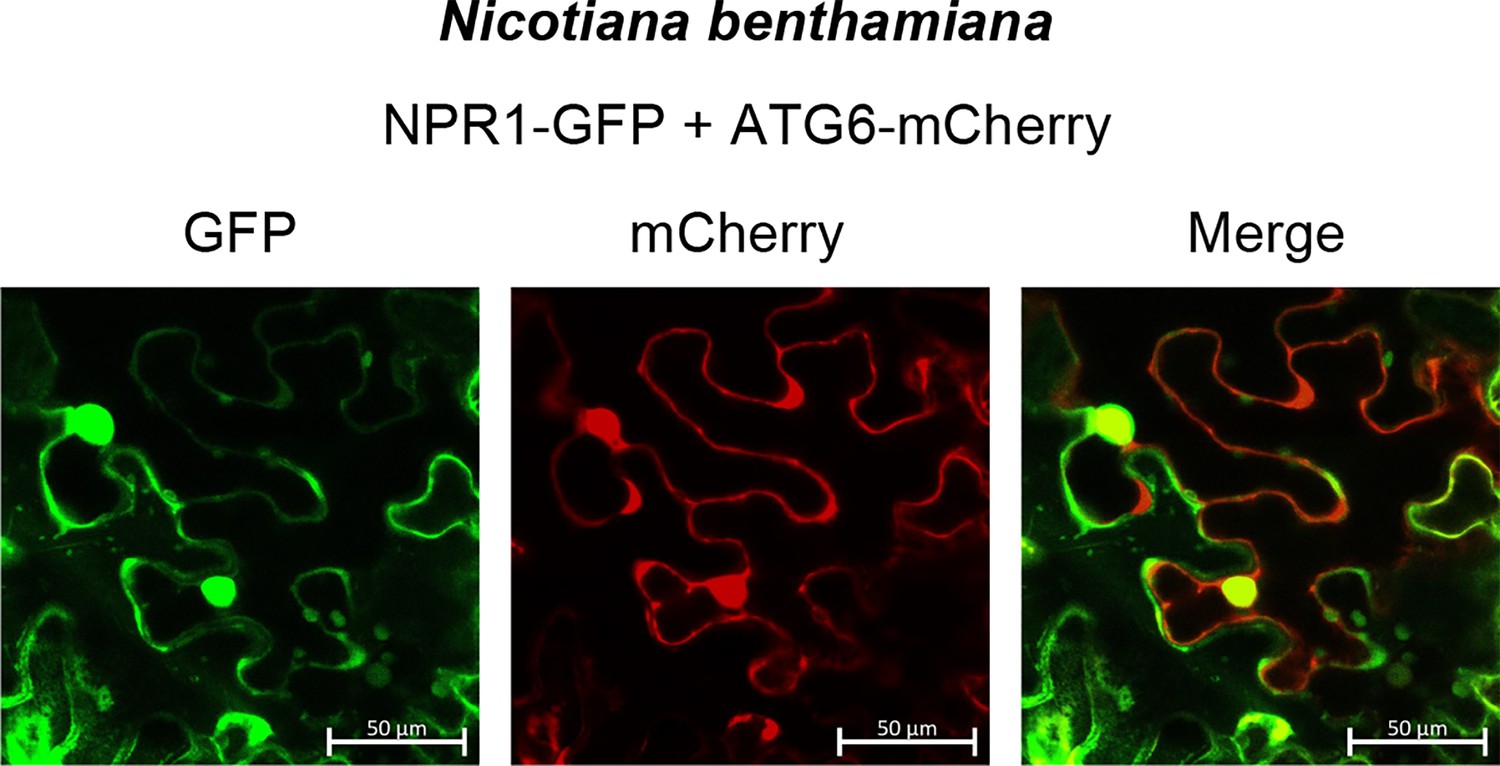
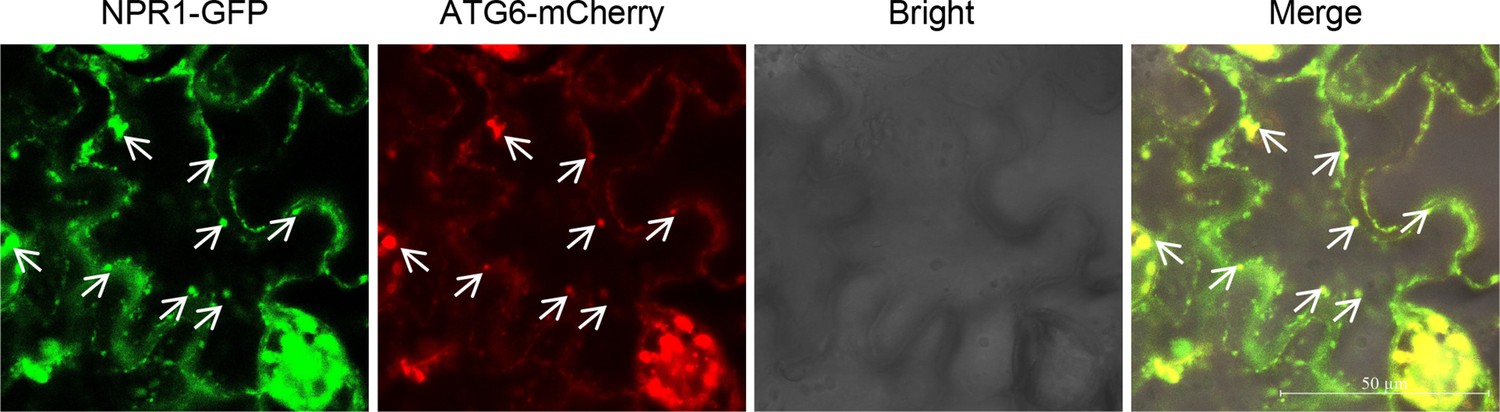
Co-localization of NPR1-GFP and ATG6-mCherry in N. benthamiana.
NPR1-GFP were co-expressed with ATG6-mCherry in N. benthamiana for 3 days followed by confocal observation. Scale bar, 50 μm. Experiment was performed with three biological replicates.
Figure 2 with 3 supplements
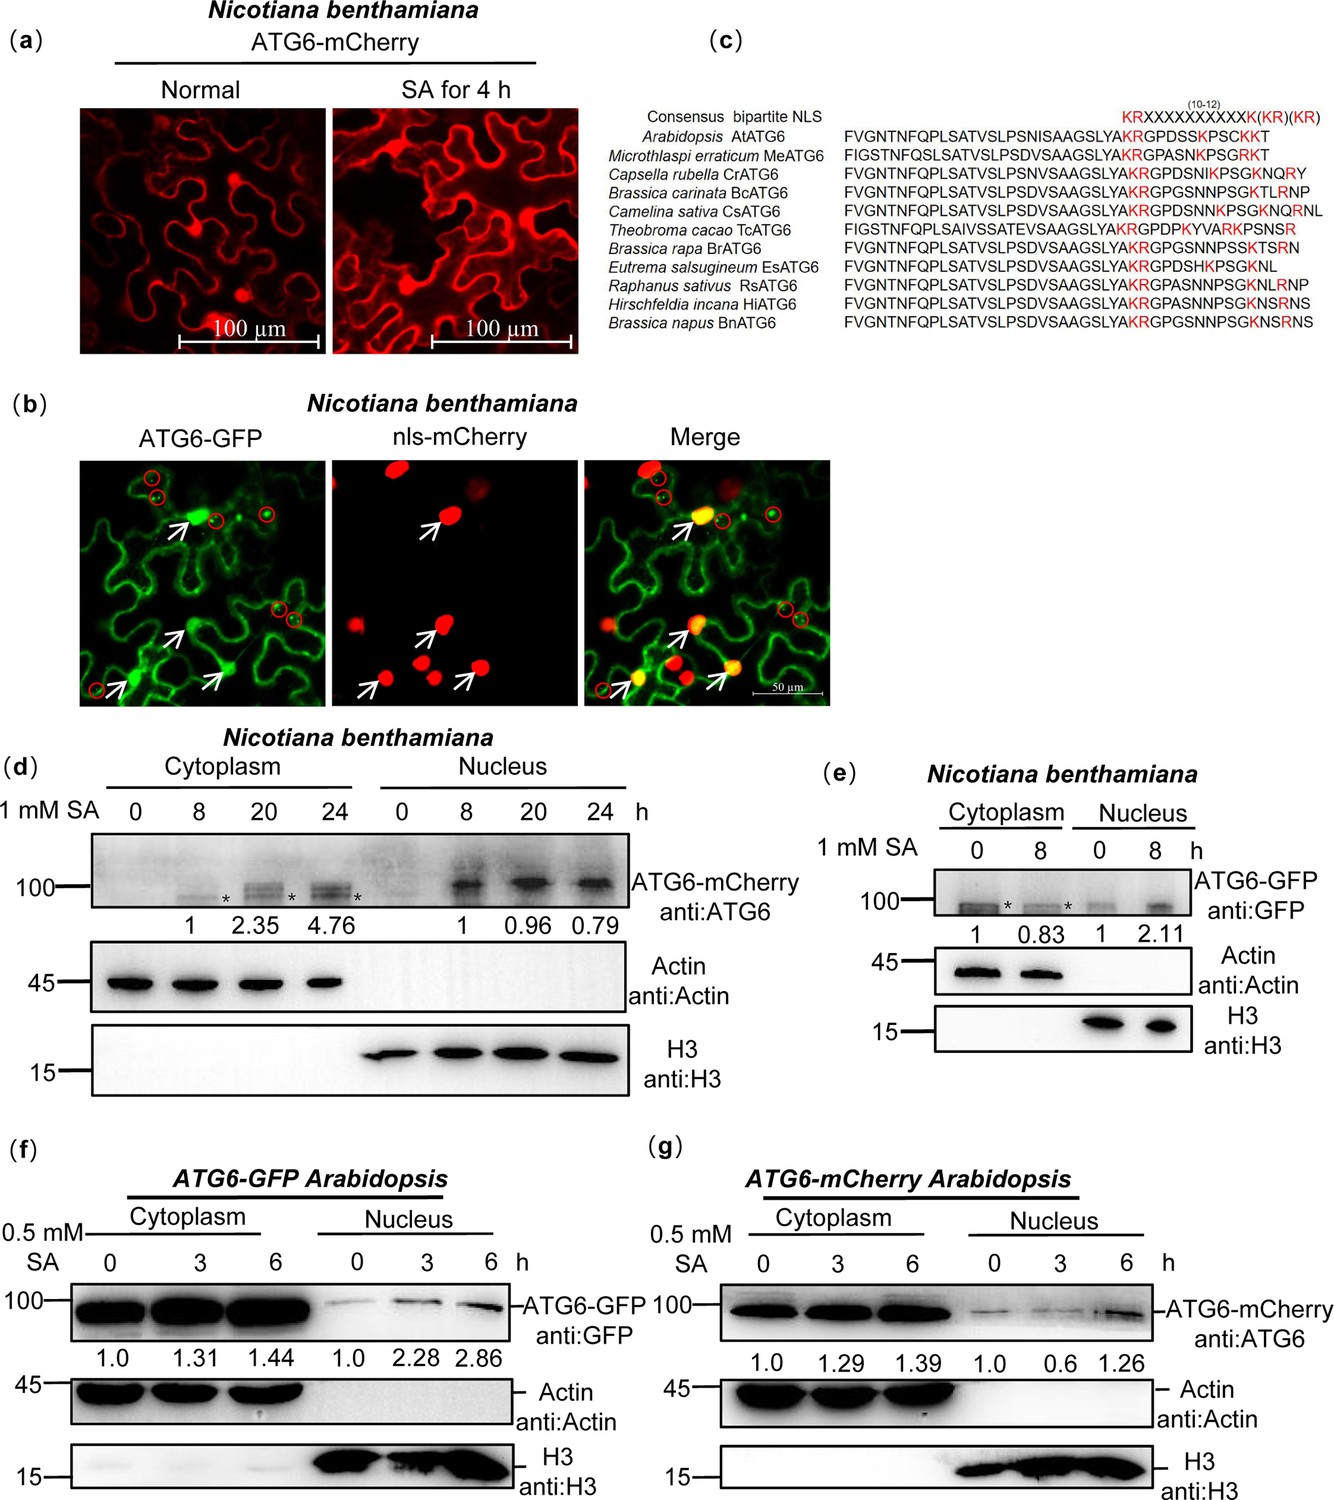
ATG6 is localized in the cytoplasm and nucleus.
(a) The nuclear localization of ATG6-mCherry in N. benthamiana. Scale bar, 100 μm. (b) Co-localization of ATG6-GFP and nls-mCherry in N. benthamiana. Scale bar, 50 μm. (c) ATGs protein nuclear localization sequence analysis using the online NLSExplorer prediction software and sequence comparison of ATG6 C-terminal with other species. (d) Subcellular fractionation of ATG6-mCherry in N. benthamiana after 1 mM SA treatment. Black asterisk (*) indicates ATG6-mCherry bands. (e) Subcellular fractionation of ATG6-GFP in N. benthamiana after 1 mM SA treatment. Black asterisk (*) indicates ATG6-GFP bands. (f) Subcellular fractionation of ATG6-GFP in ATG6-GFP Arabidopsis after 0.5 mM SA treatment. (g) Subcellular fractionation of ATG6-mCherry in ATG6-mCherry Arabidopsis after 0.5 mM SA treatment. In (d–g), ATG6-mCherry (d, g) and ATG6-GFP (e, f) were detected using ATG6 or GFP antibody. Actin and H3 were used as cytoplasmic and nucleus internal reference, respectively. Numerical values indicate quantitative analysis of ATG6-mCherry and ATG6-GFP using ImageJ. All experiments were performed with three biological replicates.
-
Figure 2—source data 1
Original files for western blot analysis displayed in Figure 2d–g.
- https://cdn.elifesciences.org/articles/97206/elife-97206-fig2-data1-v1.zip
-
Figure 2—source data 2
PDF file containing original western blots for Figure 2d–g, indicating the relevant bands and treatments.
- https://cdn.elifesciences.org/articles/97206/elife-97206-fig2-data2-v1.zip
Figure 2—figure supplement 1
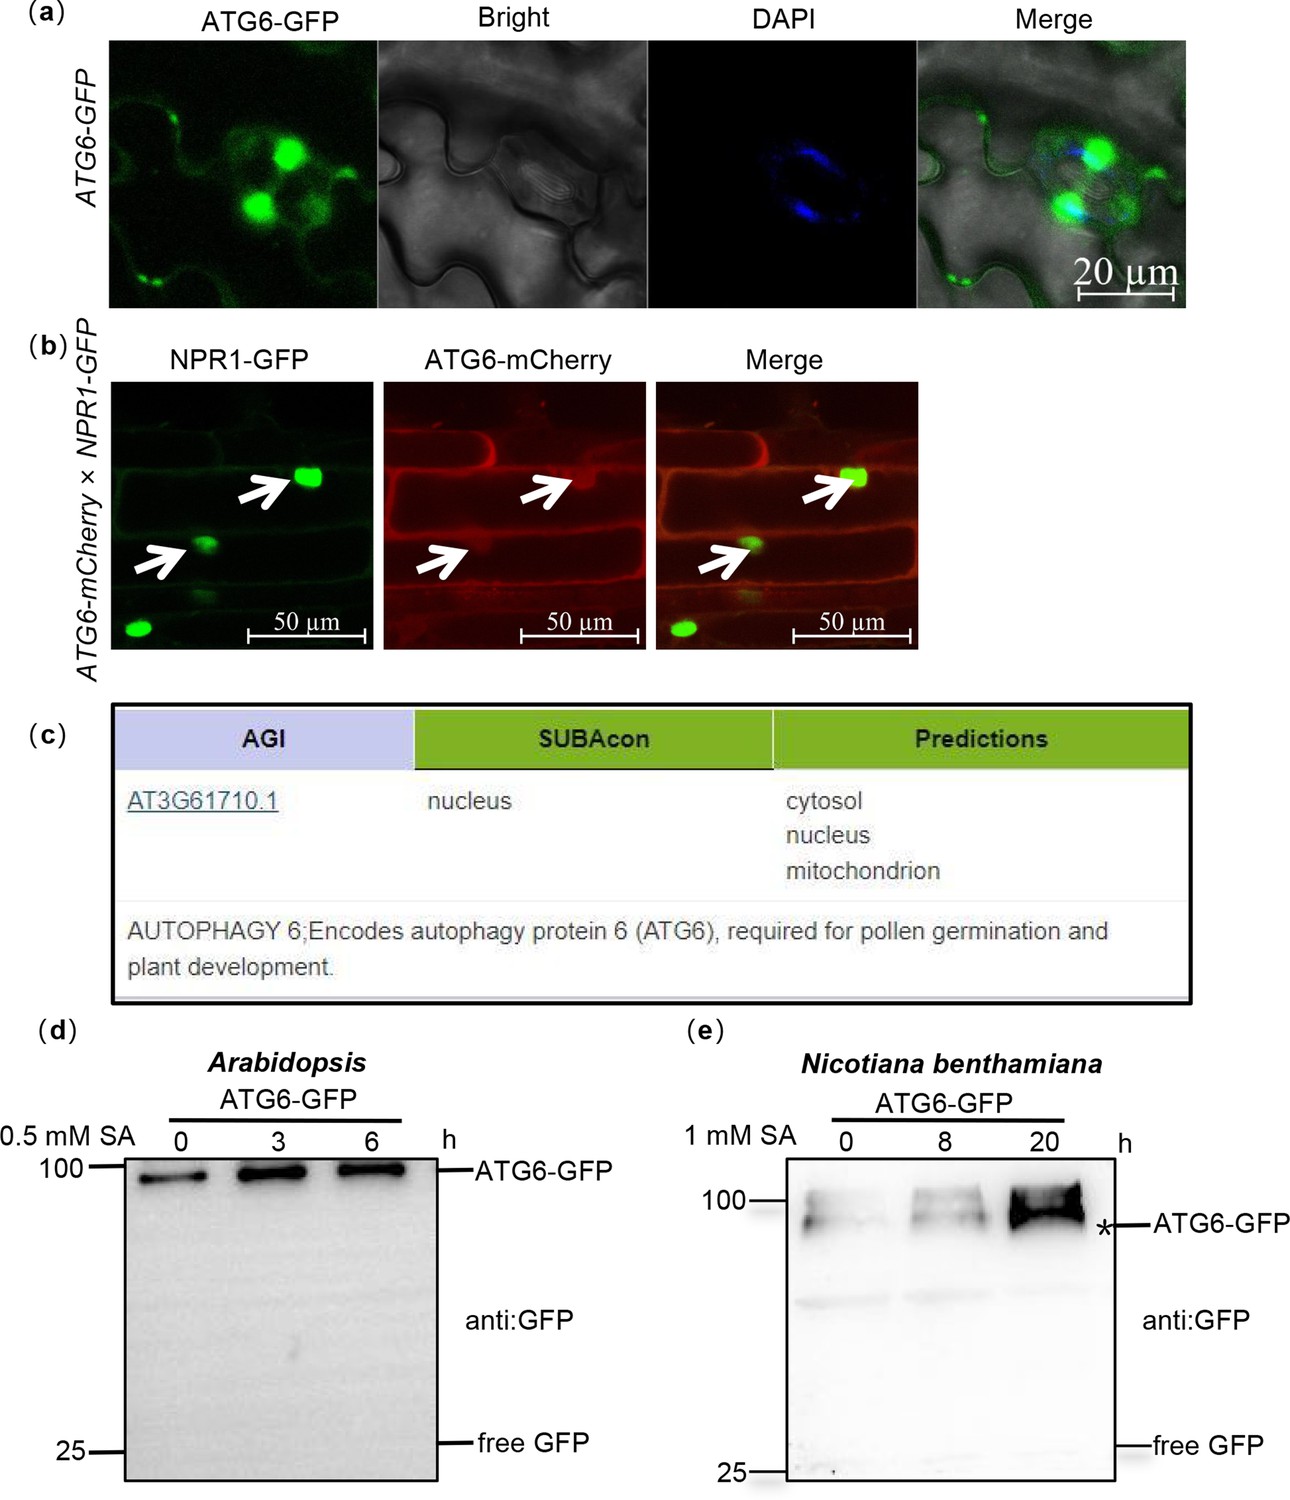
The nuclear localization of ATG6 in Arabidopsis.
(a) The nuclear localization of ATG6-GFP in ATG6-GFP under normal condition. Scale bar, 20 μm. (b) The nuclear localization of ATG6-mCherry in ATG6-mCherry × NPR1-GFP. Scale bar, 50 μm. (c) Predicted subcellular localization of ATG6 by Arabidopsis database (https://suba.live/). (d) ATG6-GFP and free GFP protein levels in ATG6-GFP Arabidopsis. (e) ATG6-GFP and free GFP protein levels in N. benthamiana. Black asterisk (*) indicates ATG6-GFP bands. All experiments were performed with three biological replicates.
-
Figure 2—figure supplement 1—source data 1
Original files for western blot analysis displayed in Figure 2—figure supplement 1d, e.
- https://cdn.elifesciences.org/articles/97206/elife-97206-fig2-figsupp1-data1-v1.zip
-
Figure 2—figure supplement 1—source data 2
PDF file containing original western blots for Figure 2—figure supplement 1d, e, indicating the relevant bands and treatments.
- https://cdn.elifesciences.org/articles/97206/elife-97206-fig2-figsupp1-data2-v1.zip
Figure 2—figure supplement 2
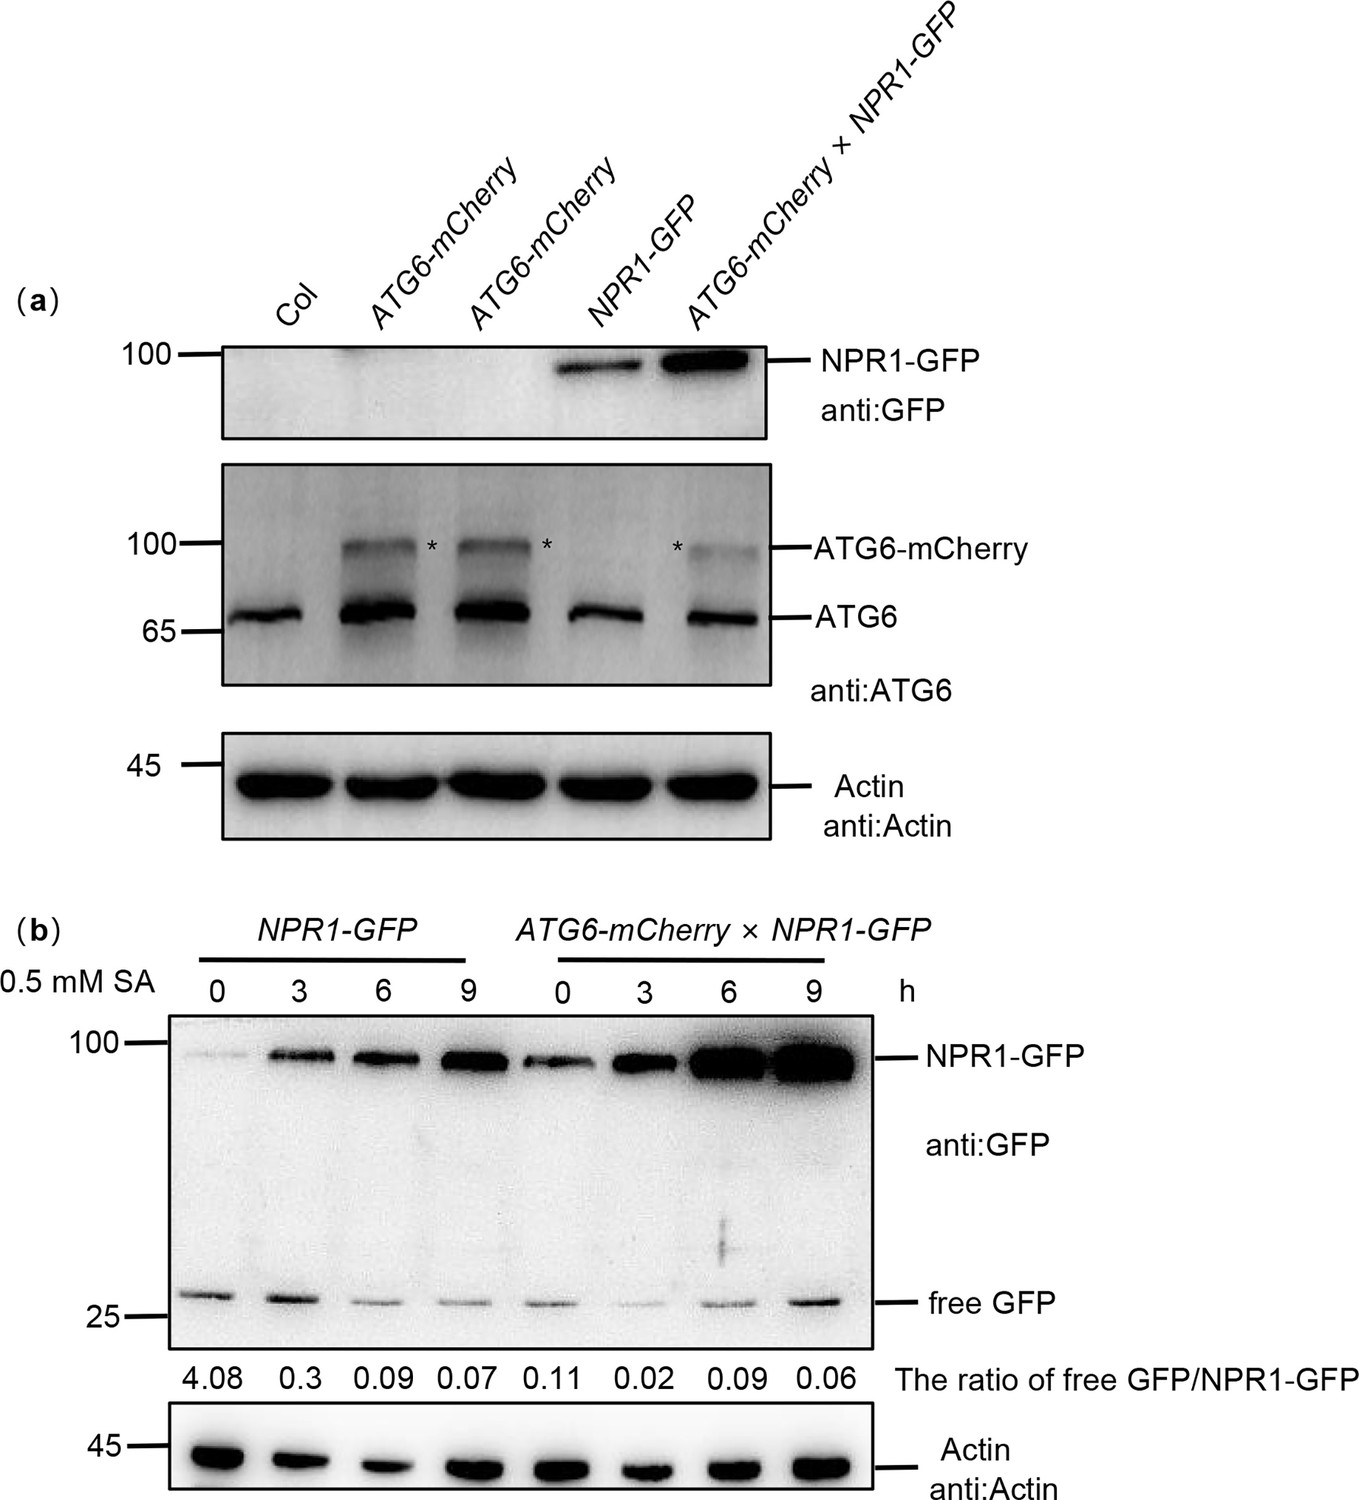
Identification of ATG6-mCherry × NPR1-GFP plants.
(a) Total proteins from 7-day-old seedlings were extracted. Western blot was performed using ATG6 and GFP antibodies. Actin was used as an internal reference. Black asterisk (*) indicates ATG6-GFP bands. (b) NPR1-GFP and free GFP protein levels in 7-day-old seedlings of NPR1-GFP and ATG6-mCherry × NPR1-GFP plants after 0.5 mM SA treatment for 0, 3, 6, and 9 hr. Numerical values indicate the ration of NPR1-GFP/free GFP. All experiments were performed with three biological replicates.
-
Figure 2—figure supplement 2—source data 1
Original files for western blot analysis displayed in Figure 2—figure supplement 2a, b.
- https://cdn.elifesciences.org/articles/97206/elife-97206-fig2-figsupp2-data1-v1.zip
-
Figure 2—figure supplement 2—source data 2
PDF file containing original western blots for Figure 2—figure supplement 2a, b, indicating the relevant bands and treatments.
- https://cdn.elifesciences.org/articles/97206/elife-97206-fig2-figsupp2-data2-v1.zip
Figure 2—figure supplement 3
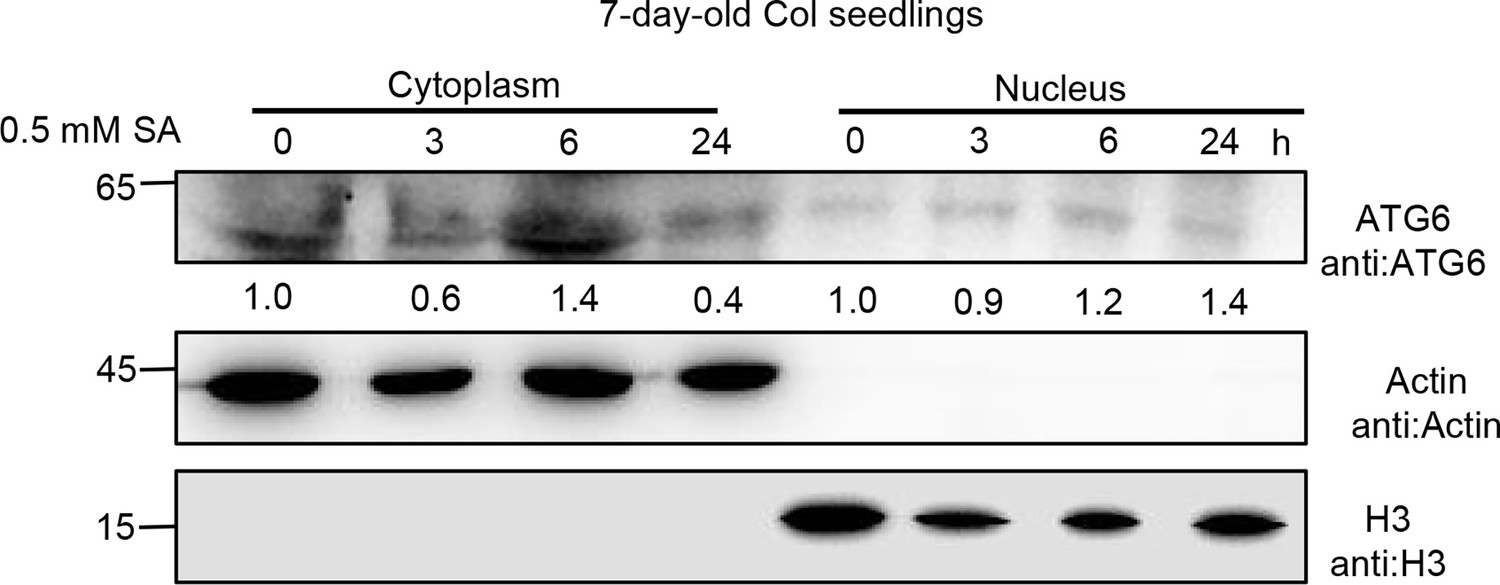
Subcellular fractionation of endogenous ATG6 in Col after 0.5 mM SA treatment for 0, 3, 6, and 24 hr.
Cytoplasmic and nuclear proteins were extracted from Arabidopsis. Endogenous ATG6 were detected using ATG6 antibody. Actin and H3 were used as cytoplasmic and nucleus internal reference, respectively. Numerical values indicate quantitative analysis of ATG6 using ImageJ. Experiment was performed with three biological replicates.
-
Figure 2—figure supplement 3—source data 1
Original files for western blot analysis displayed in Figure 2—figure supplement 3.
- https://cdn.elifesciences.org/articles/97206/elife-97206-fig2-figsupp3-data1-v1.zip
-
Figure 2—figure supplement 3—source data 2
PDF file containing original western blots for Figure 2—figure supplement 3, indicating the relevant bands and treatments.
- https://cdn.elifesciences.org/articles/97206/elife-97206-fig2-figsupp3-data2-v1.zip
Figure 3 with 3 supplements
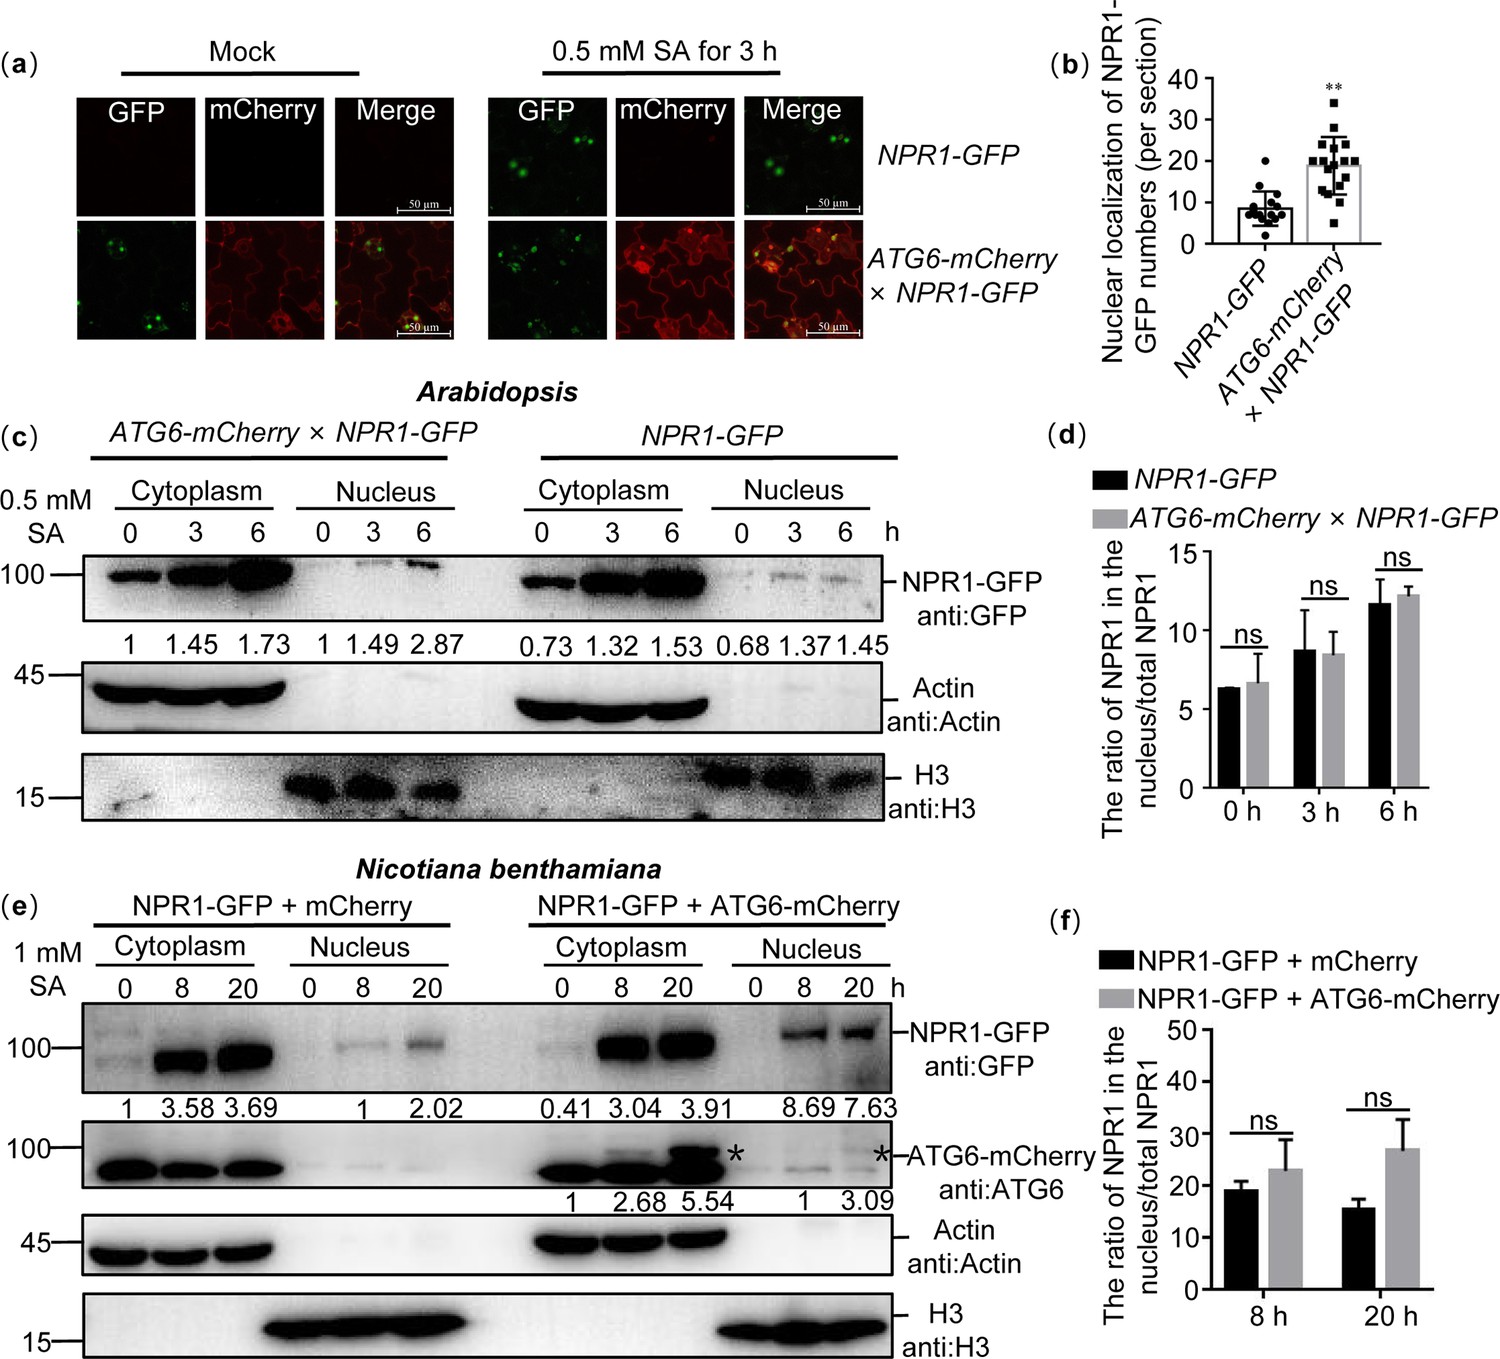
ATG6 increases the nuclear accumulation of NPR1 under SA treatment.
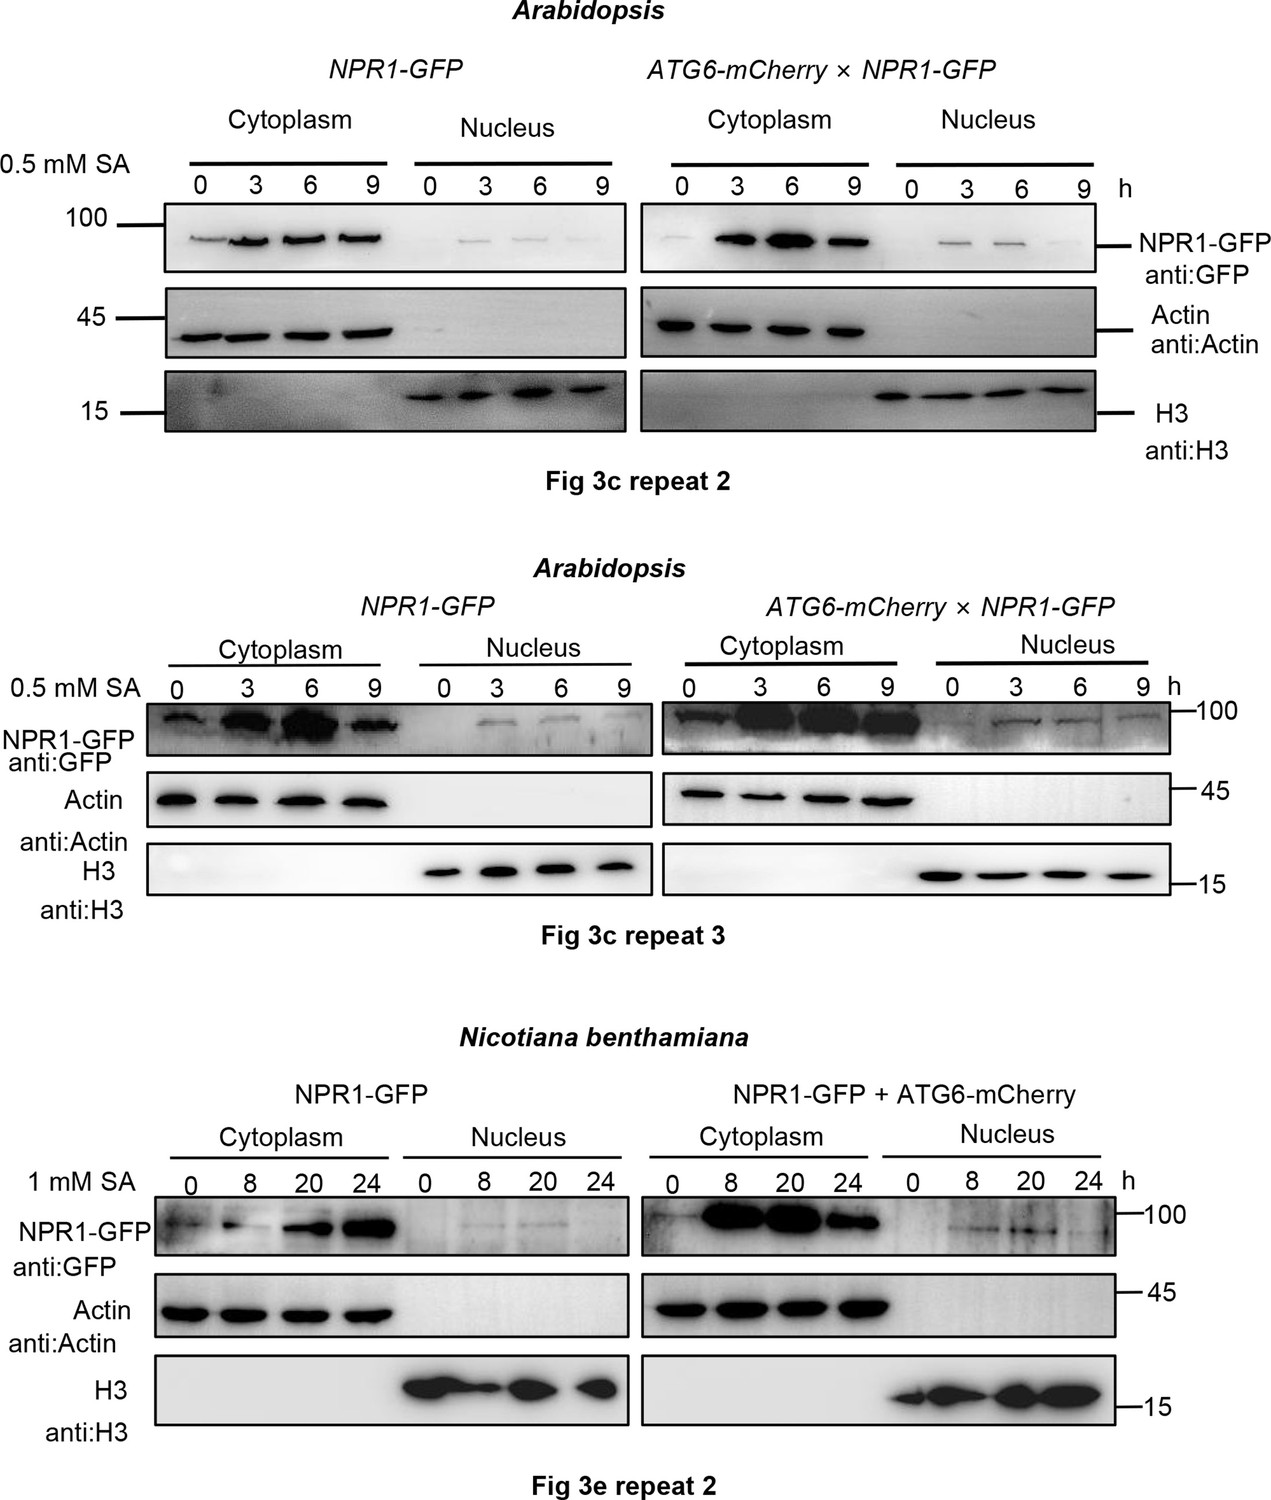
(a) Confocal images of NPR1-GFP nuclear localization in 7-day-old seedlings of NPR1-GFP and ATG6-mCherry × NPR1-GFP under normal and 0.5 mM SA spray for 3 hr. Scale bar, 50 μm. (b) The count of nuclear localizations of NPR1-GFP in ATG6-mCherry × NPR1-GFP and NPR1-GFP Arabidopsis plants following SA treatment in (a). Statistical data were obtained from three independent experiments, each comprising five individual images, resulting in a total of 15 images analyzed for this comparison. ** indicates that the significant difference compared to the control is at the level of 0.01 (Student’s t-test p value, **p < 0.01). (c) Subcellular fractionation of NPR1-GFP in 7-day-old seedlings of NPR1-GFP and ATG6-mCherry × NPR1-GFP after 0.5 mM SA treatment for 0, 3, and 6 hr. (d) The ration of NPR1 in the nucleus/total NPR1 in (c), Student’s t-test was conducted to analyze the data. The mean and standard deviation were calculated from three biological replicates, ns indicates no significant difference. (e) Subcellular fractionation of NPR1-GFP in N. benthamiana after 1 mM SA treatment for 0, 8, and 20 hr. (f) The ration of NPR1 in the nucleus/total NPR1 in (e), Student’s t-test was conducted to analyze the data. The mean and standard deviation were calculated from three biological replicates, ns indicates no significant difference. In (c, e), cytoplasmic and nuclear proteins were extracted from Arabidopsis or N. benthamiana. NPR1-GFP were detected using GFP antibody. Actin and H3 were used as cytoplasmic and nucleus internal reference, respectively. Numerical values indicate quantitative analysis of NPR1-GFP using ImageJ. All experiments were performed with three biological replicates.
-
Figure 3—source data 1
Original files for western blot analysis displayed in Figure 3c, e.
- https://cdn.elifesciences.org/articles/97206/elife-97206-fig3-data1-v1.zip
-
Figure 3—source data 2
PDF file containing original western blots for Figure 3c, e, indicating the relevant bands and treatments.
- https://cdn.elifesciences.org/articles/97206/elife-97206-fig3-data2-v1.zip
-
Figure 3—source data 3
Numerical source data files for Figure 3b, d, f.
- https://cdn.elifesciences.org/articles/97206/elife-97206-fig3-data3-v1.zip
Figure 3—figure supplement 1
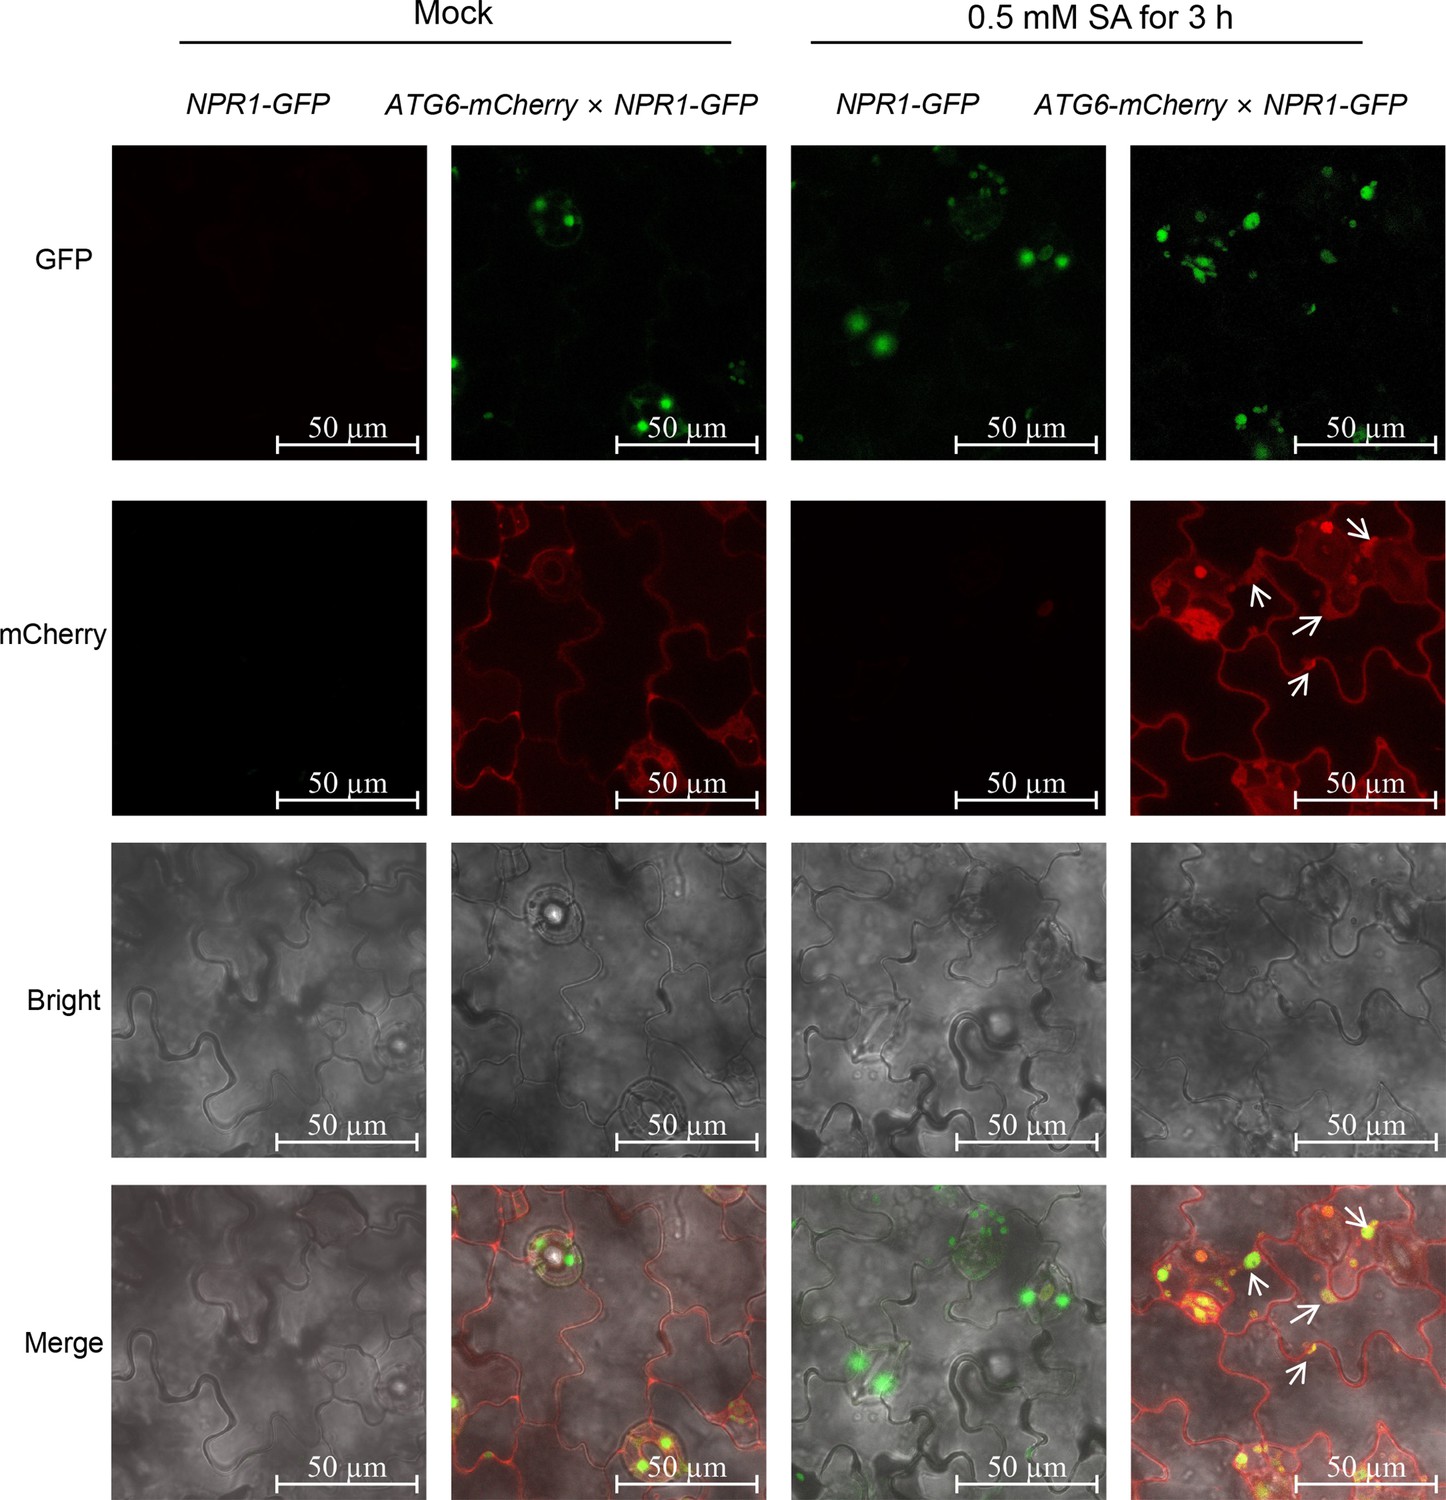
Confocal images of NPR1-GFP nuclear localization in 7-day-old seedlings of NPR1-GFP and ATG6-mCherry × NPR1-GFP under normal and 0.5 mM SA spray for 3 hr.
Scale bar, 50 μm. Experiment was performed with three biological replicates.
Figure 3—figure supplement 2
ATG6 increases the nuclear accumulation of NPR1 under SA treatment.
Replicate experiments at Figure 3c, e. (Figure 3c) Subcellular fractionation of NPR1-GFP in 7-day-old seedlings of NPR1-GFP and ATG6-mCherry × NPR1-GFP after 0.5 mM SA treatment for 0, 3, and 6 hr. (Figure 3e) Subcellular fractionation of NPR1-GFP in N. benthamiana after 1 mM SA treatment for 0, 8, 20, and 24 hr.
-
Figure 3—figure supplement 2—source data 1
Original files for western blot analysis displayed in Figure 3—figure supplement 2.
- https://cdn.elifesciences.org/articles/97206/elife-97206-fig3-figsupp2-data1-v1.zip
-
Figure 3—figure supplement 2—source data 2
PDF file containing original western blots for Figure 3—figure supplement 2, indicating the relevant bands and treatments.
- https://cdn.elifesciences.org/articles/97206/elife-97206-fig3-figsupp2-data2-v1.zip
Figure 3—figure supplement 3
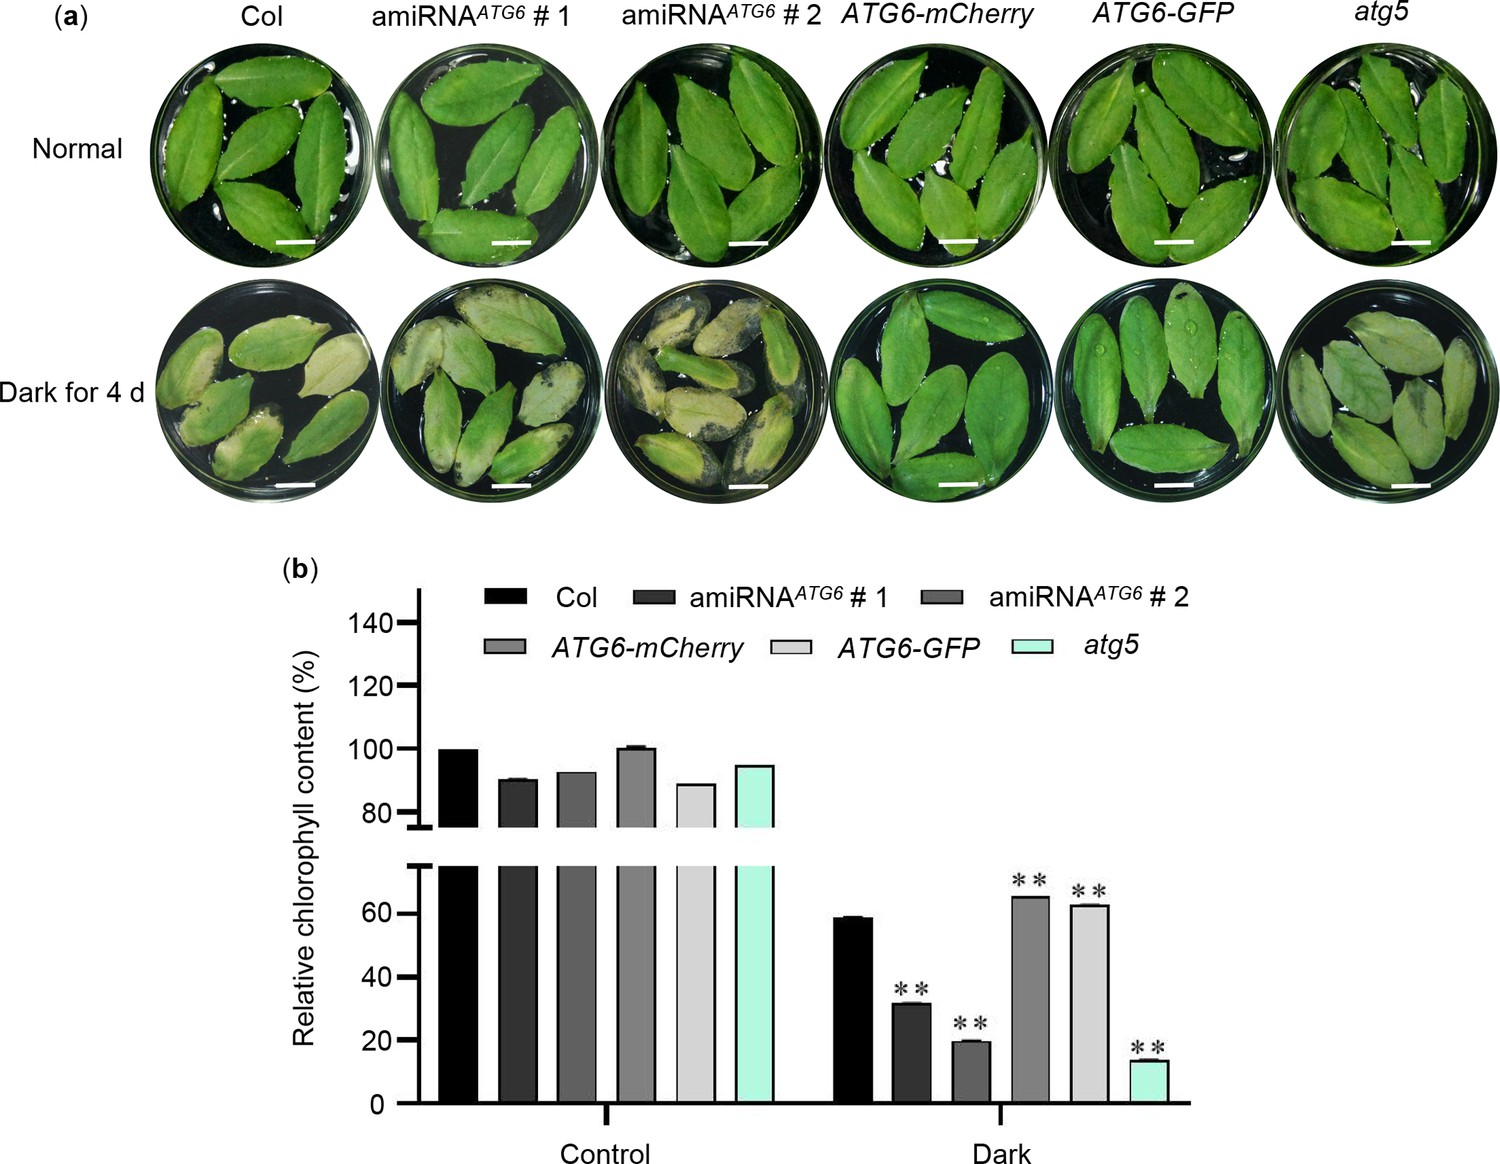
Overexpression of ATG6 delayed dark-induced leaf senescence.
(a) Phenotypes of detached rosette leaves from 3-week-old of Col, amiRNAATG6 # 1, amiRNAATG6 # 2, ATG6-mCherry, ATG6-GFP, and atg5 under constant dark treatment for 4 days. Bar = 1 cm. (b) Relative chlorophyll content in (a). ** indicates that the significant difference compared to the Col is at the level of 0.01 (Student’s t-test p value, **p < 0.01). Experiment was performed with three biological replicates.
-
Figure 3—figure supplement 3—source data 1
Numerical source data files for Figure 3—figure supplement 3b.
- https://cdn.elifesciences.org/articles/97206/elife-97206-fig3-figsupp3-data1-v1.zip
Figure 4 with 3 supplements
ATG6 increases endogenous SA levels and promotes the expression of NPR1 downstream target genes.
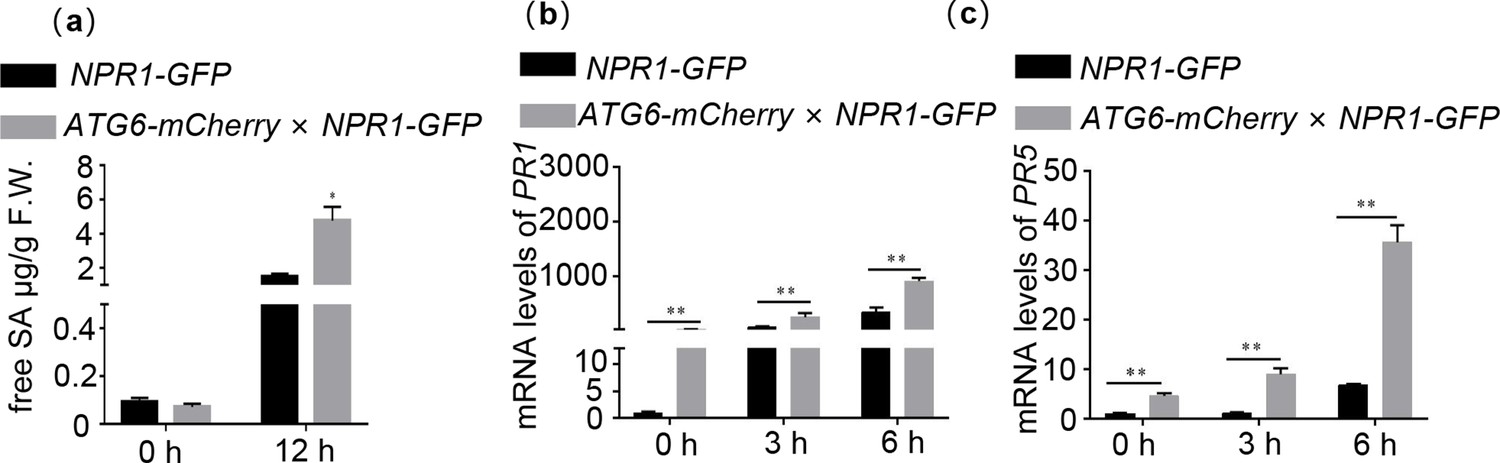
(a) Level of free SA in 3-week-old NPR1-GFP and ATG6-mCherry × NPR1-GFP after Pst DC3000/avrRps4 for 12 hr. Expression of PR1 (b) and PR5 (c) in 3-week-old NPR1-GFP and ATG6-mCherry × NPR1-GFP under normal and SA treatment conditions, values are means ± SD (n = 3 biological replicates). The AtActin gene was used as the internal control. * or ** indicates that the significant difference compared to the control is at the level of 0.05 or 0.01 (Student’s t-test p value, *p < 0.05 or **p < 0.01). All experiments were performed with three biological replicates.
-
Figure 4—source data 1
Numerical source data files for Figure 4a–c.
- https://cdn.elifesciences.org/articles/97206/elife-97206-fig4-data1-v1.zip
Figure 4—figure supplement 1
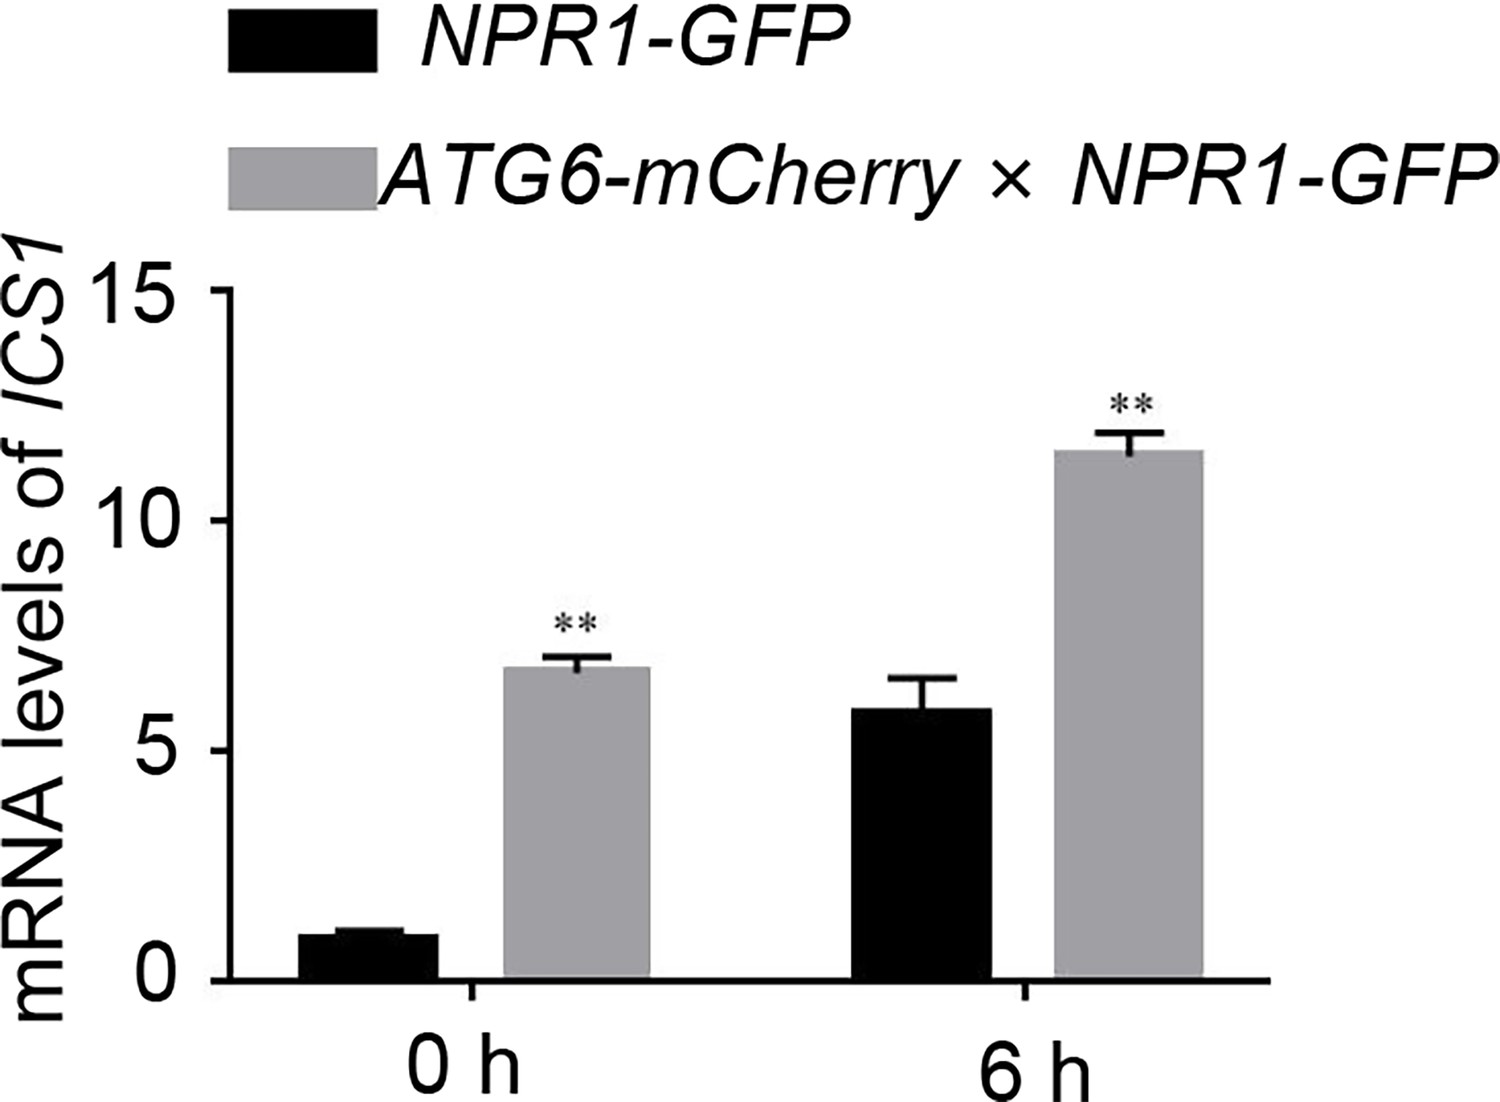
Expression of ICS1 in 3-week-old NPR1-GFP and ATG6-mCherry × NPR1-GFP under normal and 0.5 mM SA treatment conditions.
Values are means ± SD (n = 3 biological replicates). The AtActin gene was used as the internal control. ** indicates that the significant difference compared to the control is at the level of 0.01 (Student’s t-test p value, **p < 0.01). Experiment was performed with three biological replicates.
-
Figure 4—figure supplement 1—source data 1
Numerical source data files for Figure 4—figure supplement 1.
- https://cdn.elifesciences.org/articles/97206/elife-97206-fig4-figsupp1-data1-v1.zip
Figure 4—figure supplement 2
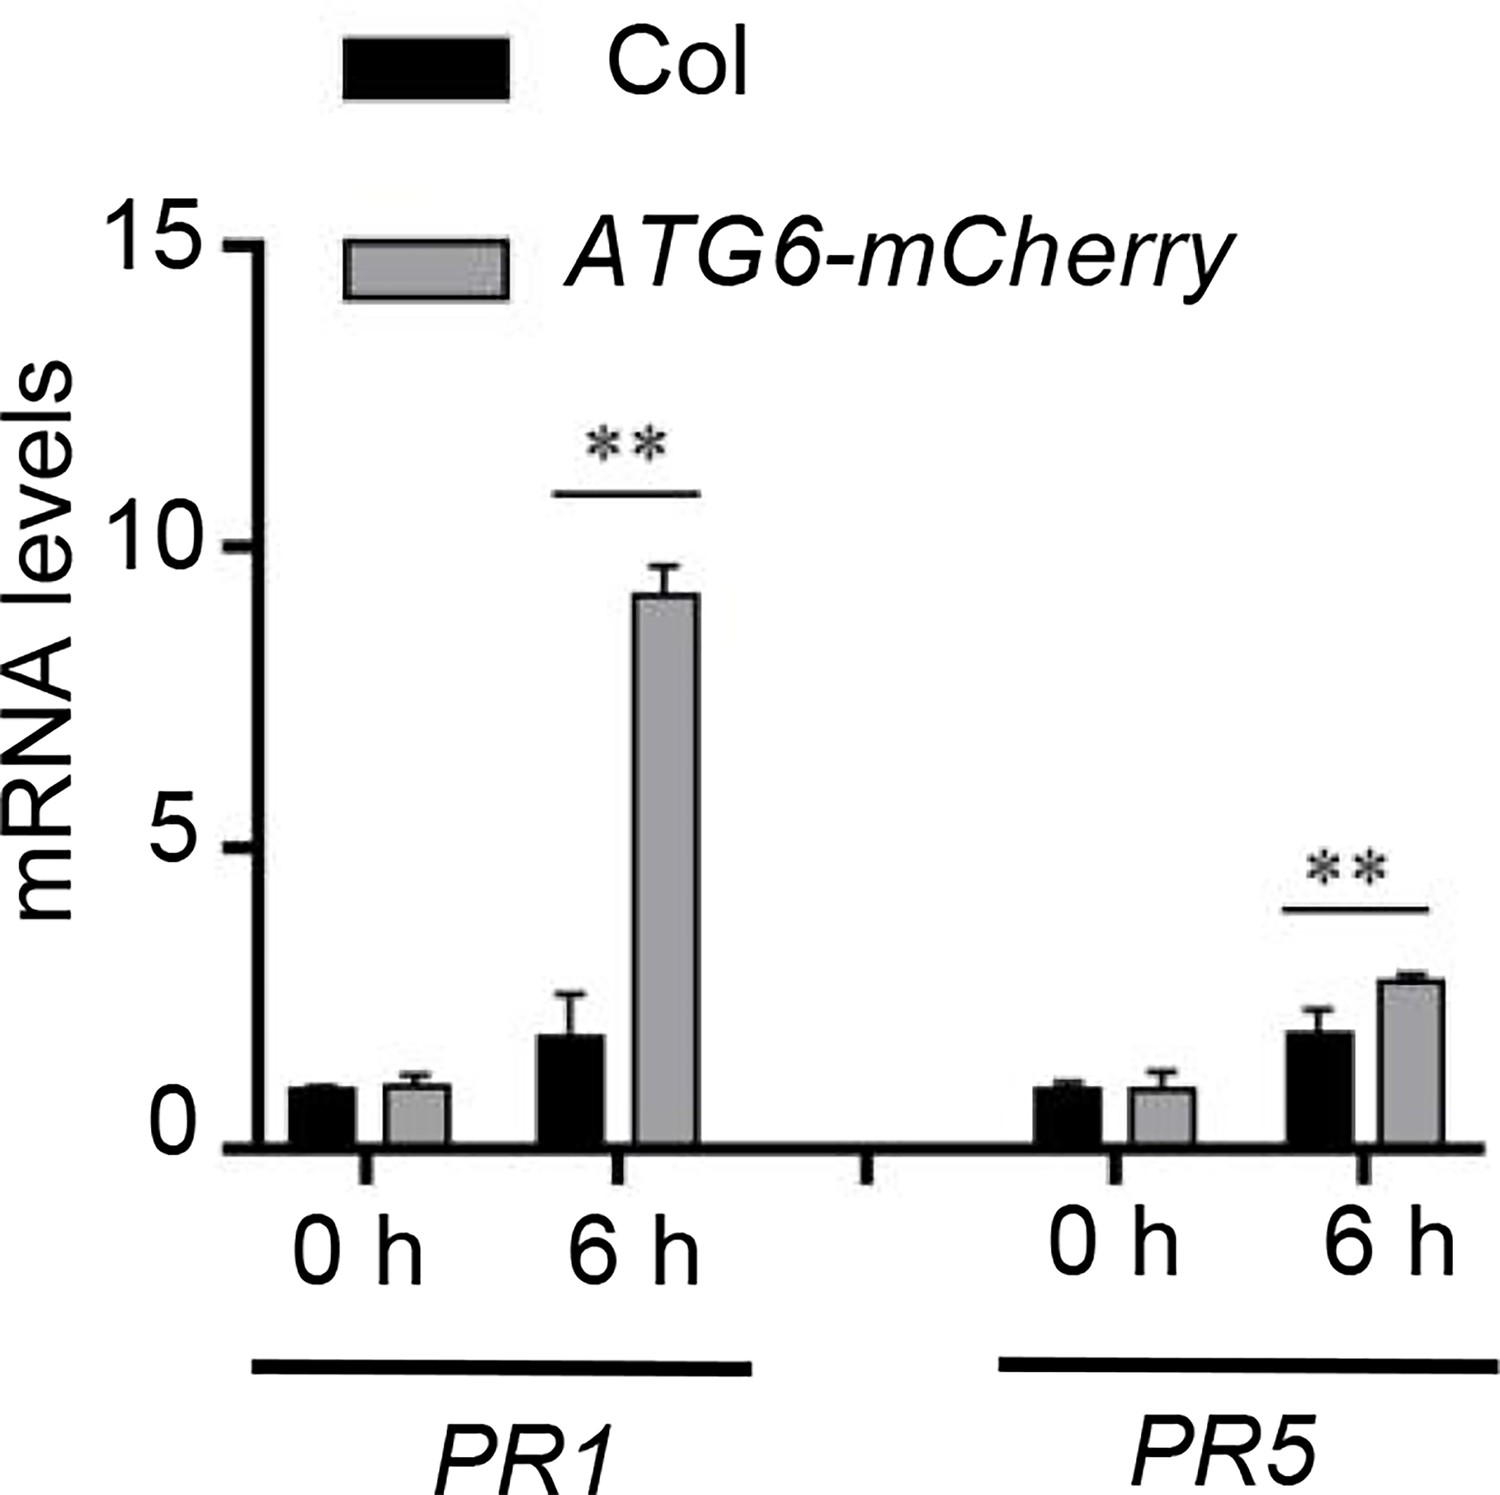
Expression of PR1 and PR5 in Col and ATG6-mCherry under normal and Pst DC3000/avrRps4 treatment.
Values are means ± SD (n = 3 biological replicates). The AtActin gene was used as the internal control. ** indicates that the significant difference compared to the control is at the level of 0.01 (Student’s t-test p value, **p < 0.01). Experiment was performed with three biological replicates.
-
Figure 4—figure supplement 2—source data 1
Numerical source data files for Figure 4—figure supplement 2.
- https://cdn.elifesciences.org/articles/97206/elife-97206-fig4-figsupp2-data1-v1.zip
Figure 4—figure supplement 3

Structural analysis of acidic activation domains (AADs) in ATG6. Acidic (red) and hydrophobic (blue) amino acid residues in AADs.
Figure 5 with 3 supplements
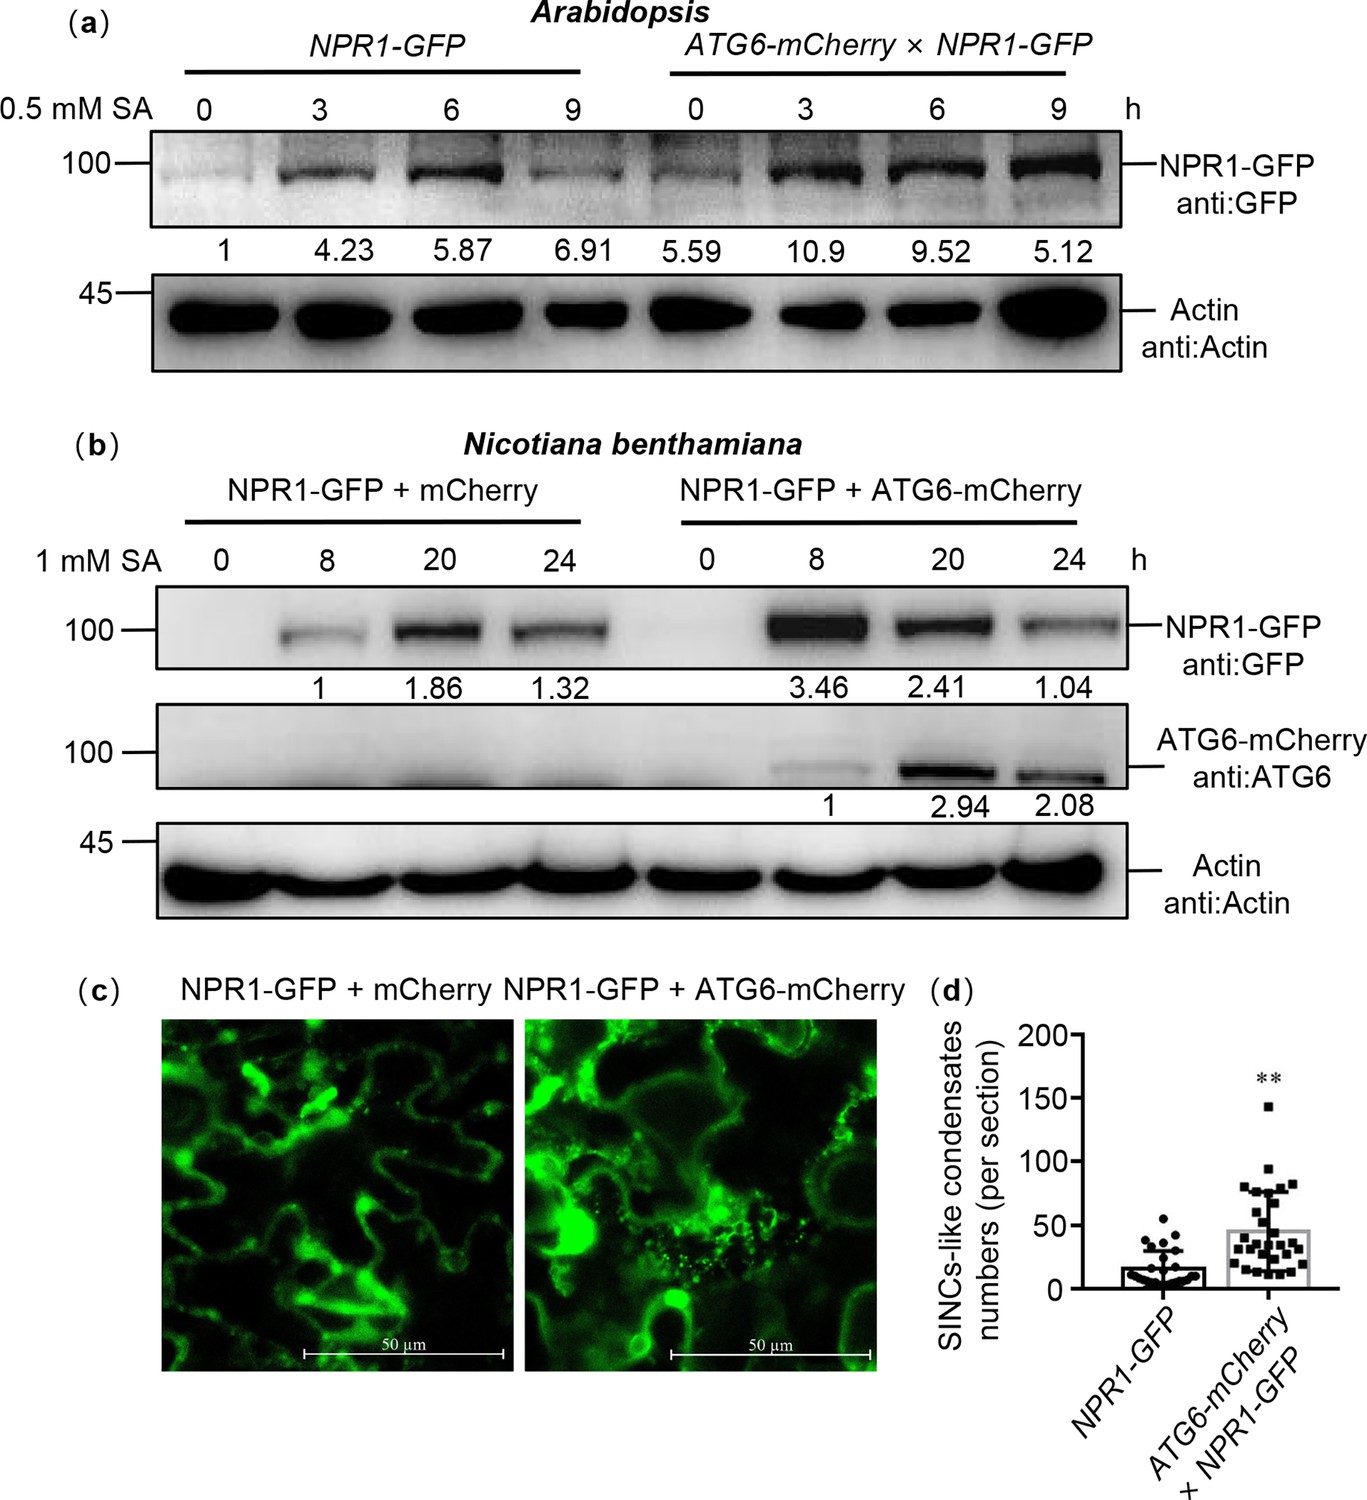
ATG6 increases the NPR1 protein levels and the formation of SINCs-like condensates.
(a) NPR1-GFP protein levels in 7-day-old seedlings of NPR1-GFP and ATG6-mCherry × NPR1-GFP after 0.5 mM SA treatment for 0, 3, 6, and 9 hr. Numerical values indicate quantitative analysis of NPR1-GFP protein using ImageJ. (b) NPR1-GFP protein levels in N. benthamiana. ATG6-mCherry + NPR1-GFP, NPR1-GFP + mCherry were co-expressed in N. benthamiana. After 2 days, leaves were treated with 1 mM SA for 8, 20, and 24 hr. Total proteins were extracted and analyzed. Numerical values indicate quantitative analysis of NPR1-GFP protein using ImageJ. (c) ATG6 promotes the formation of SINCs-like condensates. ATG6-mCherry + NPR1-GFP, NPR1-GFP + mCherry were co-expressed in N. benthamiana. After 2 days, leaves were treated with 1 mM SA for 24 hr. Confocal images obtained at excitation with wavelengths of 488 nm, scale bar = 50 μm. (d) SINCs-like condensates numbers of per section in (c), n > 10 sections. ** indicates that the significant difference compared to the control is at the level of 0.01 (Student’s t-test p value, **p < 0.01). All experiments were performed with three biological replicates.
-
Figure 5—source data 1
Original files for western blot analysis displayed in Figure 5a, b.
- https://cdn.elifesciences.org/articles/97206/elife-97206-fig5-data1-v1.zip
-
Figure 5—source data 2
PDF file containing original western blots for Figure 5a, b, indicating the relevant bands and treatments.
- https://cdn.elifesciences.org/articles/97206/elife-97206-fig5-data2-v1.zip
-
Figure 5—source data 3
Numerical source data files for Figure 5d.
- https://cdn.elifesciences.org/articles/97206/elife-97206-fig5-data3-v1.zip
Figure 5—figure supplement 1
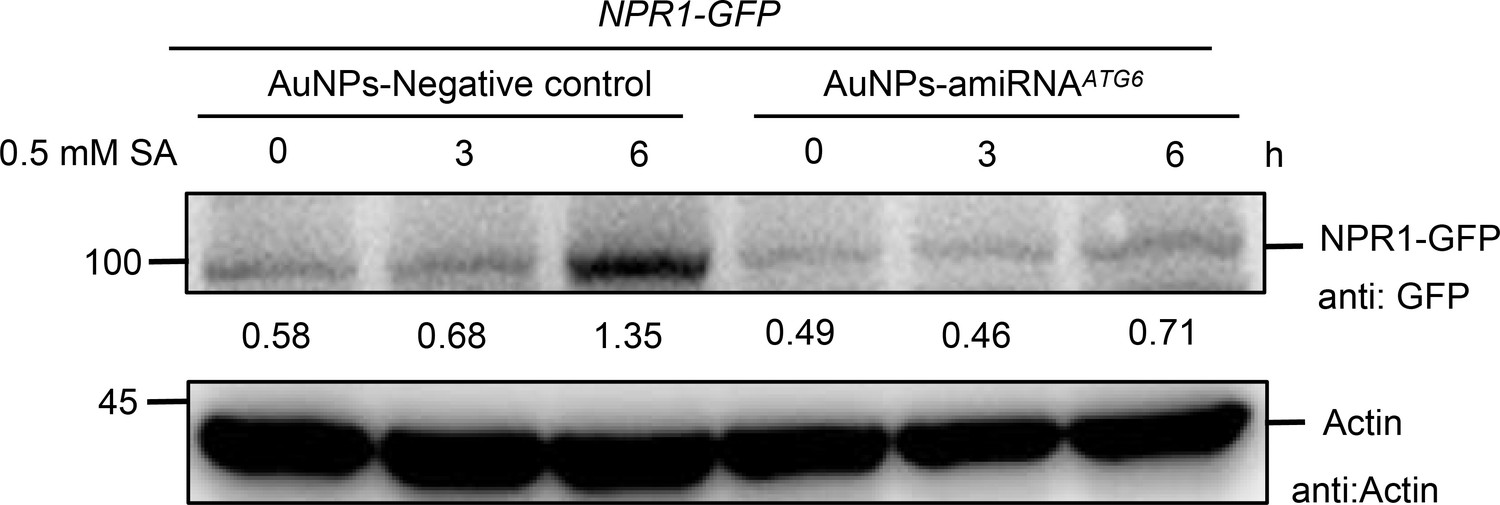
The protein level of NPR1-GFP in NPR1-GFP/silencing ATG6 and NPR1-GFP/Negative control.
The mixture of AuNPs-amiRNAATG6 or AuNPs-amiRNANgeative control was performed by pressure infiltration through the abaxial leaf surface. After 3 days, NPR1-GFP protein levels were detected by treating with 0.5 mM SA for 0, 3, and 6 hr. Experiment was performed with three biological replicates.
-
Figure 5—figure supplement 1—source data 1
Original files for western blot analysis displayed in Figure 5—figure supplement 1.
- https://cdn.elifesciences.org/articles/97206/elife-97206-fig5-figsupp1-data1-v1.zip
-
Figure 5—figure supplement 1—source data 2
PDF file containing original western blots for Figure 5—figure supplement 1, indicating the relevant bands and treatments.
- https://cdn.elifesciences.org/articles/97206/elife-97206-fig5-figsupp1-data2-v1.zip
Figure 5—figure supplement 2
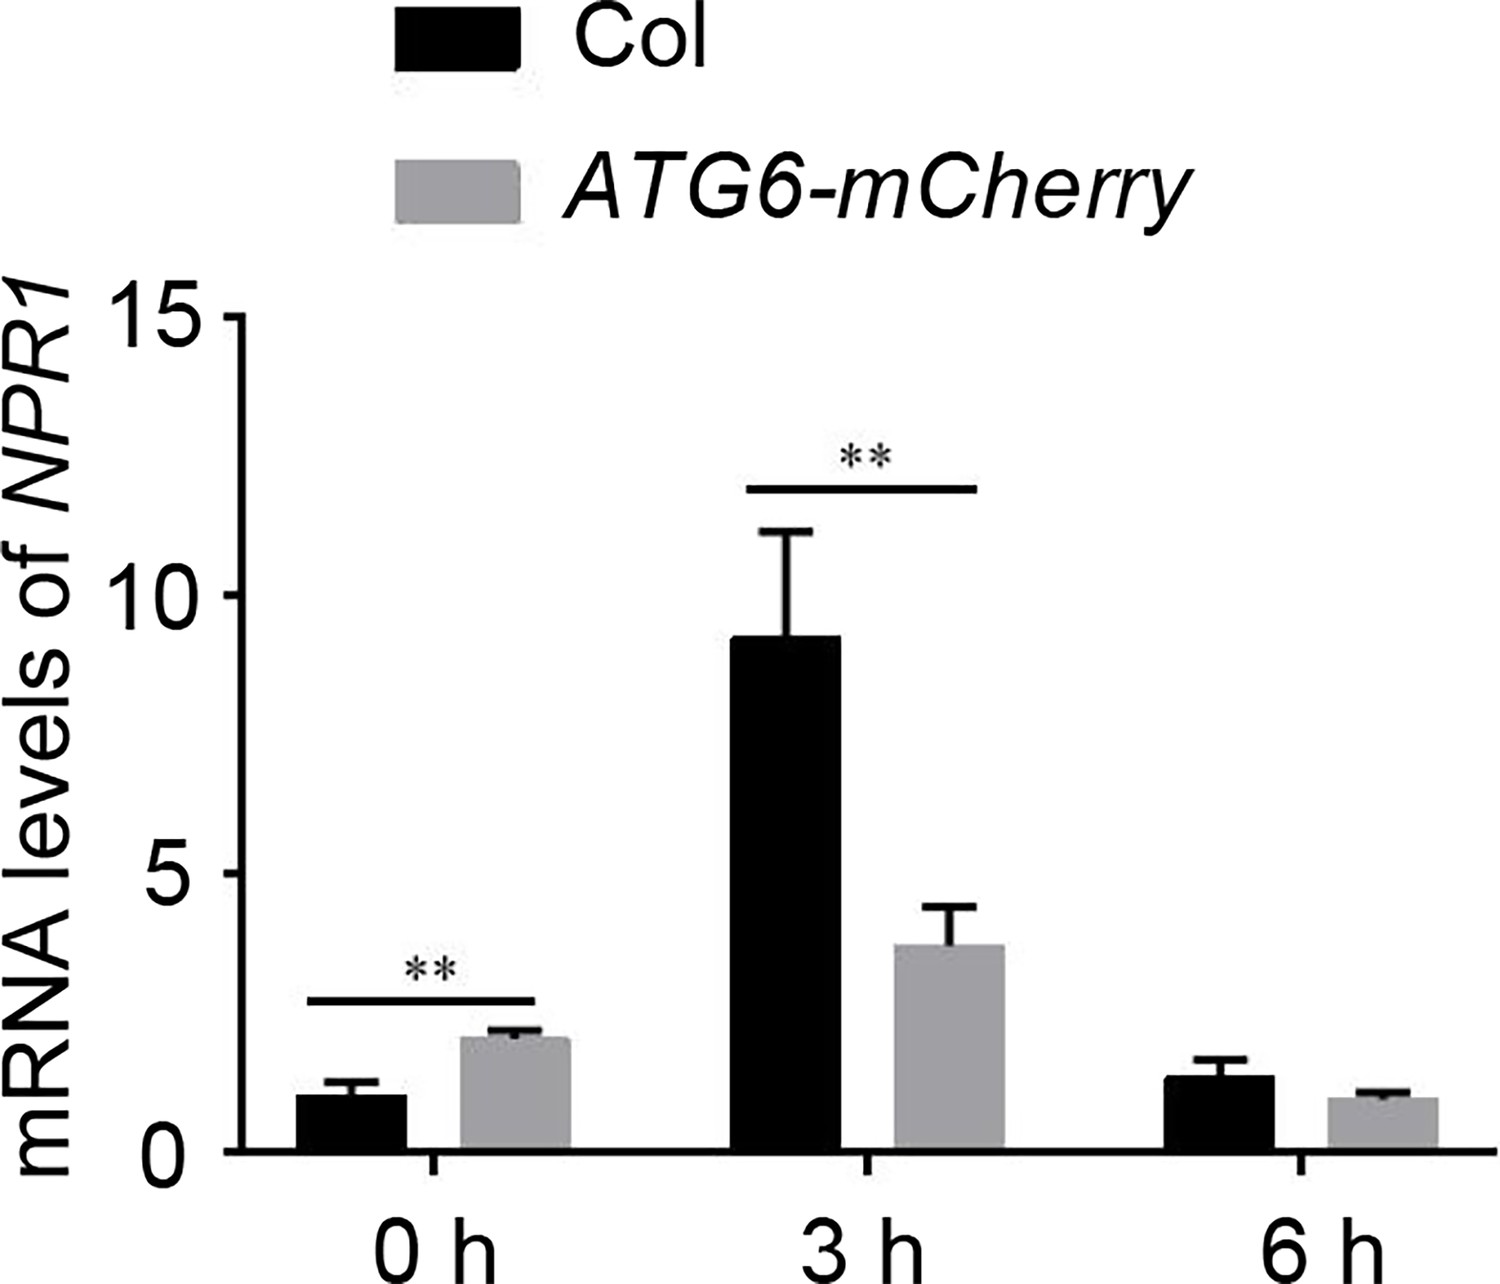
Expression of NPR1 in Col and ATG6-mCherry under normal and Pst DC3000/avrRps4 treatment.
Values are means ± SD (n = 3 biological replicates). The AtActin gene was used as the internal control. ** indicates that the significant difference compared to the control is at the level of 0.01 (Student’s t-test p value, **p < 0.01). Experiment was performed with three biological replicates.
-
Figure 5—figure supplement 2—source data 1
Numerical source data files for Figure 5—figure supplement 2.
- https://cdn.elifesciences.org/articles/97206/elife-97206-fig5-figsupp2-data1-v1.zip
Figure 5—figure supplement 3
Partial co-localization of ATG6-mCherry and SINCs-like condensates.
ATG6-mCherry + NPR1-GFP were co-expressed in N. benthamiana. After 2 days, leaves were treated with 1 mM SA for 24 hr. Scale bar = 50 μm. Experiment was performed with three biological replicates.
Figure 6 with 2 supplements
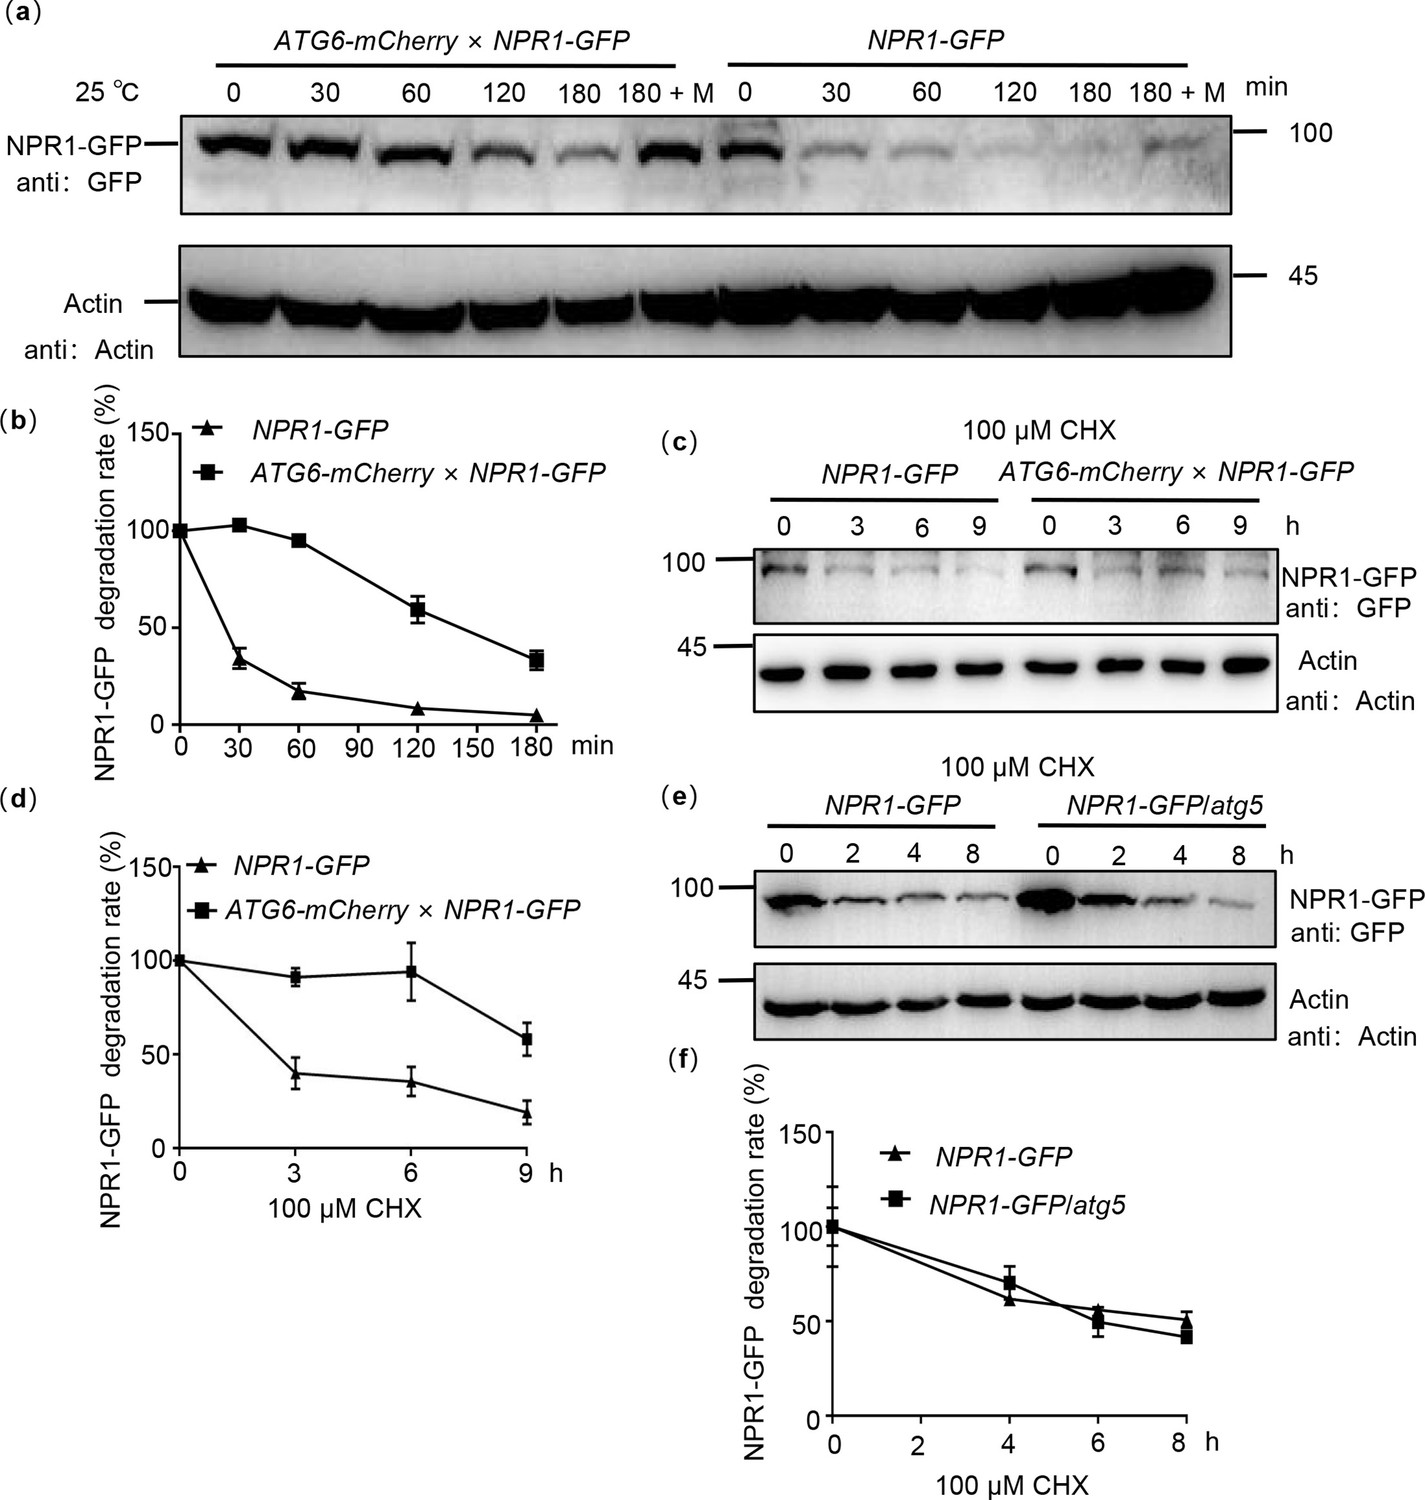
ATG6 improves the protein stability of NPR1.
(a) NPR1-GFP degradation assay in Arabidopsis. Total proteins from 7-day-old seedlings of NPR1-GFP and ATG6-mCherry × NPR1-GFP were extracted, using Actin as an internal reference. ‘M’ indicates 100 μM MG115 treatment. (b) Quantification of NPR1-GFP degradation rates in (a) using ImageJ. In (a, b), the extracts were incubated for 0–180 min at room temperature (25°C), the degradation rate of NPR1-GFP was analyzed. (c) NPR1-GFP protein turnover. Seven-day-old NPR1-GFP and ATG6-mCherry × NPR1-GFP seedlings were treated with 100 μM cycloheximide (CHX) for different times. Total proteins were analyzed, actin was used as an internal reference. (d) Quantification of NPR1-GFP protein turnover rates in (c) using ImageJ. (e) NPR1-GFP protein turnover. Seven-day-old NPR1-GFP and NPR1-GFP/atg5 seedlings were treated with 100 μM CHX for different times. Total proteins were analyzed, actin was used as an internal reference. (f) Quantification of protein levels of NPR1-GFP in (e) using ImageJ. All experiments were performed with three biological replicates.
-
Figure 6—source data 1
Original files for western blot analysis displayed in Figure 6a, c, e.
- https://cdn.elifesciences.org/articles/97206/elife-97206-fig6-data1-v1.zip
-
Figure 6—source data 2
PDF file containing original western blots for Figure 6a, c, e, indicating the relevant bands and treatments.
- https://cdn.elifesciences.org/articles/97206/elife-97206-fig6-data2-v1.zip
-
Figure 6—source data 3
Numerical source data files for Figure 6b, d, f.
- https://cdn.elifesciences.org/articles/97206/elife-97206-fig6-data3-v1.zip
Figure 6—figure supplement 1
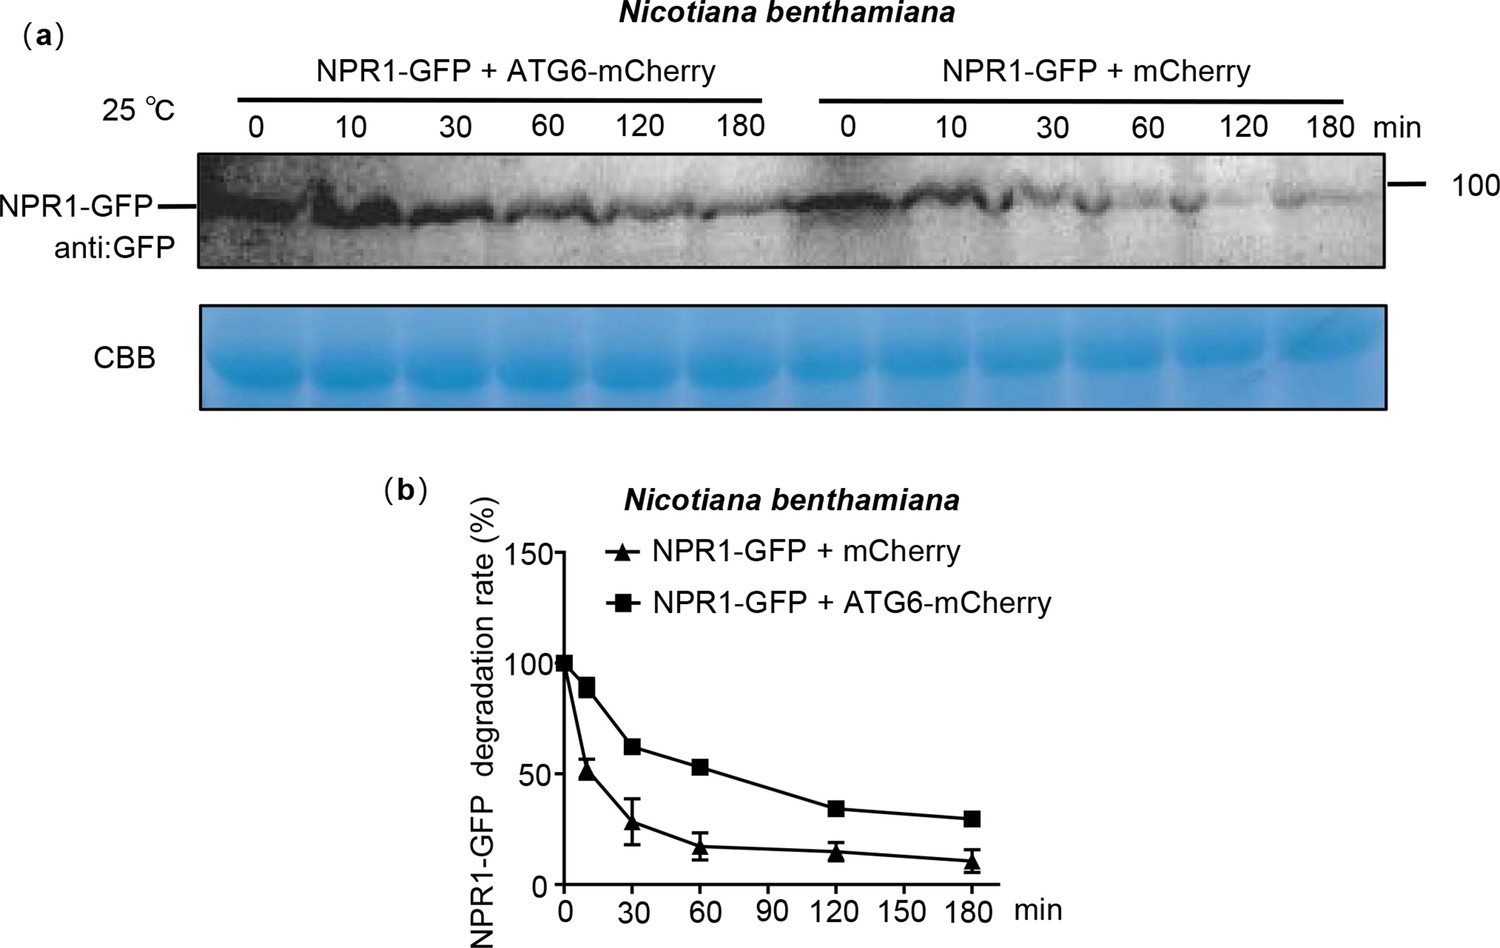
ATG6 improves the protein stability of NPR1 in N. benthamiana.
(a) NPR1-GFP degradation assay in N. benthamiana. Total proteins from N. benthamiana co-transfected with mCherry + NPR1-GFP and ATG6-mCherry + NPR1-GFP were extracted. CBB was used as a control. (b) Quantification of NPR1-GFP degradation rates in (a) using ImageJ. All experiments were performed with three biological replicates.
-
Figure 6—figure supplement 1—source data 1
Original files for western blot analysis displayed in Figure 6—figure supplement 1a.
- https://cdn.elifesciences.org/articles/97206/elife-97206-fig6-figsupp1-data1-v1.zip
-
Figure 6—figure supplement 1—source data 2
PDF file containing original western blots for Figure 6—figure supplement 1a, indicating the relevant bands and treatments.
- https://cdn.elifesciences.org/articles/97206/elife-97206-fig6-figsupp1-data2-v1.zip
-
Figure 6—figure supplement 1—source data 3
Numerical source data files for Figure 6—figure supplement 1b.
- https://cdn.elifesciences.org/articles/97206/elife-97206-fig6-figsupp1-data3-v1.zip
Figure 6—figure supplement 2
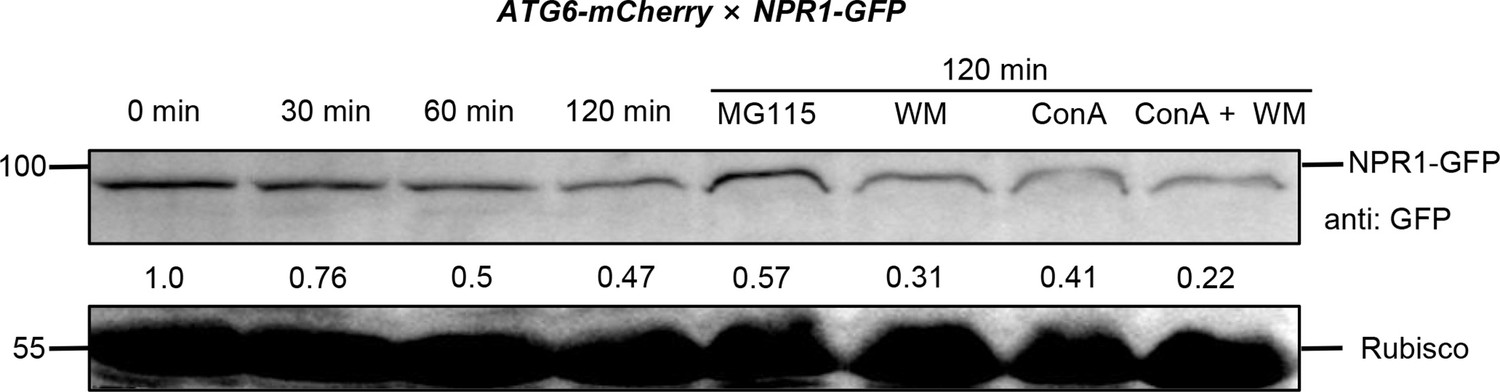
NPR1-GFP degradation assay in ATG6-mCherry × NPR1-GFP Arabidopsis.
Total proteins from 7-day-old seedlings of ATG6-mCherry × NPR1-GFP were extracted. These extracts were then incubated at room temperature (25°C) for 0–120 min to analyze the degradation rate of NPR1-GFP. To inhibit the proteasome pathway, 100 μM MG115 was utilized. Additionally, autophagy was inhibited using 5 μM concanamycin A and 30 μM Wortmannin. The analysis of NPR1-GFP was quantitatively performed using ImageJ software, and the corresponding numerical values were determined. Experiment was performed with three biological replicates.
-
Figure 6—figure supplement 2—source data 1
Original files for western blot analysis displayed in Figure 6—figure supplement 2.
- https://cdn.elifesciences.org/articles/97206/elife-97206-fig6-figsupp2-data1-v1.zip
-
Figure 6—figure supplement 2—source data 2
PDF file containing original western blots for Figure 6—figure supplement 2, indicating the relevant bands and treatments.
- https://cdn.elifesciences.org/articles/97206/elife-97206-fig6-figsupp2-data2-v1.zip
Figure 7 with 2 supplements

ATG6 and NPR1 cooperatively inhibit the growth of Pst DC3000/avrRps4.
(a) Expression of ATG6 under Pst DC3000/avrRps4 infiltration in 3-week-old Col leaves, values are means ± SD (n = 3 biological replicates). The AtActin gene was used as the internal control. (b) Expression of ATG6 in the presence of 0.5 mM SA in 3-week-old Col leaves, values are means ± SD (n = 3 biological replicates). The AtActin gene was used as the internal control. (c) The protein levels of ATG6 after 0.5 mM SA in 3-week-old Col leaves. Total leaf proteins from Arabidopsis were analyzed, actin was used as an internal reference. Numerical values indicate quantitative analysis of ATG6 protein using ImageJ. (d) Growth of Pst DC3000/avrRps4 in Col/silencing ATG6 and Col/negative control (NC). (e) Phenotypes of 16-day-old amiRNAATG6 # 1 and amiRNAATG6 # 2. Bar, 1 cm. (f) Phenotypes of 23-day-old amiRNAATG6 # 1 and amiRNAATG6 # 2. Bar, 3 cm. (g) Expression of ATG6 in Col, amiRNAATG6 # 1 and amiRNAATG6 # 2 under infiltration treatment of 100 μM β-estradiol, values are means ± SD (n = 3 biological replicates). The AtActin gene was used as the internal control. (h) Growth of Pst DC3000/avrRps4 in Arabidopsis leaves of amiRNAATG6 # 1,amiRNAATG6 # 2 and Col. (i) Growth of Pst DC3000/avrRps4 in NPR1 GFP/silencing ATG6 and NPR1-GFP/NC. (j) Growth of Pst DC3000/avrRps4 in Arabidopsis leaves of Col, amiRNAATG6 # 1,amiRNAATG6 # 2, npr1, NPR1-GFP, ATG6-mCherry, and ATG6-mCherry × NPR1-GFP. In (d, h–j), a low dose of Pst DC3000/avrRps4 (OD600 = 0.001) was infiltrated. After 3 days, the growth of Pst DC3000/avrRps4 was counted. * or ** indicates that the significant difference compared to the control is at the level of 0.05 or 0.01 (Student’s t-test p value, *p < 0.05 or **p < 0.01). All experiments were performed with three biological replicates.
-
Figure 7—source data 1
Original files for western blot analysis displayed in Figure 7c.
- https://cdn.elifesciences.org/articles/97206/elife-97206-fig7-data1-v1.zip
-
Figure 7—source data 2
PDF file containing original western blots for Figure 7c, indicating the relevant bands and treatments.
- https://cdn.elifesciences.org/articles/97206/elife-97206-fig7-data2-v1.zip
-
Figure 7—source data 3
Numerical source data files for Figure 7a, b, d, g, h, i, j.
- https://cdn.elifesciences.org/articles/97206/elife-97206-fig7-data3-v1.zip
Figure 7—figure supplement 1
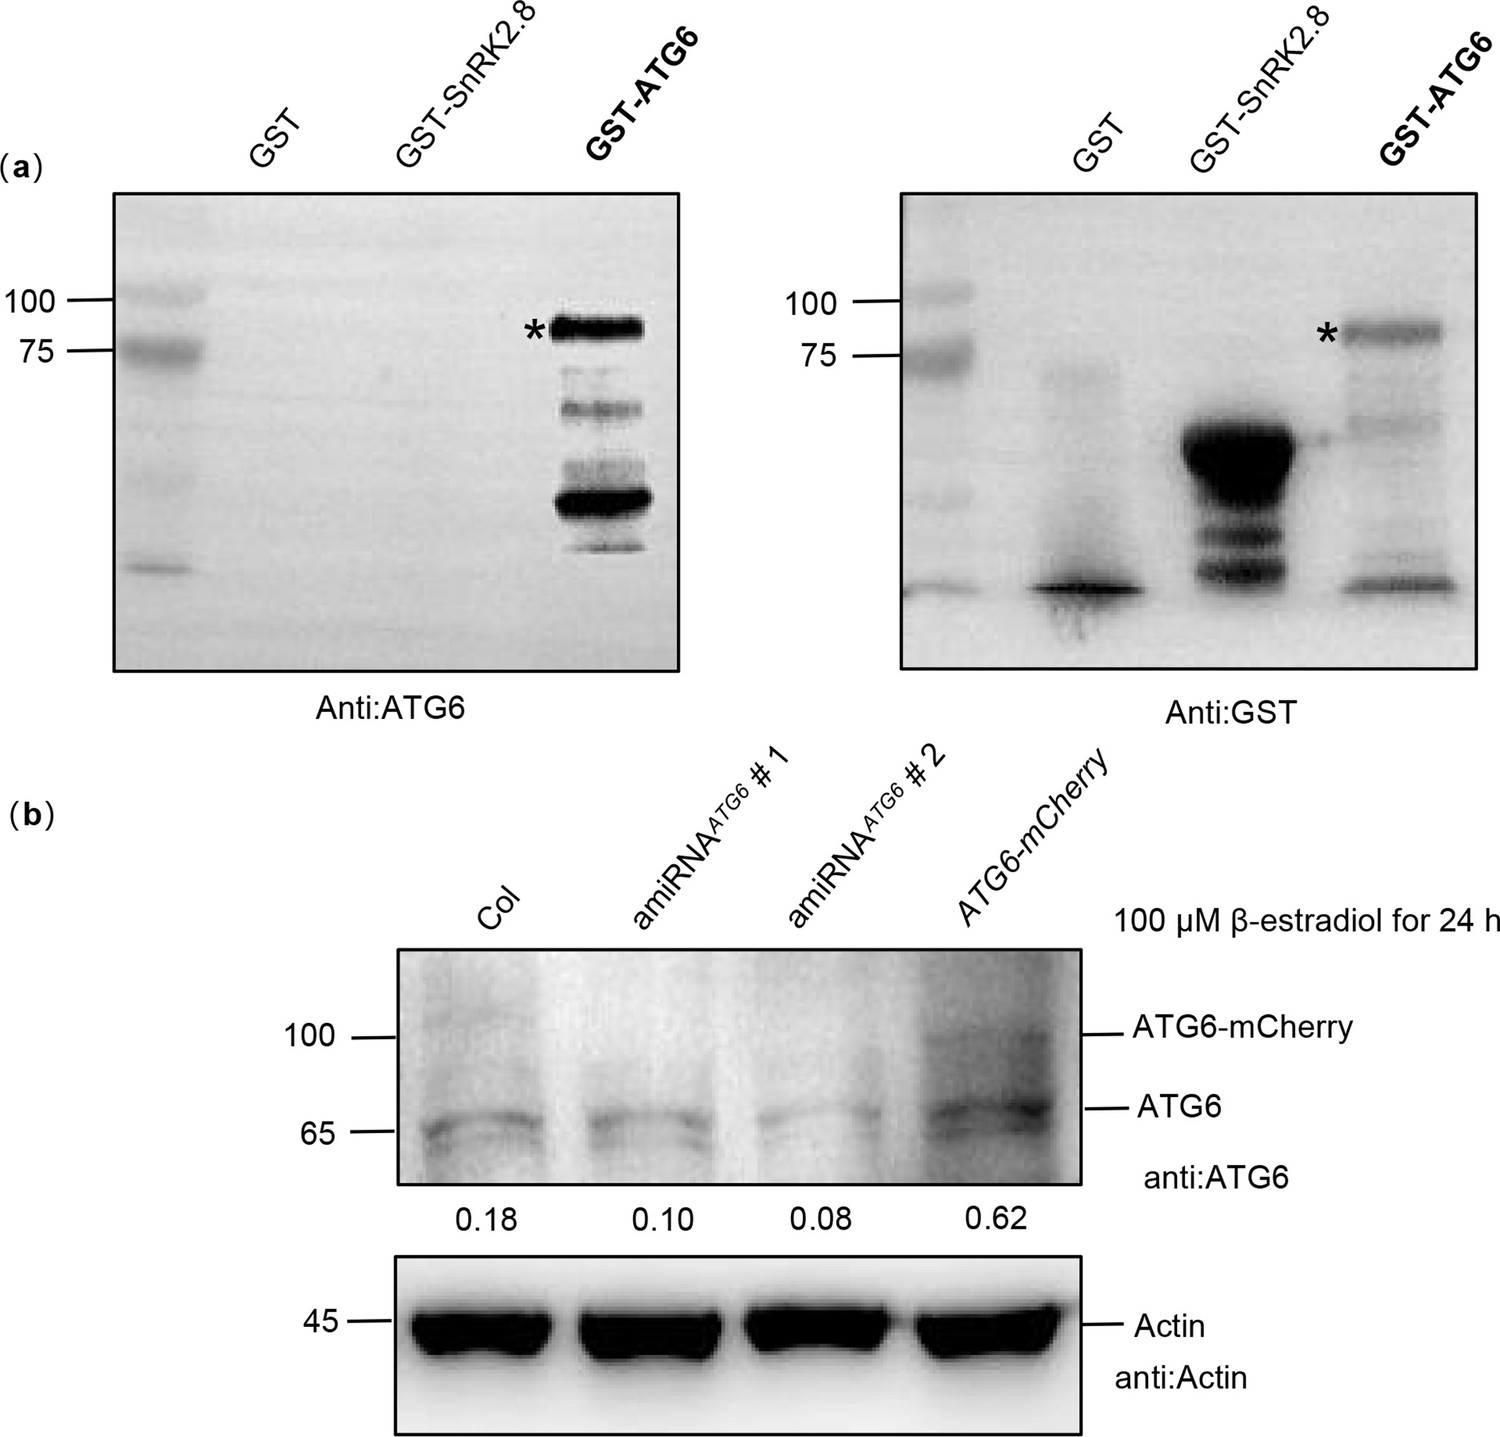
Verification of ATG6 antibody specificity.
(a) Prokaryotic expression of the GST-ATG6 fusion protein was used to verify the specificity of the ATG6 antibody, and GST and GST-SnRK2.8 were used as negative controls. GST-ATG6 bands was marked with a black asterisk. (b) The levels of ATG6 protein. Levels of ATG6-mCherry and endogenous ATG6 in Col, amiRNAATG6 # 1, amiRNAATG6 # 2, and ATG6-mCherry were detected after 100 μM estradiol treatment for 24 hr. Experiment was performed with three biological replicates.
-
Figure 7—figure supplement 1—source data 1
Original files for western blot analysis displayed in Figure 7—figure supplement 1.
- https://cdn.elifesciences.org/articles/97206/elife-97206-fig7-figsupp1-data1-v1.zip
-
Figure 7—figure supplement 1—source data 2
PDF file containing original western blots for Figure 7—figure supplement 1, indicating the relevant bands and treatments.
- https://cdn.elifesciences.org/articles/97206/elife-97206-fig7-figsupp1-data2-v1.zip
Figure 7—figure supplement 2

ATG6 and NPR1 cooperatively inhibit Pst DC3000/avrRps4-induced cell dead.
(a) Trypan blue staining showing cell death in the leaves of Col, amiRNAATG6 # 1, amiRNAATG6 # 2, npr1, NPR1-GFP, ATG6-mCherry, and ATG6-mCherry × NPR1-GFP. A low dose of Pst DC3000/avrRps4 (OD600 = 0.001) was infiltrated. After 3 days, trypan blue staining was performed. Bar, 0.2 cm. (b) Number of dead cells per section in the leaves of Col, amiRNAATG6 # 1, amiRNAATG6 # 2, npr1, NPR1-GFP, ATG6-mCherry, and ATG6-mCherry × NPR1-GFP in (a). ** indicates that the significant difference compared to the control is at the level of 0.01 (Student’s t-test p value, **p < 0.01). Experiment was performed with three biological replicates.
-
Figure 7—figure supplement 2—source data 1
Numerical source data files for Figure 7—figure supplement 2b.
- https://cdn.elifesciences.org/articles/97206/elife-97206-fig7-figsupp2-data1-v1.zip
Figure 8
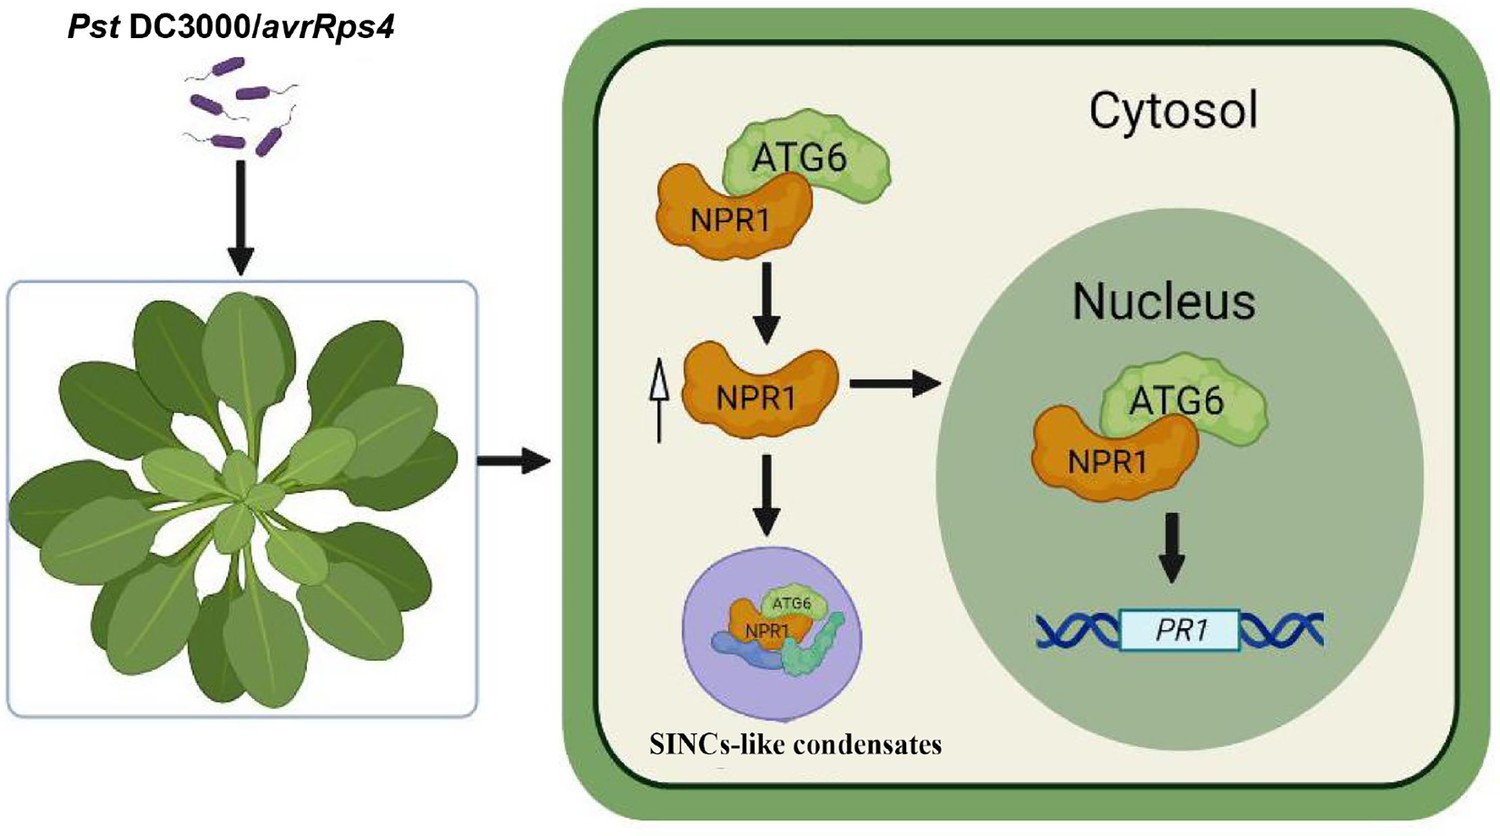
Working model for NPR1 regulation by ATG6.
ATG6 interacts directly with NPR1 to increase NPR1 protein level and stability, thereby promoting the formation of SINCs-like condensates and increasing the nuclear accumulation of NPR1. ATG6 synergistically activates PRs expression with NPR1 to cooperatively enhance resistance to inhibit Pst DC3000/avrRps4 infection in Arabidopsis.
Appendix 4—figure 1
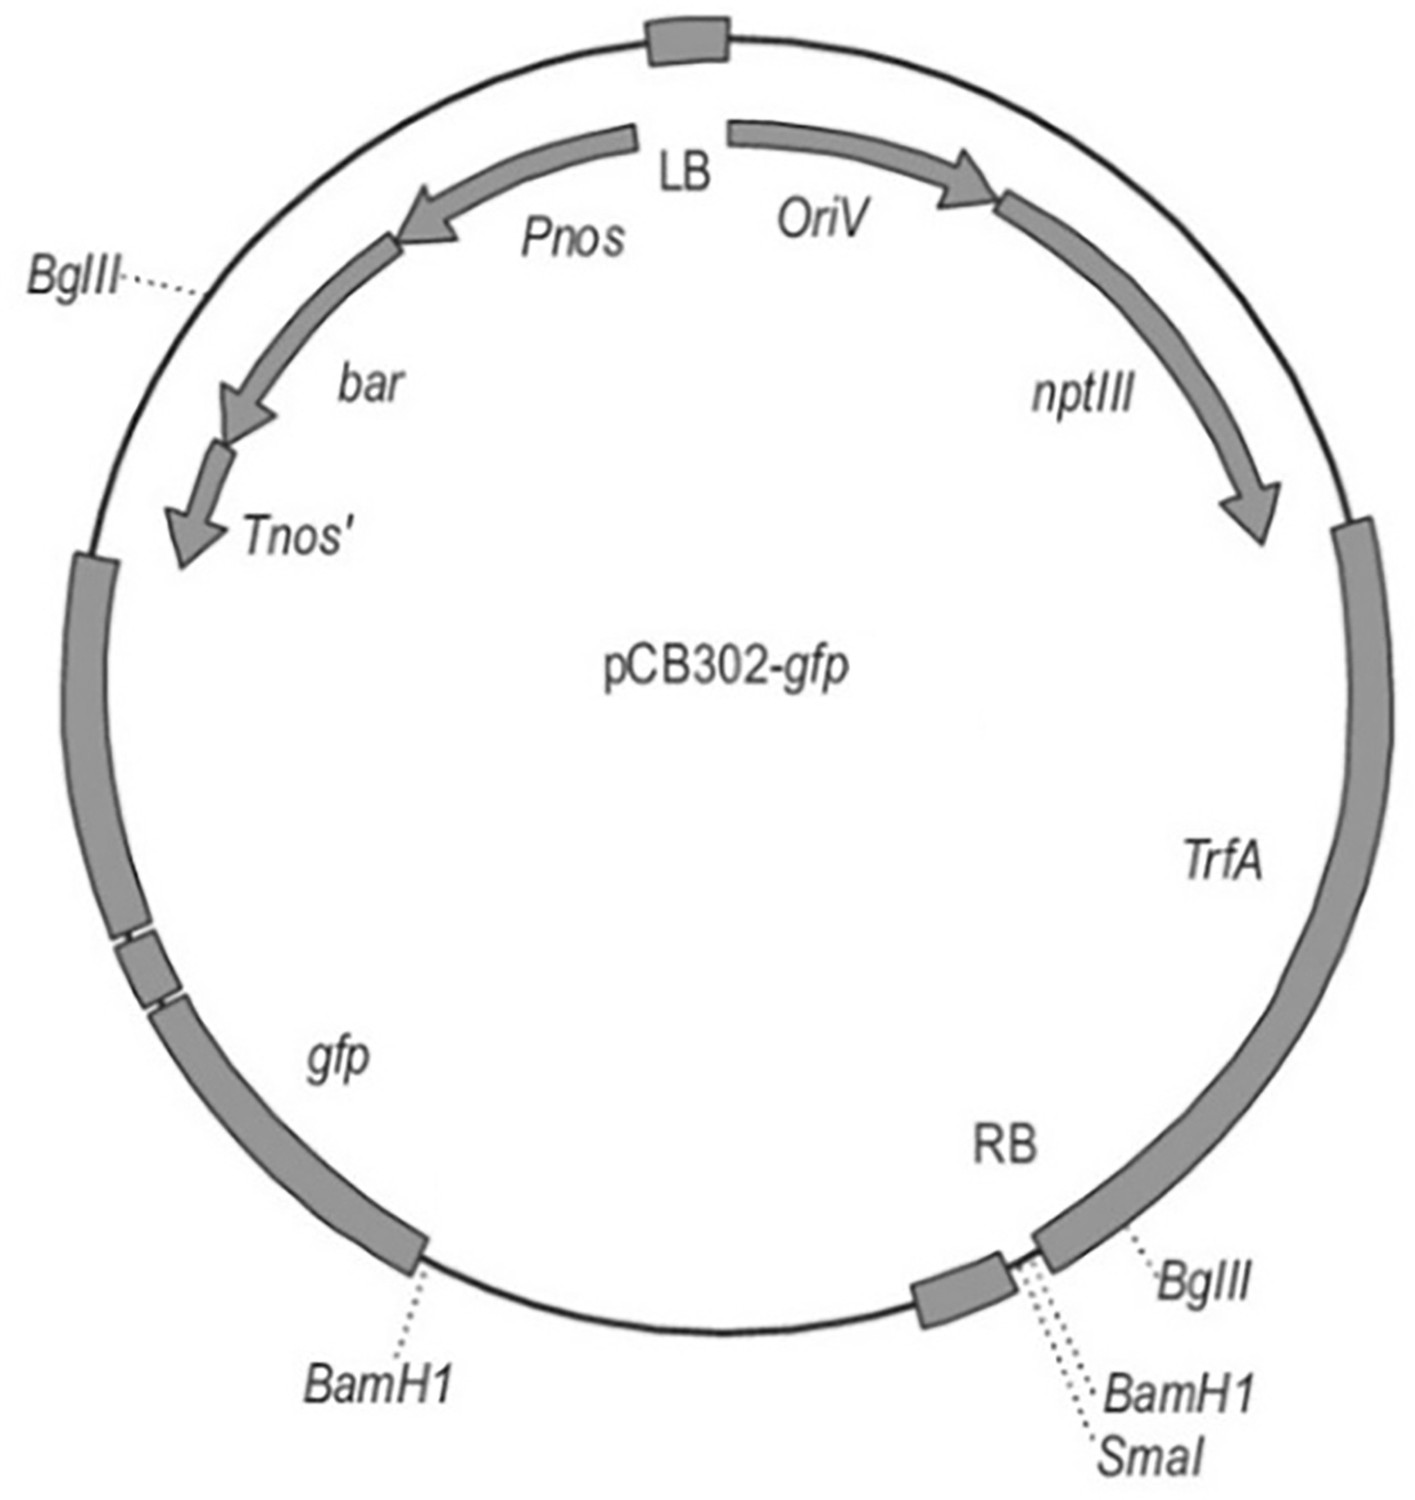
Map of pCB302-GFP vector.
Appendix 4—figure 2
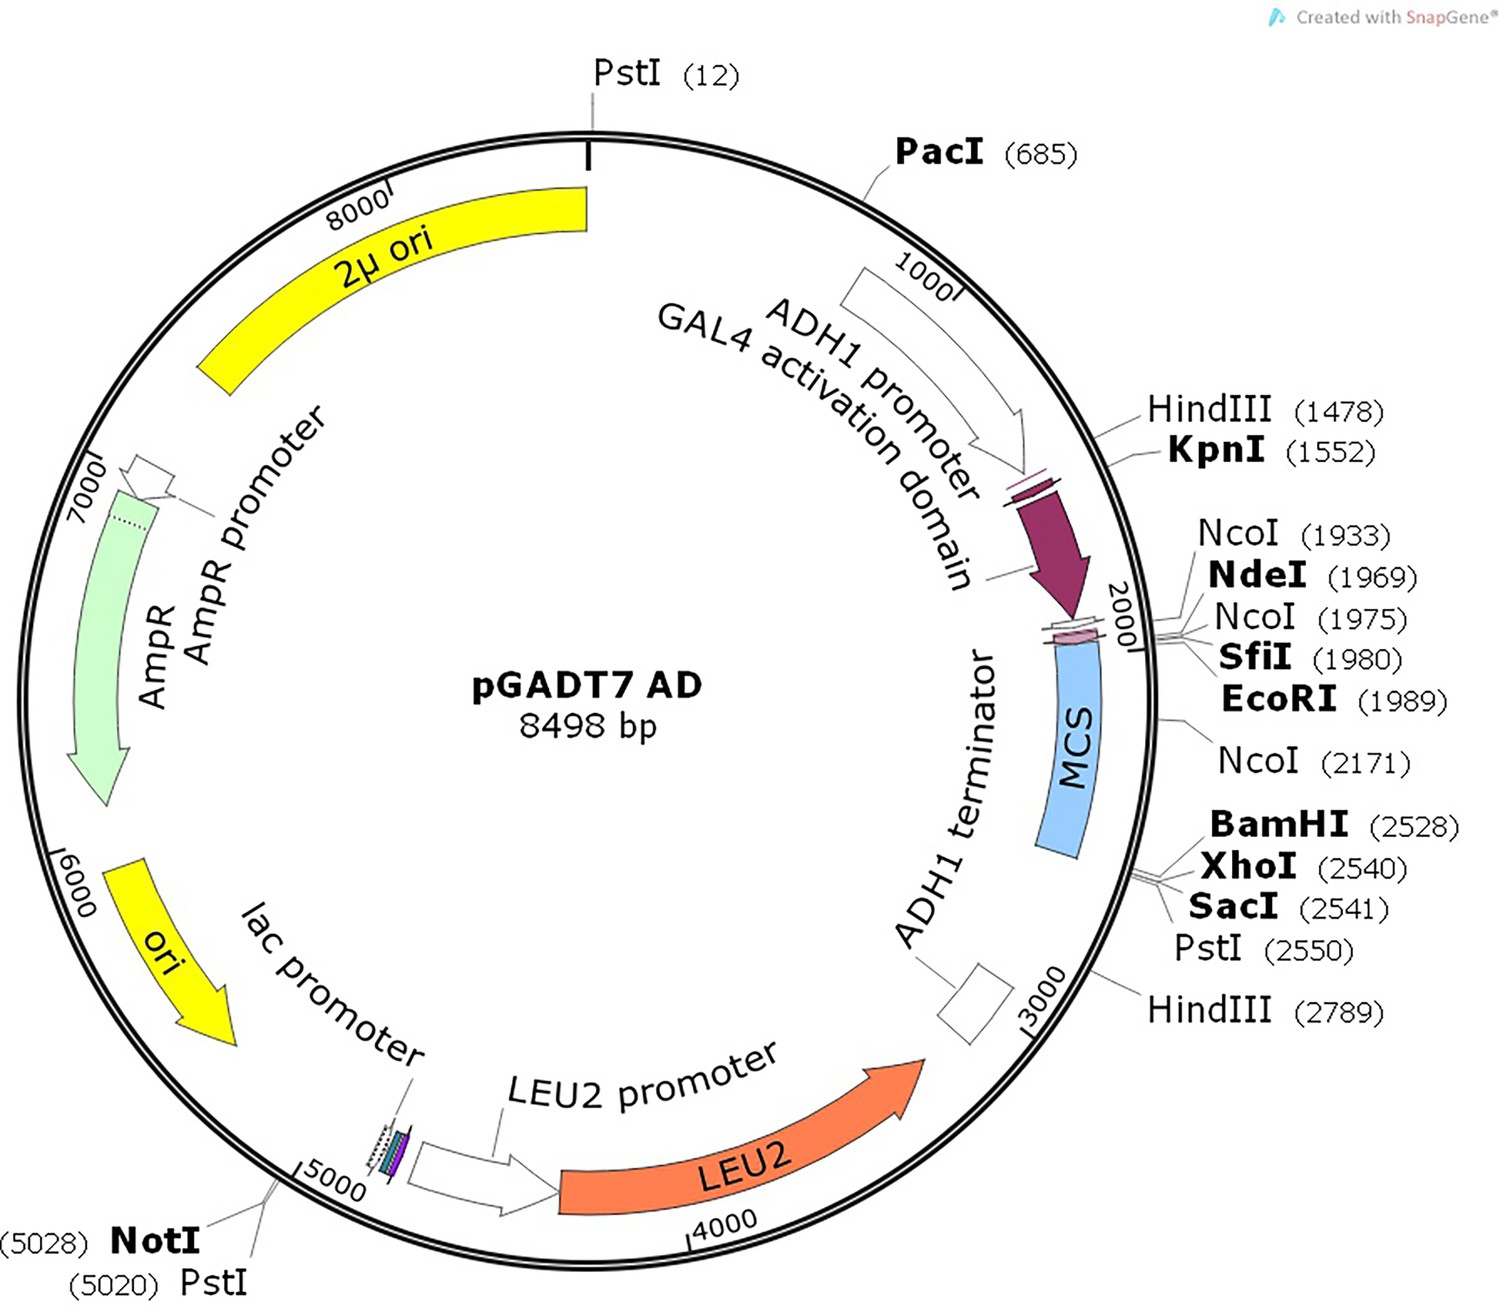
Map of pGADT7 AD vector.
Appendix 4—figure 3
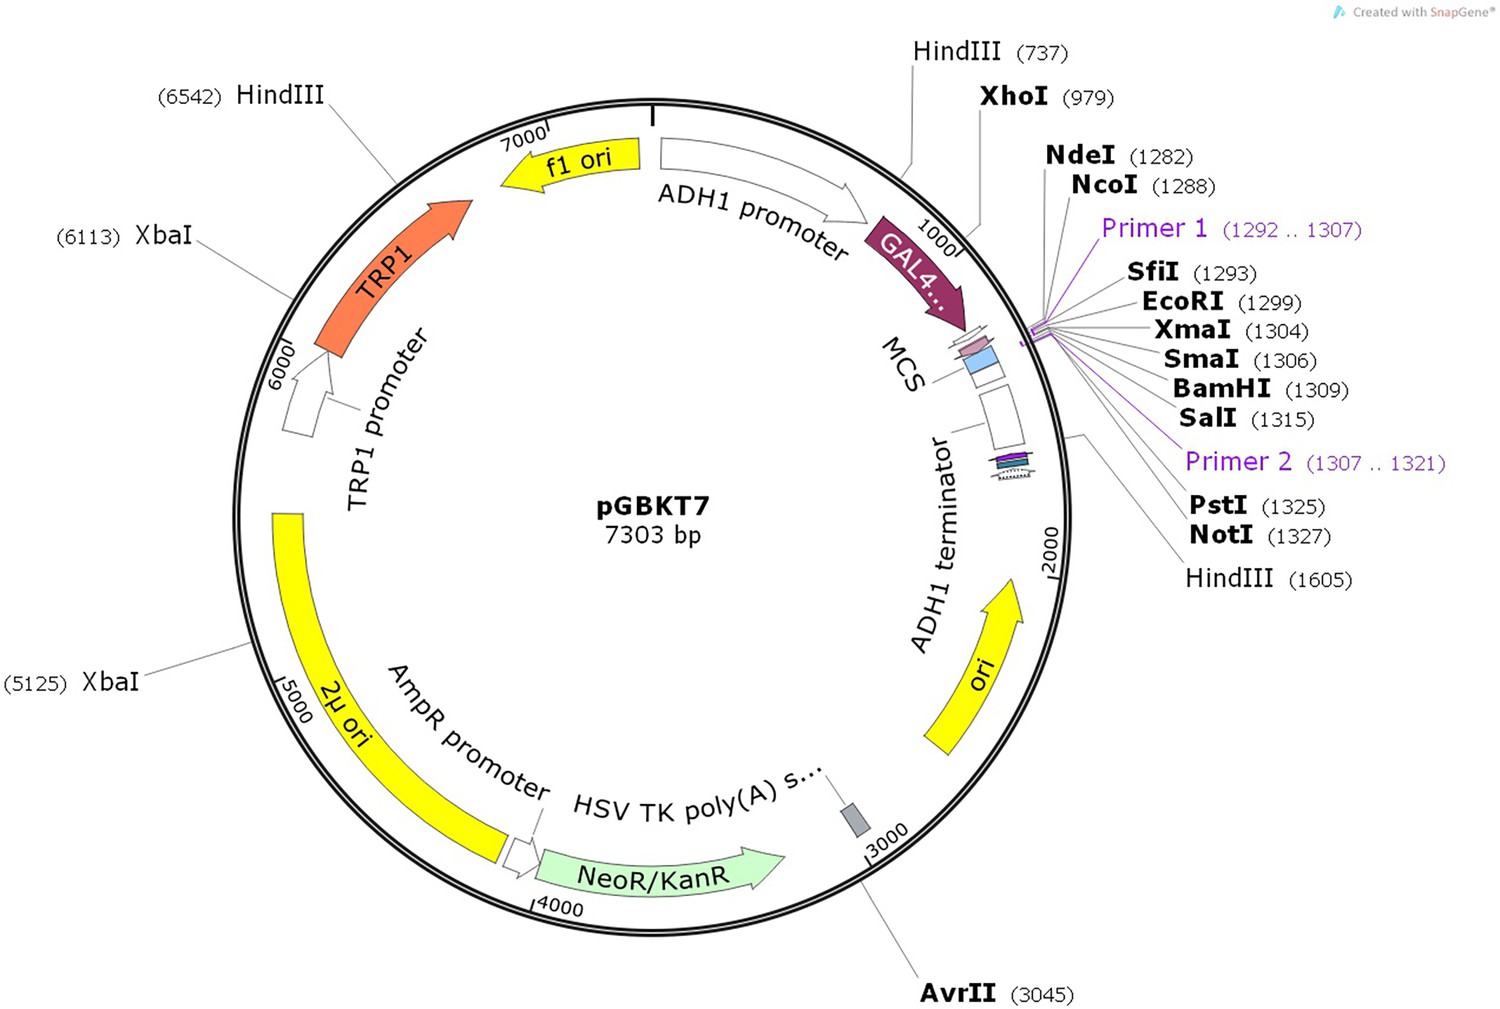
Map of pGBKT7 BD vector.
Appendix 4—figure 4
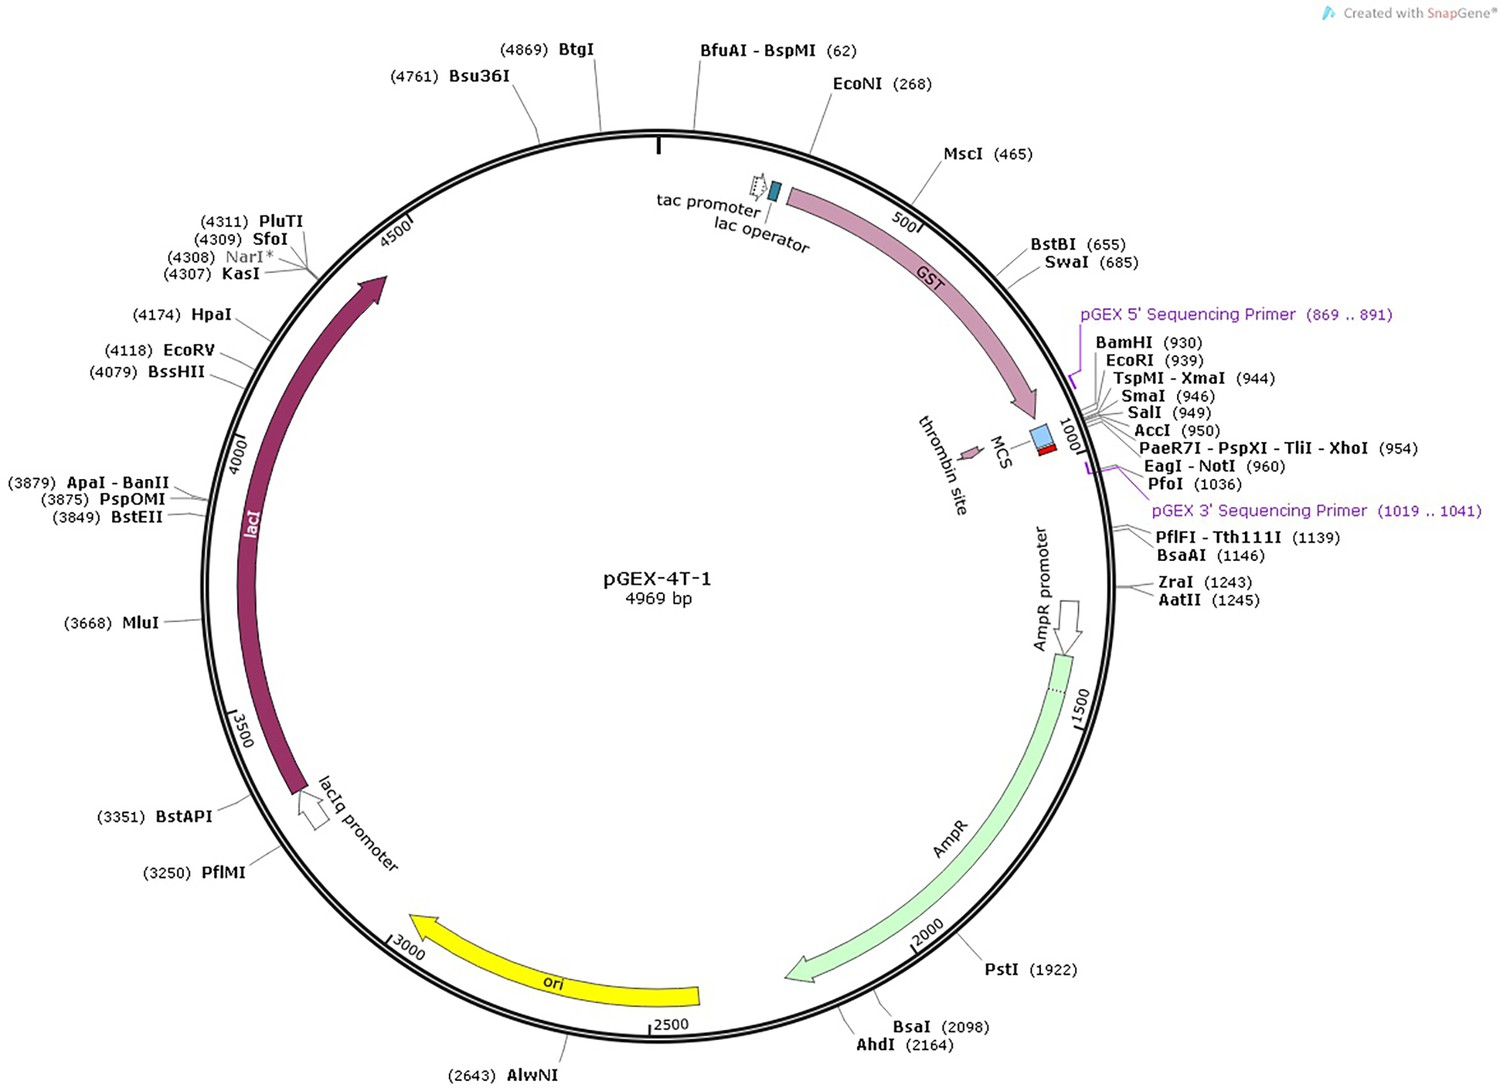
Map of pGEX-4T-1 vector.
Appendix 4—figure 5
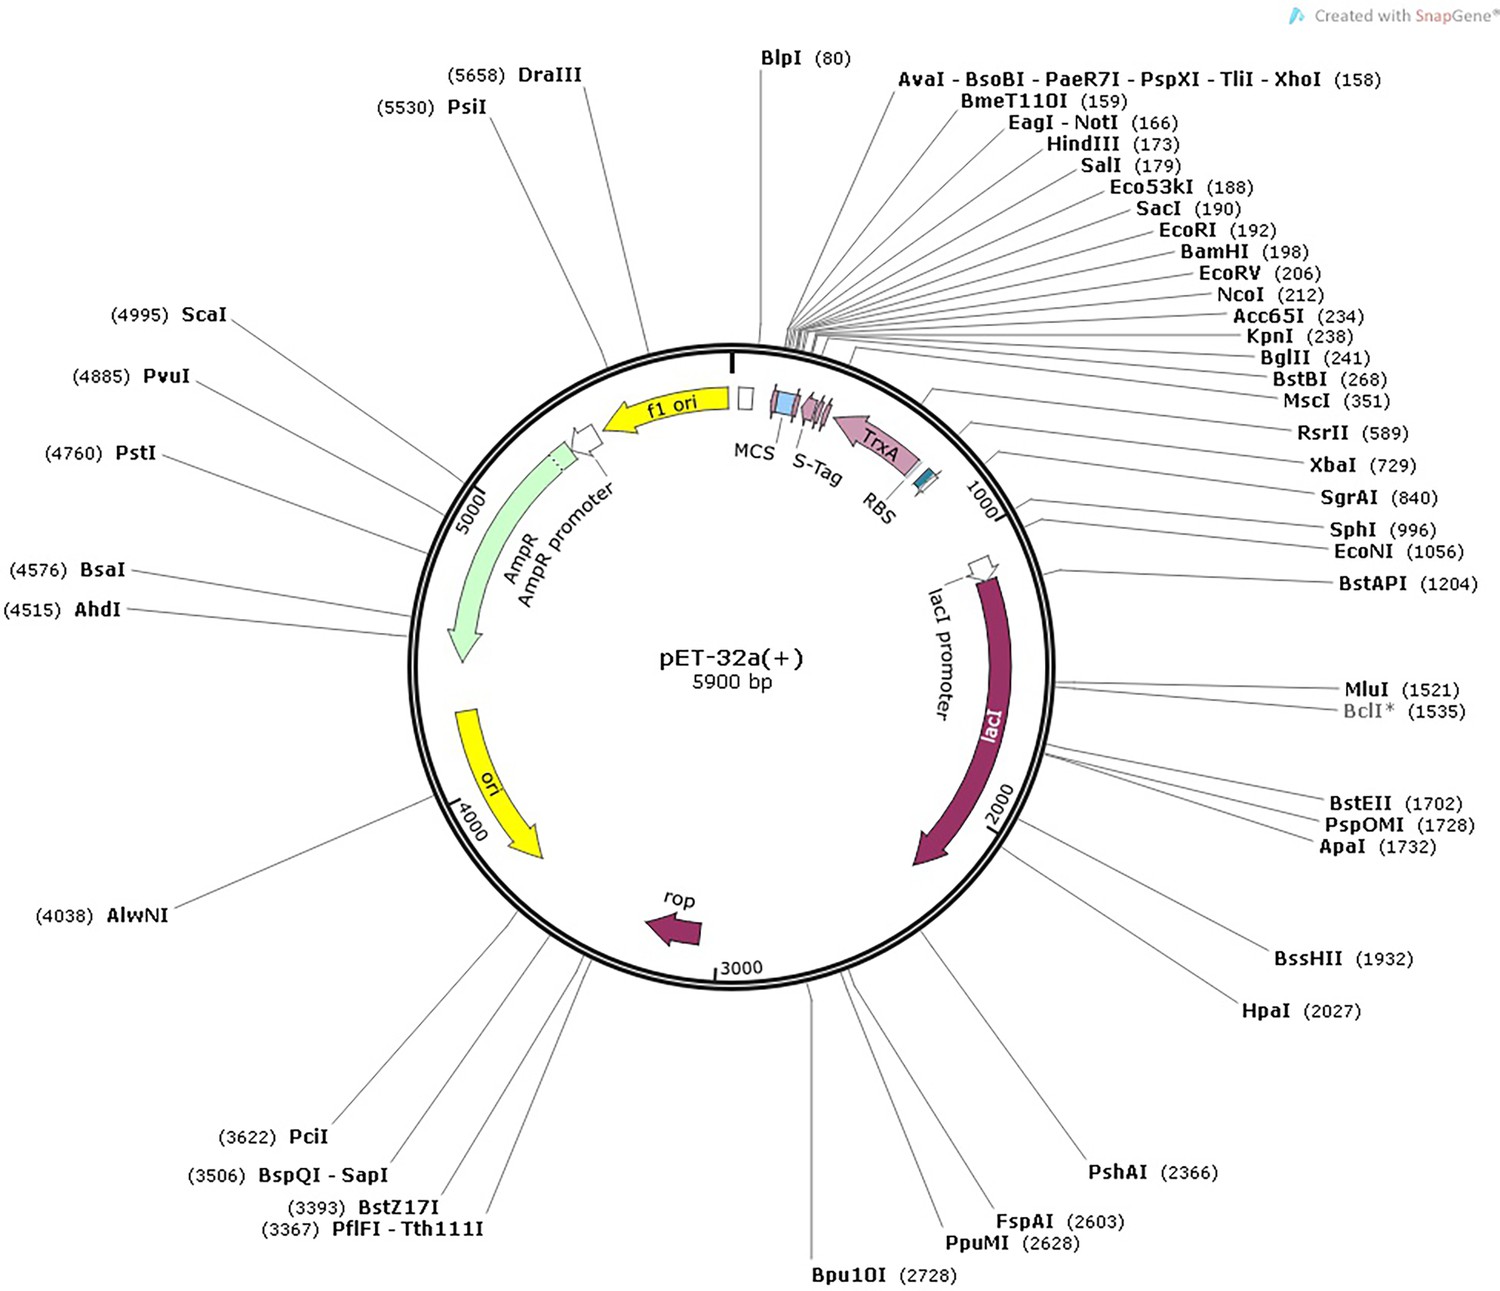
Map of pET-32a(+) vector.
Appendix 4—figure 6
Map of pCAMBIA1300 UBQ-sGFP vector.
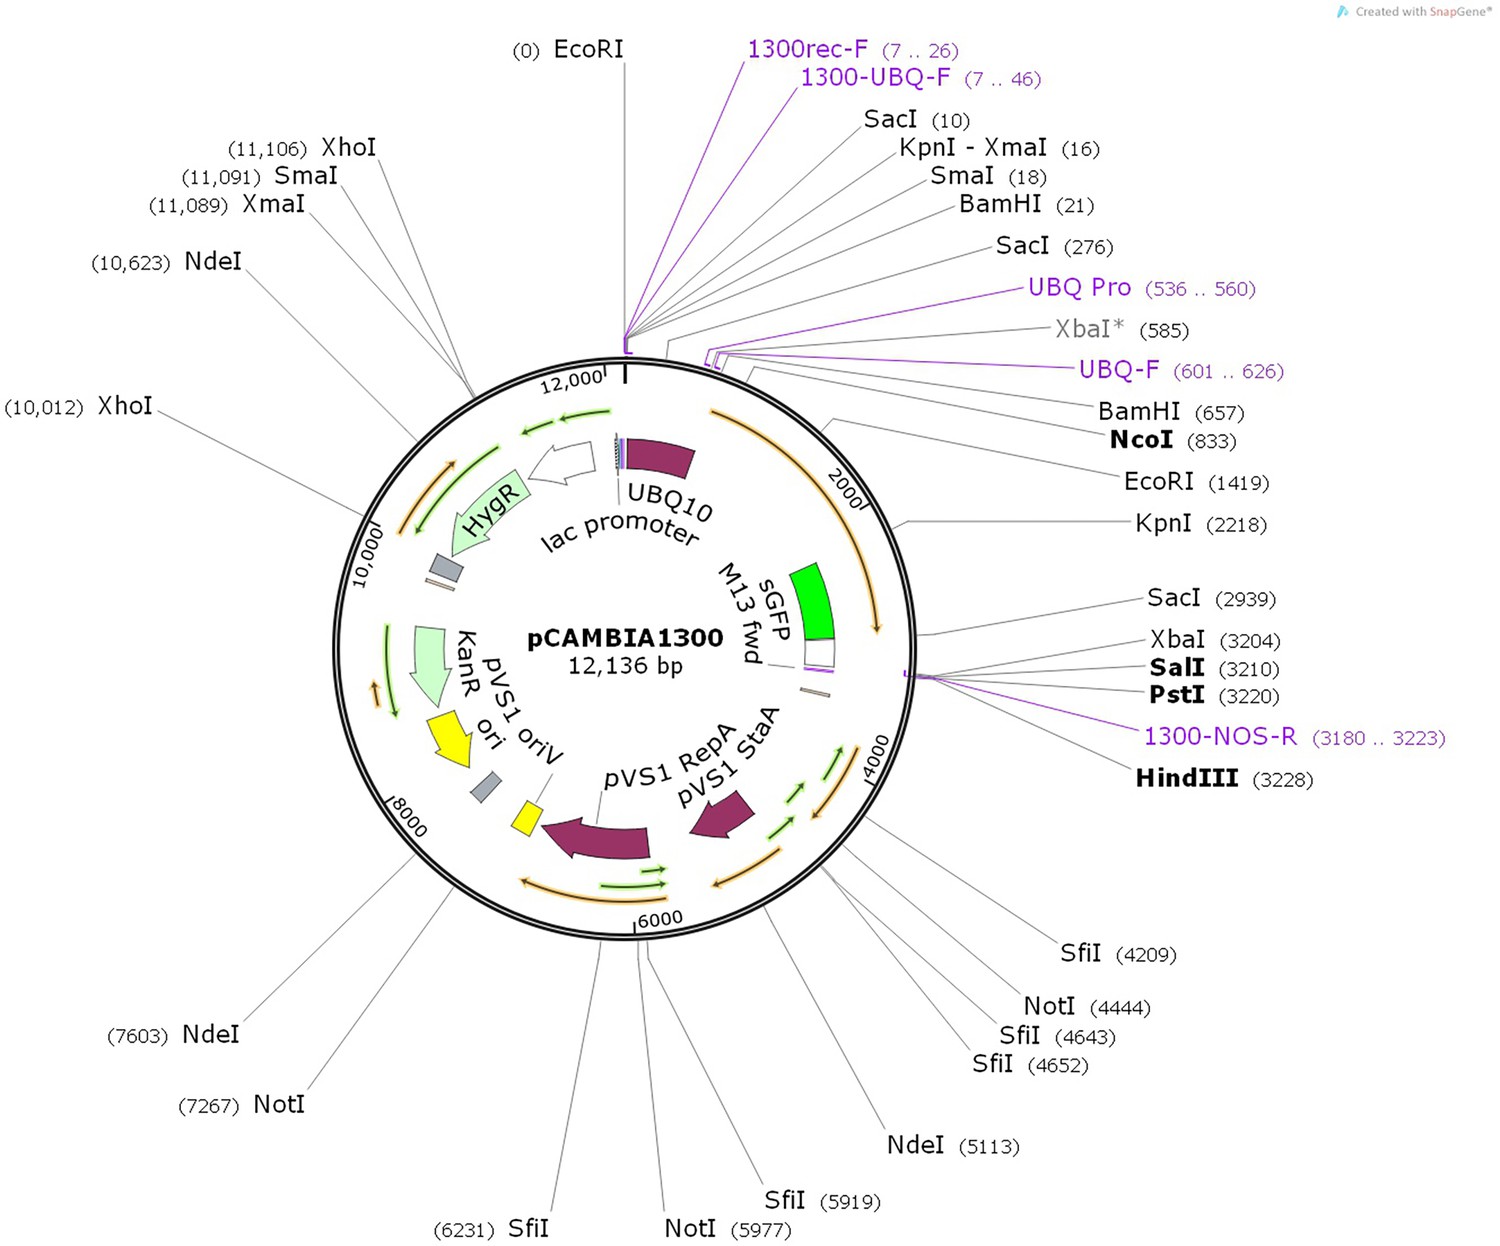
Appendix 4—figure 7
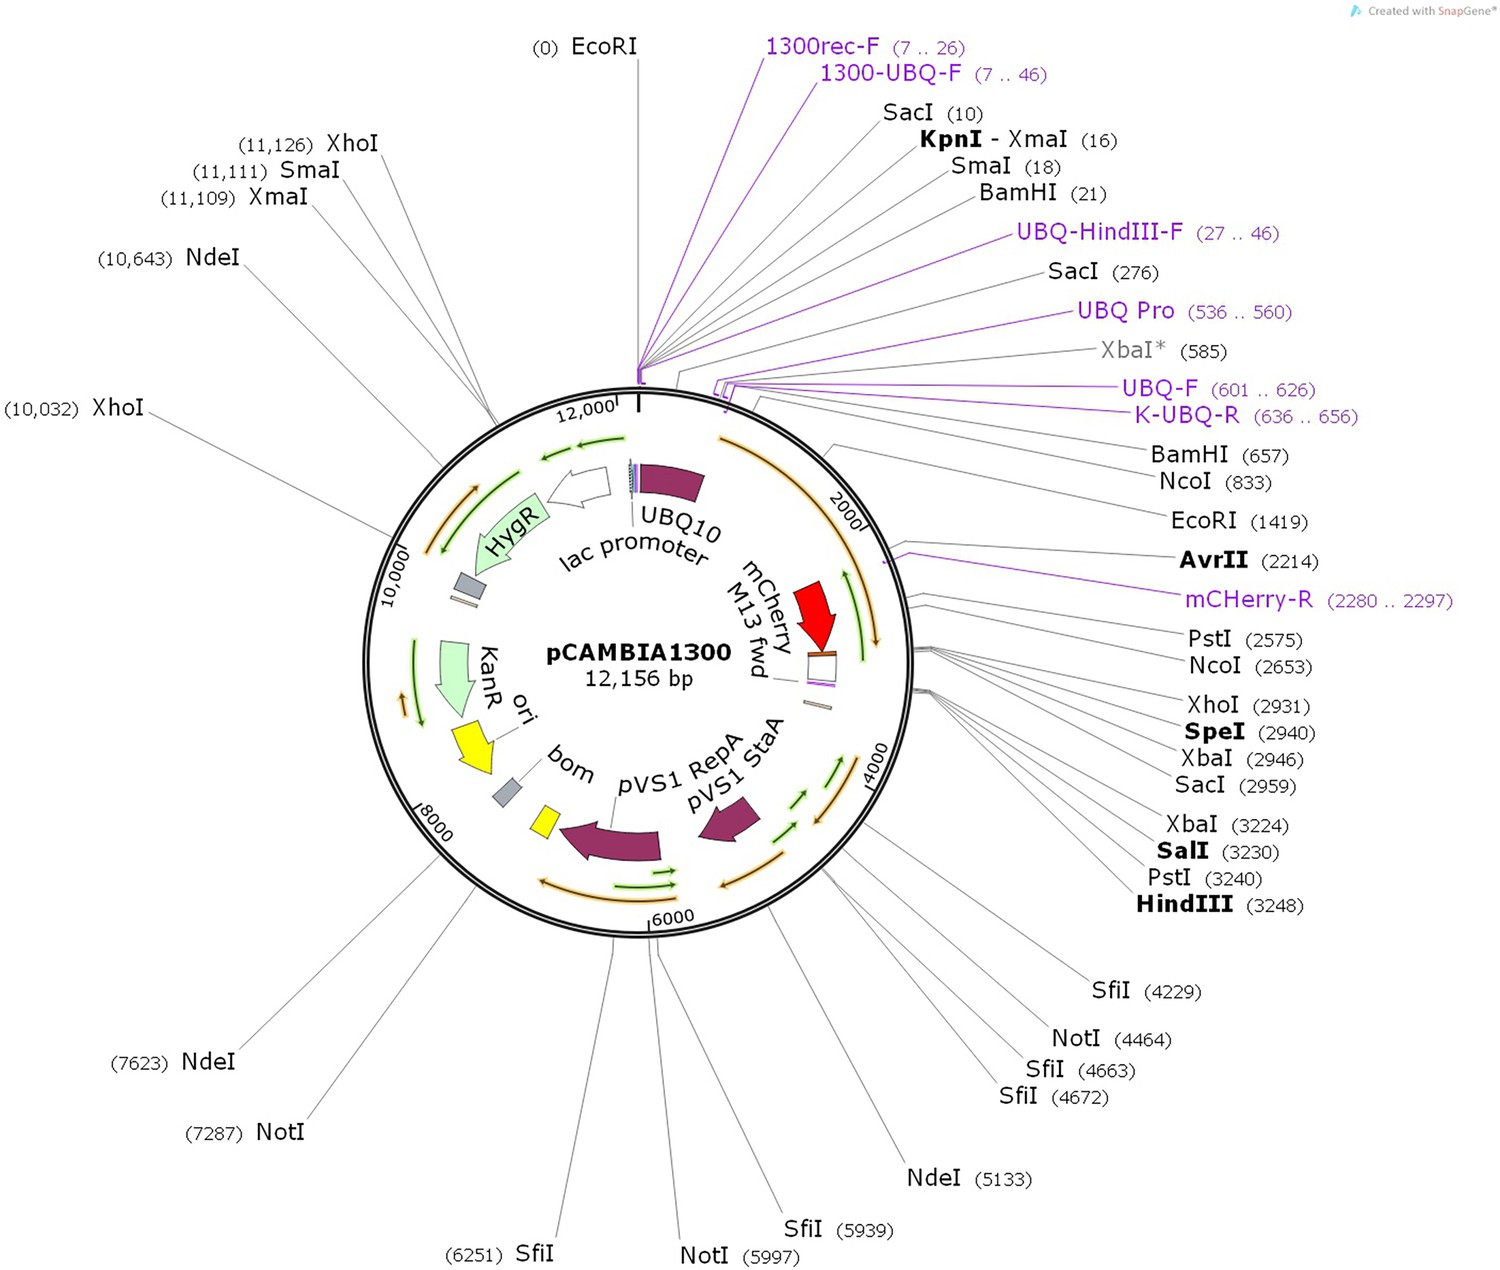
Map of pCAMBIA1300 UBQ-mCherry vector.
Appendix 4—figure 8
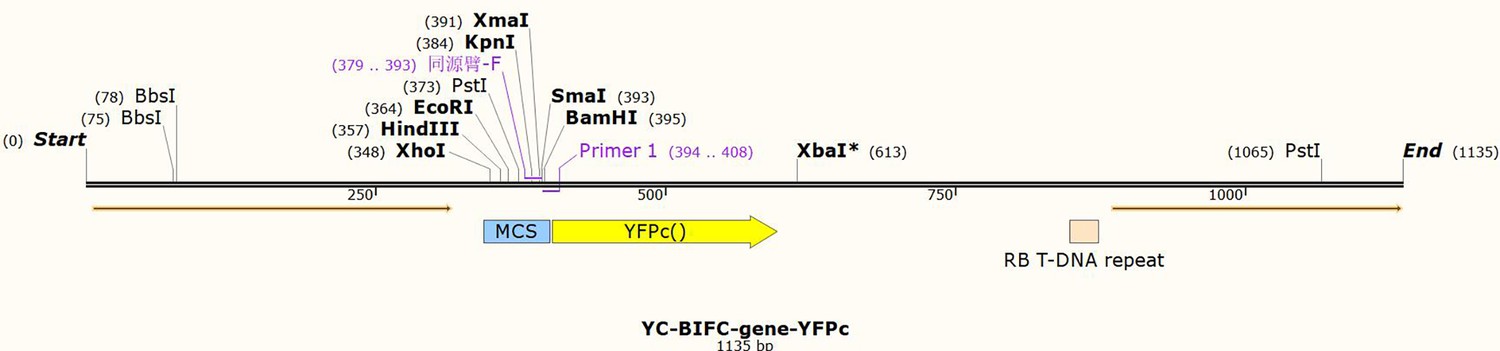
Map of YC-BIFC-gene-cYFP vector.
Appendix 4—figure 9
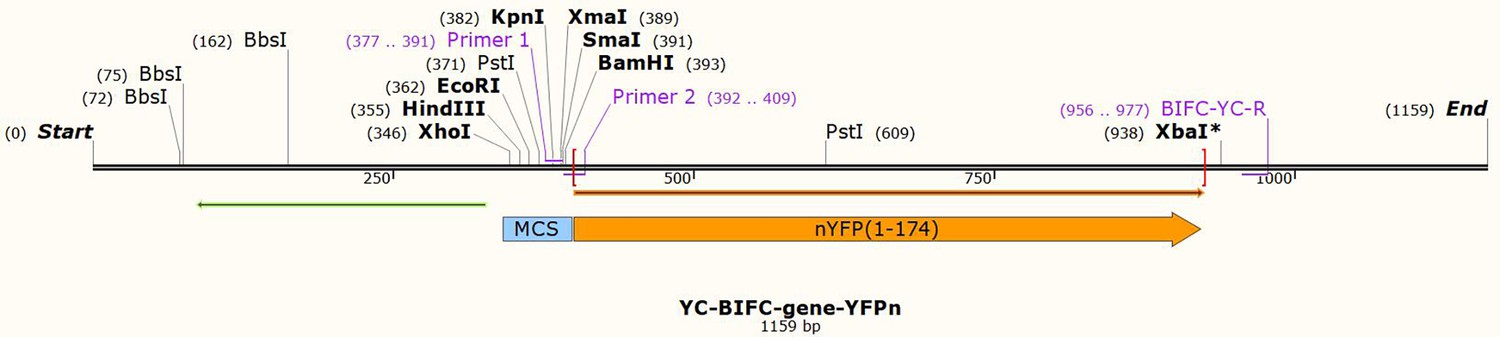
Map of YC-BIFC-gene-nYFP vector.
Appendix 4—figure 10
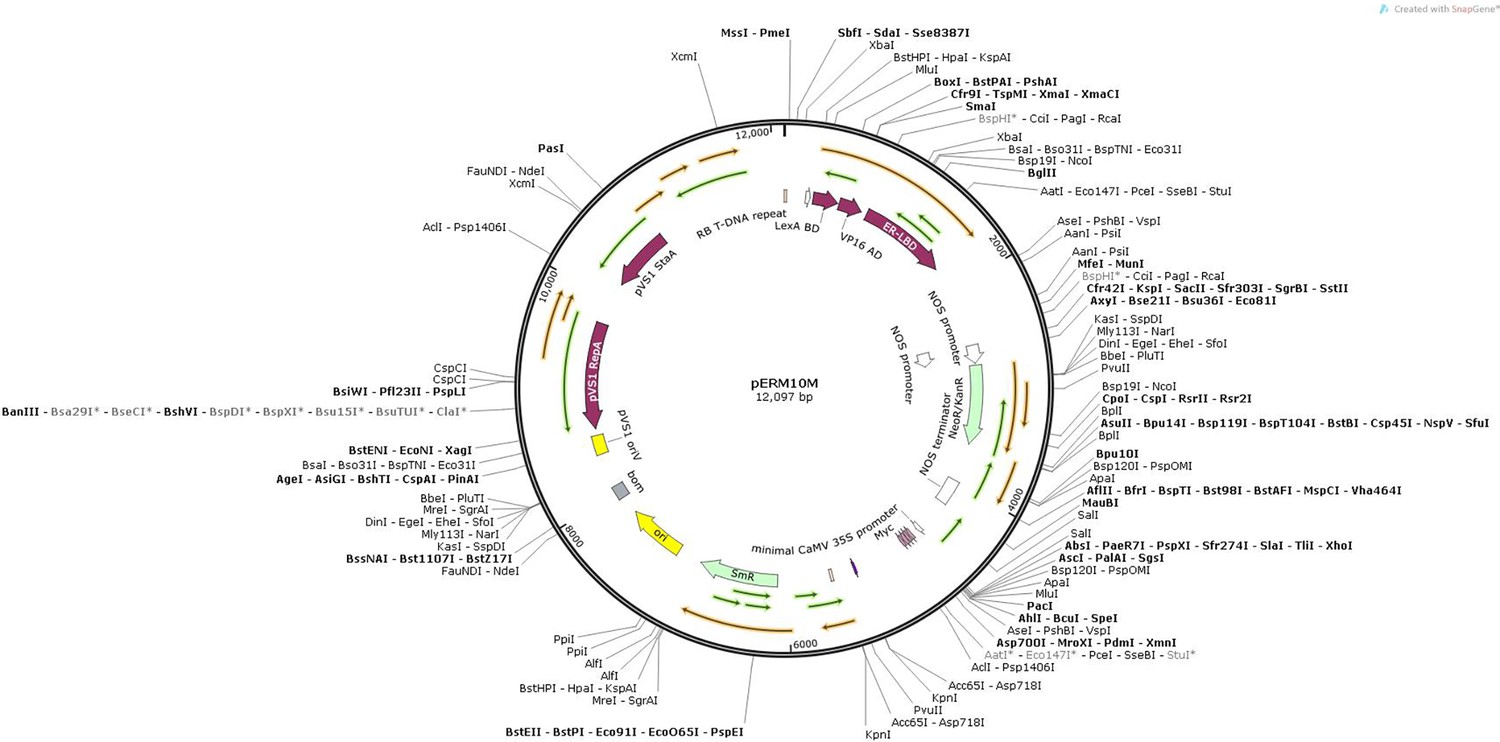
Map of pERM10 vector.
Videos
Video 1
Localization of NPR1-GFP in N. benthamiana co-expressed NPR1-GFP and mCherry.
Video 2
Localization of NPR1-GFP in N. benthamiana co-expressed NPR1-GFP and ATG6-mCherry.
Tables
Appendix 2—table 1
Plasmid in this study.
| Gene name | Vector name | Subcloning method | Source | |
|---|---|---|---|---|
| ATG6 | pGADT7 | ClonExpress II One Step Cloning Kit | This paper | |
| NPR1 | pGBKT7 | ClonExpress II One Step Cloning Kit | This paper | |
| NPR1-C | pGBKT7 | ClonExpress II One Step Cloning Kit | This paper | |
| NPR1-N | pGBKT7 | ClonExpress II One Step Cloning Kit | This paper | |
| SnRK2.8 | pGADT7 | ClonExpress II One Step Cloning Kit | This paper | |
| ATG6 | 35s-gene-cYFP | ClonExpress II One Step Cloning Kit | This paper | |
| NPR1 | 35s-gene-nYFP | ClonExpress II One Step Cloning Kit | This paper | |
| SnRK2.8 | 35s-gene-cYFP | ClonExpress II One Step Cloning Kit | This paper | |
| SnRK2.8 | pGEX-4T-1 | Double digests and T4 DNA ligase | This paper | |
| ATG6 | pGEX-4T-1 | Double digests and T4 DNA ligase | This paper | |
| ATG6 | 1300:UBQ-mCherry | Double digests and T4 DNA ligase | This paper | |
| ATG6 | 1300:UBQ-eGFP | Double digests and T4 DNA ligase | This paper | |
| GFP | 1300:UBQ-eGFP | N/A | This paper | |
| NPR1 | pET32a | Provided by Dr. ZhengQing Fu of University of South Carolina | ||
| NPR1 amiRNAATG6 | pCB302-GFP pERM10M | Provided by Dr. ZhengQing Fu of University of South Carolina Double digests and T4 DNA ligase This paper | ||
Appendix 2—table 2
Primers for vector construction.
| Vector name | Primers (5′–3′) | |
|---|---|---|
| For Y2H assay | ||
| ATG6-AD (pGADT7) | F: GAGGCCAGTGAATTCCACCCGATGAGGAAAGAGGAGATTCCAG R: CCCGTATCGATGCCCACCCCTAAGTTTTTTTACATGAAGGCT | |
| NPR1-BD (pGBKT7) | F: CATGGAGGCCGAATTCCCGATGGACACCACCATTGATG R: CAGGTCGACGGATCCCCTCACCGACGACGATGAGAG | |
| NPR1-C-BD (pGBKT7) | F: CATGGAGGCCGAATTCCCGCTTCATTTCGCTGTTGCAT | |
| NPR1-N-BD (pGBKT7) | R: CAGGTCGACGGATCCCCTCAAGCACACGCATCATCTAGAT | |
| SnRK2.8-AD (pGADT7) | F: CATGGAGGCCGAATTCCCGATGGAGAGGTACGAAATAGTGAAG R: CAGGTCGACGGATCCCCTCACAAAGGGGAAAGGAGATCAGCGGT | |
| For BiFC assay | ||
| ATG6 -cYFP (35s-gene-cYFP) | F: CGACGGTACCGCGGGCCCGGGATGAGGAAAGAGGAGATTCCAG R: CACGCTGCCCAGGATCCCGGGAGTTTTTTTACATGAAGGCT | |
| NPR1-nYFP (35s-gene-nYFP) | F: CGACGGTACCGCGGGCCCGGGATGGACACCACCATTGATG R: GCTCACCATCAGGATCCCGGGCCGACGACGATGAGAGAG | |
| SnRK2.8 -cYFP (35s-gene-cYFP) | F: CGACGGTACCGCGGGCCCGGGATGGAGAGGTACGAAATAGTGAAG R: CACGCTGCCCAGGATCCCGGGCAAAGGGGAAAGGAGATCAGCGGT | |
| For plant transformation | ||
| ATG6-mCherry (1300:UBQ-mCherry) ATG6-GFP (1300:UBQ-GFP) amiRNAATG6 I amiRNAATG6 II amiRNAATG6 III amiRNAATG6 IV miRNA 319 F miRNA 319 R | F: cagACTAGTATGAGGAAAGAGGAGATTCCAG R: cagACTAGTAGTTTTTTTACATGAAGGCTTACTAG F: cagACTAGTATGAGGAAAGAGGAGATTCCAG R: cagACTAGTAGTTTTTTTACATGAAGGCTTACTAG miR-s: GATCAATTCTAGGATAACTGCCCCTCTCTTTTGTATTCCA miR-a: AGGGGCAGTTATCCTAGAATTGATCAAAGAGAATCAATGA miR*s: AGGGACAGTTATCCTTGAATTGTTCACAGGTCGTGATATG miR*a: GAACAATTCAAGGATAACTGTCCCTACATATATATTCCTA F: CGCGGATCCCAAACACACGCTCGGACGCATATT R: TCCCCCGGGCATGGCGATGCCTTAAATAAAGATAAACCC | |
| GST-ATG6 (pGEX-4T-1) | F: GAATTCATGAGGAAAGAGGAGATTCC R: GTCGACAGTTTTTTTACATGAAGGCTTACTAG | |
| GST-SnRK2.8 (pGEX-4T-1) | F: CGCGGATCCATGGAGAGGTACGAAATAGTGAAG R: CCGCTCGAGCAAAGGGGAAAGGAGATCAGCGGT | |
Appendix 2—table 3
Plant materials.
| Name | Source |
|---|---|
| NPR1-GFP/atg5 | This paper (crossing) |
| ATG6-mCherry×NPR1-GFP/npr1-2 | This paper (crossing) |
| ATG6-mCherry ATG6-GFP amiRNAATG6 | This paper (floral dip method) This paper (floral dip method) This paper (floral dip method) |
| atg5-1 | SALK_020601C |
| NPR1-GFP (in npr1-2 background) | Provided by Dr. Xinnian Dong of Duke University |
| npr1-1 | Provided by Dr. Xinnian Dong of Duke University |
Appendix 2—table 4
Antibody information.
| Antibodies | Dilution | Identifier | Source |
|---|---|---|---|
| anti-GFP | 1:3000 | CAT#A-6455 | Invitrogen |
| anti-GST | 1:5000 | CAT#AT0027 | Engibody |
| anti-His | 1:2000 | CAT#AH367 | Beyotime |
| anti-Actin | 1:3000 | CAT#AT0004 | Engibody |
| anti-H3 | 1:3000 | CAT#NB500-171 | Novus Biologicals |
| anti-ATG6 | 1:200 | Peptide, C-KEKKKIEEEERK | Abmart |
Appendix 2—table 5
Primers of RT-qPCR.
| Genes | Primers (5′–3′) |
|---|---|
| AtActin2 AtNPR1 | F: GGTAACATTGTGCTCAGTGGTGG R: AACGACCTTAATCTTCATGCTGC F:GATCGCAAAACAAGCCACTATGG R:ATCGAGCAGCGTCATCTTCAATT |
| AtATG6 | F:TCCTCCATACGATGTGTAACTATTTCC R:GCTCATAAGTTTCGTTGTTGCTGT |
| AtPR1 AtPR5 AtICS1 | F:TGTAGCTCTTGTAGGTGCTC R:AACTCCATTGCACGTGTTCG F:AGTTCCTCCCGTCACTCTGG R:TCCTCCGGATGGTCTTATCC F: GAGACTTACGAAGGAAGATGATGAG R:TGATCCCGACTGCAAATTCACTCTC |
Additional files
Download links
A two-part list of links to download the article, or parts of the article, in various formats.
Downloads (link to download the article as PDF)
Open citations (links to open the citations from this article in various online reference manager services)
Cite this article (links to download the citations from this article in formats compatible with various reference manager tools)
ATG6 interacting with NPR1 increases Arabidopsis thaliana resistance to Pst DC3000/avrRps4 by increasing its nuclear accumulation and stability
eLife 13:RP97206.
https://doi.org/10.7554/eLife.97206.5


