RGS10 deficiency facilitates distant metastasis by inducing epithelial–mesenchymal transition in breast cancer
- Department of Oncology, Shengjing Hospital of China Medical University, China
- Department of Anesthesiology, Shengjing Hospital of China Medical University, China
- Department of Pathology, Shengjing Hospital of China Medical University, China
- Department of Nursing, Shengjing Hospital of China Medical University, China
- Breast Surgery of Panjin Central Hospital, China
Figures
Figure 1
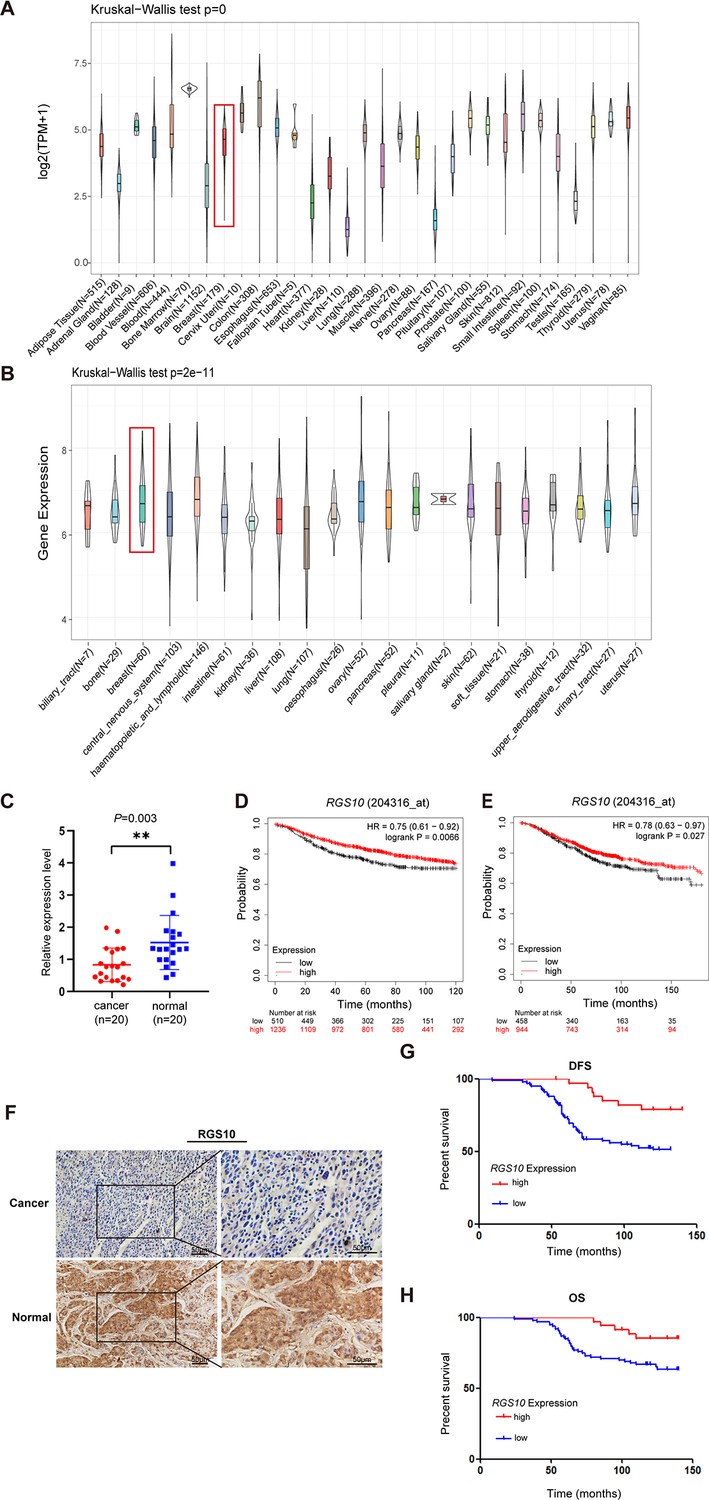
The expression and prognostic associations of RGS10 in breast cancer.
(A) RGS10 mRNA levels in 31 normal human tissues. Data were derived from the Genotype-Tissue Expression database. (B) RGS10 mRNA levels in cell lines representing 21 human cancers. Data were derived from the Cancer Cell Line Encyclopedia database. (C) qRT-PCR showing RGS10 mRNA levels in freshly resected breast cancer tissues (n = 20) and matched adjacent normal breast tissues. **p<0.01, Student’s t -test. (D, E) Survival analyses showing disease-free survival (DFS) (D) and overall survival (OS) (E) in patients with breast cancer stratified by high versus low RGS10 mRNA levels. Data were derived from the Kaplan–Meier plotter database. (F) Representative images showing immunohistochemical staining of RGS10 protein expression in breast cancer tissues or normal tissues (n = 133) (magnification: ×200 and ×400). (G, H) Kaplan–Meier analysis showing DFS (G) and OS (H) in patients with breast cancer stratified by presence versus absence of RGS10 protein in breast cancer tissues (n = 133).
-
Figure 1—source data 1
Original files for Figure 1.
- https://cdn.elifesciences.org/articles/97327/elife-97327-fig1-data1-v1.zip
Figure 2
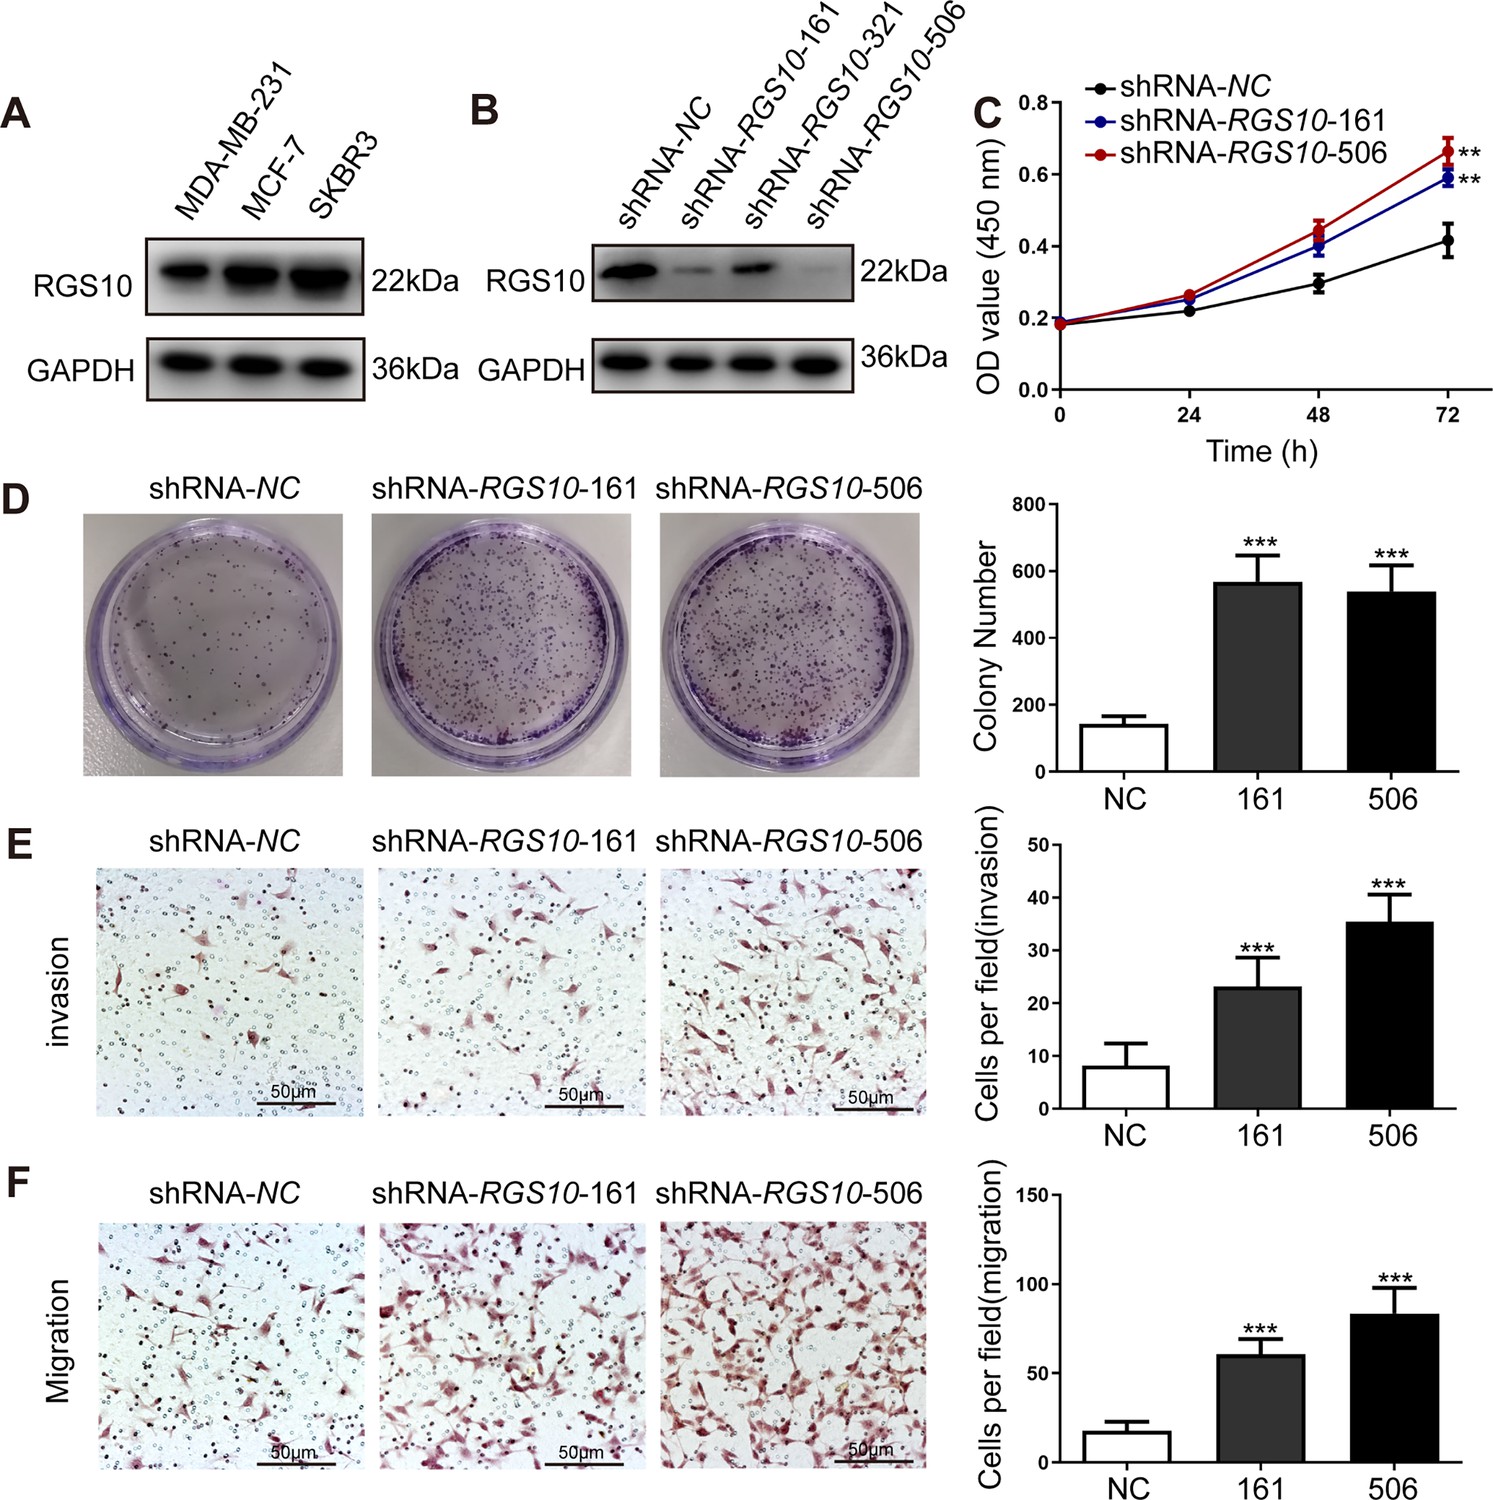
RGS10 silencing increases the proliferation and migration of breast cancer cells in vitro.
(A) Western blotting showing RGS10 protein levels in molecularly distinct breast cancer cell lines. The original files of the full raw unedited blots are provided in Figure 2—source data 1. The uncropped gels with the relevant bands labeled are provided in Figure 2—source data 2. The statistical data is provided in Figure 2—source data 3. (B) Western blotting showing RGS10 protein levels in SKBR3 cells transfected with three independent shRNA constructs, shRNA-RGS10-161, shRNA-RGS10-321, and shRNA-RGS10-506, and shRNA-NC. The original files of the full raw unedited blots are provided in Figure 2—source data 4. The uncropped gels with the relevant bands labeled are provided in Figure 2—source data 4. The statistical data is provided in Figure 2—source data 6. (C) CCK-8 assay showing the viability of SKBR3 cells transfected with shRNA-RGS10-161, shRNA-RGS10-506, or shRNA-NC. **p <0.01, one-way ANOVA. (D–F) Colony formation (D) and transwell migration/invasion (E, F) assays in SKBR3 cells transfected with shRNA-RGS10-161, shRNA-RGS10-506, or shRNA-NC. ***p<0.001, one-way ANOVA.
-
Figure 2—source data 1
Original files for the gels in Figure 2A.
- https://cdn.elifesciences.org/articles/97327/elife-97327-fig2-data1-v1.zip
-
Figure 2—source data 2
Uncropped gels with the relevant bands labeled in Figure 2A.
- https://cdn.elifesciences.org/articles/97327/elife-97327-fig2-data2-v1.zip
-
Figure 2—source data 3
Statistical data for Figure 2A.
- https://cdn.elifesciences.org/articles/97327/elife-97327-fig2-data3-v1.pdf
-
Figure 2—source data 4
Original files for the gels in Figure 2B.
- https://cdn.elifesciences.org/articles/97327/elife-97327-fig2-data4-v1.zip
-
Figure 2—source data 5
Uncropped gels with the relevant bands labeled in Figure 2B.
- https://cdn.elifesciences.org/articles/97327/elife-97327-fig2-data5-v1.zip
-
Figure 2—source data 6
Statistical data for Figure 2B.
- https://cdn.elifesciences.org/articles/97327/elife-97327-fig2-data6-v1.pdf
-
Figure 2—source data 7
Original files for Figure 2C.
- https://cdn.elifesciences.org/articles/97327/elife-97327-fig2-data7-v1.zip
-
Figure 2—source data 8
Original files for Figure 2D.
- https://cdn.elifesciences.org/articles/97327/elife-97327-fig2-data8-v1.zip
-
Figure 2—source data 9
Original files for Figure 2E.
- https://cdn.elifesciences.org/articles/97327/elife-97327-fig2-data9-v1.zip
-
Figure 2—source data 10
Original files for Figure 2F.
- https://cdn.elifesciences.org/articles/97327/elife-97327-fig2-data10-v1.zip
Figure 3
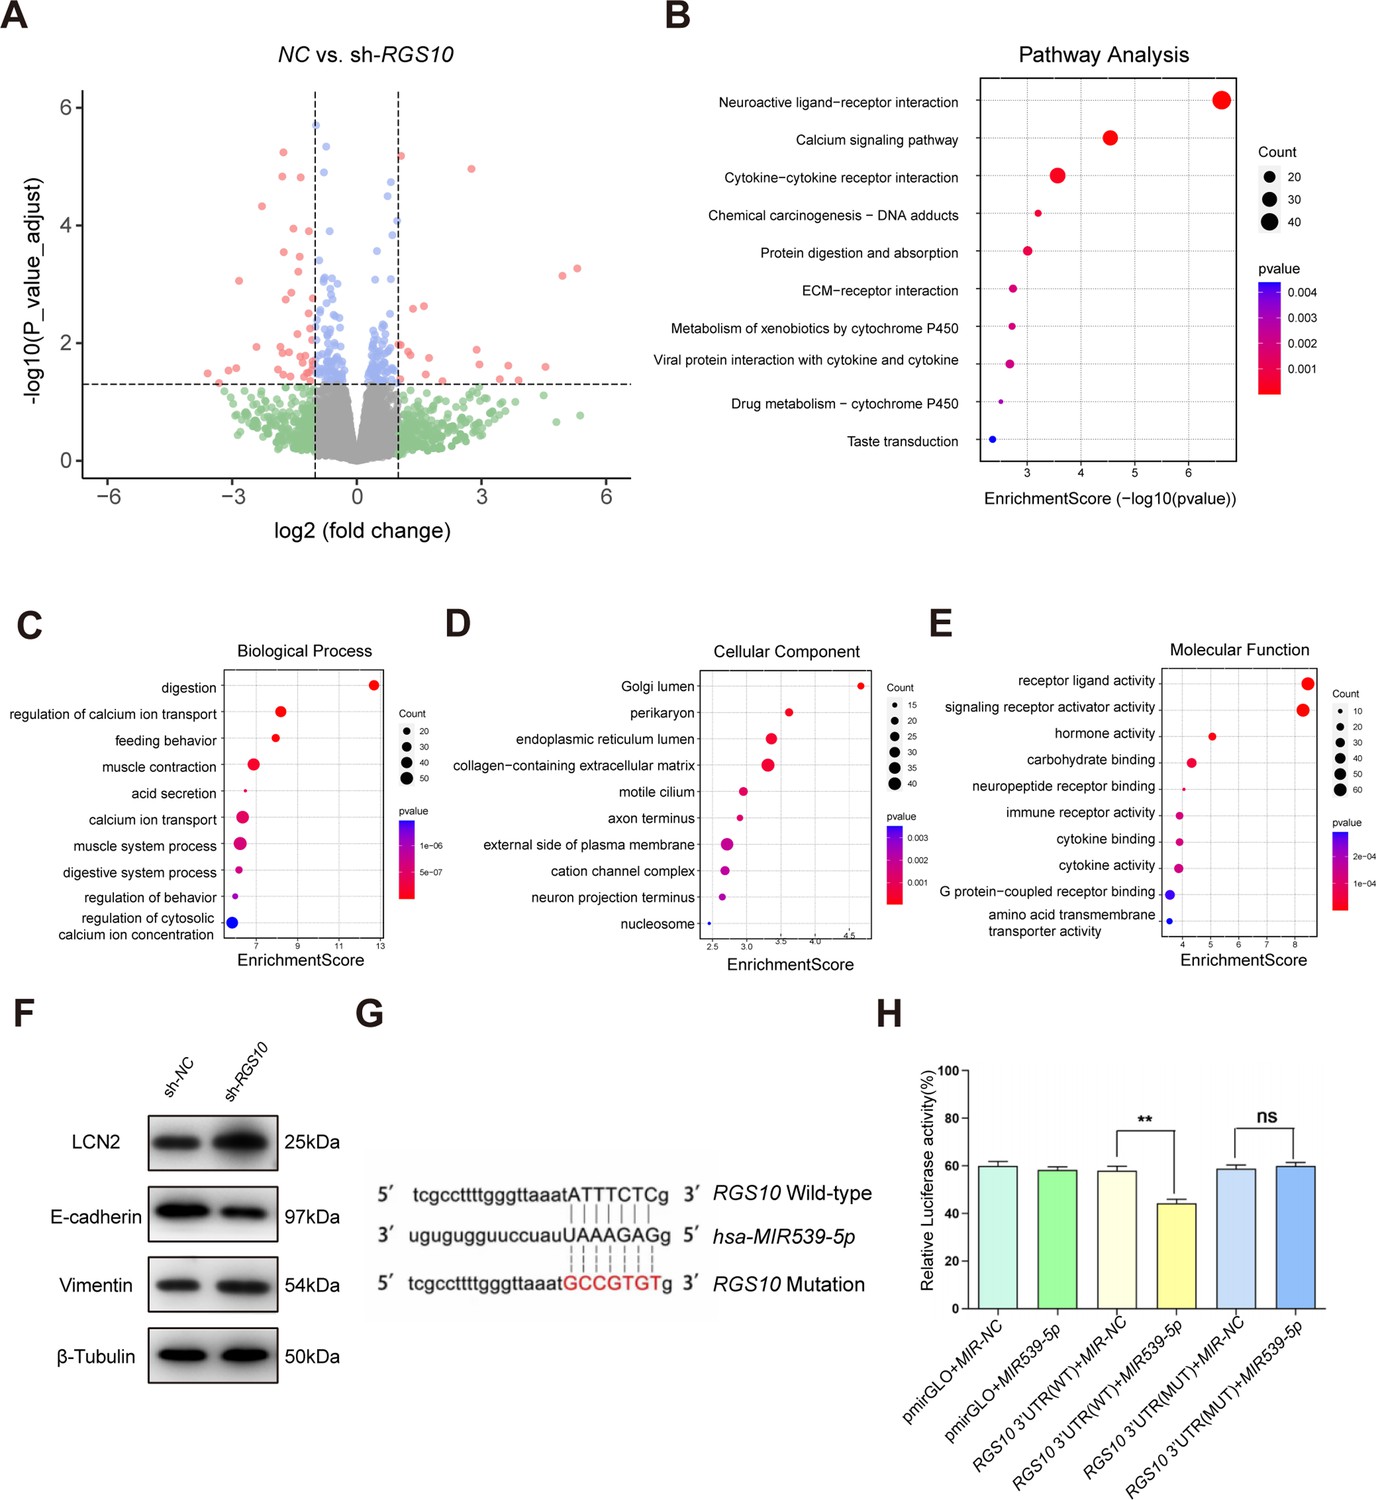
Protein–protein network interaction network and Gene Ontology (GO) functional- and Kyoto Encyclopedia of Genes and Genomes (KEGG) pathway-enrichment analysis of genes co-expressed with RGS10.
(A) Volcano plot showing differentially expressed genes between SKBR3 cells transfected with shRNA-RGS10 or shRNA-NC. (B–E) KEGG pathway analysis and GO enrichment analysis of differentially expressed genes showing the ten most enriched terms. BP: biological processes; MF: molecular function; CC: cellular compartment. (F) LCN2, E-cadherin, and vimentin protein levels in SKBR3 cells transfected with shRNA-RGS10 or shRNA-NC. The original files of the full raw unedited blots are provided in Figure 3—source data 1. The uncropped gels with the relevant bands labeled are provided in Figure 3—source data 2. The statistical data is provided in Figure 3—source data 3. (G) Schematics of predicted MIR539-5p binding sites between wild-type and mutant RGS10 sequences in the 3ʹ-untranslated regions. (H) Relative luciferase activities detected after cotransfection of wild-type or mutant luciferase reporter plasmids and an MIR539-mimic.
-
Figure 3—source data 1
Original files for the gels in Figure 3F.
- https://cdn.elifesciences.org/articles/97327/elife-97327-fig3-data1-v1.zip
-
Figure 3—source data 2
Uncropped gels with the relevant bands labeled in Figure 3F.
- https://cdn.elifesciences.org/articles/97327/elife-97327-fig3-data2-v1.zip
-
Figure 3—source data 3
Statistical data for Figure 3F.
- https://cdn.elifesciences.org/articles/97327/elife-97327-fig3-data3-v1.pdf
-
Figure 3—source data 4
Original files for Figure 3A–E, G and H.
- https://cdn.elifesciences.org/articles/97327/elife-97327-fig3-data4-v1.zip
Figure 4
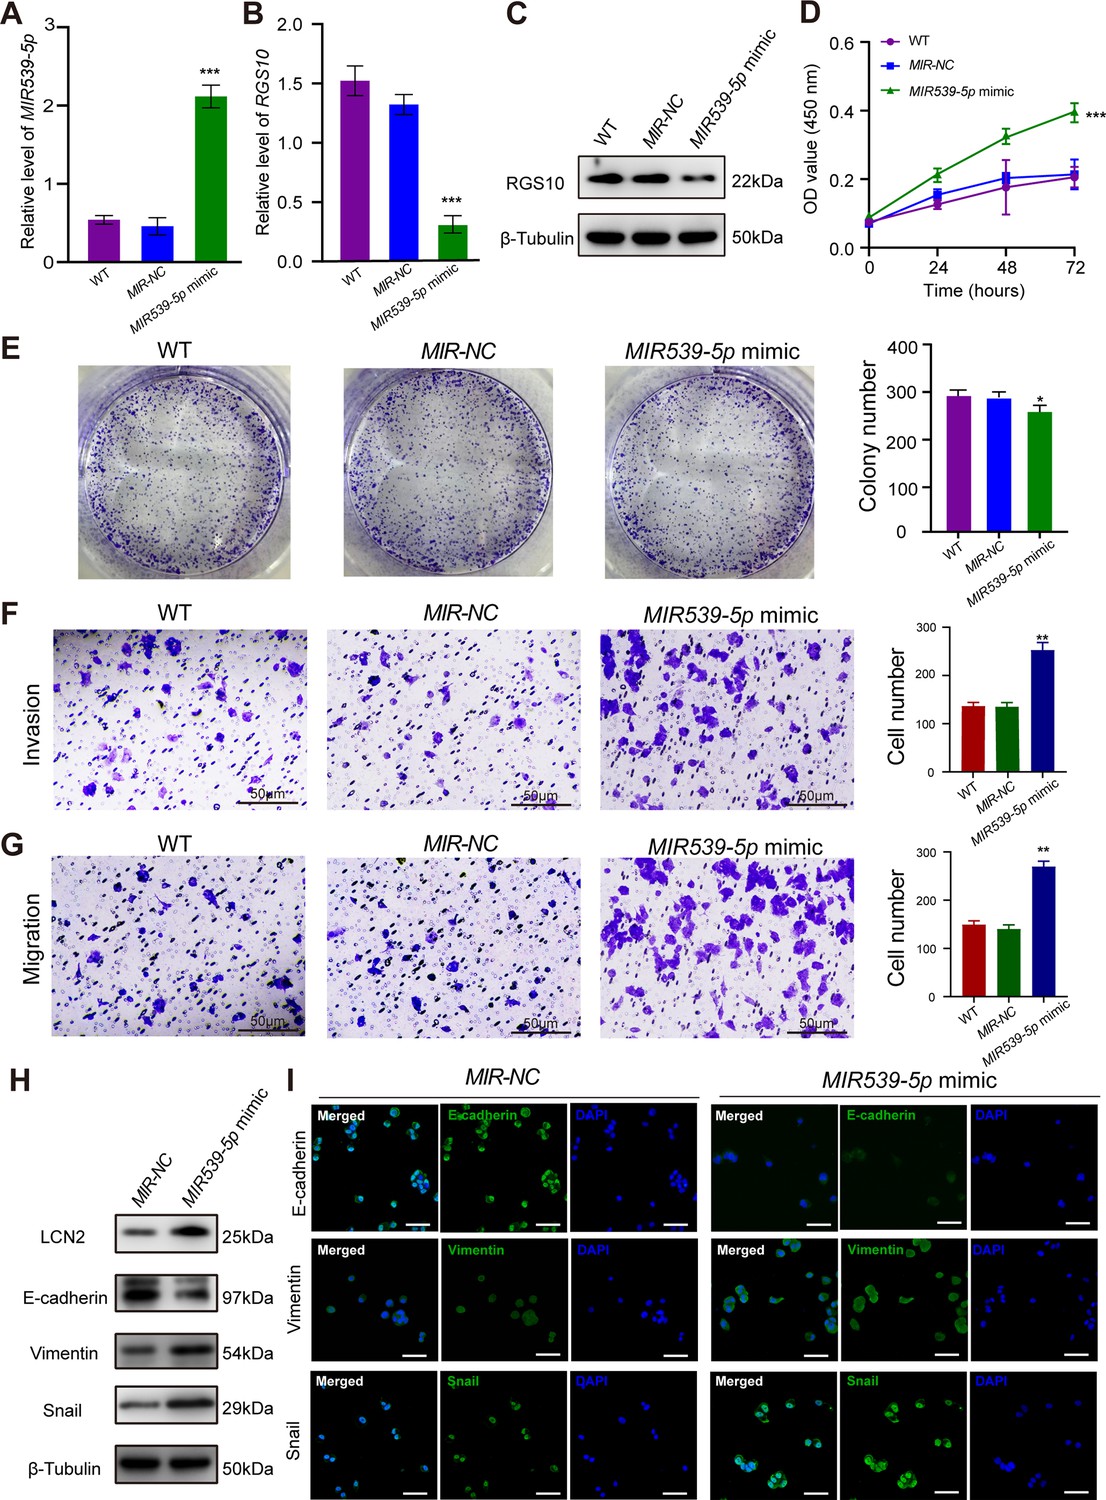
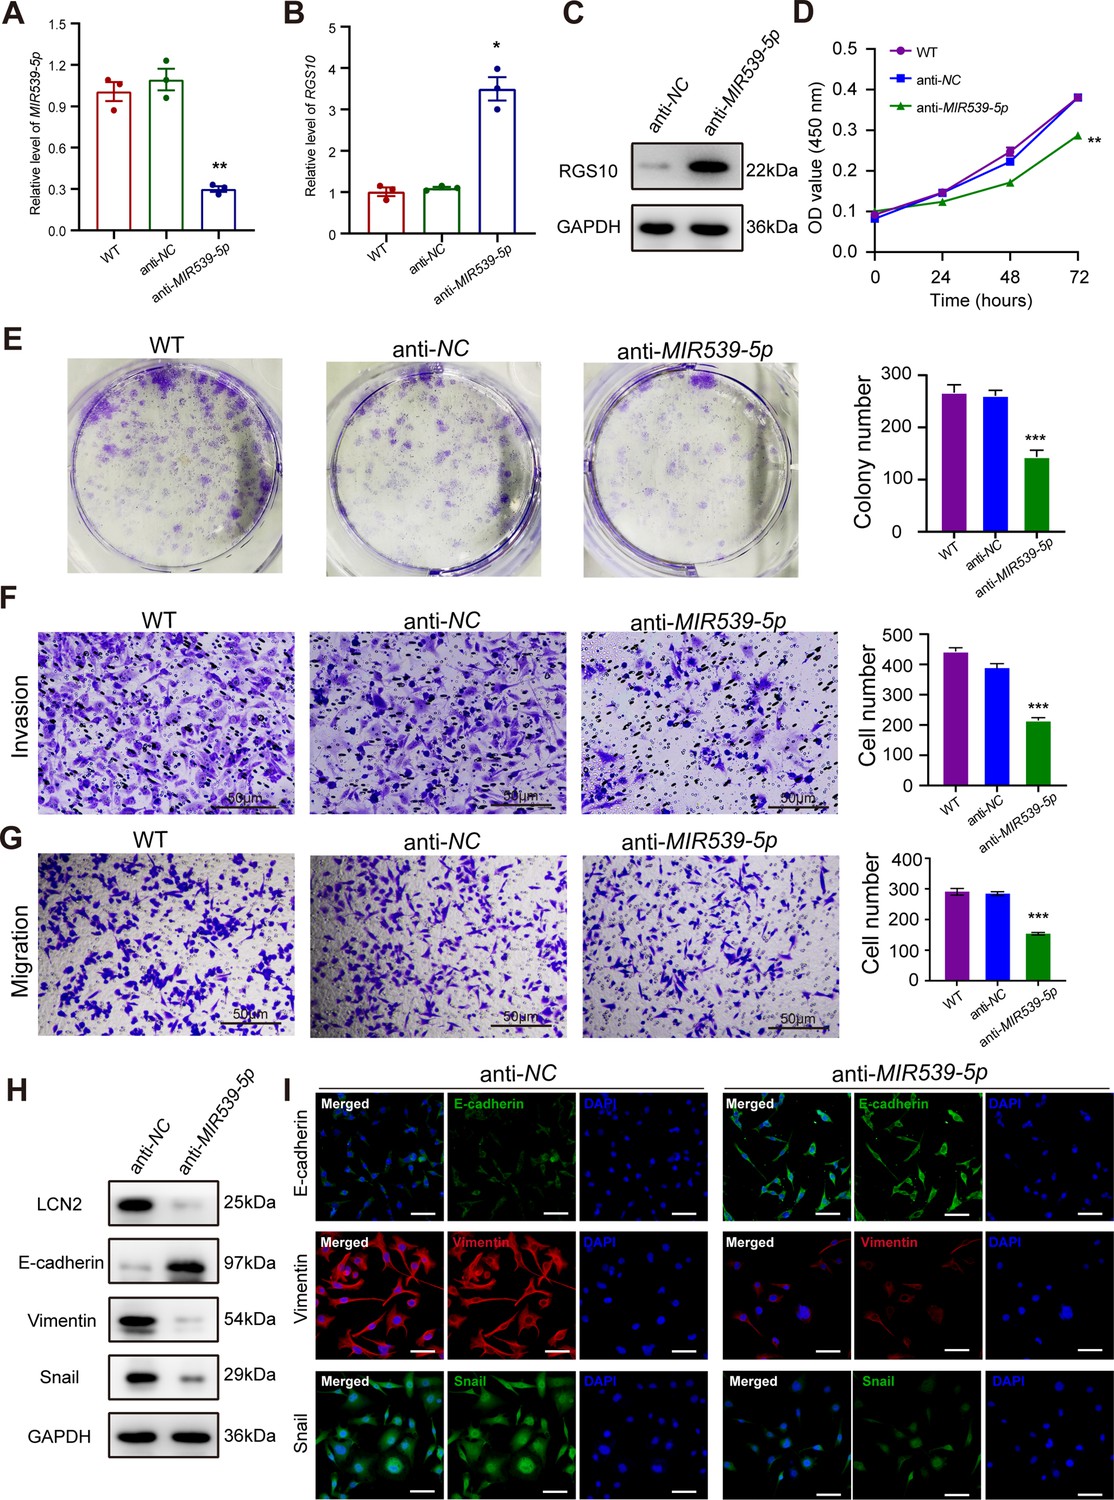
MIR539-5p regulates the migration, invasion, proliferation, and epithelial–mesenchymal transition (EMT) of breast cancer cells.
(A) qPCR showing the transfection efficiency of the MIR539-5p mimic. ***p<0.001, one-way ANOVA. (B, C) qRT-PCR and western blotting showing RGS10 mRNA and protein levels in SKBR3 cells transfected with the MIR539-5p mimic, negative control (NC), or wild type (WT). ***p<0.001, one-way ANOVA. The original files of the full raw unedited blots are provided in Figure 4—source data 1. The uncropped gels with the relevant bands labeled are provided in Figure 4—source data 2. The statistical data is provided in Figure 4—source data 3. (D) CCK-8 assay showing the viability of SKBR3 cells transfected with the MIR539-5p mimic, NC, or WT. ***p<0.001, one-way ANOVA. (E–G) Colony formation (E) and transwell migration/invasion (F, G) assays in SKBR3 cells transfected with the MIR539-5p mimic, NC, or WT. *p<0.05, **p<0.01, Student’s t-test. (H) Western blotting showing protein levels of LCN2 and biomarkers of EMT in SKBR3 cells transfected with the MIR539-5p mimic or NC. The original files of the full raw unedited blots are provided in Figure 4—source data 4. The uncropped gels with the relevant bands labeled are provided in Figure 4—source data 5. The statistical data is provided in Figure 4—source data 6. (I) Immunofluorescence staining showing E-cadherin, vimentin, and snail protein expression in SKBR3 cells transfected with the MIR539-5p mimic or NC. Scale bar: 50 µm.
-
Figure 4—source data 1
Original files for the gels in Figure 4C.
- https://cdn.elifesciences.org/articles/97327/elife-97327-fig4-data1-v1.zip
-
Figure 4—source data 2
Uncropped gels with the relevant bands labeled in Figure 4C.
- https://cdn.elifesciences.org/articles/97327/elife-97327-fig4-data2-v1.zip
-
Figure 4—source data 3
Statistical data for Figure 4C.
- https://cdn.elifesciences.org/articles/97327/elife-97327-fig4-data3-v1.pdf
-
Figure 4—source data 4
Original files for the gels in Figure 4H.
- https://cdn.elifesciences.org/articles/97327/elife-97327-fig4-data4-v1.zip
-
Figure 4—source data 5
Uncropped gels with the relevant bands labeled in Figure 4H.
- https://cdn.elifesciences.org/articles/97327/elife-97327-fig4-data5-v1.zip
-
Figure 4—source data 6
Statistical data for Figure 4H.
- https://cdn.elifesciences.org/articles/97327/elife-97327-fig4-data6-v1.pdf
-
Figure 4—source data 7
Original files for Figure 4A, B and D.
- https://cdn.elifesciences.org/articles/97327/elife-97327-fig4-data7-v1.zip
-
Figure 4—source data 8
Original files for Figure 4E.
- https://cdn.elifesciences.org/articles/97327/elife-97327-fig4-data8-v1.zip
-
Figure 4—source data 9
Original files for Figure 4F.
- https://cdn.elifesciences.org/articles/97327/elife-97327-fig4-data9-v1.zip
-
Figure 4—source data 10
Original files for Figure 4G.
- https://cdn.elifesciences.org/articles/97327/elife-97327-fig4-data10-v1.zip
-
Figure 4—source data 11
Original files for Figure 4I.
- https://cdn.elifesciences.org/articles/97327/elife-97327-fig4-data11-v1.zip
Figure 5
MIR539-5p inhibitor suppresses breast cancer cell proliferation and invasion.
(A) qPCR showing transfection efficiency of the MIR539-5p inhibitor after 48 hr. ***p<0.001, one-way ANOVA. (B, C) qRT-PCR and western blotting showing RGS10 mRNA and protein levels in MDA-MB-231 cells transfected with the MIR539-5p inhibitor, negative control (NC), or wild type (WT). ***p<0.001, one-way ANOVA. The original files of the full raw unedited blots are provided in Figure 5—source data 1. The uncropped gels with the relevant bands labeled are provided in Figure 5—source data 2. The statistical data is provided in Figure 5—source data 3. (D) CCK-8 assay showing the viability of MDA-MB-231 cells transfected with the MIR539-5p inhibitor, NC, or WT. ***p<0.001, one-way ANOVA. (E–G) Colony formation (E) and transwell migration/invasion (F, G) assays in MDA-MB-231 cells transfected with the MIR539-5p inhibitor, NC, or WT. *p<0.05, **p<0.01, Student’s t-test. (H) Western blotting showing protein levels of LCN2 and biomarkers of EMT in MDA-MB-231 cells transfected with the MIR539-5p inhibitor or NC. The original files of the full raw unedited blots are provided in Figure 5—source data 4. The uncropped gels with the relevant bands labeled are provided in Figure 5—source data 5. The statistical data is provided in Figure 5—source data 6. (I) Immunofluorescence staining showing E-cadherin, vimentin, and snail protein expression in MDA-MB-231 cells transfected with the MIR539-5p inhibitor or NC. Scale bar: 50 µm.
-
Figure 5—source data 1
Original files for the gels in Figure 5C.
- https://cdn.elifesciences.org/articles/97327/elife-97327-fig5-data1-v1.zip
-
Figure 5—source data 2
Uncropped gels with the relevant bands labeled in Figure 5C.
- https://cdn.elifesciences.org/articles/97327/elife-97327-fig5-data2-v1.zip
-
Figure 5—source data 3
Statistical data for Figure 5C.
- https://cdn.elifesciences.org/articles/97327/elife-97327-fig5-data3-v1.pdf
-
Figure 5—source data 4
Original files for the gels in Figure 5H.
- https://cdn.elifesciences.org/articles/97327/elife-97327-fig5-data4-v1.zip
-
Figure 5—source data 5
Uncropped gels with the relevant bands labeled in Figure 5H.
- https://cdn.elifesciences.org/articles/97327/elife-97327-fig5-data5-v1.zip
-
Figure 5—source data 6
Statistical data for Figure 5H.
- https://cdn.elifesciences.org/articles/97327/elife-97327-fig5-data6-v1.pdf
-
Figure 5—source data 7
Original files for Figure 5A, B and D.
- https://cdn.elifesciences.org/articles/97327/elife-97327-fig5-data7-v1.zip
-
Figure 5—source data 8
Original files for Figure 5E.
- https://cdn.elifesciences.org/articles/97327/elife-97327-fig5-data8-v1.zip
-
Figure 5—source data 9
Original files for Figure 5F.
- https://cdn.elifesciences.org/articles/97327/elife-97327-fig5-data9-v1.zip
-
Figure 5—source data 10
Original files for Figure 5G.
- https://cdn.elifesciences.org/articles/97327/elife-97327-fig5-data10-v1.zip
-
Figure 5—source data 11
Original files for Figure 5I.
- https://cdn.elifesciences.org/articles/97327/elife-97327-fig5-data11-v1.zip
Figure 6
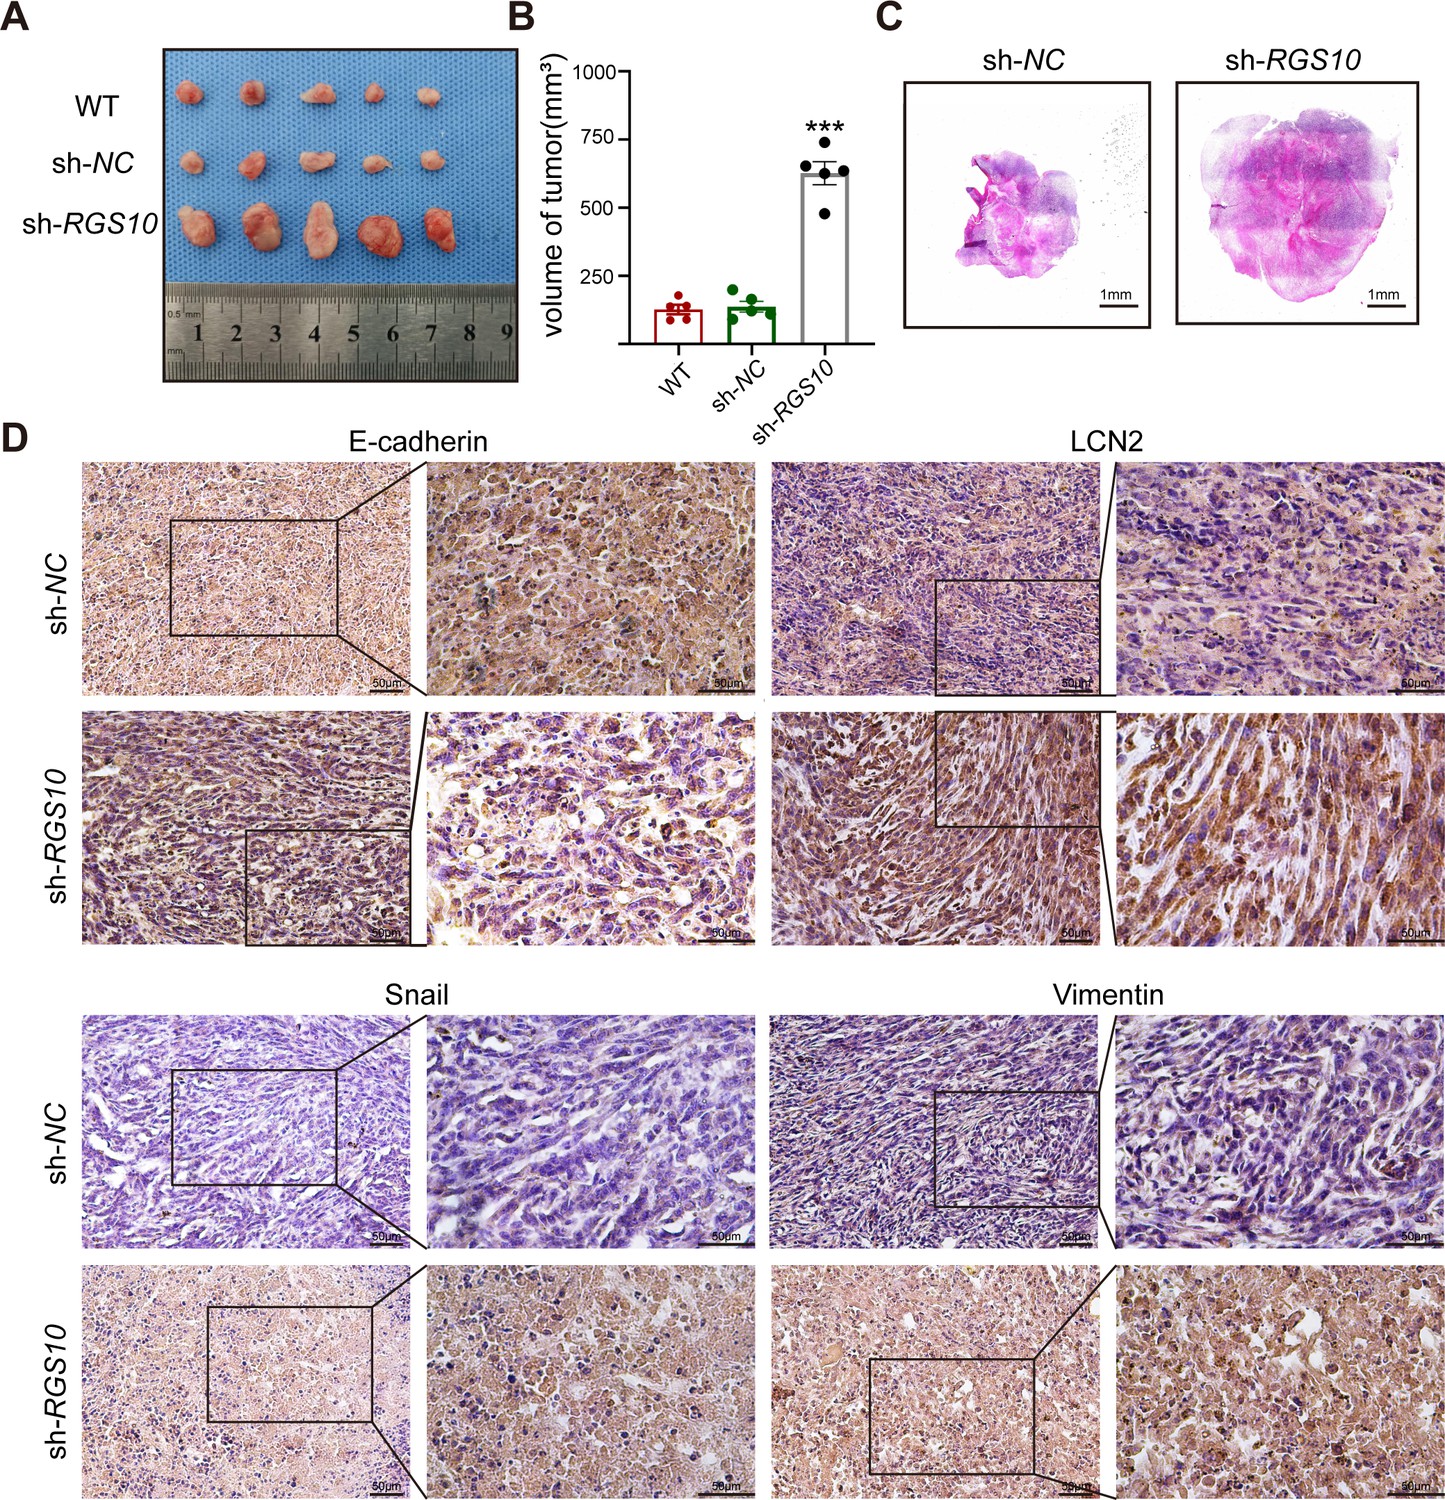
RGS10 inhibits breast cancer growth by targeting LCN2 in vivo.
(A) Size of tumors derived from RGS10-depleted SKBR3 cells, negative control (NC), and wild type (WT). (B) Volume of tumors derived from RGS10-depleted SKBR3 cells, NC, and WT. ***p<0.001, one-way ANOVA. (C) Hematoxylin and eosin staining of tumors derived from RGS10-depleted SKBR3 cells and NC. (D) Immunohistochemical staining showing LCN2, E-cadherin, snail, and vimentin protein expression in tumors derived from RGS10-depleted SKBR3 cells and NC.
-
Figure 6—source data 1
Original files for the gels in Figure 6A.
- https://cdn.elifesciences.org/articles/97327/elife-97327-fig6-data1-v1.zip
-
Figure 6—source data 2
Uncropped gels with the relevant bands labeled in Figure 6B.
- https://cdn.elifesciences.org/articles/97327/elife-97327-fig6-data2-v1.zip
-
Figure 6—source data 3
Statistical data for Figure 6C.
- https://cdn.elifesciences.org/articles/97327/elife-97327-fig6-data3-v1.zip
-
Figure 6—source data 4
Original files for the gels in Figure 6D.
- https://cdn.elifesciences.org/articles/97327/elife-97327-fig6-data4-v1.zip
Author response image 1

Tables
Table 1
Clinicopathological characteristics of 20 patients.
| Clinicopathological characteristics | Patient 1 | Patient 2 | Patient 3 | Patient 4 | Patient 5 |
|---|---|---|---|---|---|
| Sex | Female | Female | Female | Female | Female |
| Age (years) | 58 | 40 | 70 | 38 | 58 |
| T grade | 2 | 1 | 2 | 1 | 1 |
| N grade | 0 | 1 | 3 | 0 | 1 |
| Menopausal status | Postmenopausal | Premenopausal | Postmenopausal | Premenopausal | Postmenopausal |
| Subclass | Luminal A | Luminal A | Luminal A | Luminal A | Luminal A |
| Metastasis | No | No | No | No | No |
| Patient 6 | Patient 7 | Patient 8 | Patient 9 | Patient 10 | |
| Sex | Female | Female | Female | Female | Female |
| Age (years) | 59 | 56 | 80 | 55 | 37 |
| T grade | 2 | 2 | 3 | 2 | 1 |
| N grade | 3 | 0 | 2 | 2 | 3 |
| Menopausal status | Postmenopausal | Postmenopausal | Postmenopausal | Postmenopausal | Premenopausal |
| Subclass | Luminal B | Luminal B | Luminal B | Luminal B | Luminal B |
| Metastasis | No | No | No | No | No |
| Patient 11 | Patient 12 | Patient 13 | Patient 14 | Patient 15 | |
| Sex | Female | Female | Female | Female | Female |
| Age (years) | 62 | 57 | 41 | 53 | 58 |
| T grade | 2 | 2 | 2 | 1 | 2 |
| N grade | 3 | 1 | 3 | 3 | 1 |
| Menopausal status | Postmenopausal | Postmenopausal | Premenopausal | Postmenopausal | Postmenopausal |
| Subclass | HER2 positive | HER2 positive | HER2 positive | HER2 positive | HER2 positive |
| Metastasis | No | No | No | No | No |
| Patient 16 | Patient 17 | Patient 18 | Patient 19 | Patient 20 | |
| Sex | Female | Female | Female | Female | Female |
| Age (years) | 50 | 37 | 35 | 51 | 55 |
| T grade | 2 | 2 | 2 | 2 | 2 |
| N grade | 0 | 0 | 0 | 0 | 0 |
| Menopausal status | Premenopausal | Premenopausal | Premenopausal | Premenopausal | Postmenopausal |
| Subclasses | Triple negative | Triple negative | Triple negative | Triple negative | Triple negative |
| Metastasis | No | No | No | No | No |
-
HER2, human epidermal growth factor receptor 2.
Table 2
Correlations between RGS10 expression and clinicopathological characteristics.
| Variable | RGS10 expression (n, %) | RGS10 expression (n, %) | p-Value |
|---|---|---|---|
| No. of patients | 34 (25.6) | 99 (74.4) | |
| Age (years) | 0.590 | ||
| ≤45 | 8 (23.5) | 28 (28.3) | |
| >45 | 26 (76.5) | 71 (71.7) | |
| Other disease | 0.746 | ||
| Yes | 28 (82.4) | 79 (79.8) | |
| No | 6 (17.6) | 20 (20.2) | |
| Histological grade | 0.744 | ||
| I | 12 (35.3) | 30 (30.3) | |
| II | 19 (55.9) | 56 (56.6) | |
| III | 3 (8.8) | 13 (13.1) | |
| Tumor size (cm) | 0.101 | ||
| Median (range) | 2.191 (1.0–8.0) | 1.861 (0.6–4.0) | |
| No. of positive axillary lymph nodes | 0.316 | ||
| Median (range) | 1.06 (0–19) | 1.93 (0–27) | |
| No. of pregnancies | 0.706 | ||
| Median (range) | 2.50 (1–6) | 2.40 (0–7) | |
| No. of births | 0.497 | ||
| Median (range) | 1.62 (1–3) | 1.75 (0–7) | |
| Age at first pregnancy (years) | 0.489 | ||
| <21 | 1 (2.9) | 6 (6.1) | |
| 21–25 | 15 (44.1) | 42 (42.4) | |
| 26–30 | 18 (52.9) | 46 (46.5) | |
| >30 | 0 (0) | 5 (5.0) | |
| Menopausal status | 0.216 | ||
| Premenopausal | 21 (61.8) | 49 (49.5) | |
| Postmenopausal | 13 (38.2) | 50 (50.5) | |
| Estrogen receptor status | 0.397 | ||
| Positive | 25 (73.5) | 65 (65.7) | |
| Negative | 9 (26.5) | 34 (34.3) | |
| Progesterone receptor status | 0.527 | ||
| Positive | 25 (73.5) | 78 (78.8) | |
| Negative | 9 (26.5) | 21 (21.2) | |
| HER2 status | 0.496 | ||
| Positive | 6 (17.6) | 23 (23.2) | |
| Negative | 28 (82.4) | 76 (76.8) | |
| Ki67 status | 0.773 | ||
| >20 | 14 (41.2) | 38 (38.4) | |
| ≤20 | 20 (58.8) | 61 (61.6) | |
| Molecular type | 0.043 | ||
| Luminal A | 6 (17.6) | 30 (30.3) | |
| Luminal B | 19 (55.9) | 36 (36.3) | |
| HER2+ | 2 (5.9) | 16 (16.2) | |
| Triple-negative breast cancer | 7 (20.6) | 17 (17.2) | |
| Distant metastasis | 0.008 | ||
| Yes | 7 (20.6) | 46 (46.5) | |
| No | 27 (79.4) | 53 (53.5) | |
| Disease-free survival (months) | <0.001 | ||
| Median (range) | 114.71 (53–140) | 89.66 (9–132) | |
| Death | 0.024 | ||
| Yes | 5 (14.7) | 35 (35.4) | |
| No | 29 (85.3) | 64 (64.6) | |
| Overall survival (months) | 0.030 | ||
| Median (range) | 120.41 (80–140) | 107.64 (24–140) |
-
HER2, human epidermal growth factor receptor 2.
Table 3
Univariate and multivariate Cox regression analyses of clinicopathological risk factors for disease-free survival (DFS).
| Variable | DFS | |||
|---|---|---|---|---|
| Univariate analysis | Multivariate analysis | |||
| HR (95% CI) | p-Value | HR (95% CI) | p-Value | |
| Age (years) | 0.720 (0.400–1.296) | 0.273 | NA | |
| Other disease | 0.885 (0.445–1.762) | 0.728 | NA | |
| Histological grade | ||||
| I | 0.003 | 0.004 | ||
| II | 2.636 (1.263–5.503) | 0.010 | 2.704 (1.294–5.649) | 0.008 |
| III | 4.638 (1.877–11.462) | 0.001 | 4.566 (1.846–11.294) | 0.001 |
| Tumor size (cm) | 1.065 (0.840–1.350) | 0.605 | NA | |
| No. of positive axillary lymph nodes | 1.012 (0.953–1.074) | 0.698 | NA | |
| No. of pregnancies | 0.835 (0.662–1.054) | 0.129 | NA | |
| No. of births | 0.694 (0.481–1.001) | 0.051 | NA | |
| Age at first pregnancy (years) | NA | |||
| <21 | 0.501 | |||
| 21–25 | 3.336 (0.449–24.810) | 0.239 | ||
| 26–30 | 3.886 (0.530–28.499) | 0.182 | ||
| >30 | 1.838 (0.115–29.429) | 0.667 | ||
| Menopausal status | 0.844 (0.492–1.451) | 0.540 | NA | |
| Estrogen receptor status | 1.534 (0.820–2.869) | 0.180 | NA | |
| Progesterone receptor status | 1.098 (0.577–2.089) | 0.776 | NA | |
| HER2 status | 0.841 (0.433–1.635) | 0.610 | NA | |
| Ki67 status | 0.816 (0.465–1.431) | 0.478 | NA | |
| Molecular type | NA | |||
| Luminal A | 0.307 | |||
| Luminal B | 1.940 (0.819–4.593) | 0.132 | ||
| HER2+ | 1.147 (0.479–2.747) | 0.758 | ||
| Triple-negative breast cancer | 1.453 (0.527–4.007) | 0.470 | ||
| RGS10 expression | 0.323 (0.146–0.716) | 0.005 | 0.321 (0.144–0.713) | 0.005 |
-
HR, hazard ratio; HER2, human epidermal growth factor receptor 2; NA, not analyzed.
Table 4
Univariate and multivariate Cox regression analyses of clinicopathological risk factors for overall survival.
| Variable | Overall survival | |||
|---|---|---|---|---|
| Univariate analysis | Multivariate analysis | |||
| HR (95% CI) | p-Value | HR (95% CI) | p-Value | |
| Age (years) | 0.423 (0.226–0.792) | 0.007 | 0.305 (0.154–0.603) | 0.001 |
| Other disease | 0.984 (0.453–2.136) | 0.967 | NA | |
| Histological grade | ||||
| I | 0.067 | 0.008 | ||
| II | 1.519 (0.703–3.284) | 0.288 | 1.834 (0.840–4.007) | 0.128 |
| III | 3.062 (1.180–7.943) | 0.021 | 5.090 (1.812–14.300) | 0.002 |
| Tumor size (cm) | 1.045 (0.788–1.385) | 0.760 | NA | |
| No. of positive axillary lymph nodes | 1.011 (0.943–1.083) | 0.759 | NA | |
| No. of pregnancies | 0.941 (0.731–1.213) | 0.640 | NA | |
| No. of births | 0.896 (0.625–1.285) | 0.550 | NA | |
| Age at first pregnancy (years) | NA | |||
| <21 | 0.580 | |||
| 21–25 | 2.818 (0.378–21.001) | 0.312 | ||
| 26–30 | 2.021 (0.269–15.190) | 0.494 | ||
| >30 | 3.255 (0.295–35.934) | 0.335 | ||
| Menopausal status | 0.769 (0.405–1.458) | 0.420 | NA | |
| Estrogen receptor status | 0.769 (0.405–1.458) | 0.420 | NA | |
| Progesterone receptor status | 1.091 (0.519–2.293) | 0.818 | NA | |
| HER2 status | 0.587 (0.246–1.398) | 0.229 | NA | |
| Ki67 status | 0.718 (0.370–1.392) | 0.327 | NA | |
| Molecular type | NA | |||
| Luminal A | 0.589 | |||
| Luminal B | 0.639 (0.295–1.383) | 0.255 | ||
| HER2+ | 0.756 (0.272–2.100) | 0.592 | ||
| Triple-negative breast cancer | 1.079 (0.467–2.493) | 0.860 | ||
| RGS10 expression | 0.353 (0.138–0.900) | 0.029 | 0.364 (0.154–0.603) | 0.001 |
-
HR, hazard ratio; HER2, human epidermal growth factor receptor 2; NA, not analyzed.
Table 5
Gene sets enriched in phenotype ‘high’.
| MSigDB collection | Gene set name | NES | NOMp-value | FDR q-value |
|---|---|---|---|---|
| h.all.v6.2.symbols.gmt [Hallmarks] | HALLMARK_ALLOGRAFT_REJECTION | –2.55 | 0 | 0 |
| HALLMARK_APOPTOSIS | –2.41 | 0 | 0 | |
| HALLMARK_IL6_JAK_STAT3_SIGNALING | –2.40 | 0 | 0 | |
| HALLMARK_IL2_STAT5_SIGNALING | –2.39 | 0 | 0 | |
| HALLMARK_INFLAMMATORY_RESPONSE | –2.37 | 0 | 0 | |
| HALLMARK_INTERFERON_GAMMA_RESPONSE | –2.33 | 0 | 0 | |
| HALLMARK_COMPLEMENT | –2.27 | 0 | 0 | |
| HALLMARK_KRAS_SIGNALING_UP | –2.25 | 0 | 0 | |
| HALLMARK_INTERFERON_ALPHA_RESPONSE | –2.22 | 0 | 0 | |
| HALLMARK_APICAL_JUNCTION | –2.13 | 0 | 0 |
-
Gene sets with NOM p-value <0.05 and FDR q-value <0.25 were considered as significant.
-
MSigDB, Molecular Signatures Database; NES, normalized enrichment score; NOM, nominal; FDR, false discovery rate.
Key resources table
| Reagent type (species) or resource | Designation | Sourceor reference | Identifiers | Additional information |
|---|---|---|---|---|
| Cell line (SKBR3) | HER2+ breast cancer cell line | ATCC | Cell line cultured in McCoy’s 5A Culture medium supplemented with 10% FBS | |
| Cell line (MCF-7) | ER+/PR+ breast cancer cell line | ATCC | Cell line cultured in DMEM high glucose Culture medium supplemented with 10% FBS | |
| Cell line (MDA-MB- 231) | Triple-negative breast cancer cell line | ATCC | Cell line cultured in L-15 Culture medium supplemented with 10% FBS | |
| Transfected construct (human) | RGS10 shRNA#161,321,506 | Syngentech Biotechnology | Lentiviral construct to transfect and express the shRNA | |
| Transfected construct (human) | MIRNA-539-5p mimics and inhibitor | GenePharma Biotechnology | ||
| Antibody | Anti- RGS10 (rabbit monoclonal) | Abcam | Cat# ab154172 | WB (1:250) IHC (1:50) |
| Antibody | Anti- lipocalin-2 (rabbit monoclonal) | ABclonal | Cat# A2092 | WB (1:1000) IHC (1:500) |
| Antibody | Anti- E-cadherin (rabbit monoclonal) | Proteintech | Cat# 20874-1-AP | WB (1:1000) IHC (1:500) IF (1:100) |
| Antibody | Anti-vimentin (mouse monoclonal) | HUABIO | Cat# EM0401 | WB (1:1000) IHC (1:200) IF (1:100) |
| Antibody | Anti-snail (rabbit monoclonal) | ABclonal | Cat# A5243 | WB (1:1000) IHC (1:00) IF (1:100) |
| Antibody | Anti-GAPDH (rabbit monoclonal) | CST | Cat# 5174 | WB (1:1000) |
| Antibody | Anti- β-tubulin (rabbit monoclonal) | ABclonal | Cat# AC008 | WB (1:5000) |
| Sequence-based reagent | RGS10_F | This paper | PCR primers | CACGACAGCGATGGCAGTTCC |
| Sequence-based reagent | RGS10_R | This paper | PCR primers | CTTTTCACGCCTTCTGGGTCTTCC |
| Sequence-based reagent | MIR539-5p_F | This paper | PCR primers | CGCTGCATGGAGAAATTATCCT |
| Sequence-based reagent | MIR539-5p_R | This paper | PCR primers | CAGTGCAGGGTCCGAGGT |
| Software, algorithm | SPSS | SPSS | SPSS, version 25.0 Armonk, NY |
Additional files
Download links
A two-part list of links to download the article, or parts of the article, in various formats.
Downloads (link to download the article as PDF)
Open citations (links to open the citations from this article in various online reference manager services)
Cite this article (links to download the citations from this article in formats compatible with various reference manager tools)
RGS10 deficiency facilitates distant metastasis by inducing epithelial–mesenchymal transition in breast cancer
eLife 13:RP97327.
https://doi.org/10.7554/eLife.97327.3


