Single-cell profiling reveals the intratumor heterogeneity and immunosuppressive microenvironment in cervical adenocarcinoma
- Fourth Department of Gynecologic Oncology, Hunan Cancer Hospital, The Affiliated Cancer Hospital of Xiangya School of Medicine, Central South University, China
- Department of Pathology, Third Hospital, School of Basic Medical Sciences, Peking University Health Science Center, China
- Department of Gynecologic Oncology, Changsha Kexin Cancer Hospital, China
- Department of Pathology, Hunan Cancer Hospital/The Affiliated Cancer Hospital of Xiangya School of Medicine, Central South University, China
- Xiangya Cancer Center, Xiangya Hospital, Central South University, China
- Hunan International Science and Technology Collaboration Base of Precision Medicine for Cancer, China
- Key Laboratory of Molecular Radiation Oncology of Hunan Province, China
Figures
Figure 1 with 1 supplement
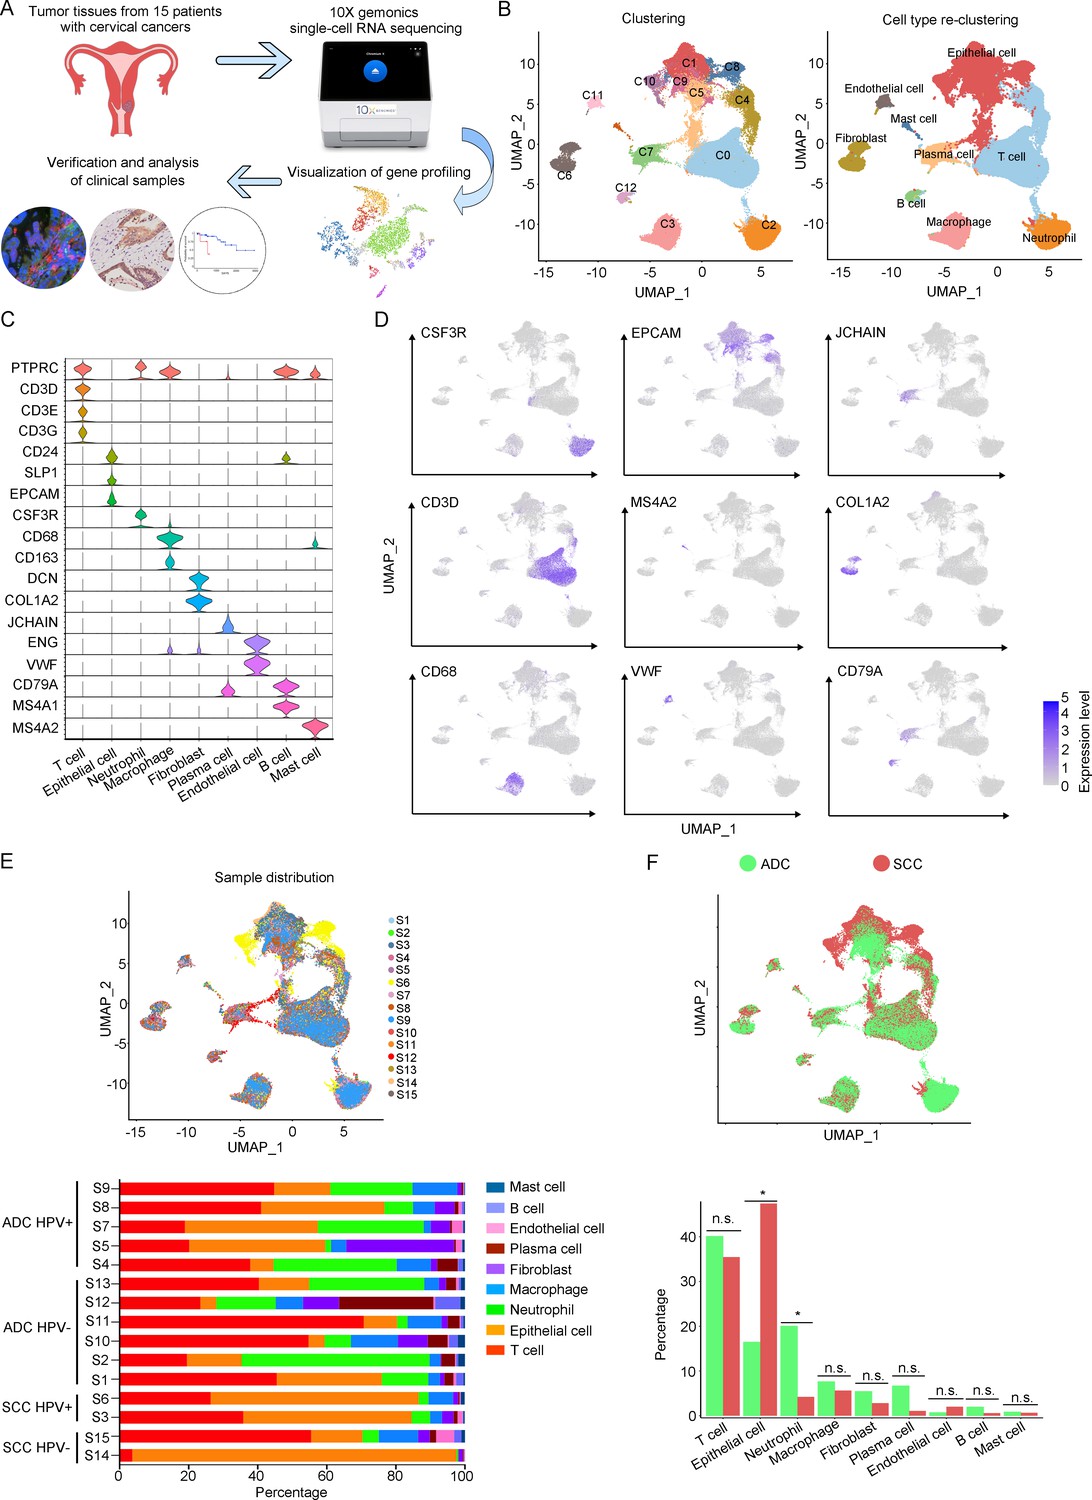
The single-cell genomic atlas of cervical cancer.
(A) The schematic design of sample collection, single-cell RNA sequencing, data processing, and clinical validating through 10X Genomics platform (the sketch of scRNA-sq machine, as well as the plot of dimension-reduction visualization, was originally cited from the official website of 10X Genomics: https://www.10xgenomics.com). (B) Uniform Manifold Approximation and Projection (UMAP) plots of all single cells by original clustering and cell type reclustering, according to the published lineage-specific marker genes, respectively. (C) Violin plots demonstrating the expression of marker genes that correspond to each of the major cell types. (D) UMAP plots demonstrating the most typical marker gene specific to each type of cell cluster. (E) UMAP plot and histogram plot showing the occupation ratios of the major cell types in each individual sample, with human papillomavirus (HPV) status and histological type summarized. (F) UMAP (up) and histogram (down) plots to show the differences of distribution and proportion of each cell type between different histological types (adenocarcinoma [ADC] vs. squamous cell carcinoma [SCC]). Statistics were performed using R software with two-sided Wilcoxon test (p values for each group are listed below: T cell: p=0.661; epithelial cell: p=0.039; neutrophil: p=0.026; macrophage: p=0.661; fibroblast: p=0.661; plasma: p=0.078; endothelial cell: p=0.851; B cell: p=0.104; mast cell: p=0.753). Statistics are shown as *p<0.05; **p<0.01; n.s., not significant.
-
Figure 1—source data 1
Annotated code for data used in Figure 1.
- https://cdn.elifesciences.org/articles/97335/elife-97335-fig1-data1-v1.zip
Figure 1—figure supplement 1
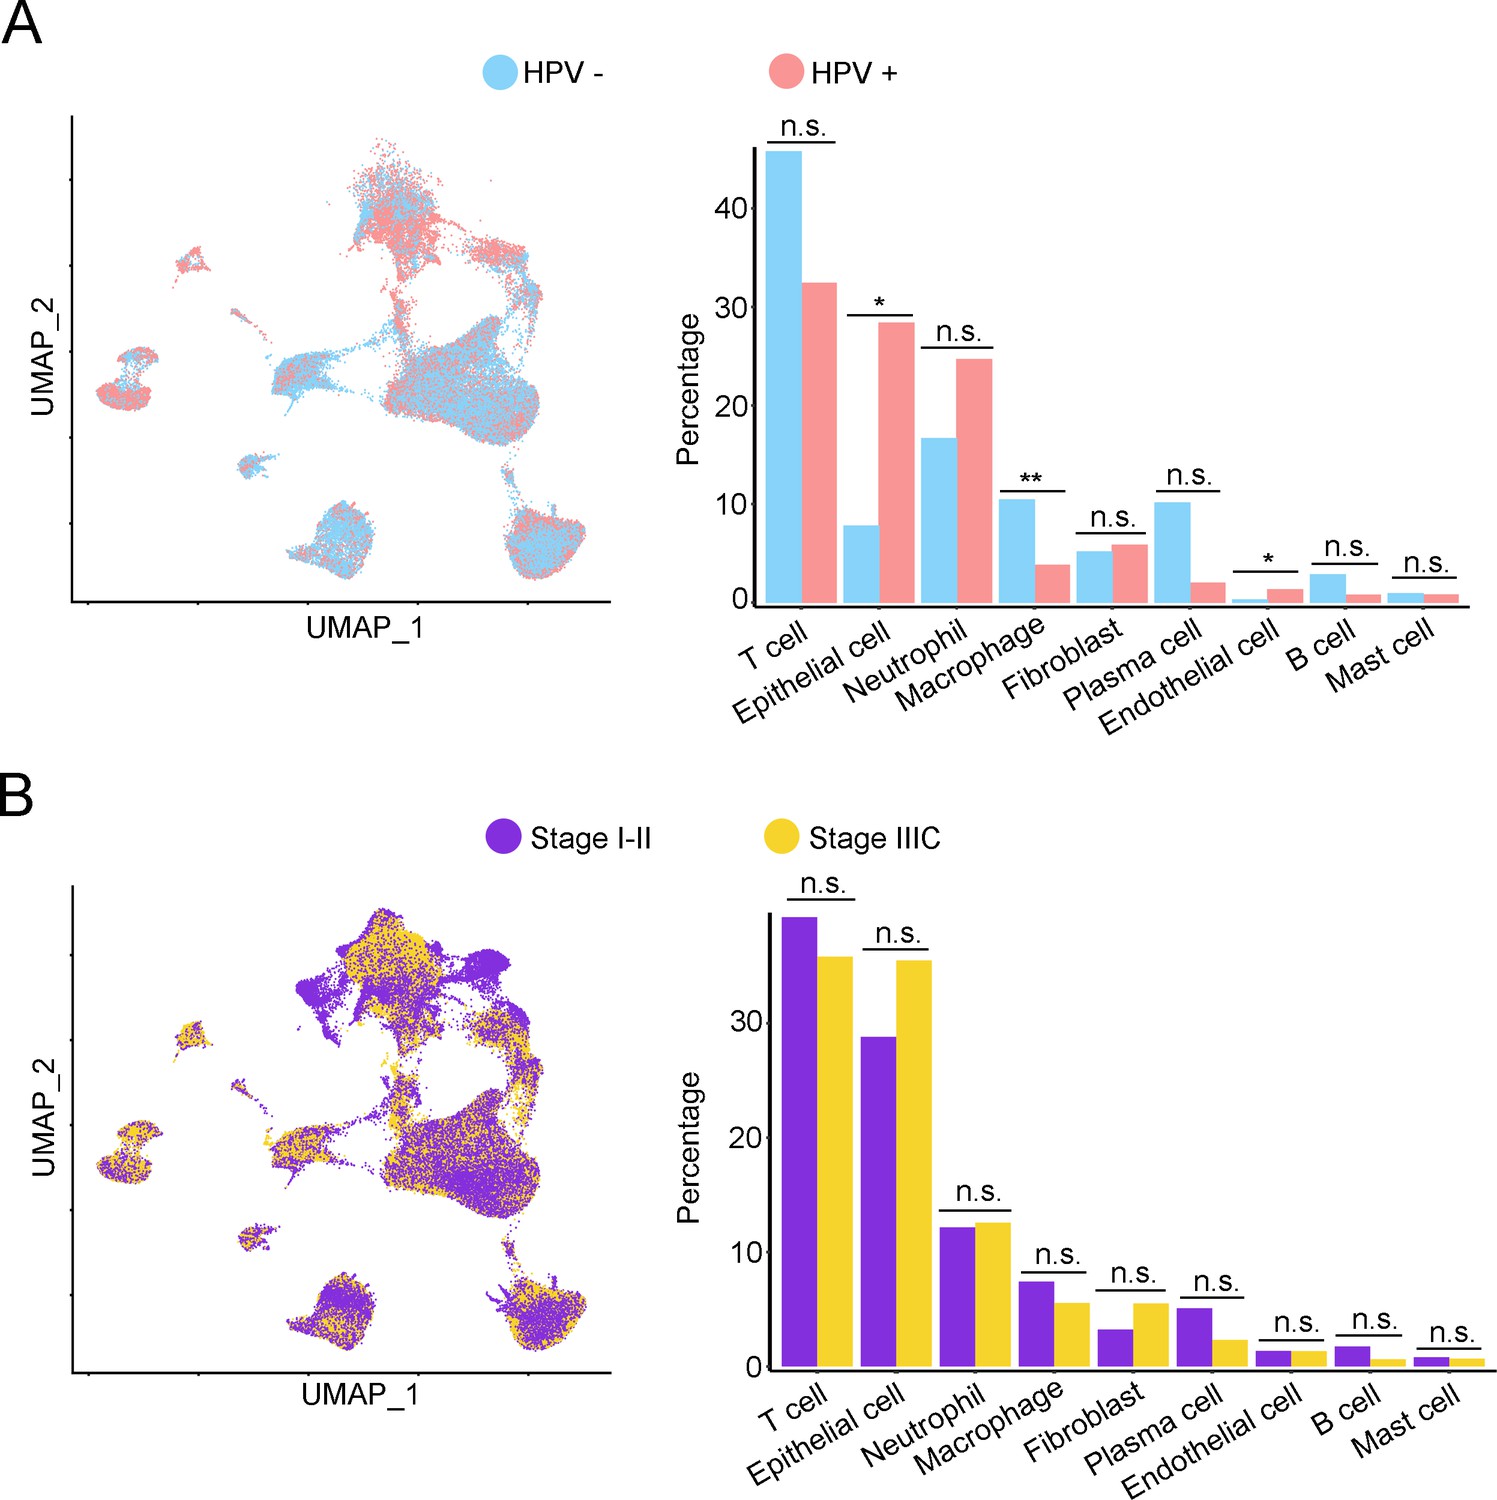
The single-cell genomic atlas of cervical cancer.
(A) Uniform Manifold Approximation and Projection (UMAP) and histogram plots to show the differences of distribution (left) and proportion (right) of each cell type between different human papillomavirus (HPV) infection status (HPV+ vs. HPV-). Statistics were performed using R software with two-sided Wilcoxon test (p values for each group are listed below: T cell: p=0.178; epithelial cell: p=0.017; neutrophil: p=0.792; macrophage: p=0.004; fibroblast: p=1.000; plasma: p=0.126; endothelial cell: p=0.017; B cell: p=0.247; mast cell: p=1). (B) The UMAP and histogram plots were used to compare the differences of distribution (left) and proportion (right) of each cell type between different stages (stage I–II vs. stage IIIC). Statistics were performed using and R software with two-sided Wilcoxon test. p values for each group are listed below: T cell: p=0.514; epithelial cell: p=0.953; neutrophil: p=0.953; macrophage: p=0.953; fibroblast: p=0.075; plasma: p=0.859; endothelial cell: p=0.440; B cell: p=0.953; mast cell: p=0.594. All statistics are shown as *p<0.05; **p<0.01; n.s., not significant.
Figure 2 with 1 supplement
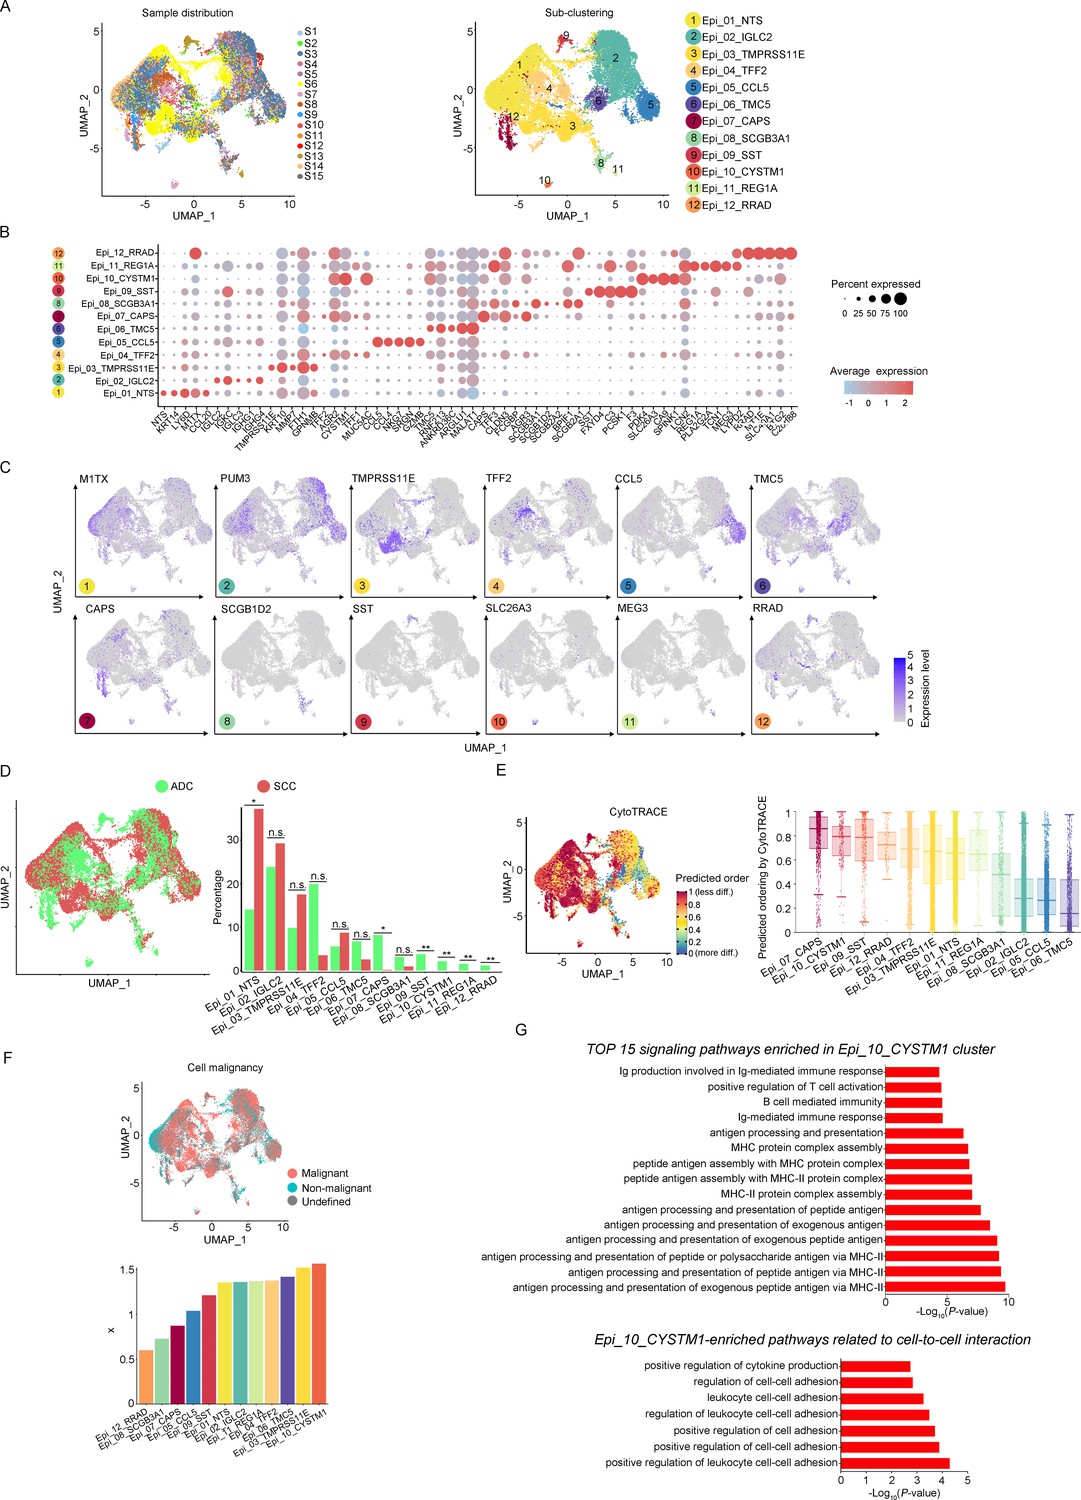
The scRNA-seq data reveals the malignant features of tumor epithelial cells.
(A) Uniform Manifold Approximation and Projection (UMAP) plots showing the distribution of epithelial cells in 15 samples and the sub-clustering into 12 clusters according to ectopic gene expressions. Each cluster of epithelial cells was named using the most highly enriched gene. (B) Heatmap plot showing the annotation of each epithelial sub-cluster with top 5 differently expressed genes (DEGs). (C) UMAP plots demonstrating the most specific gene as the marker for each sub-cluster. (D) UMAP (left) and histogram (right) plots to compare the differences of distribution and proportion of each epithelial cell sub-cluster between different histological types (adenocarcinoma [ADC] vs. squamous cell carcinoma [SCC]). Statistics were performed using R software with two-sided Wilcoxon test (p values for each group are listed below: Epi_01_NTS: p=0.040; Epi_02_IGLC2: p=0.661; Epi_03_TMRPSS11E: p=0.661; Epi_04_TTF2: p=0.104; Epi_05_CCL5: p=0.950; Epi_06_TMC5: p=0.412; Epi_07_CAPS: p=0.040; Epi_08_SCGB3A1: p=0.412; Epi_09_SST: p<0.001; Epi_10_CYSTM1: p<0.001; Epi_11_REG1A: p<0.001; Epi_12_RRAD: p<0.001). Statistics were shown as *p<0.05; **p<0.01; n.s., not significant. (E) UMAP plot of CytoTRACE showing the thermal imaging projection of predicted developmental order (left) and histogram plot showing the ranking of CytoTRACE scores (right). (F) UMAP plot of malignancy analysis demonstrating the cell malignancy features (up) and ranking of scores (down). (G) GOBP analyses showing the top 15 enriched signaling pathways of Epi_10_CYSTM1 that are more active in ADC than SCC (up), particularly pathways related to cell-to-cell interactions (down). The histogram data are transformed from -Log10(p-value) for visualization. Ig: immunoglobulin; MHC: major histocompatibility complex.
-
Figure 2—source data 1
Annotated code for data used in Figure 2.
- https://cdn.elifesciences.org/articles/97335/elife-97335-fig2-data1-v1.zip
Figure 2—figure supplement 1
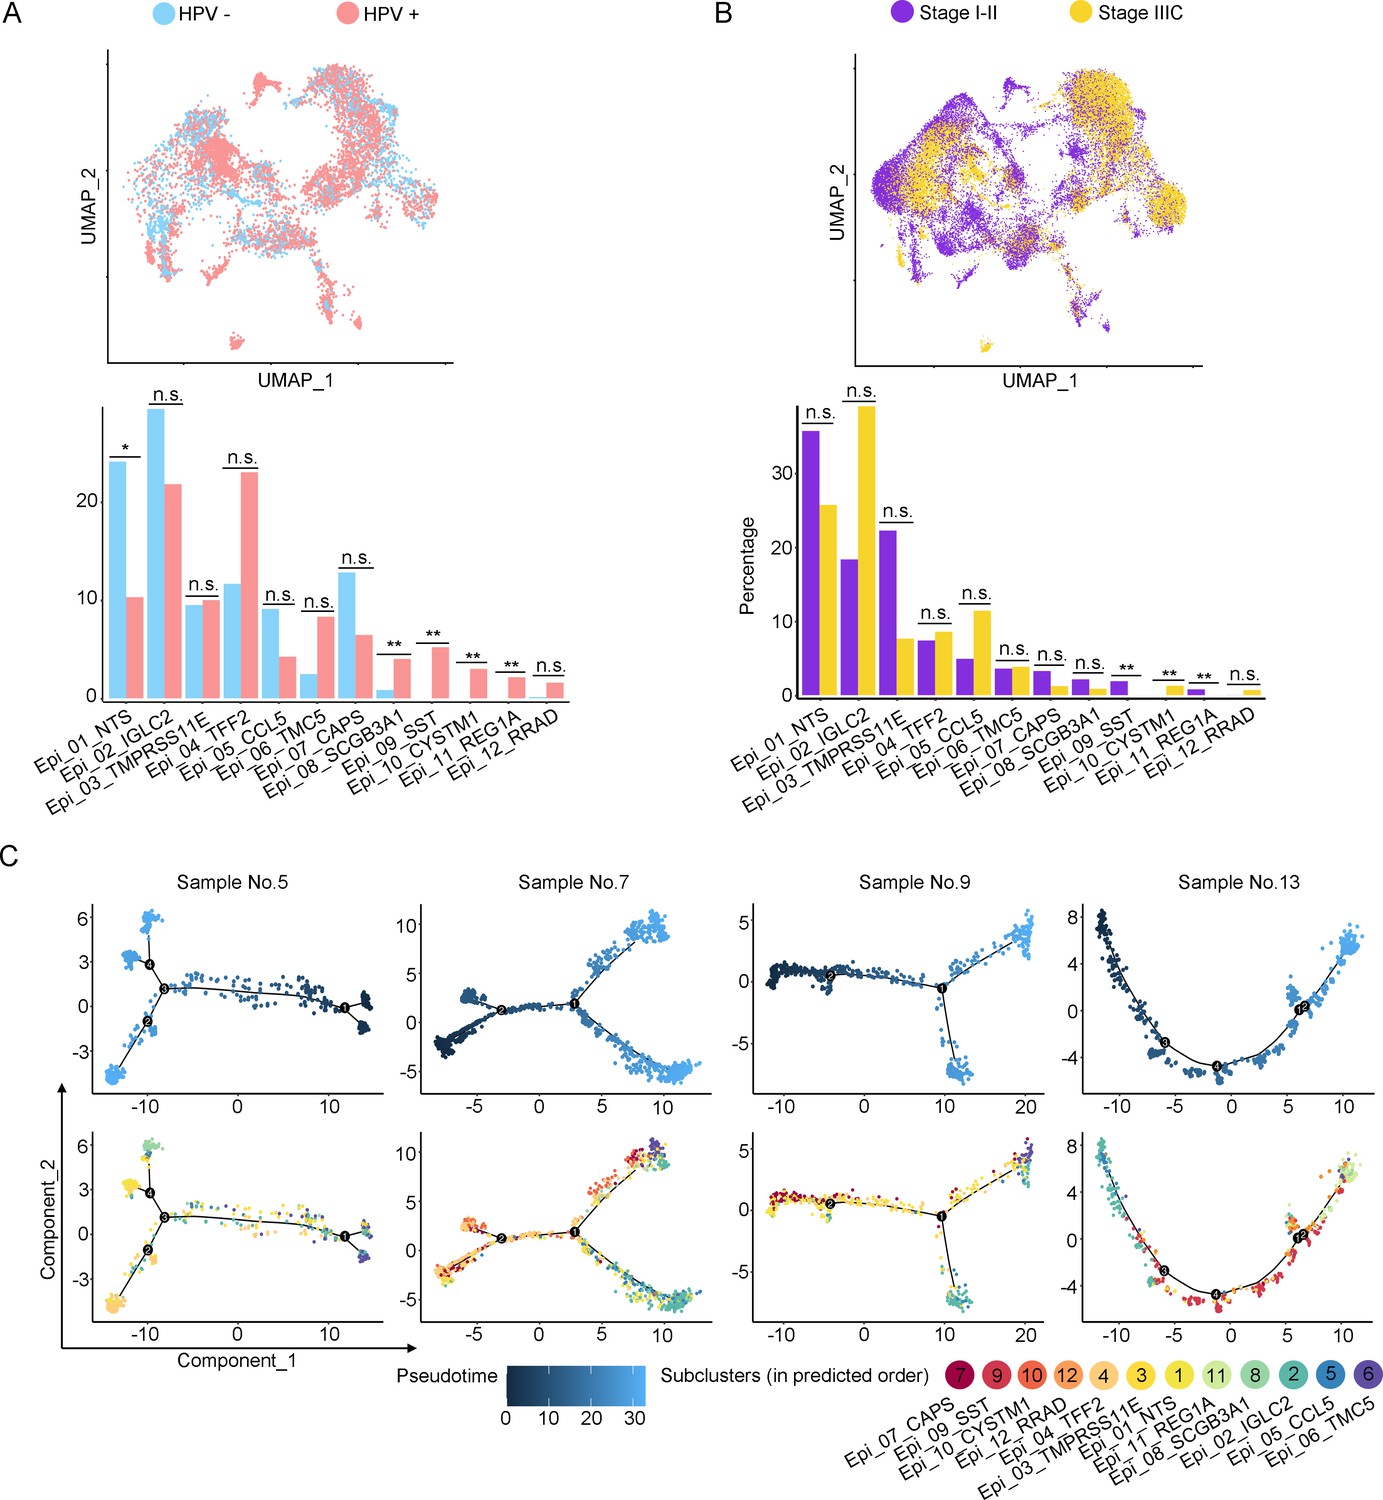
The scRNA-seq data reveals the malignant features of tumor epithelial cells.
(A, B) Uniform Manifold Approximation and Projection (UMAP) and histogram plots to compare the differences of distribution (up) and proportion (down) of each epithelial cell sub-cluster between different human papillomavirus (HPV) infection status (HPV+ vs. HPV-, p values for each group are listed below: Epi_01_NTS: p=0.017; Epi_02_IGLC2: p=0.792; Epi_03_TMRPSS11E: p=0.792; Epi_04_TTF2: p=0.662; Epi_05_CCL5: p=0.247; Epi_06_TMC5: p=0.082; Epi_07_CAPS: p=0.429; Epi_08_SCGB3A1: p=0.009; Epi_09_SST: p<0.001; Epi_10_CYSTM1: p<0.001; Epi_11_REG1A: p<0.001; Epi_12_RRAD: p=0.662) and different stages (stage I–II vs. stage IIIC, p values for each group are listed below: Epi_01_NTS: p=0.953; Epi_02_IGLC2: p=0.679; Epi_03_TMRPSS11E: p=0.440; Epi_04_TTF2: p=0.100; Epi_05_CCL5: p=0.371; Epi_06_TMC5: p=0.440; Epi_07_CAPS: p=0.514; Epi_08_SCGB3A1: p=0.440; Epi_09_SST: p<0.001; Epi_10_CYSTM1: p<0.001; Epi_11_REG1A: p<0.001; Epi_12_RRAD: p=0.161). (C) Pseudotime trajectory plots from four individual cases to represent the predicted developmental potential of epithelial cells. Statistics were performed using R software with two-sided Wilcoxon test. All statistics are shown as *p<0.05; **p<0.01; n.s., not significant.
Figure 3 with 2 supplements
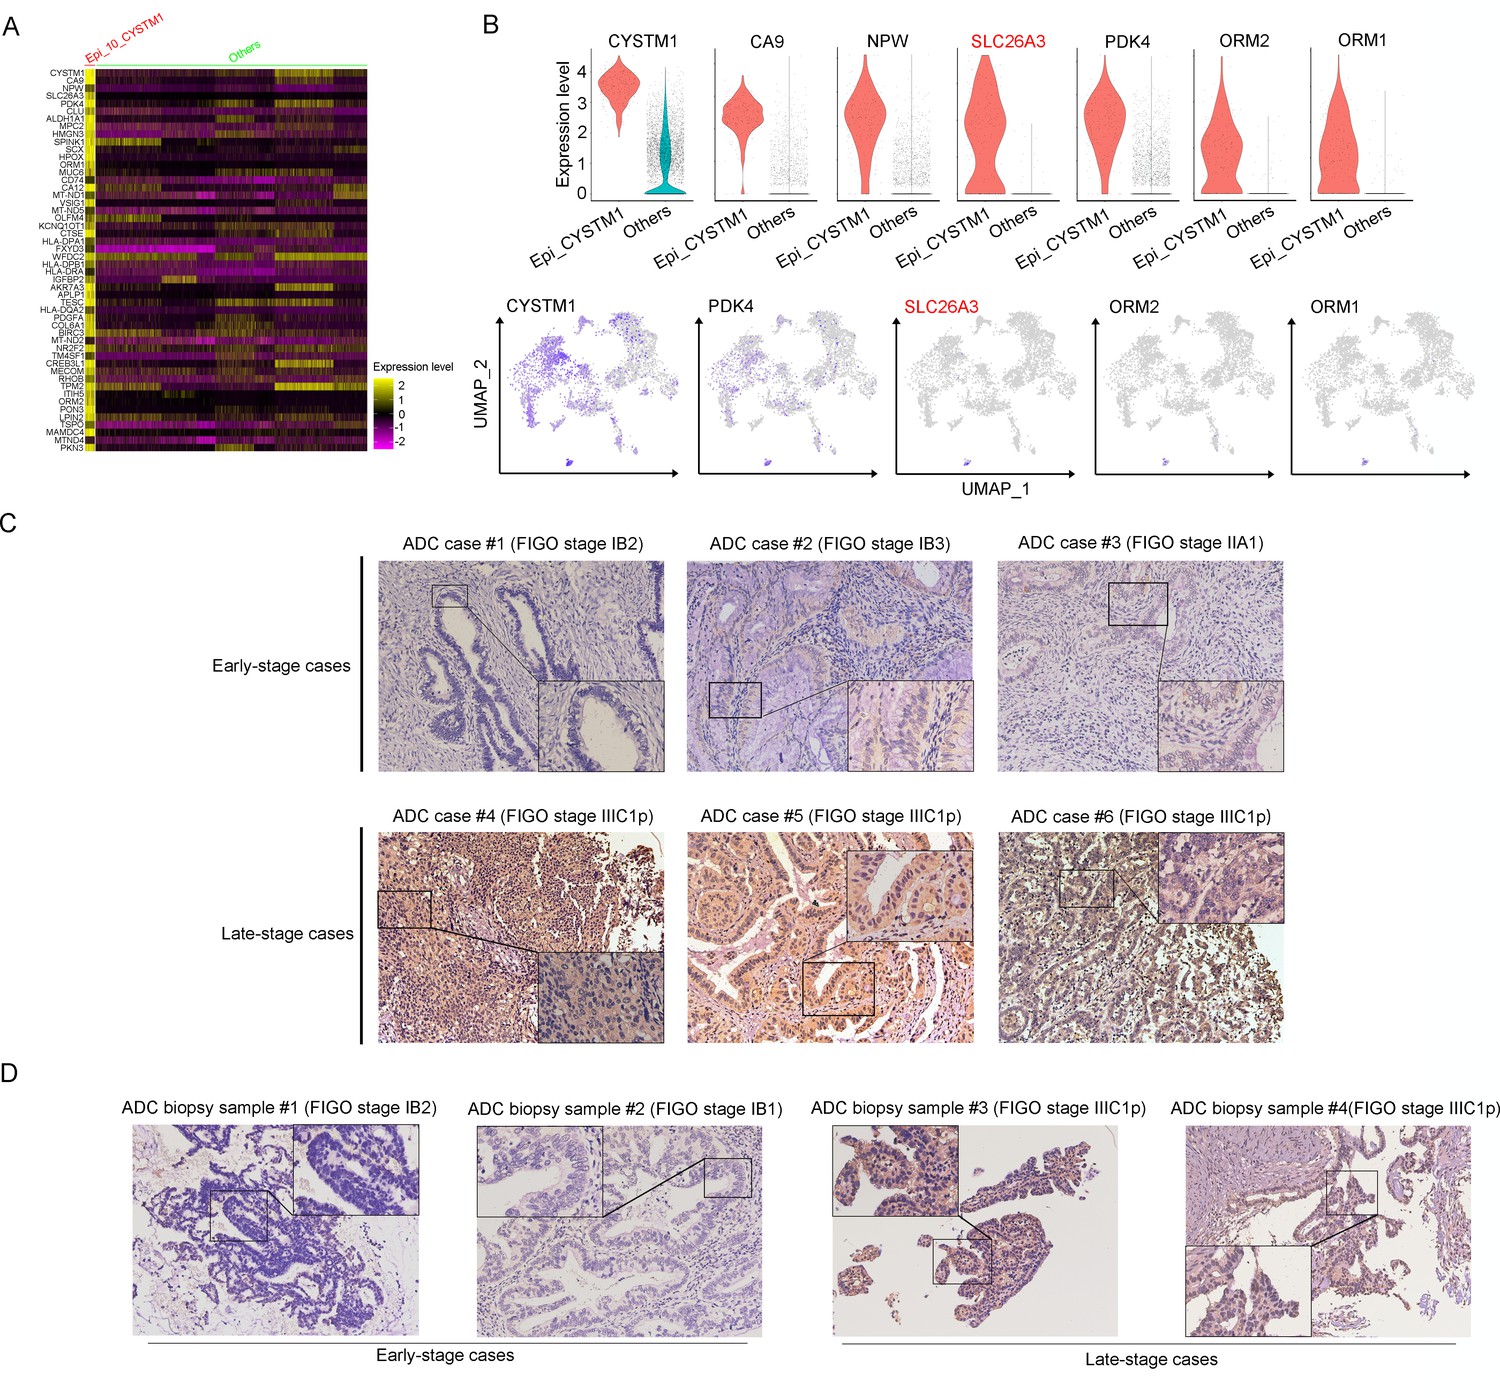
SLC26A3 is identified as a potential prognostic and diagnostic indicator for lymph node metastasis of cervical cancer (CC) patients.
(A) Heatmap showing the top 50 differently expressed genes (DEGs) of Epi_10_CYSTM1 cluster in comparison to all the other sub-clusters (red: Epi_10_CYSTM1 cluster; green: other epithelial cell sub-clusters). (B) Violin plots showing the expression difference between two groups (top), with Uniform Manifold Approximation and Projection (UMAP) plots (bottom) demonstrating the specificity of each candidate gene, filtering SLC26A3 as the most identical marker for this sub-cluster. (C) Immunohistochemistry (IHC) staining showing the protein expression of SLC26A3 in surgically resected adenocarcinoma (ADC) samples which are classified as early stages (International Federation of Gynecology and Obstetrics [FIGO] stage I–IIA) and late stages (FIGO stage IIIC1–2p). Images from six individual cases are shown as representatives for each group. (D) IHC staining showing the protein expression of SLC26A3 in biopsy ADC samples which are classified as early stages (FIGO stage I–IIA) and late stages (FIGO stage IIIC1–2p). Images from four individual cases are shown as representatives for each group. The method of H-score is used and the scoring system is as follows: negative (0), weak (1), intermediate (2), and strong (3). Expression is quantified by the H-score method.
Figure 3—figure supplement 1

SLC26A3 is identified as a potential prognostic and diagnostic indicator for lymph node metastasis of cervical cancer (CC) patients.
(A) Heatmap showing the top 50 differently expressed genes (DEGs) in cluster Epi_12_RRAD, comparing to all the other sub-clusters. (B) Violin plots showing the each gene’s expression differences between two groups (top), with Uniform Manifold Approximation and Projection (UMAP) plots (bottom) demonstrating the specificity of each candidate gene, filtering IGF2 as the most identical marker for this sub-cluster. (C) Immunohistochemistry (IHC) staining for validation of the protein expression of IGF2 and ADH1C in adenocarcinoma (ADC) samples which are classified as early stages (International Federation of Gynecology and Obstetrics [FIGO] stage I–IIA) and late stages (FIGO stage IIIC1–2p). (D) Kaplan–Meier curves showing the overall survival rate of CC patients stratified by the top 50 genes-scaled signature of Epi_12_RRAD. (E) IHC staining for validation of the protein expression of ORM1/ORM2 and SLC26A3 in ADC samples which are classified as early stages and late stages. As for (C) and (E), the intensity of each protein marker is shown on four individual samples and the scoring is as follows: negative (0), weak (1), intermediate (2), and strong (3). Expression is quantified by the H-score method. (F) The selecting procedure for stratified comparison (considering HPV status, histological type, etc.) in Cohort 1 (top, in blue) and Cohort 2 (bottom, in red), respectively. In each comparison module, the case number and rate of post-surgical upstaging are presented.
Figure 3—figure supplement 2
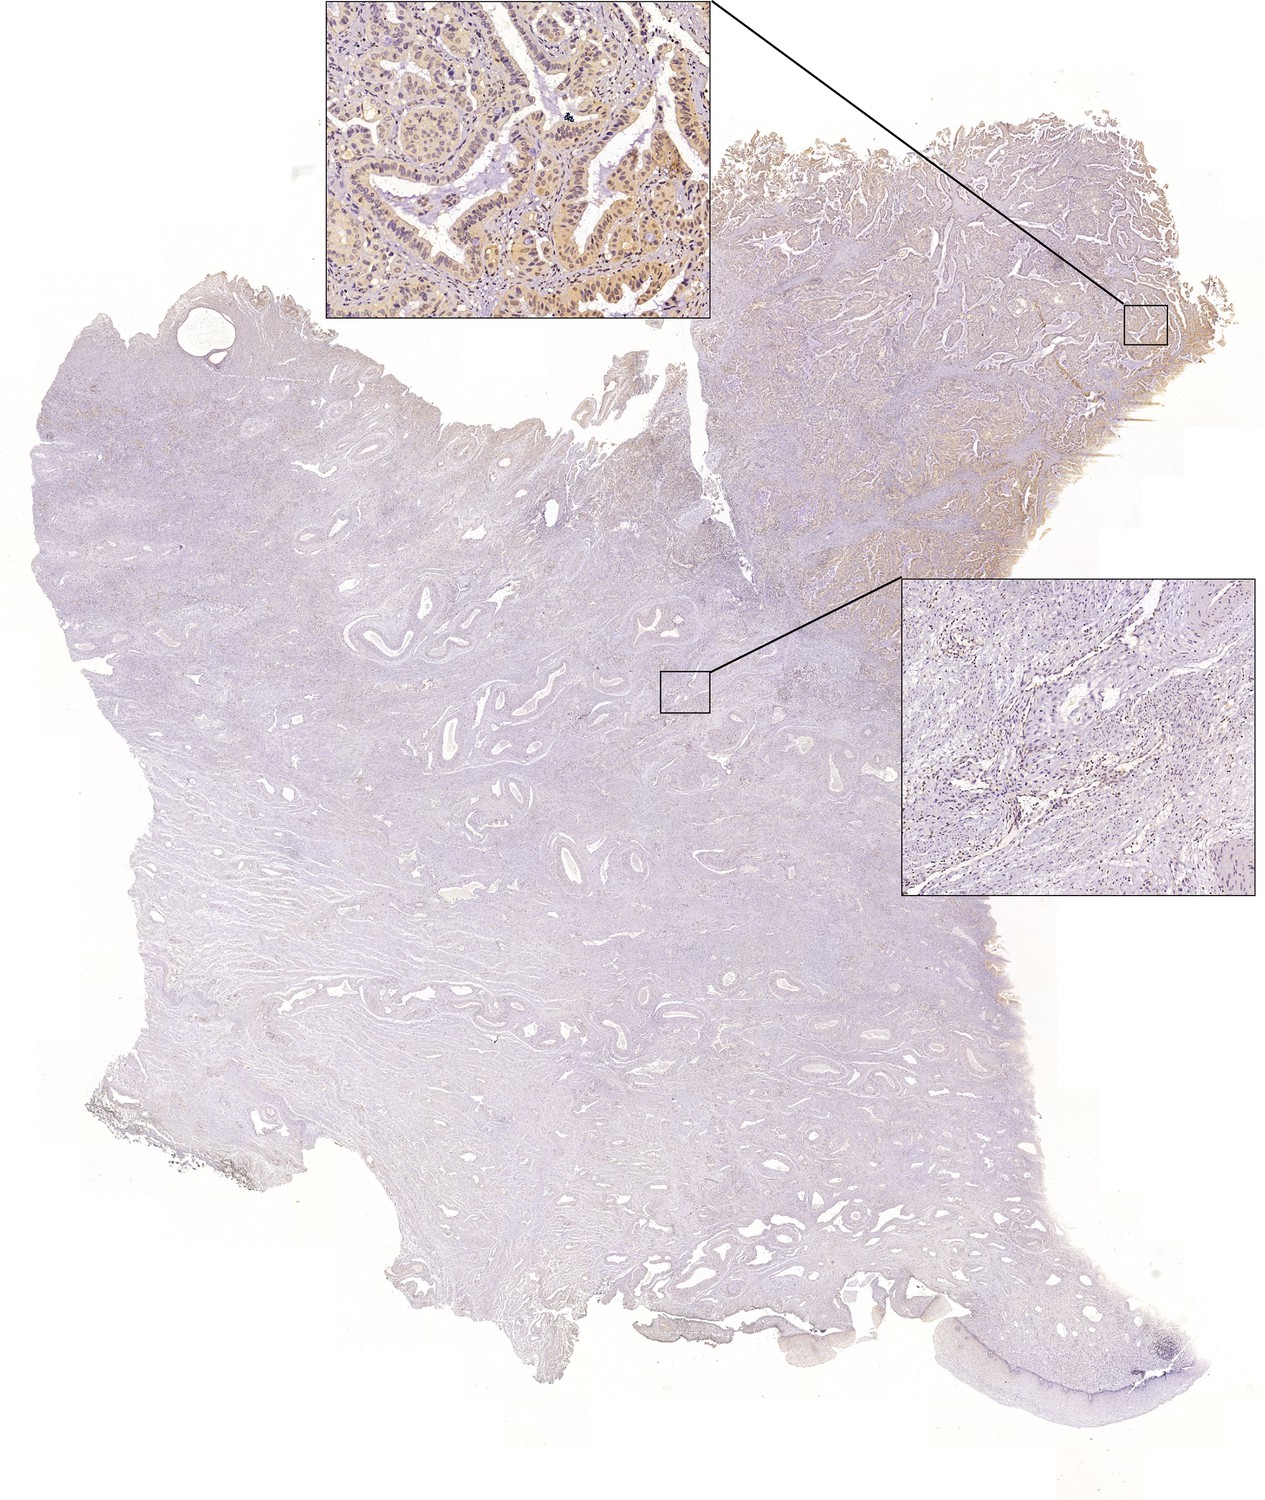
Full-scan image of the slide from adenocarcinoma (ADC) case #5 in Figure 3C.
Image of immunohistochemistry (IHC) staining via using SLC26A3 antibody to test the expression of this protein on surgically resected ADC sample #5. The positive (left square) and negative (right square) regions are presented separately.
Figure 4 with 1 supplement
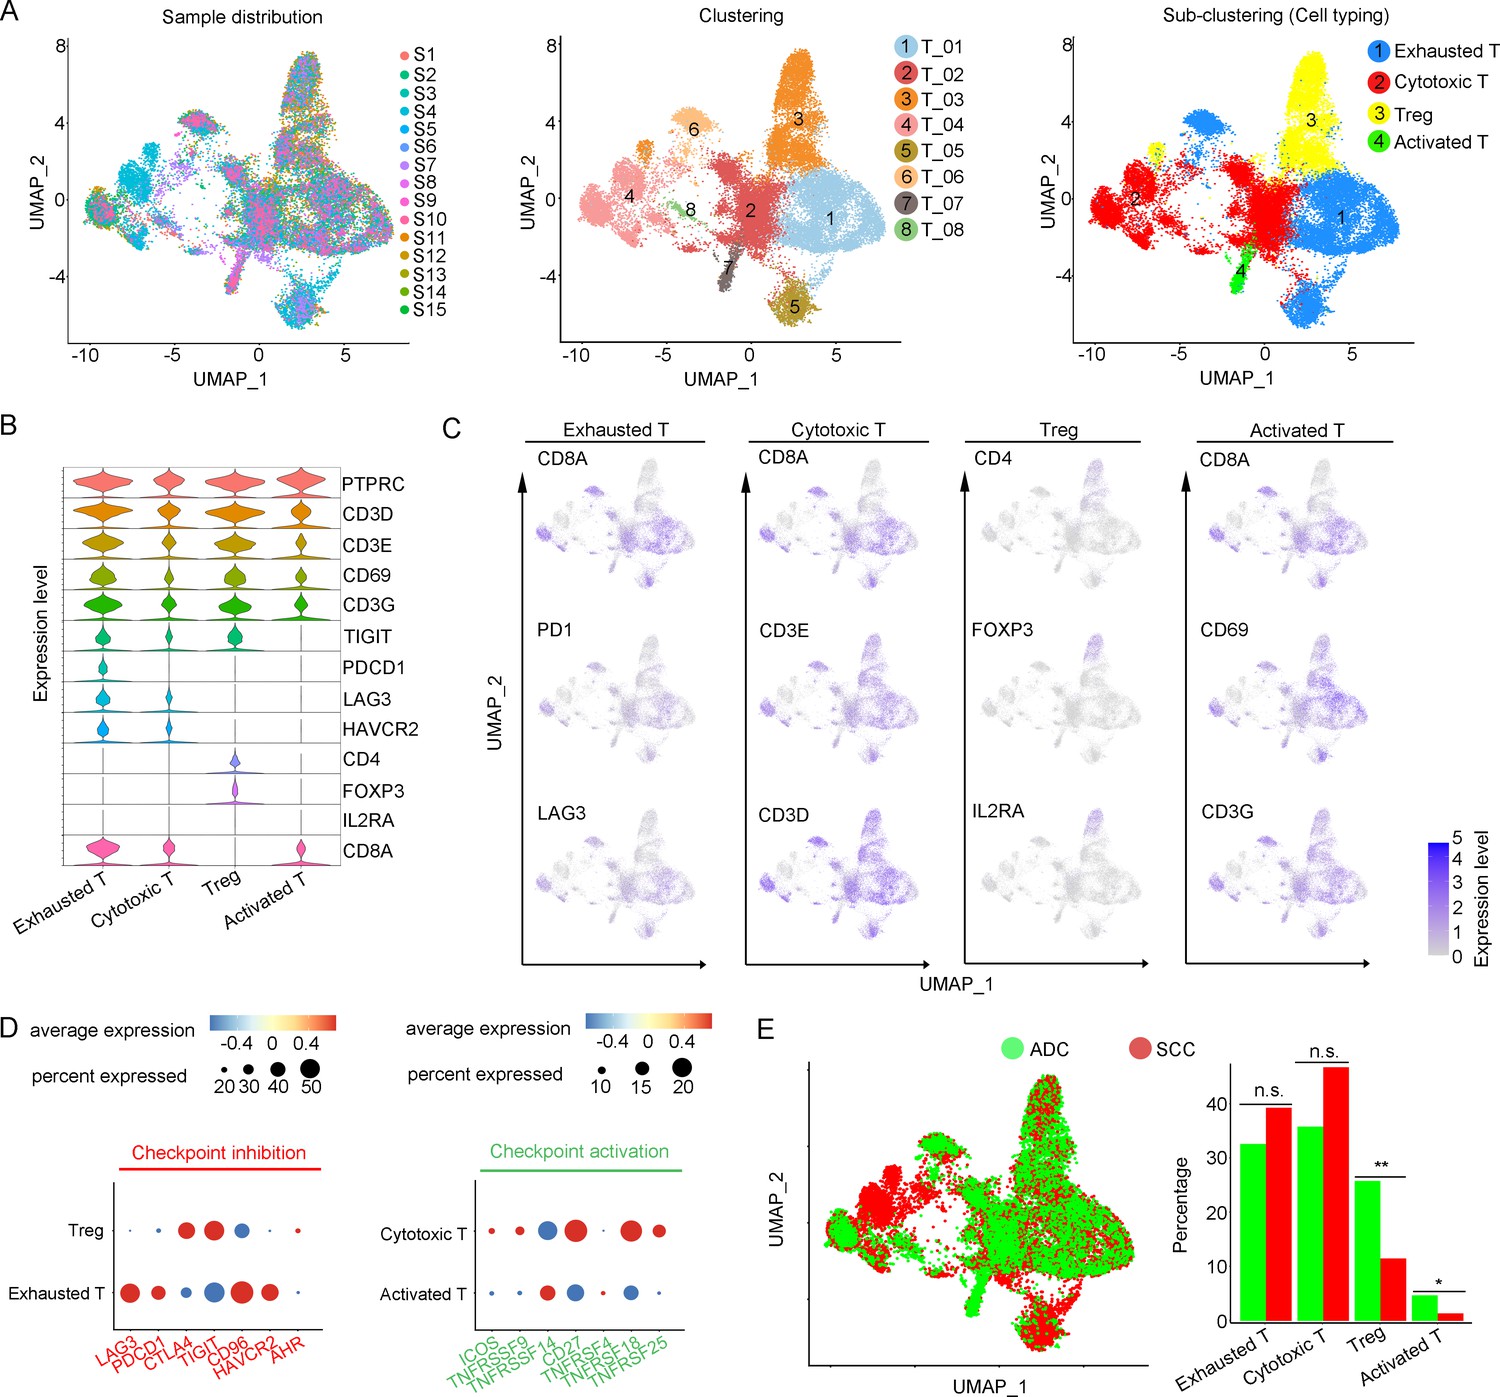
Cellular and molecular heterogeneity of T cells in adenocarcinoma (ADC).
(A) Uniform Manifold Approximation and Projection (UMAP) plots showing the sample distribution (left), original cell clustering of T cells (middle, eight clusters in total) and re-clustering of T cell subtypes (right, four major sub-clusters: exhausted T cell, cytotoxic T cell, regulatory T cell, and activated T cell) according to acknowledged marker genes. (B) Violin plot showing the expression of specific marker genes that annotate each sub-type of T cells. (C) UMAP plots showing the widely recognized classification markers that denote each type of T cell sub-cluster. (D) Dot heatmap plots that demonstrate the level of marker genes representing the signaling pathways of immune checkpoint activation and inhibition for grouped sub-clusters. (E) Differences of distribution and proportion of each T cell sub-cluster between different histological types (ADC vs. squamous cell carcinoma [SCC]). Statistics were performed using R software with two-sided Wilcoxon test (p values for each group are listed below: exhausted T: p=0.571; cytotoxic T: p=0.078; Treg: p<0.01; activated T: p=0.040). Statistics are shown as *p<0.05; **p<0.01; n.s., not significant. Treg: regulatory T cell.
-
Figure 4—source data 1
Annotated code for data used in Figure 4.
- https://cdn.elifesciences.org/articles/97335/elife-97335-fig4-data1-v1.zip
Figure 4—figure supplement 1
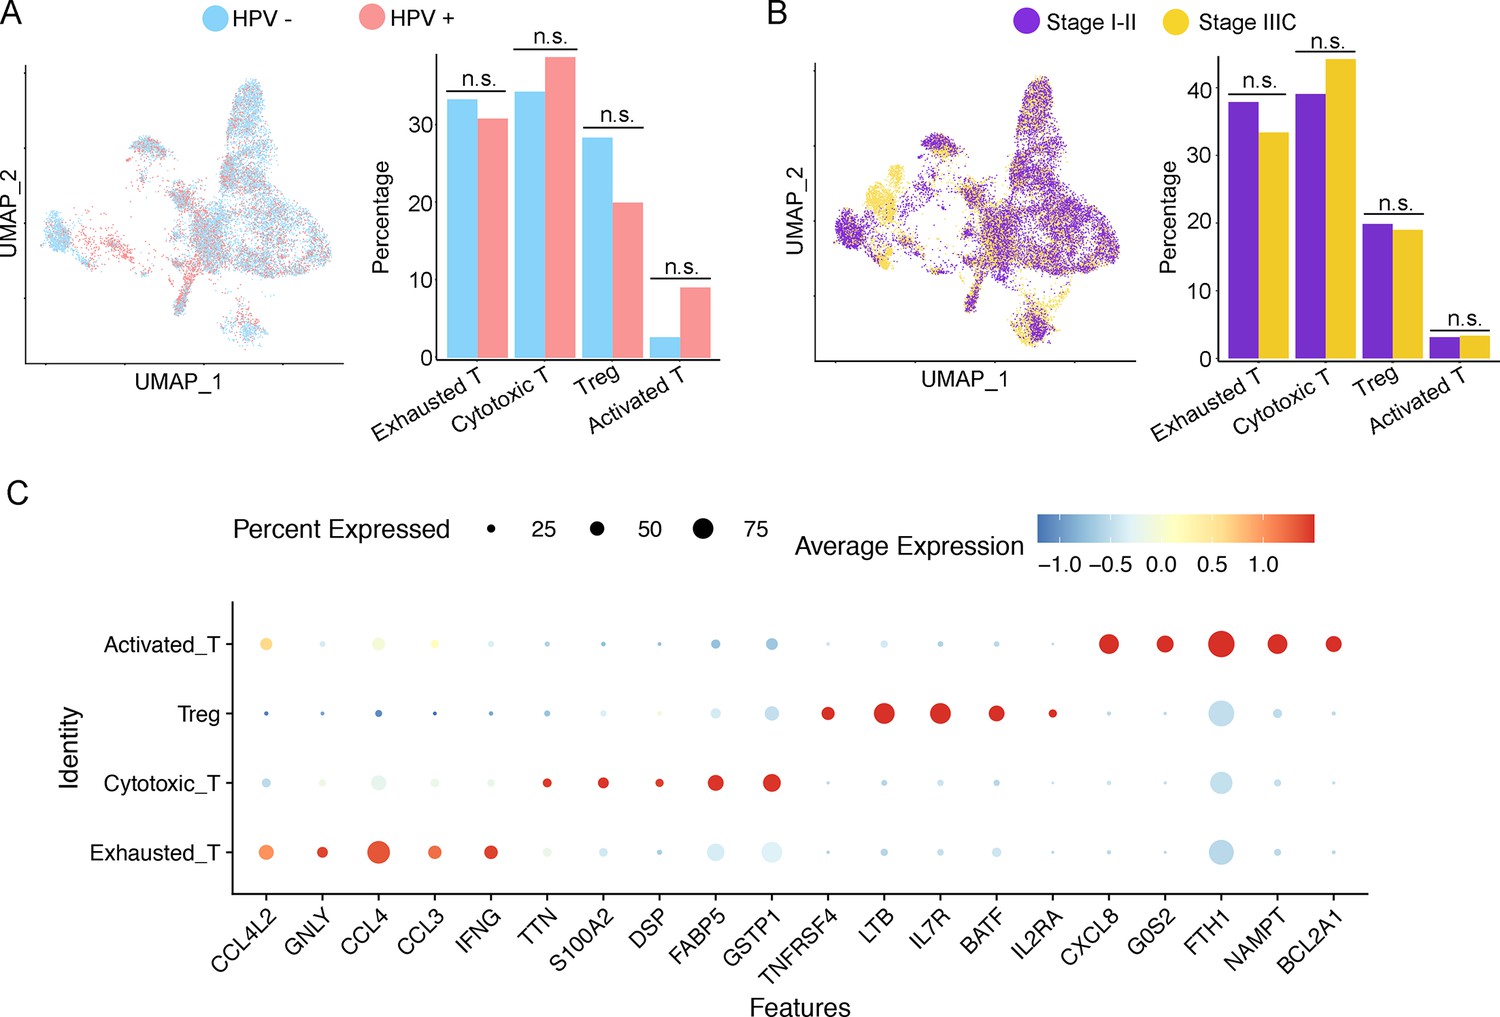
Cellular and molecular heterogeneity of T cells in adenocarcinoma (ADC).
(A, B) Uniform Manifold Approximation and Projection (UMAP) and histogram plots to show the distribution (left) and proportion (right) of each T cell sub-cluster between different human papillomavirus (HPV) infection status (HPV+ vs. HPV-, p values for each group are listed below: exhausted T: p=0.537; cytotoxic T: p=0.662; Treg: p=0.329; activated T: p=0.792) and different stages (stage I–II vs. stage IIIC, p values for each group are listed below: exhausted T: p=0.768; cytotoxic T: p=0.768; Treg: p=0.514; activated T: p=1.000). (C) Dot heatmap plot of row-scaled expression of overexpressed genes for each sub-cluster of T cells. Statistics were performed using R software with two-sided Wilcoxon test. All statistics are shown as *p<0.05; **p<0.01; n.s., not significant.
Figure 5 with 1 supplement
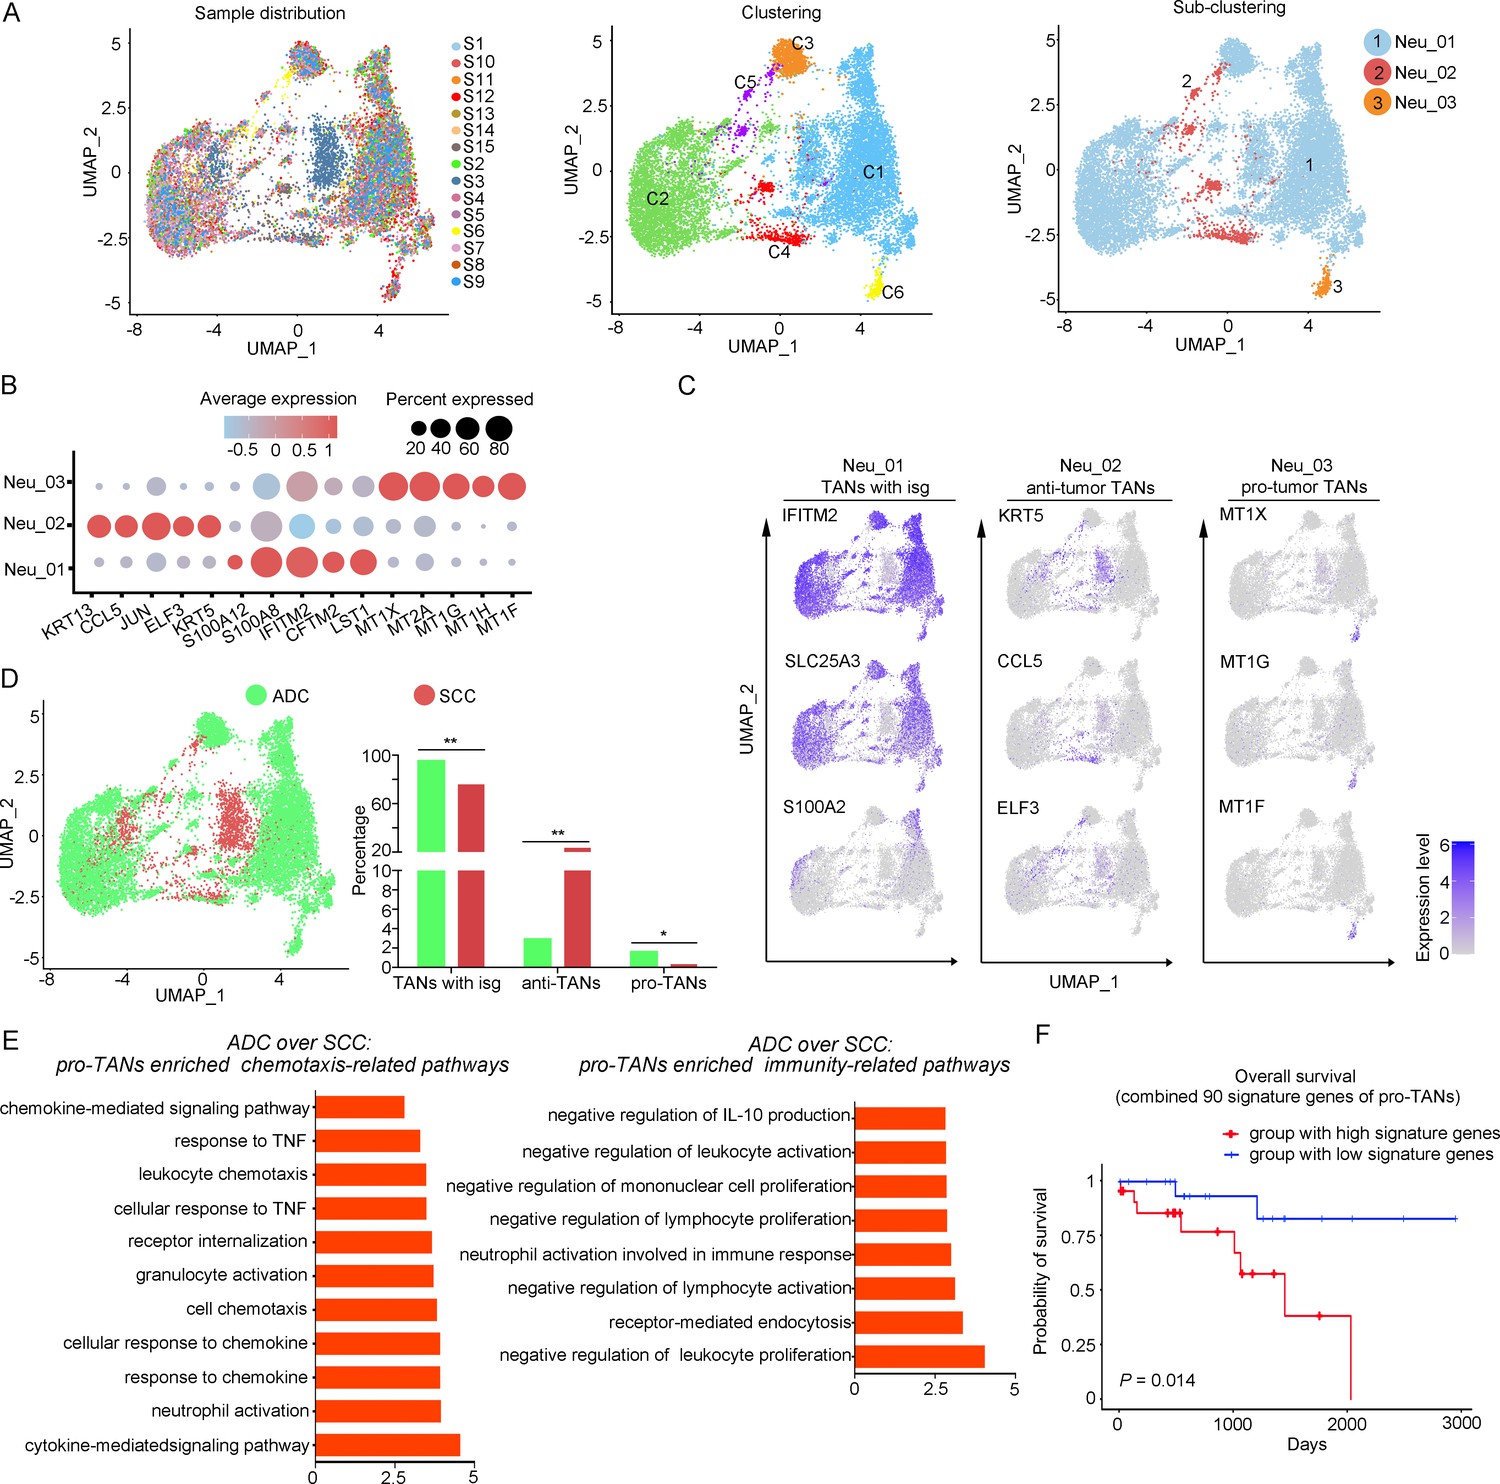
The heterogeneity of tumor-associated neutrophils (TANs) in adenocarcinoma (ADC).
(A) Uniform Manifold Approximation and Projection (UMAP) plots showing the distribution of neutrophils in 15 samples (left), original clustering (middle) the re-clustering (right) into three sub-clusters according to gene markers of TANs. (B) Dot heatmap showing the top 5 differently expressed genes (DEGs) in each sub-cluster of TANs. (C) UMAP plots for annotation of each sub-type of TANs with published marker genes presented: pro-tumor TANs, anti-tumor TANs, and TANs with isg. (D) UMAP and histogram plots to compare the differences of distribution and proportion of each sub-types of TANs between different histological types (ADC vs. squamous cell carcinoma [SCC]). Statistics were performed using R software with two-sided Wilcoxon test (p values for each group are listed below: TANs with isg: p=0.002; anti-TANs: p=0.002; pro-TANs: p=0.049). Statistics are shown as *p<0.05; **p<0.01; n.s., not significant. (E) Gene Ontology Biological Process (GOBP) analyses of signaling pathways that are more active in ADC than SCC, in terms of the pro-tumor TANs cluster. The histogram data are transformed from -Log10 (p-value). (F) Kaplan–Meier curve showing the overall survival rate of CC patients stratified by the top 90 genes-scaled signature of pro-TANs.
-
Figure 5—source data 1
Annotated code for data used in Figure 5.
- https://cdn.elifesciences.org/articles/97335/elife-97335-fig5-data1-v1.zip
Figure 5—figure supplement 1
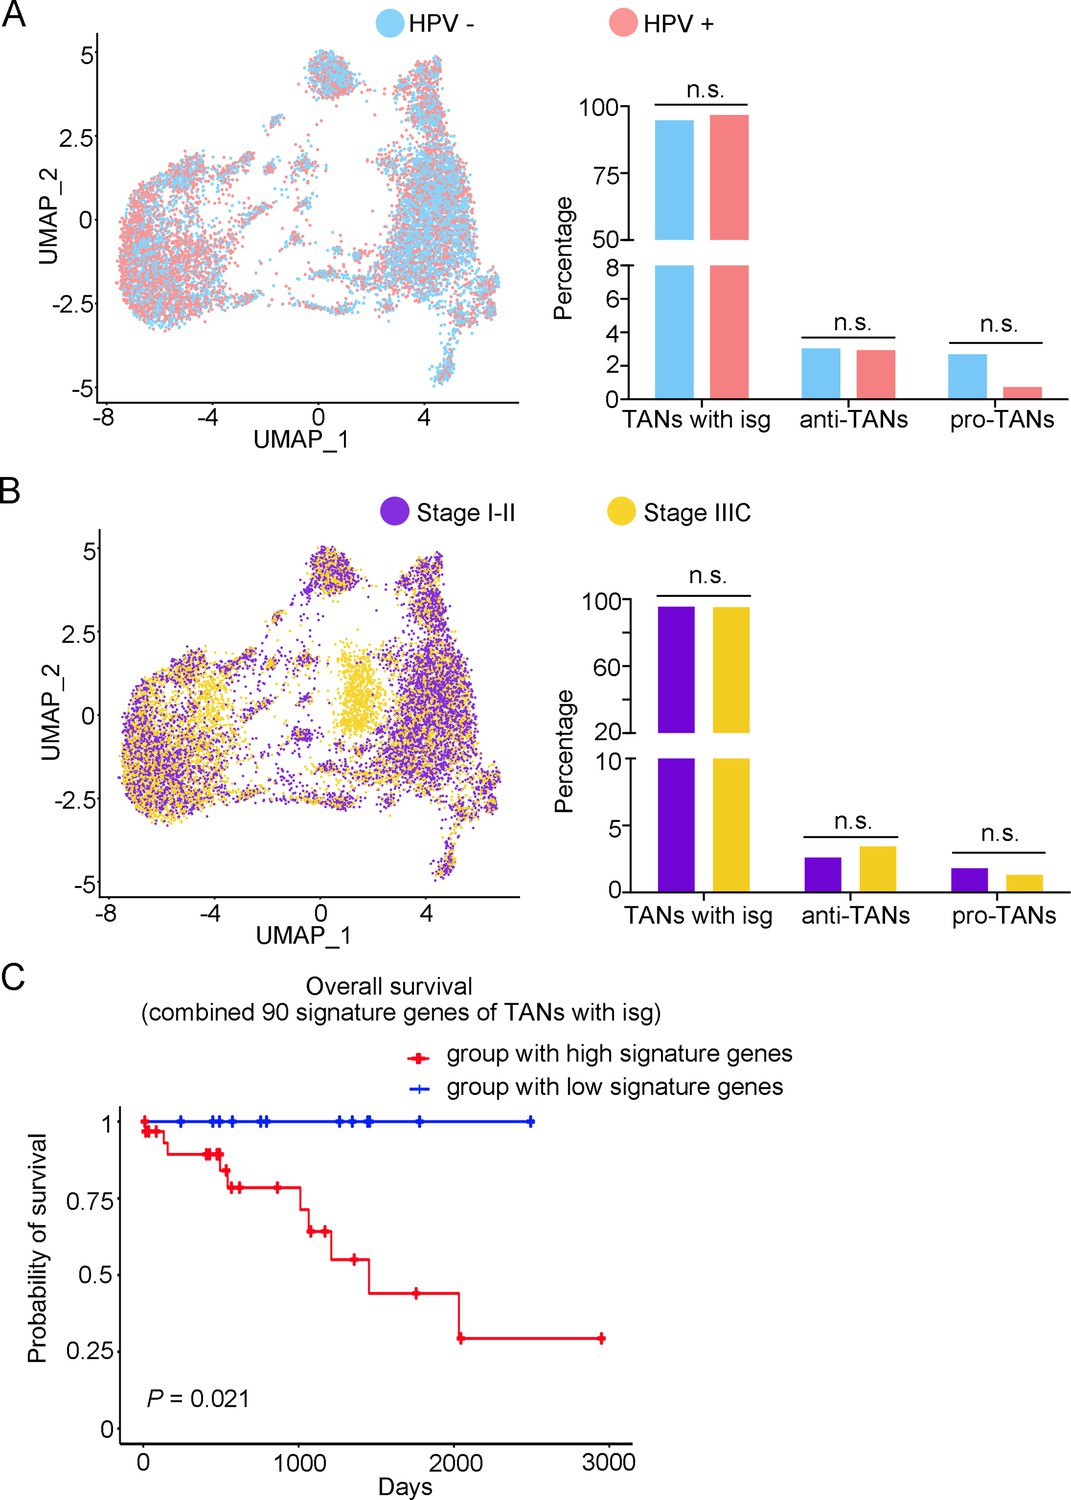
The heterogeneity of tumor-associated neutrophils (TANs) in adenocarcinoma (ADC).
(A, B) Uniform Manifold Approximation and Projection (UMAP) and histogram plots to compare the differences of distribution (left) and proportion (right) of each sub-type of TANs between different human papillomavirus (HPV) infection status (HPV+ vs. HPV-, p values for each group are listed below: TANs with isg: p=0.427; anti-TANs: p=0.931; pro-TANs: p=0.178) and different stages (stage I–II vs. stage IIIC, p values for each group are listed below: TANs with isg: p=1.000; anti-TANs: p=0.514; pro-TANs: p=0.951). (C) Kaplan–Meier curve to show the overall survival rate of CC patients stratified by the top 90 genes-scaled signature of the sub-cluster of TANs with isg. Statistics were performed using R software with two-sided Wilcoxon test. All statistics are shown as *p<0.05; **p<0.01; n.s. not significant.
Figure 6 with 1 supplement
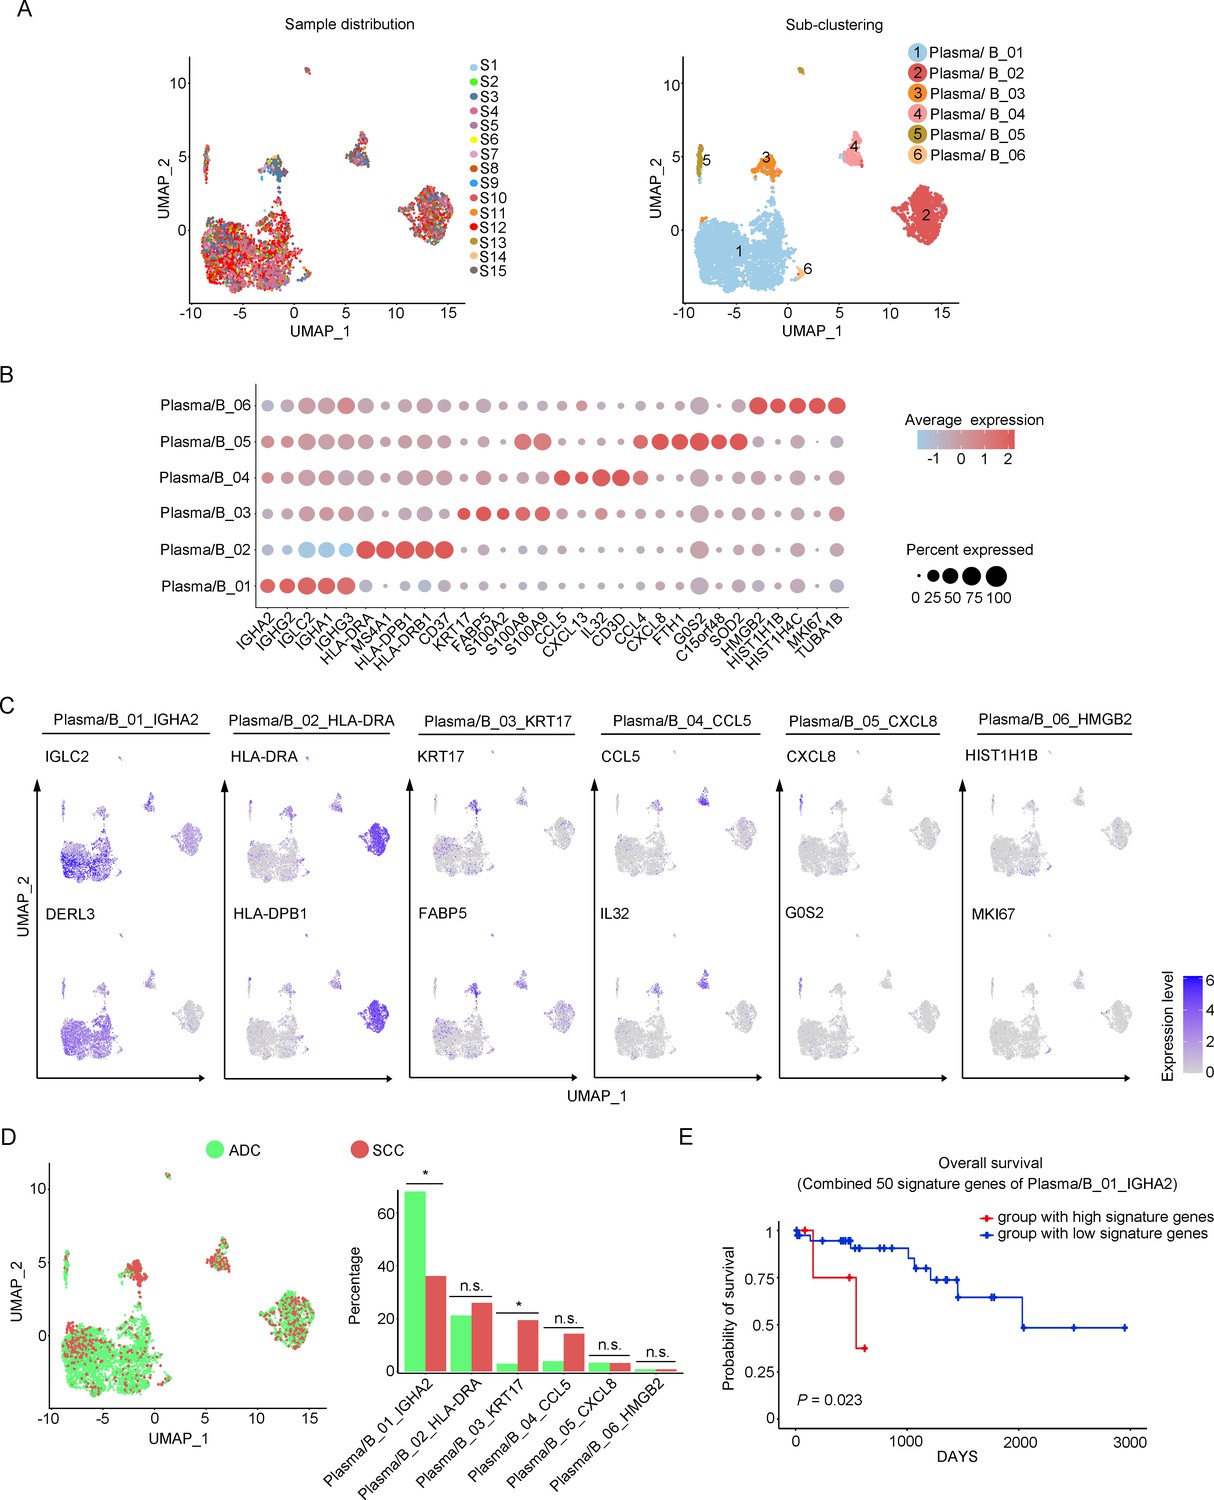
Phenotype diversity of plasma/B cells in adenocarcinoma (ADC).
(A) Uniform Manifold Approximation and Projection (UMAP) plots showing the distribution of plasma/B cells in 15 samples (left) and the re-clustering into six clusters (right) according to ectopic expressions of genes. (B) Plot heatmap showing the annotation of each sub-cluster with top 5 differently expressed genes (DEGs). (C) UMAP plots demonstrating the most specific genes as the marker for each sub-cluster. (D) UMAP and histogram plots to compare the differences of distribution and proportion of each plasma/B cell sub-cluster between different histological types. Statistics were performed using R software with two-sided Wilcoxon test (p values for each group are listed below: Plasma/B_01_IGHA2: p=0.040; Plasma/B_02_HLA-DAR: p=0.177; Plasma/B_03_KRT17: p=0.040; Plasma/B_04_CCL5: p=0.388; Plasma/B_05_CXCL8: p=0.169; Plasma/B_06_HMGB2: p=0.211). Statistics are shown as *p<0.05; **p<0.01; n.s., not significant. (E) Kaplan–Meier curve showing the overall survival rate of CC patients stratified by the top 50 genes-scaled signature of Plasma/B_01_IGHA2.
-
Figure 6—source data 1
Annotated code for data used in Figure 6.
- https://cdn.elifesciences.org/articles/97335/elife-97335-fig6-data1-v1.zip
Figure 6—figure supplement 1
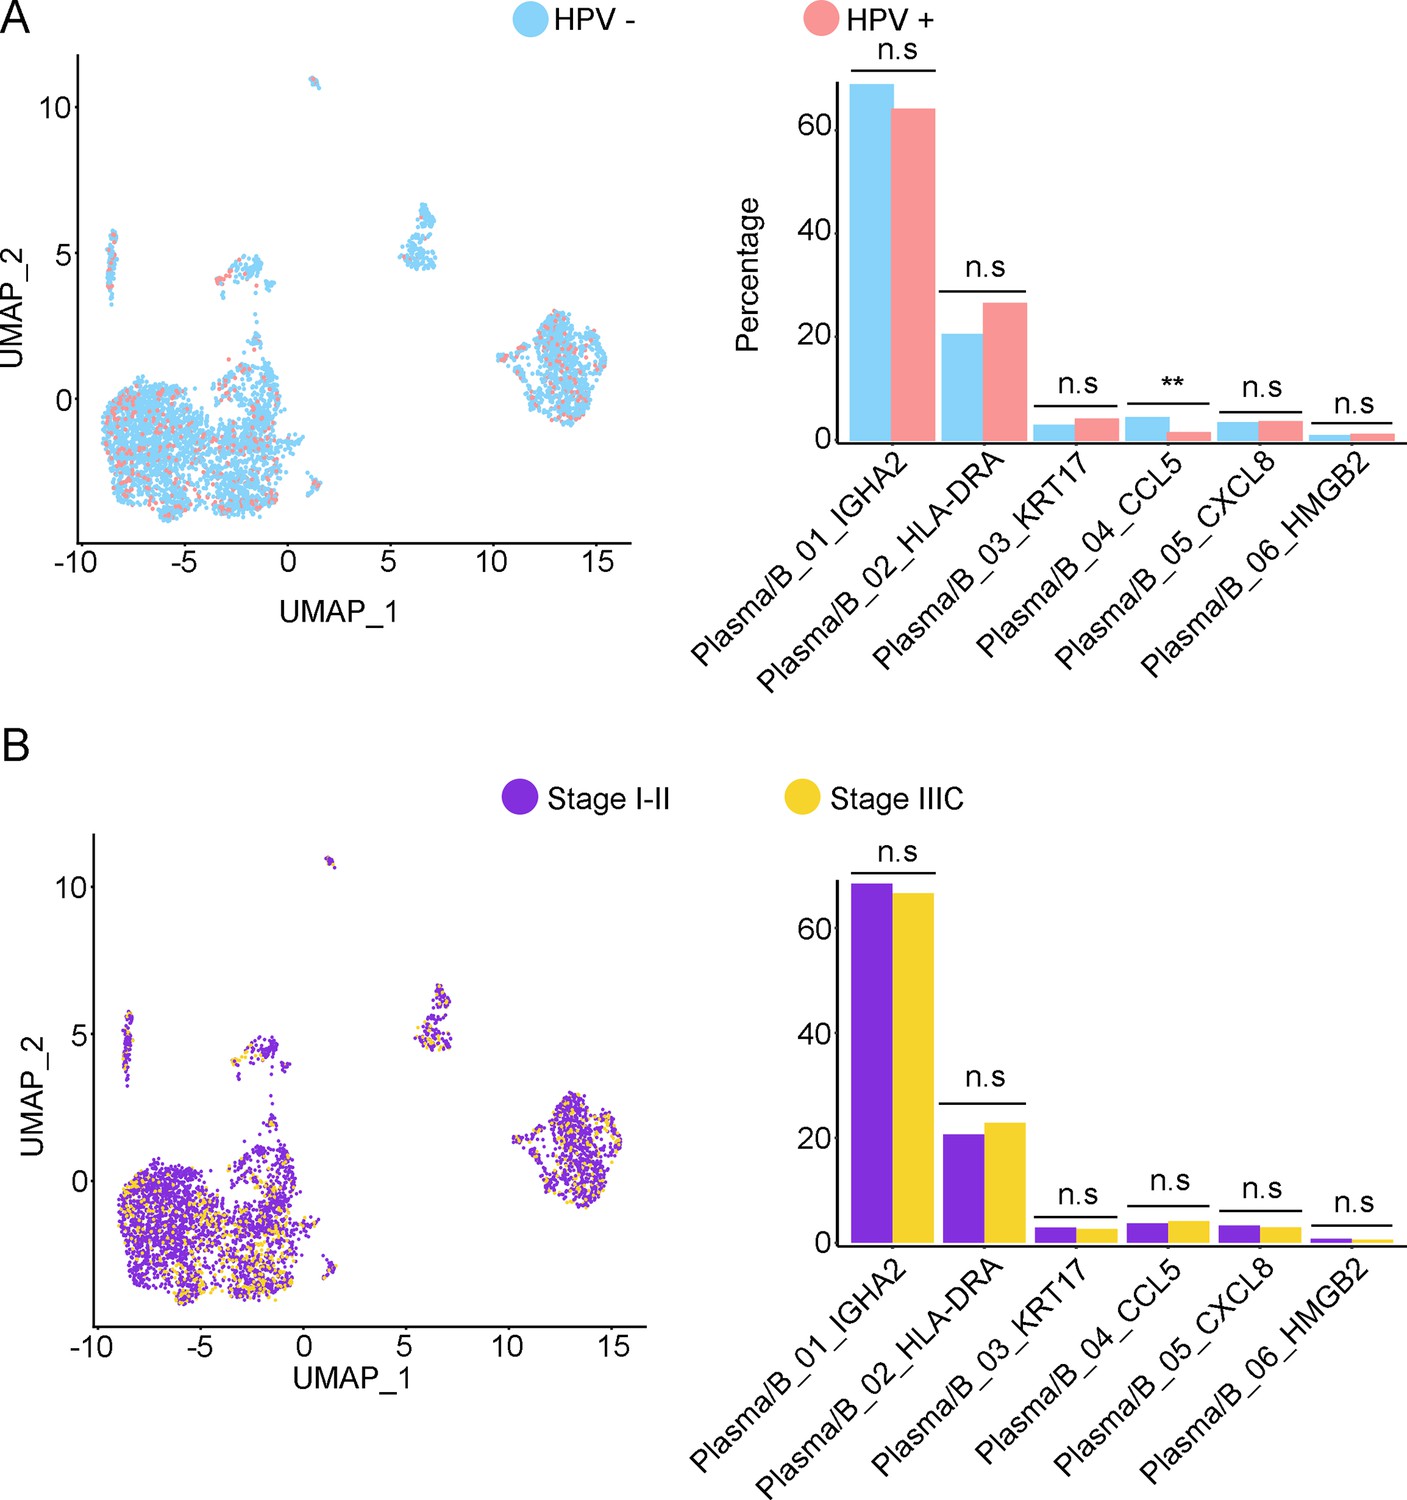
Phenotype diversity of plasma/B cells in adenocarcinoma (ADC).
(A) Uniform Manifold Approximation and Projection (UMAP) and histogram plots to show the differences of distribution (left) and proportion (right) of each plasma/B cell sub-cluster between different human papillomavirus (HPV) infection status (HPV+ vs. HPV-, p values for each group are listed below: Plasm/B_01_IGHA2: p=0.931; Plasm/B_02_HLA-DAR: p=0.662; Plasm/B_03_KRT17: p=0.931; Plasm/B_04_CCL5: p=0.007; Plasm/B_05_CXCL8: p=1.000; Plasm/B_06_HMGB2: p=0.410). (B) UMAP and histogram plots to compare the differences of distribution and proportion of each plasma/B cell sub-cluster between different clinical stages (stage I–II vs. stage IIIC, p values for each group are listed below: Plasma/B_01_IGHA2: p=0.768; Plasma/B_02_HLA-DAR: p=0.768; Plasma/B_03_KRT17: p=1.000; Plasma/B_04_CCL5: p=0.950; Plasma/B_05_CXCL8: p=0.667; Plasma/B_06_HMGB2: p=0.294). Statistics were performed using R software with two-sided Wilcoxon test. All statistics are shown as *p<0.05; **p<0.01; n.s., not significant.
Figure 7 with 2 supplements
The cellular interaction modules of sub-clusters of T cells, neutrophils, and tumor epithelial cells.
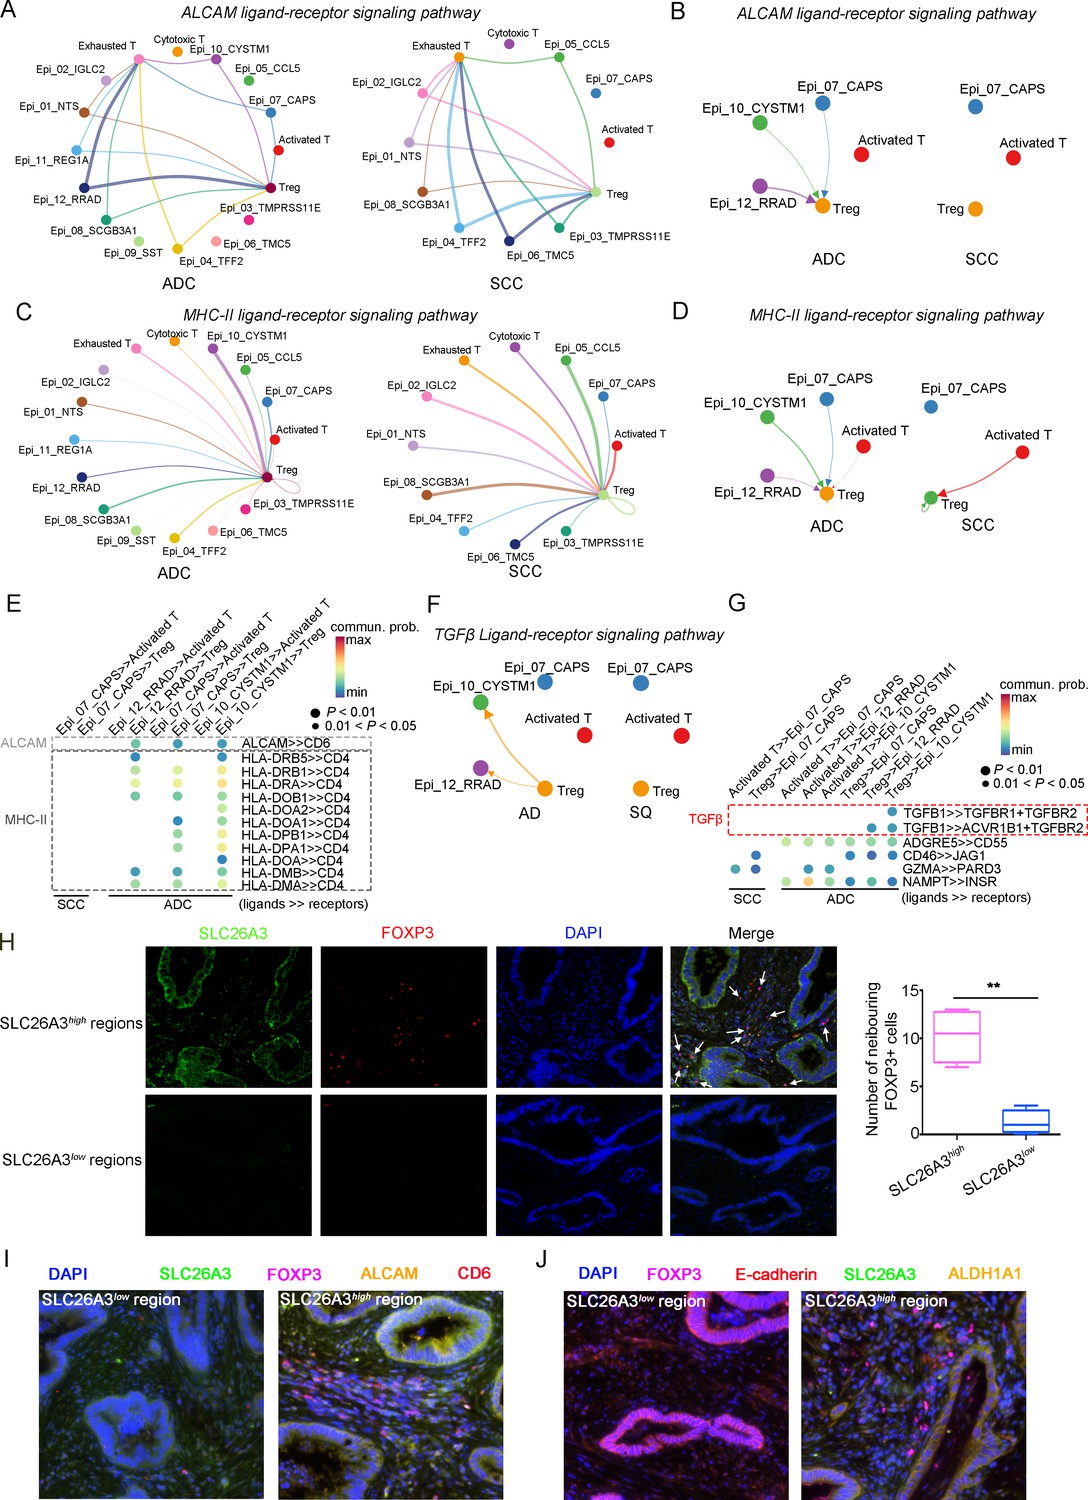
(A) Circle plots showing the interacting networks between epithelial cell sub-clusters and T cell sub-clusters via the pathway of ALCAM by comparing adenocarcinoma (ADC) and squamous cell carcinoma (SCC). (B) Circle plots simplified from (A) to show the interactions among target cell clusters via ALCAM pathway. (C) Circle plots showing the interacting networks between epithelial cell sub-clusters and T cell sub-clusters via the pathway of MHC-II by comparing ADC and SCC. (D) Circle plots simplified from (C) to show the interactions among target cell clusters via MHC-II pathway. From (A) to (D), the direction of each arrow shows the regulation from outputting cells to incoming cells. The width of the each line shows the predicted weight and strength of regulation. (E) Bubble plot showing the probability of ligand-to-receptor combination of each pathway between two different target sub-clusters of cells by comparing ADC with SCC. (F) Circle plots showing Tregs regulate epithelial cells via the TGF-β pathway, which is solely activated in ADC. (G) Bubble plot showing the probability of ligand-to-receptor combination of TGF-β pathway between Tregs and epithelial cells by comparing ADC with SCC. The pathways of ADGRE5, CD46, GZMA, and NAMPT are used as negative controls. (H) Dual immunofluorescence (IF) staining confirming that in SLC26A3high regions of CC tissues, more FOXP3+ cells are recruited than in SLC26A3low regions (left). The numbers of recruited FOXP3+ cell are quantified using histogram plot (right). Three individual samples with ROI were calculated and p<0.01 were marked with **, showing significant difference. (I) Multiplexed IF staining confirming the interaction between CD6 (on FOXP3+ cells) and ALCAM (on SLC26A3high epithelial cells) in the ALCAM pathway. (J) Multiplexed IF staining showing that the recruitment of FOXP3 + cells toward SLC26A3high cells might induce EMT (marked with E-cadherin) and increase the stemness (marked with ALDH1A1) of tumor cells, via TGF-β pathway.
Figure 7—figure supplement 1
The cellular interaction modules of sub-clusters from T cells, neutrophils, and tumor epithelial cells.
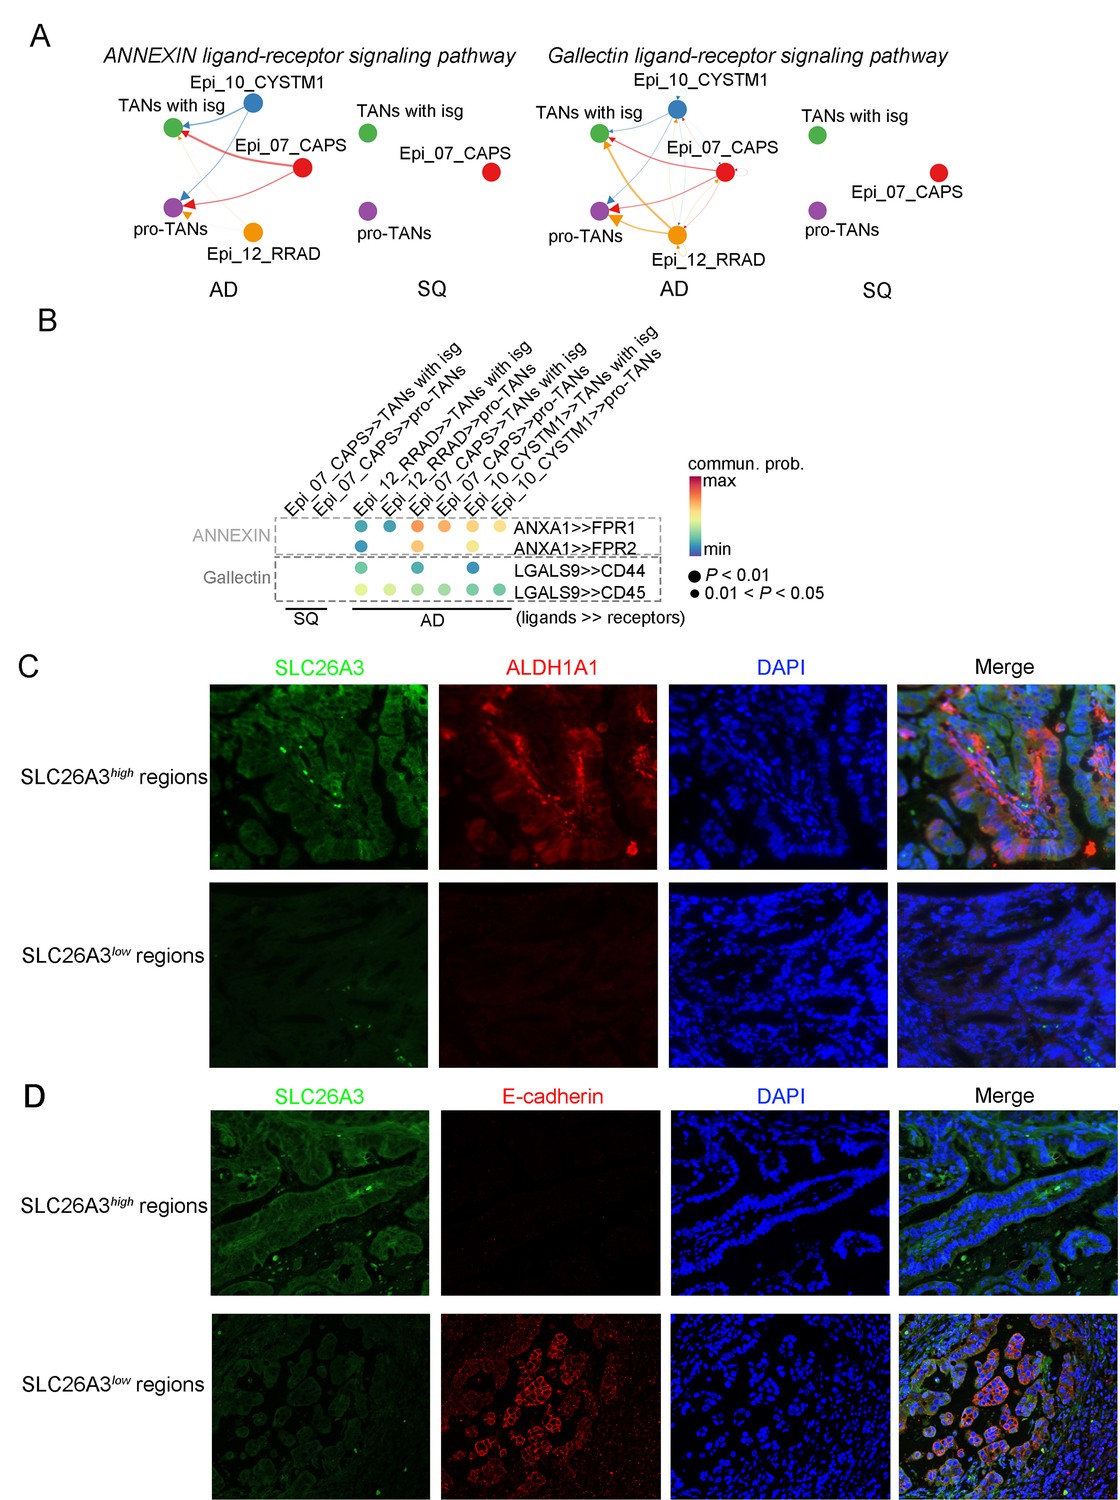
(A) Circle plots showing the interacting networks between epithelial cell sub-clusters and neutrophil sub-clusters via pathways such as ANNEXIN and Gallectin by comparing adenocarcinoma (ADC) and squamous cell carcinoma (SCC). The direction of one arrow shows the regulation from outputting cells to incoming cells. The width of the each line shows the predicted weight and strength of regulation. (B) Bubble plot showing the probability of ligand-to-receptor combination of each pathway (corresponding to A) between two different sub-types of cells by comparing ADC with SCC. (C) Dual immunofluorescence (IF) staining showing that in SLC26A3high regions the stemness of tumor epithelial cells is actively induced than that in SLC26A3low regions. (D) Dual IF staining showing that in SLC26A3high regions the EMT of tumor epithelial cells is actively induced than in SLC26A3low regions.
Figure 7—figure supplement 2
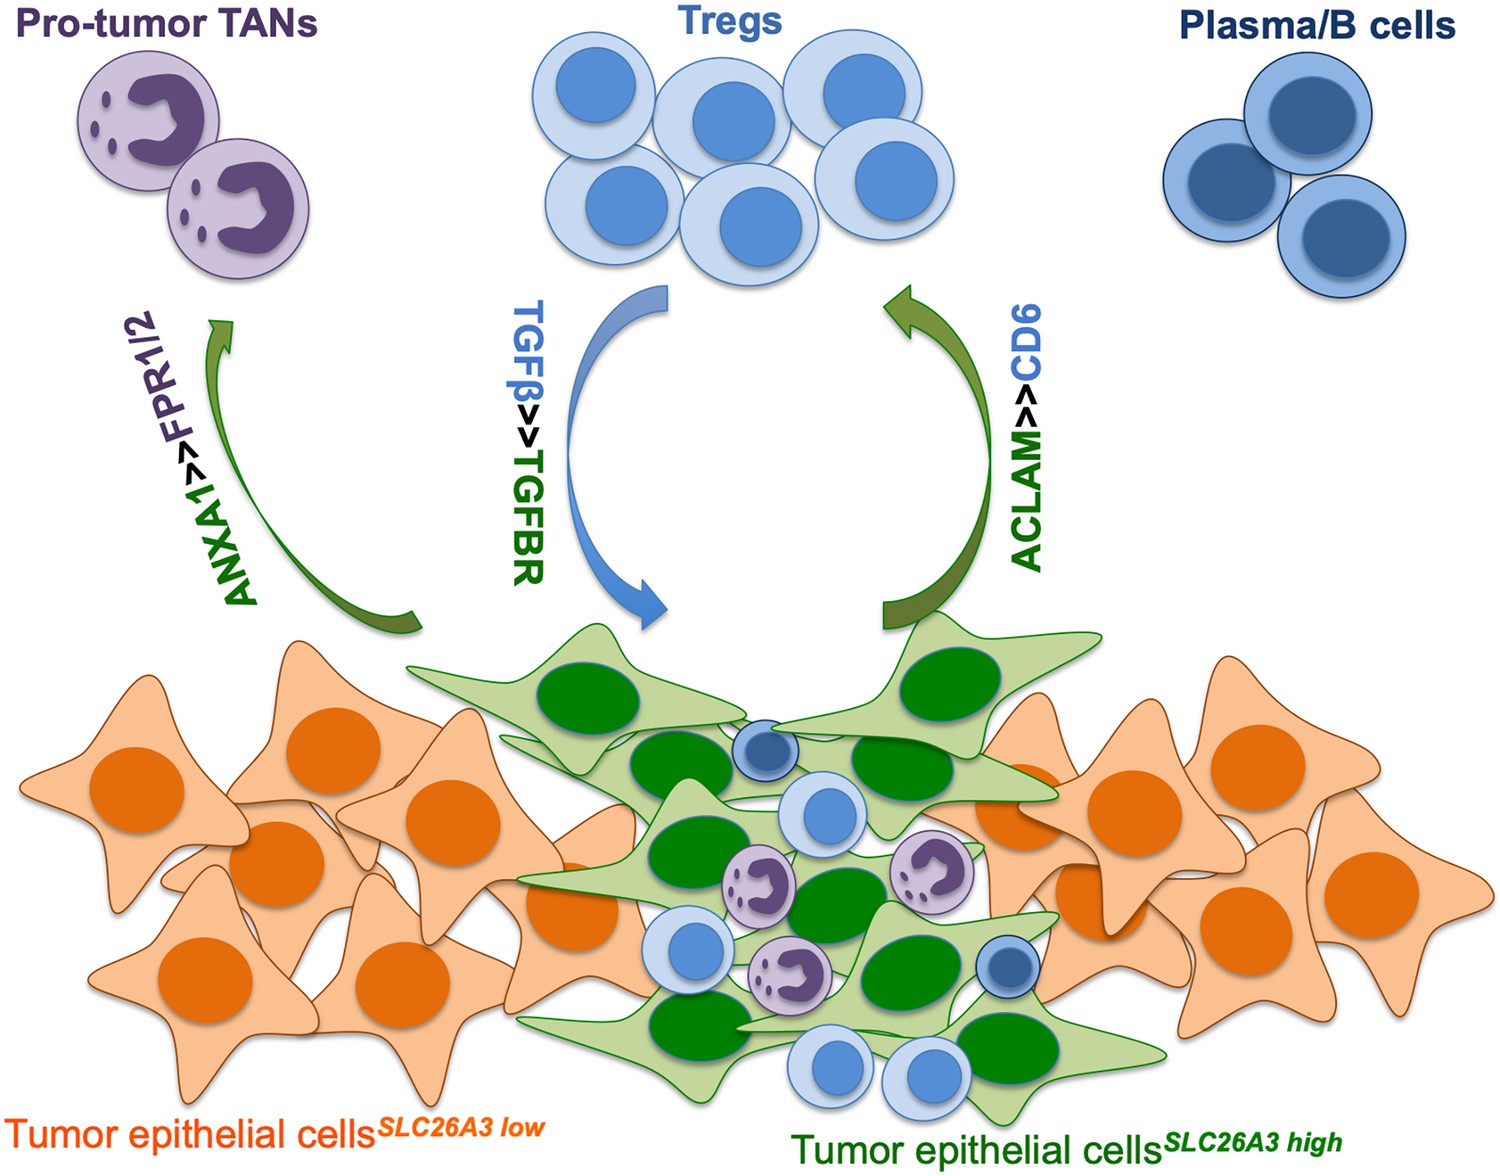
Graphical presentation of the tumor immune microenvironment (TIME) in adenocarcinoma (ADC), with cellular crosstalk among tumor cells, Tregs, neutrophils, and plasma cells.
Tables
Table 1
The association between post-surgical upstaging and clinical characteristics in patient Cohort 1 (from Xiangya Hospital).
| Characteristics | Case number | Upstaging after surgery | χ2 | p value | |
|---|---|---|---|---|---|
| Yes | No | ||||
| Total | 215 | ||||
| Histological types | 209 | ||||
| ADC | 55 | 8 (14.55%) | 47 (85.45%) | 0.955 | 0.328 |
| SCC | 154 | 15 (9.74%) | 139 (90.26%) | ||
| HPV status | 196 | ||||
| HPV+ | 181 | 18 (9.94%) | 163 (90.06%) | 3.887 | 0.049* |
| HPV- | 15 | 4 (26.67%) | 11 (73.33%) | ||
| ADC with HPV status | 50 | ||||
| HPV+ | 40 | 4 (10.00%) | 36 (90.00%) | 5.357 | 0.021* |
| HPV- | 10 | 4 (40.00%) | 6 (60.00%) | ||
| SCC with HPV status | 143 | ||||
| HPV+ | 138 | 13 (9.42%) | 125 (90.58%) | 0.518 | 0.472 |
| HPV- | 5 | 0 (0.00%) | 5 (100%) | ||
-
In each comparison panel, patients with insufficient data were excluded from analysis. The total number is 215, among which 6 cases are specific histological types (3 are neuroendocrine carcinoma [Neuro]; 2 are adenosquamous carcinoma; 1 is malignant melanoma) and has been excluded for comparison between ADC and SCC. Because the HPV status information is unclear in 16 cases, a total number of 196 cases have been used for comparison between different HPV statuses. As for sub-classification between different HPV status under different histological types, three Neuro cases have been excluded.
-
*p<0.05 is considered significantly different. p<0.01 is presented as **.
-
ADC, adenocarcinoma; HPV, human papillomavirus; SCC, squamous cell carcinoma.
Table 2
The association between post-surgical upstaging and clinical characteristics in patient Cohort 2 (from Hunan Cancer Hospital).
| Characteristics | Case number | Upstaging after surgery | χ2 | p value | |
|---|---|---|---|---|---|
| Yes | No | ||||
| Total | 1398 | ||||
| Histological types | 1336 | ||||
| ADC | 190 | 40 (21.05%) | 150 (78.95%) | 4.911 | 0.027* |
| SCC | 1146 | 169 (14.75%) | 977 (85.25%) | ||
| HPV status | 1166 | ||||
| HPV+ | 1031 | 131 (12.71%) | 900 (87.29%) | 66.616 | <0.001** |
| HPV- | 135 | 54 (40.00%) | 81 (60.00%) | ||
| ADC with HPV status | 162 | ||||
| HPV+ | 131 | 18 (13.74%) | 113 (86.26%) | 24.999 | <0.001** |
| HPV- | 31 | 17 (54.84%) | 14 (45.16%) | ||
| SCC with HPV status | 958 | ||||
| HPV+ | 864 | 109 (12.62%) | 755 (87.38%) | 40.229 | <0.001** |
| HPV- | 94 | 35 (37.23%) | 59 (62.77%) | ||
| Neuro with HPV status | 27 | ||||
| HPV+ | 21 | 3 (14.29%) | 18 (85.71%) | 0.964 | 0.326 |
| HPV- | 6 | 0 (0.00%) | 6 (100.00%) | ||
| ADSCC with HPV status | 14 | ||||
| HPV+ | 12 | 1 (8.33%) | 11 (91.67%) | 2.431 | 0.119 |
| HPV- | 2 | 1 (50.00%) | 1 (50.00%) | ||
-
In each comparison panel, patients with insufficient data were excluded from analysis. The total number is 1398 and 62 cases have been excluded for comparison between ADC and SCC, due to special pathological types (carcinosarcoma: 1; melanoma: 1; neuroendocrine carcinoma: 38; basaloma: 1; adenosquamous carcinoma: 18; malignant peripheral nerve sheath tumor: 1; fibroblastic sarcoma: 1; adenosarcoma: 1). Because the HPV status information is unclear in 232 cases, a total number of 1166 cases has been used for comparison between different HPV status. As for subclassification between two HPV statuses under different histological types, the excluded case numbers for each group are as follows due to unknown HPV status: 28 in ADC; 188 in SCC; 11 in Neuro; 4 in ADSCC (Figure 3—figure supplement 1).
-
*p<0.05 is considered significantly different. p<0.01 is presented as **.
-
ADC, adenocarcinoma; ADSCC, adenosquamous carcinoma of cervix; HPV, human papillomavirus; Neuro, neuroendocrine carcinoma; SCC, squamous cell carcinoma.
Table 3
The association between clinical characteristics and SLC26A3 protein expression via IHC tested on post-surgical samples.
| Characteristics | Case number | SLC26A3 expression | χ2 | p value | |
|---|---|---|---|---|---|
| High | Low | ||||
| Total | 56 | ||||
| Age | 56 | ||||
| ≥50 | 28 | 8 (28.57%) | 20 (71.43%) | 0.717 | 0.397 |
| <50 | 28 | 11 (39.29%) | 17 (60.71%) | ||
| Histological grading | 51 | ||||
| G1, G1-2 | 20 | 5 (25.00%) | 15 (75.00%) | 1.527 | 0.217 |
| G2, G2-3, G3 | 31 | 13 (41.94%) | 18 (50.06%) | ||
| FIGO stages | 56 | ||||
| I–II (LN-M-) | 47 | 12 (25.53%) | 35 (74.47%) | 9.198 | 0.002** |
| IIICp (LN-M+) | 9 | 7 (77.78%) | 2 (22.22%) | ||
| HPV status | 53 | ||||
| HPV+ | 44 | 13 (29.55%) | 31 (70.45%) | 2.254 | 0.133 |
| HPV- | 9 | 5 (55.56%) | 4 (44.44%) | ||
-
*p<0.05 is considered significantly different. p<0.01 is presented as **.
-
FIGO, International Federation of Gynecology and Obstetrics; HPV, human papillomavirus; IHC, immunohistochemistry.
Table 4
The association between clinical characteristics and SLC26A3 protein expression via IHC tested on biopsy small specimens.
| Characteristics | Case number | SLC26A3 expression | χ2 | p value | |
|---|---|---|---|---|---|
| High | Low | ||||
| Total | 43 | ||||
| Age | |||||
| ≥50 | 16 | 3 (18.75%) | 13 (81.25%) | 4.605 | 0.032 |
| <50 | 27 | 14 (51.85%) | 13 (48.15%) | ||
| Histological grading | |||||
| G1, G1–2 | 9 | 4 (44.44%) | 5 (55.56%) | 0.115 | 0.735 |
| G2, G2–3, G3 | 34 | 13 (38.24%) | 21 (61.76%) | ||
| FIGO stages | |||||
| I–II (consistent staging) | 29 | 7 (24.14%) | 22 (75.86%) | 8.833 | 0.003* |
| IIICp (upstaging) | 14 | 10 (71.43%) | 4 (28.57%) | ||
| HPV status | |||||
| HPV+ | 32 | 10 (31.25%) | 22 (68.75%) | 3.592 | 0.058 |
| HPV- | 11 | 7 (63.64%) | 4 (36.36%) | ||
-
*p<0.05 is considered significantly different. p<0.01 is presented as **.
-
FIGO, International Federation of Gynecology and Obstetrics; HPV, human papillomavirus; IHC, immunohistochemistry.
Appendix 1—key resources table
| Reagent type (species) or resource | Designation | Source or reference | Identifiers | Additional information |
|---|---|---|---|---|
| Antibody | SLC26A3 Antibody (H-8) | Santa Cruz Biotechnology | Cat# sc-376187 | |
| Antibody | FOXP3 Monoclonal Antibody (236A/E7), eFluor 570, eBioscience | Thermo Fisher | Cat# 41-4777-82 | |
| Antibody | ALCAM polyclonal antibody | Proteintech | Cat# 21972-1-AP | |
| Antibody | CD6 recombinant antibody | Proteintech | Cat# 84508-4-RR | |
| Antibody | ALDH1A1 polyclonal antibody | Proteintech | Cat# 15910-1-AP | |
| Antibody | Anti-IGF2 antibody | Abcam | Cat# ab9574 | |
| Antibody | ADH1C rabbit pAb | ABclonal | Cat# A8081 | |
| Antibody | ORM1/2 rabbit mAb | ABclonal | Cat# A19736 | |
| Antibody | E-Cadherin (24E10) rabbit mAb | Cell Signaling Technology | Cat# 3195 | |
| Peptide, recombinant protein | Opal 6-Plex Manual Detection Kit | Akoya Biosciences | Cat# NEL811001KT |
Additional files
-
Supplementary file 1
Table of sample information from the 15 individual patients.
- https://cdn.elifesciences.org/articles/97335/elife-97335-supp1-v1.xlsx
-
Supplementary file 2
Table of composition of cell types in the scRNA-seq data.
- https://cdn.elifesciences.org/articles/97335/elife-97335-supp2-v1.xlsx
-
Supplementary file 3
Table of gene markers for cell type identification.
- https://cdn.elifesciences.org/articles/97335/elife-97335-supp3-v1.xlsx
-
MDAR checklist
- https://cdn.elifesciences.org/articles/97335/elife-97335-mdarchecklist1-v1.docx
Download links
A two-part list of links to download the article, or parts of the article, in various formats.
Downloads (link to download the article as PDF)
Open citations (links to open the citations from this article in various online reference manager services)
Cite this article (links to download the citations from this article in formats compatible with various reference manager tools)
Single-cell profiling reveals the intratumor heterogeneity and immunosuppressive microenvironment in cervical adenocarcinoma
eLife 13:RP97335.
https://doi.org/10.7554/eLife.97335.3


