TAK1-mediated phosphorylation of PLCE1 represses PIP2 hydrolysis to impede esophageal squamous cancer metastasis
- Key Laboratory of Neuroregeneration of Jiangsu and Ministry of Education; NMPA Key Laboratory for Research and Evaluation of Tissue Engineering Technology Products; School of Medicine, Nantong University, China
- Laboratory Animal Center, Nantong University, China
- Department of Thoracic Surgery, Shanghai Chest Hospital, Shanghai Jiao Tong University School of Medicine, China
Figures
Figure 1 with 5 supplements
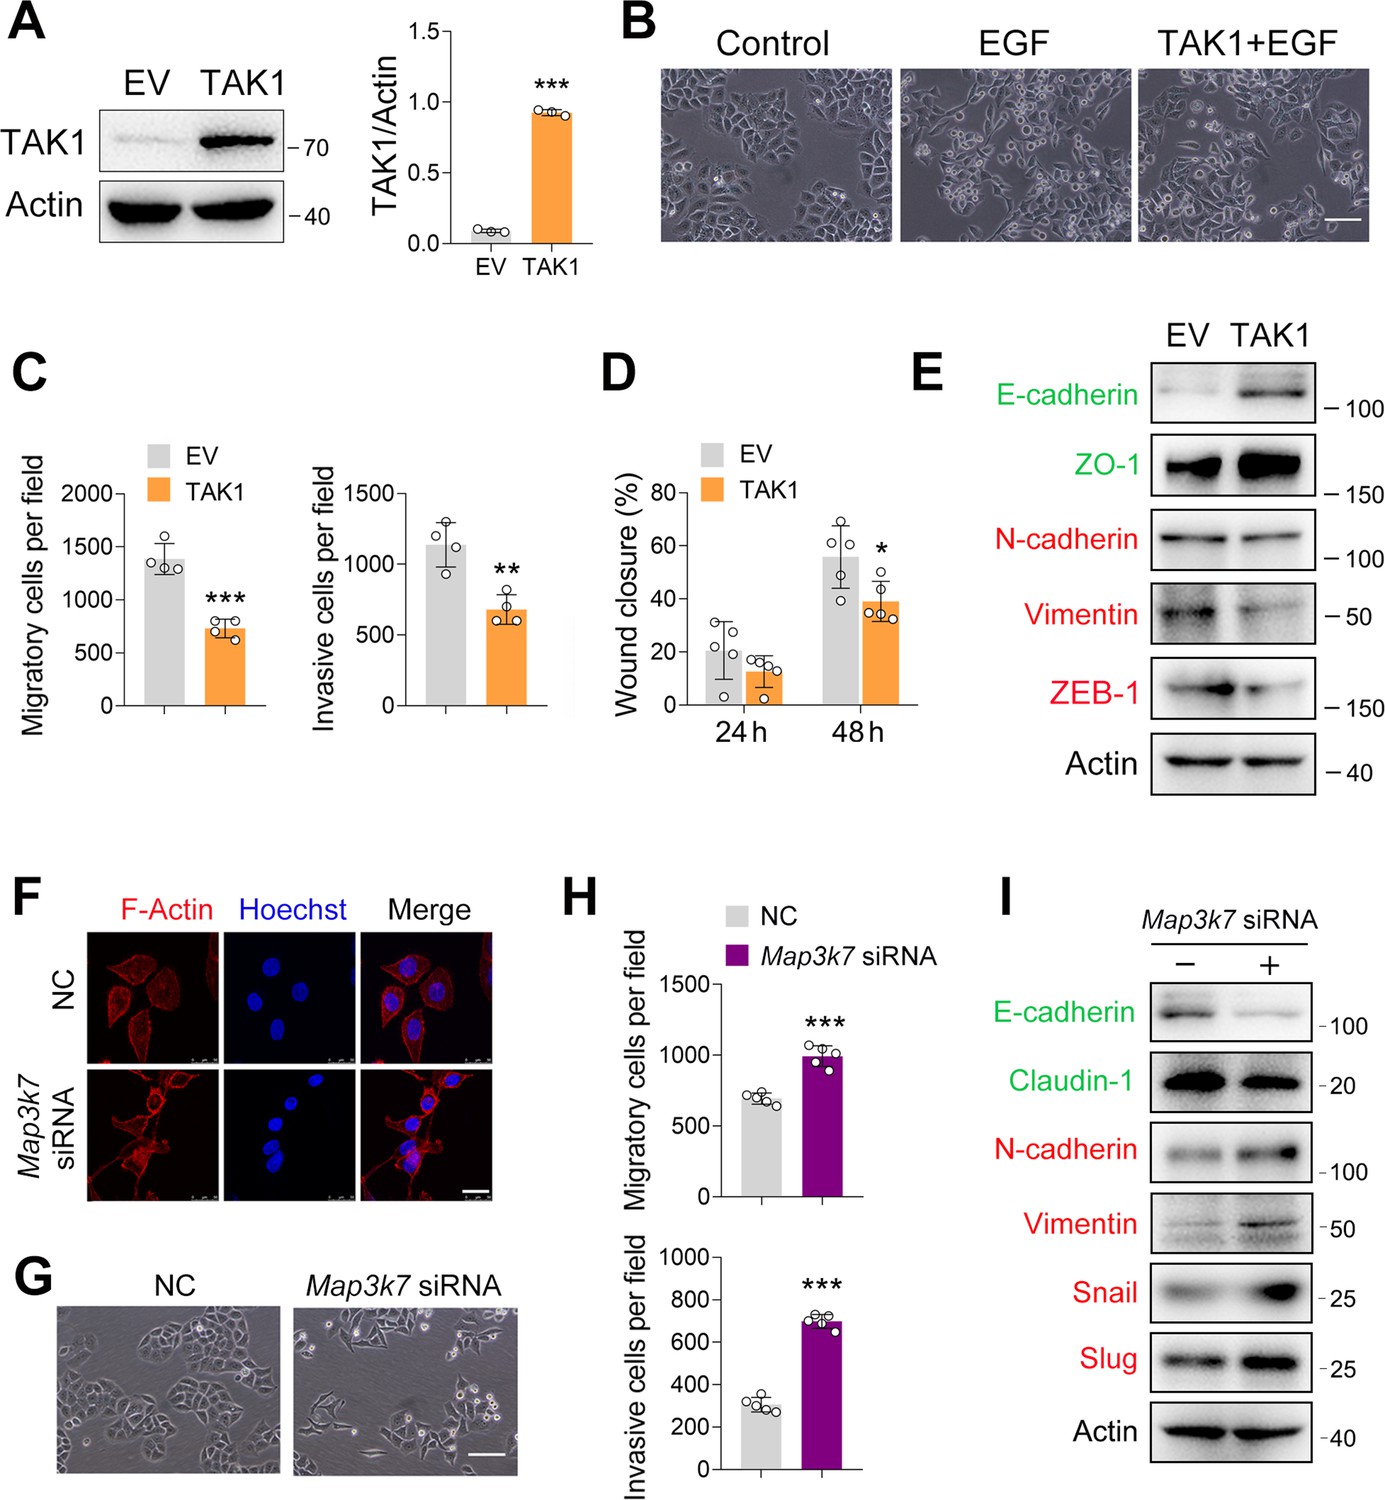
TAK1 negatively regulates esophageal squamous cell carcinoma (ESCC) migration and invasion.
(A) Increased expression of TAK1 in ECA-109 cells transfected with a plasmid expressing Map3k7. (B) Increased expression of TAK1 inhibits the morphological changes to form spindle-shaped mesenchymal cells induced by epidermal growth factor (EGF) (100 ng/ml) in ECA-109. Scale bar = 100 µm. (C) Increased expression of TAK1 inhibits cell migration and invasion in ECA-109 cells. Cell migration and invasion were analyzed by transwell assay. n=4 biologically independent replicates. (D) Wound healing assay showing cell migration was attenuated by TAK1. n=5 biologically independent replicates. (E) TAK1 decreased mesenchymal marker gene expression, while increased the expression of epithelial markers. ECA-109 cells were transfected with the plasmid carrying Map3k7. 24 hr post-transfection, protein samples were prepared and subjected to western blot. Actin was used as a loading control. (F) Knockdown of TAK1 increased the expression of F-Actin. ECA-109 cells were transfected with Map3k7 siRNA. 72 hr post-transfection, cells were subjected to immunofluorescence analysis using an anti-F-Actin antibody (red). Hoechst was used to stain the nucleus (blue). Scale bar = 10 µm. (G) TAK1 knockdown induces spindle-shaped mesenchymal cell morphology in ECA-109 cells. Scale bar = 100 µm. (H) Reduced expression of TAK1 promotes cell migration and invasion. ECA-109 cells were transfected with Map3k7 siRNA. 72 hr post-transfection, cell migration and invasion were analyzed by transwell assay. n=5 biologically independent replicates. (I) Knockdown of TAK1 increases mesenchymal protein marker expression and decreases epithelial protein marker expression. Data are presented as mean ± SD. Statistical significance was tested by unpaired Student’s t-test. *p<0.05, **p<0.01, and ***p<0.001.
-
Figure 1—source data 1
TAK1 negatively regulates esophageal squamous cell carcinoma (ESCC) migration and invasion.
- https://cdn.elifesciences.org/articles/97373/elife-97373-fig1-data1-v1.xlsx
-
Figure 1—source data 2
PDF file containing original western blots for Figure 1A, E, and I, indicating the relevant bands.
- https://cdn.elifesciences.org/articles/97373/elife-97373-fig1-data2-v1.zip
-
Figure 1—source data 3
Original files for western blot analysis displayed in Figure 1A, E, and I.
- https://cdn.elifesciences.org/articles/97373/elife-97373-fig1-data3-v1.zip
Figure 1—figure supplement 1
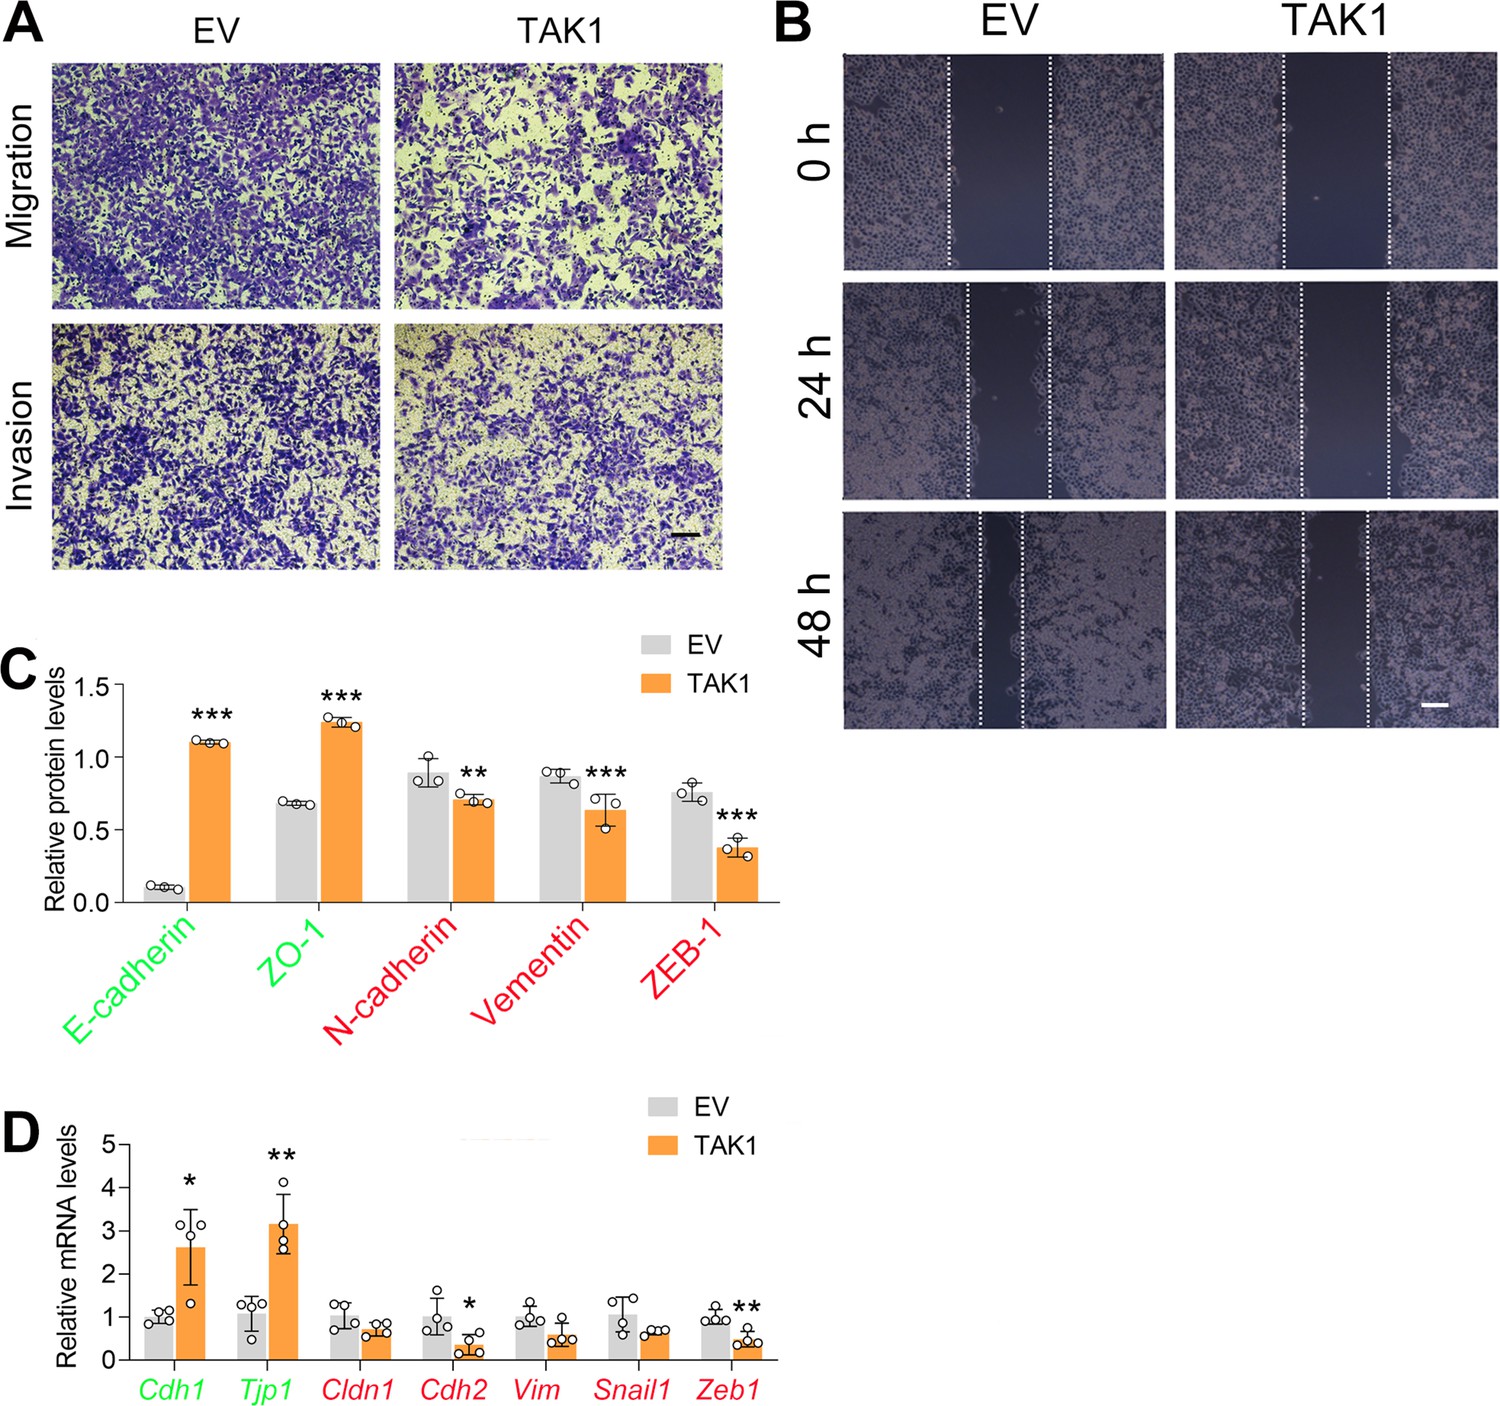
TAK1 represses cell migration in ECA-109 cells.
Cells were transfected with a plasmid expressing Map3k7. 24 or 48 hr post-transfection, cells were subjected to transwell (A) and wound healing assay (B). Scale bar = 500 µm (A) and 100 µm (B). (C) Quantified protein expression based on western blot data in Figure 1E. n=3 biologically independent replicates. (D) TAK1 decreased mesenchymal marker gene expression, while increased the expression of epithelial markers. Gene expression was analyzed by quantitative real time-PCR (qRT-PCR), and Gapdh was used as a house-keeping gene. n=4 biologically independent replicates. Data are presented as mean ± SD. Statistical significance was tested by unpaired Student’s t-test. *p<0.05, **p<0.01, and ***p<0.001.
-
Figure 1—figure supplement 1—source data 1
TAK1 represses cell migration in ECA-109 cells.
- https://cdn.elifesciences.org/articles/97373/elife-97373-fig1-figsupp1-data1-v1.xlsx
Figure 1—figure supplement 2
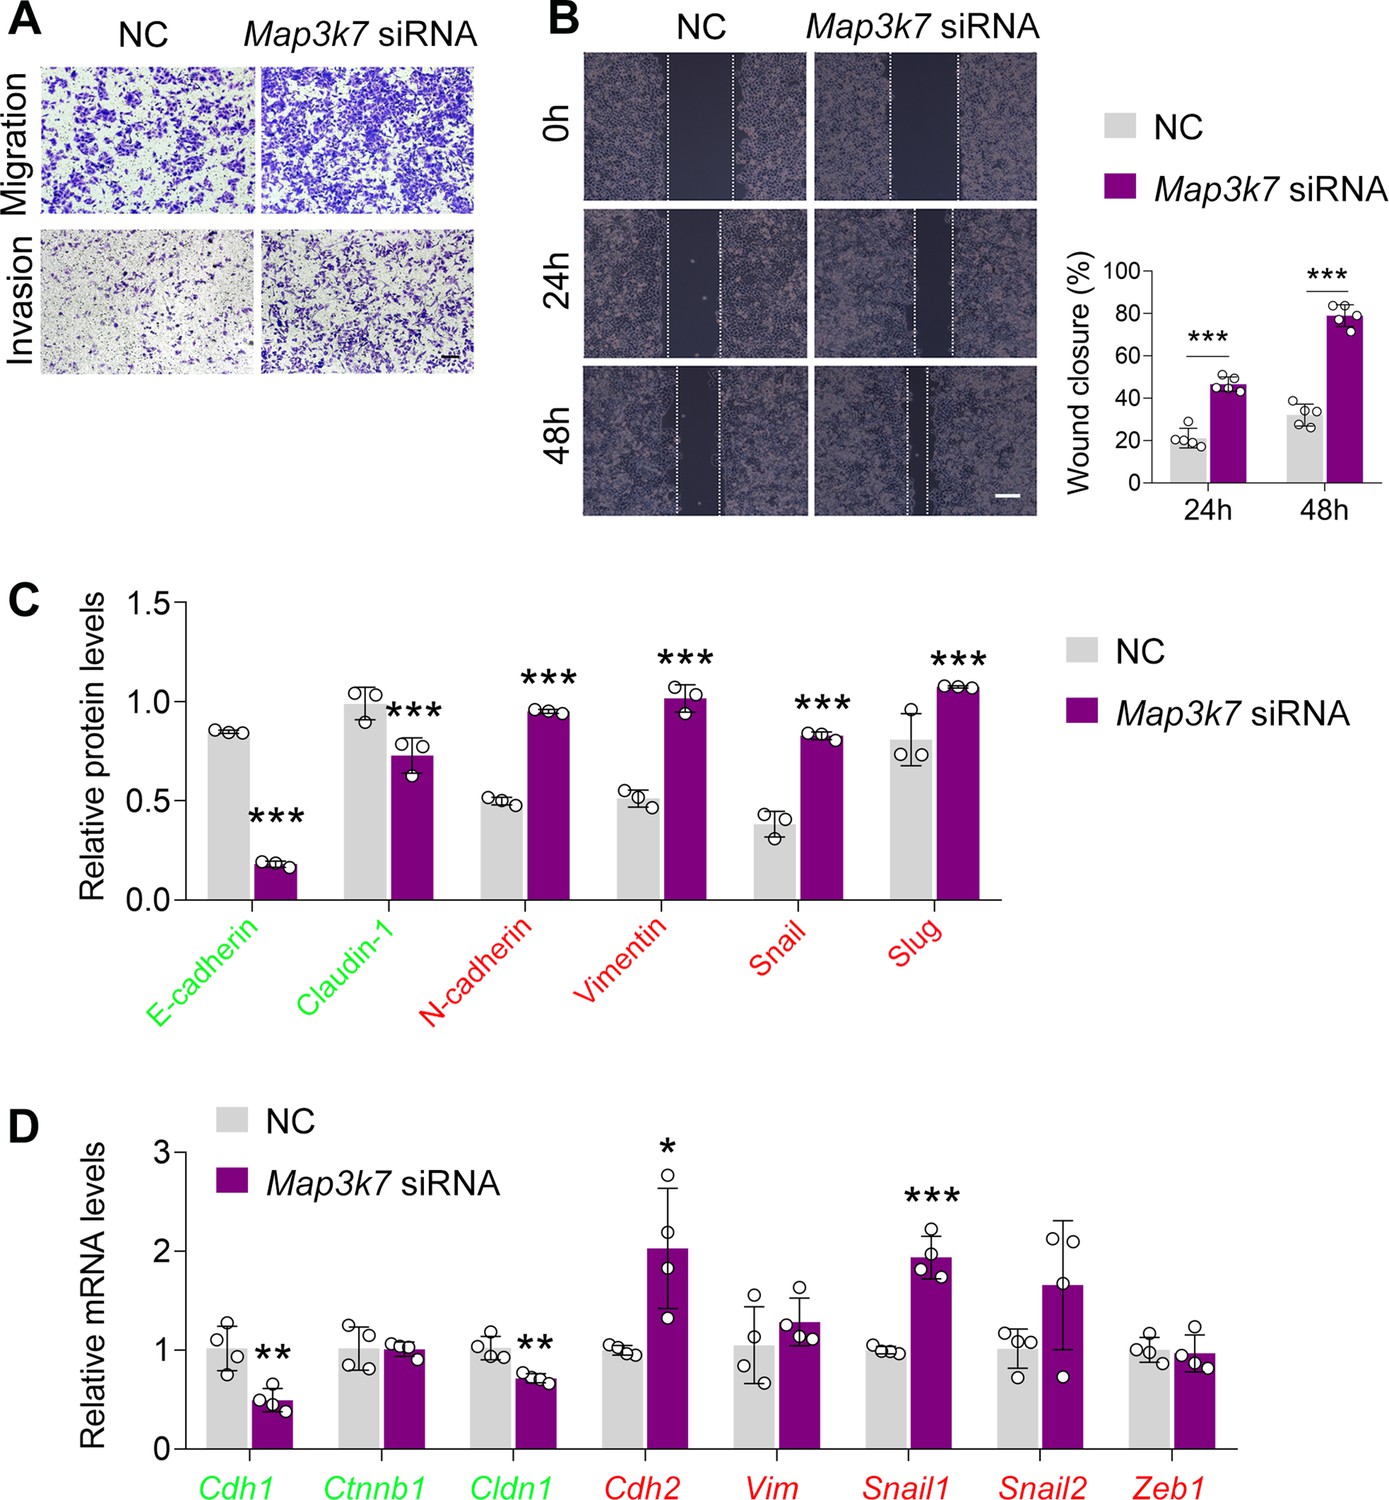
TAK1 silencing promotes esophageal squamous cell carcinoma (ESCC) migration and invasion.
(A–C) Knockdown of TAK1 in ECA-109 cells promotes cell migration and invasion analyzed by transwell (A) and wound healing (B) assays. Scale bar = 500 µm (A) or 100 µm (B). (C) Quantitative analysis of the western blot data as shown in Figure 1I. n=3 biologically independent replicates. (D) Reduced expression of TAK1 in ECA-109 cells increases mesenchymal marker gene expression, while decreases epithelial marker gene expression. Gene expression was analyzed by quantitative real time-PCR (qRT-PCR), and Gapdh was used as a house-keeping gene. n=4 biologically independent replicates. Data are presented as mean ± SD. Statistical significance was tested by unpaired Student’s t-test. *p<0.05, **p<0.01, and ***p<0.001.
-
Figure 1—figure supplement 2—source data 1
TAK1 silencing promotes esophageal squamous cell carcinoma (ESCC) migration and invasion.
- https://cdn.elifesciences.org/articles/97373/elife-97373-fig1-figsupp2-data1-v1.xlsx
Figure 1—figure supplement 3
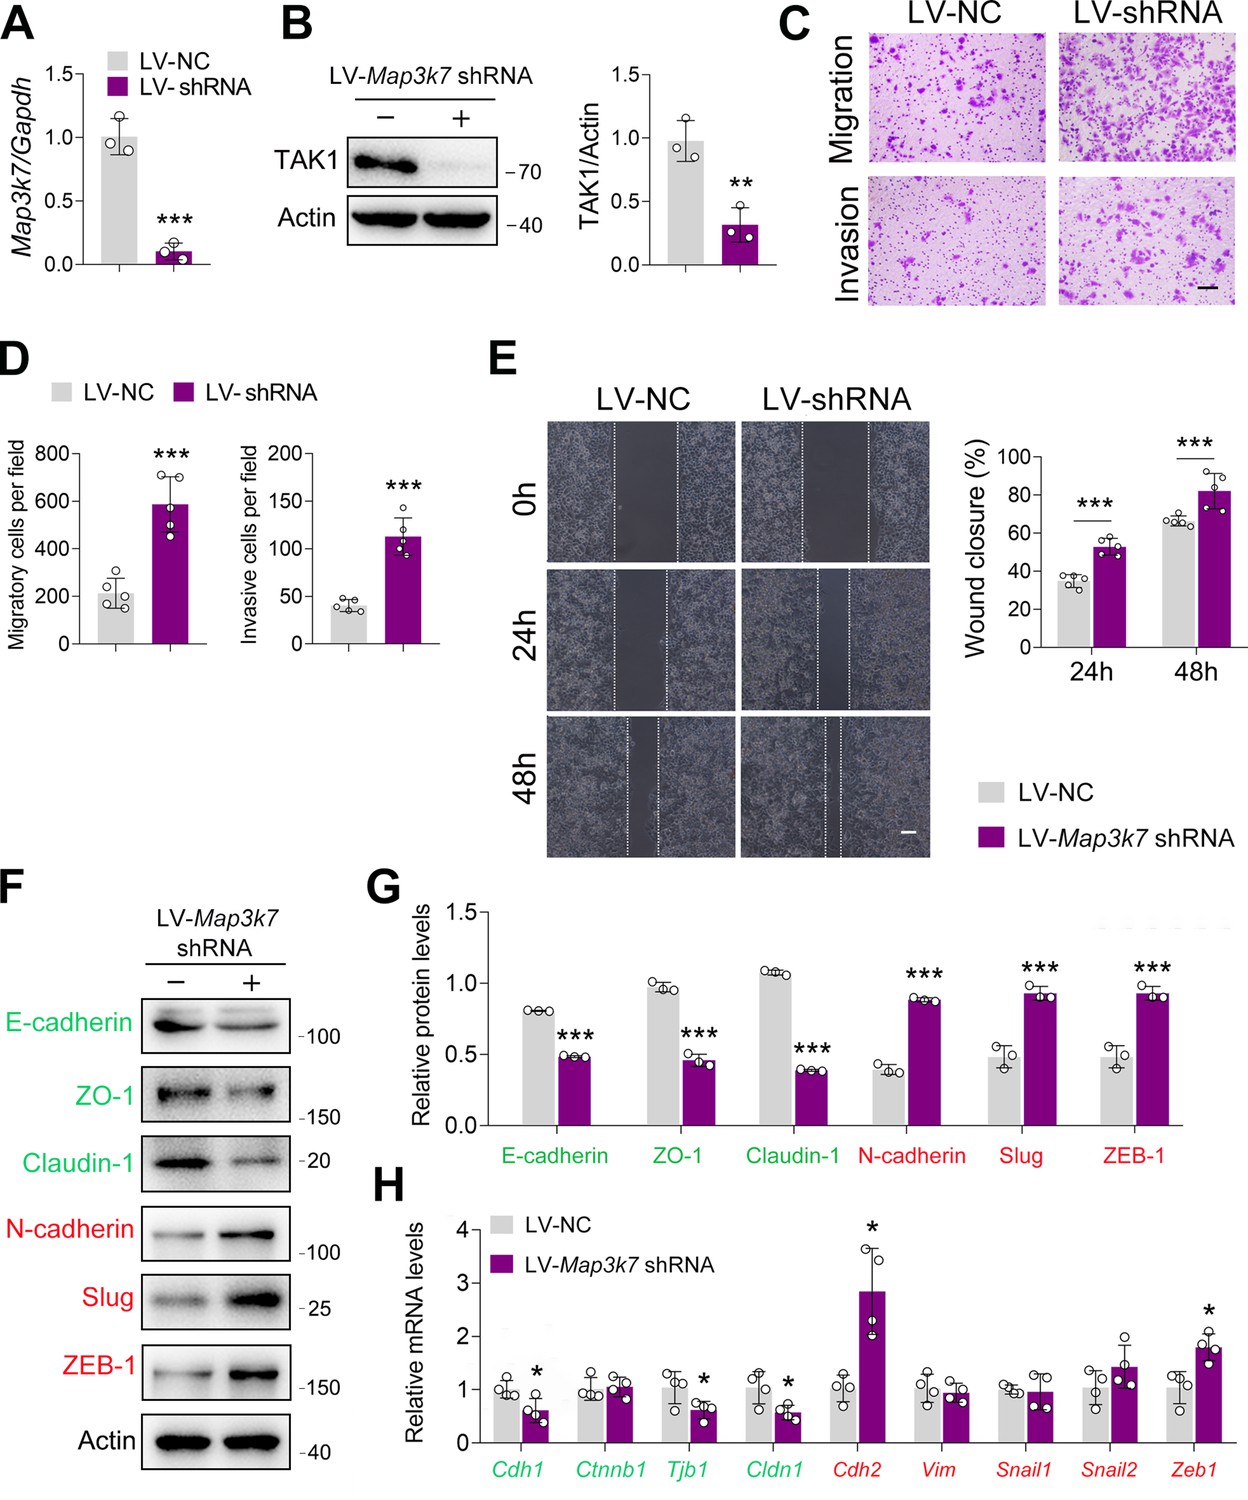
TAK1 knockdown facilitates esophageal squamous cell carcinoma (ESCC) migration and invasion.
(A–B) Knockdown of TAK1 by Map3k7 shRNA. ECA-109 cells were transduced with lentivirus bearing Map3k7 shRNA (LV-Map3k7 shRNA) or NC shRNA (LV-NC). 48 hr post-transduction, cells were harvested for analyzing TAK1 expression by quantitative real time-PCR (qRT-PCR) (A) and western blot (B). n=3 biologically independent replicates. (C–E) Decreased expression of TAK1 facilitates cell migration and invasion. ECA-109 cells were transduced with LV-Map3k7 shRNA or LV-NC. 48 hr post-transduction, cells were subjected to transwell (C, D) or wound healing (E) assay. n=5 biologically independent replicates. Scale bar = 500 µm (C); scale bar = 100 µm (E). (F–G) Reduced expression of TAK1 increases mesenchymal marker expression and decreases epithelial marker expression. n=3 biologically independent replicates. (H) Reduced expression of TAK1 in ECA-109 cells affects epithelial-mesenchymal transition (EMT) related gene expression. Protein levels were analyzed by western blot, and Actin was used as a loading control. Gene expression was detected by qRT-PCR, and Gapdh was used as a house-keeping gene. n=4 biologically independent replicates. Data are presented as mean ± SD. Statistical significance was tested by unpaired Student’s t-test. *p<0.05, **p<0.01, and ***p<0.001.
-
Figure 1—figure supplement 3—source data 1
TAK1 knockdown facilitates esophageal squamous cell carcinoma (ESCC) migration and invasion.
- https://cdn.elifesciences.org/articles/97373/elife-97373-fig1-figsupp3-data1-v1.xlsx
-
Figure 1—figure supplement 3—source data 2
PDF file containing original western blots for Figure 1—figure supplement 3B and F, indicating the relevant bands.
- https://cdn.elifesciences.org/articles/97373/elife-97373-fig1-figsupp3-data2-v1.zip
-
Figure 1—figure supplement 3—source data 3
Original files for western blot analysis displayed in Figure 1—figure supplement 3B and F.
- https://cdn.elifesciences.org/articles/97373/elife-97373-fig1-figsupp3-data3-v1.zip
Figure 1—figure supplement 4
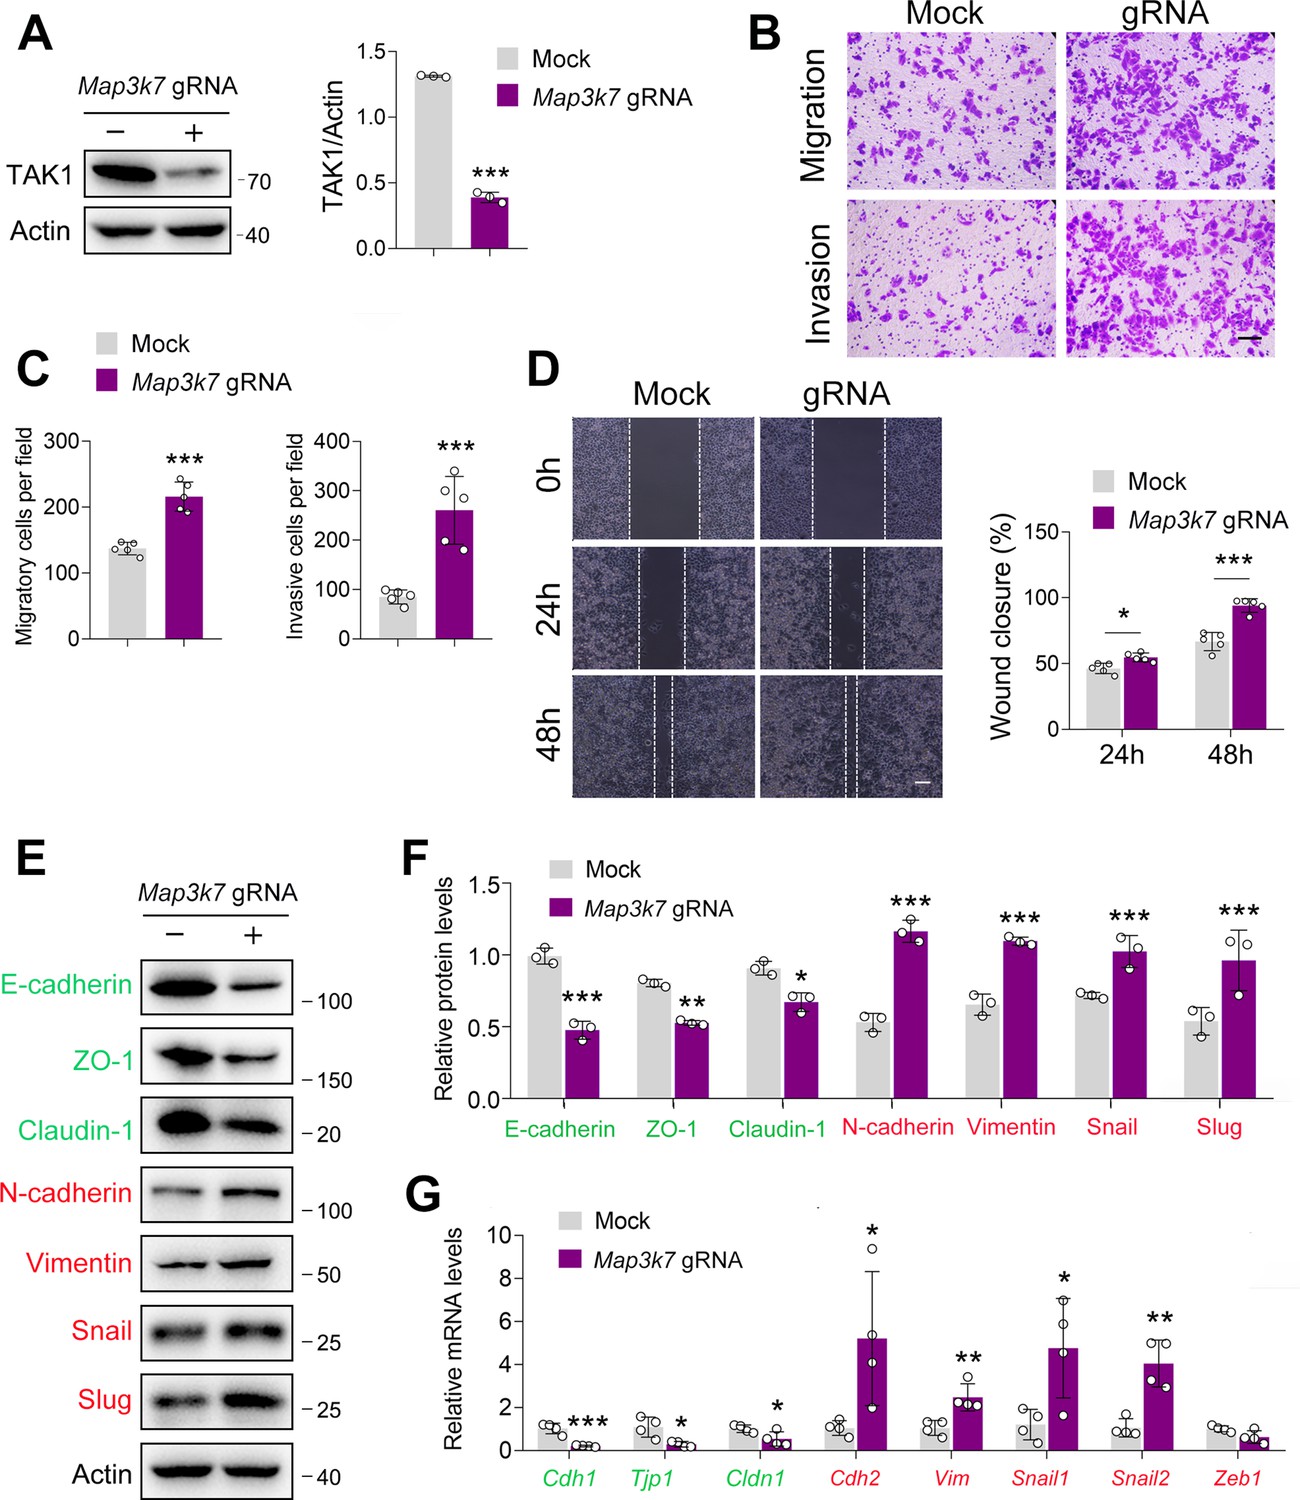
TAK1 knockout accelerates esophageal squamous cell carcinoma (ESCC) migration and invasion.
(A–B) TAK1 expression was decreased by Map3k7 gRNA in ECA-109 cells. TAK1 knockout was achieved by CRISPR-Cas9. (B–D) Knockout of TAK1 expression in ECA-109 cells accelerates cell migration and invasion as analyzed by transwell (B, C) and wound healing (D) assays. Scale bar = 500 µm (B); scale bar = 100 µm (D). (E–F) Loss of TAK1 increases mesenchymal protein marker expression and reduces epithelial protein marker expression. ECA-109 cells were treated with Map3k7 gRNA, and then cells were harvested for western blot analysis. n=3 biologically independent replicates. (G) Knockout of TAK1 expression in ECA-109 cells alters epithelial-mesenchymal transition (EMT) related gene expression as analyzed by quantitative real time-PCR (qRT-PCR). Gapdh was used as a house-keeping gene. n=4 biologically independent replicates. Protein levels were analyzed by western blot, and Actin was used as a loading control. Data are presented as mean ± SD. Statistical significance was tested by unpaired Student’s t-test. *p<0.05, **p<0.01, and ***p<0.001.
-
Figure 1—figure supplement 4—source data 1
TAK1 knockout accelerates esophageal squamous cell carcinoma (ESCC) migration and invasion.
- https://cdn.elifesciences.org/articles/97373/elife-97373-fig1-figsupp4-data1-v1.xlsx
-
Figure 1—figure supplement 4—source data 2
PDF file containing original western blots for Figure 1—figure supplement 4A and E, indicating the relevant bands.
- https://cdn.elifesciences.org/articles/97373/elife-97373-fig1-figsupp4-data2-v1.zip
-
Figure 1—figure supplement 4—source data 3
Original files for western blot analysis displayed in Figure 1—figure supplement 4A and E.
- https://cdn.elifesciences.org/articles/97373/elife-97373-fig1-figsupp4-data3-v1.zip
Figure 1—figure supplement 5
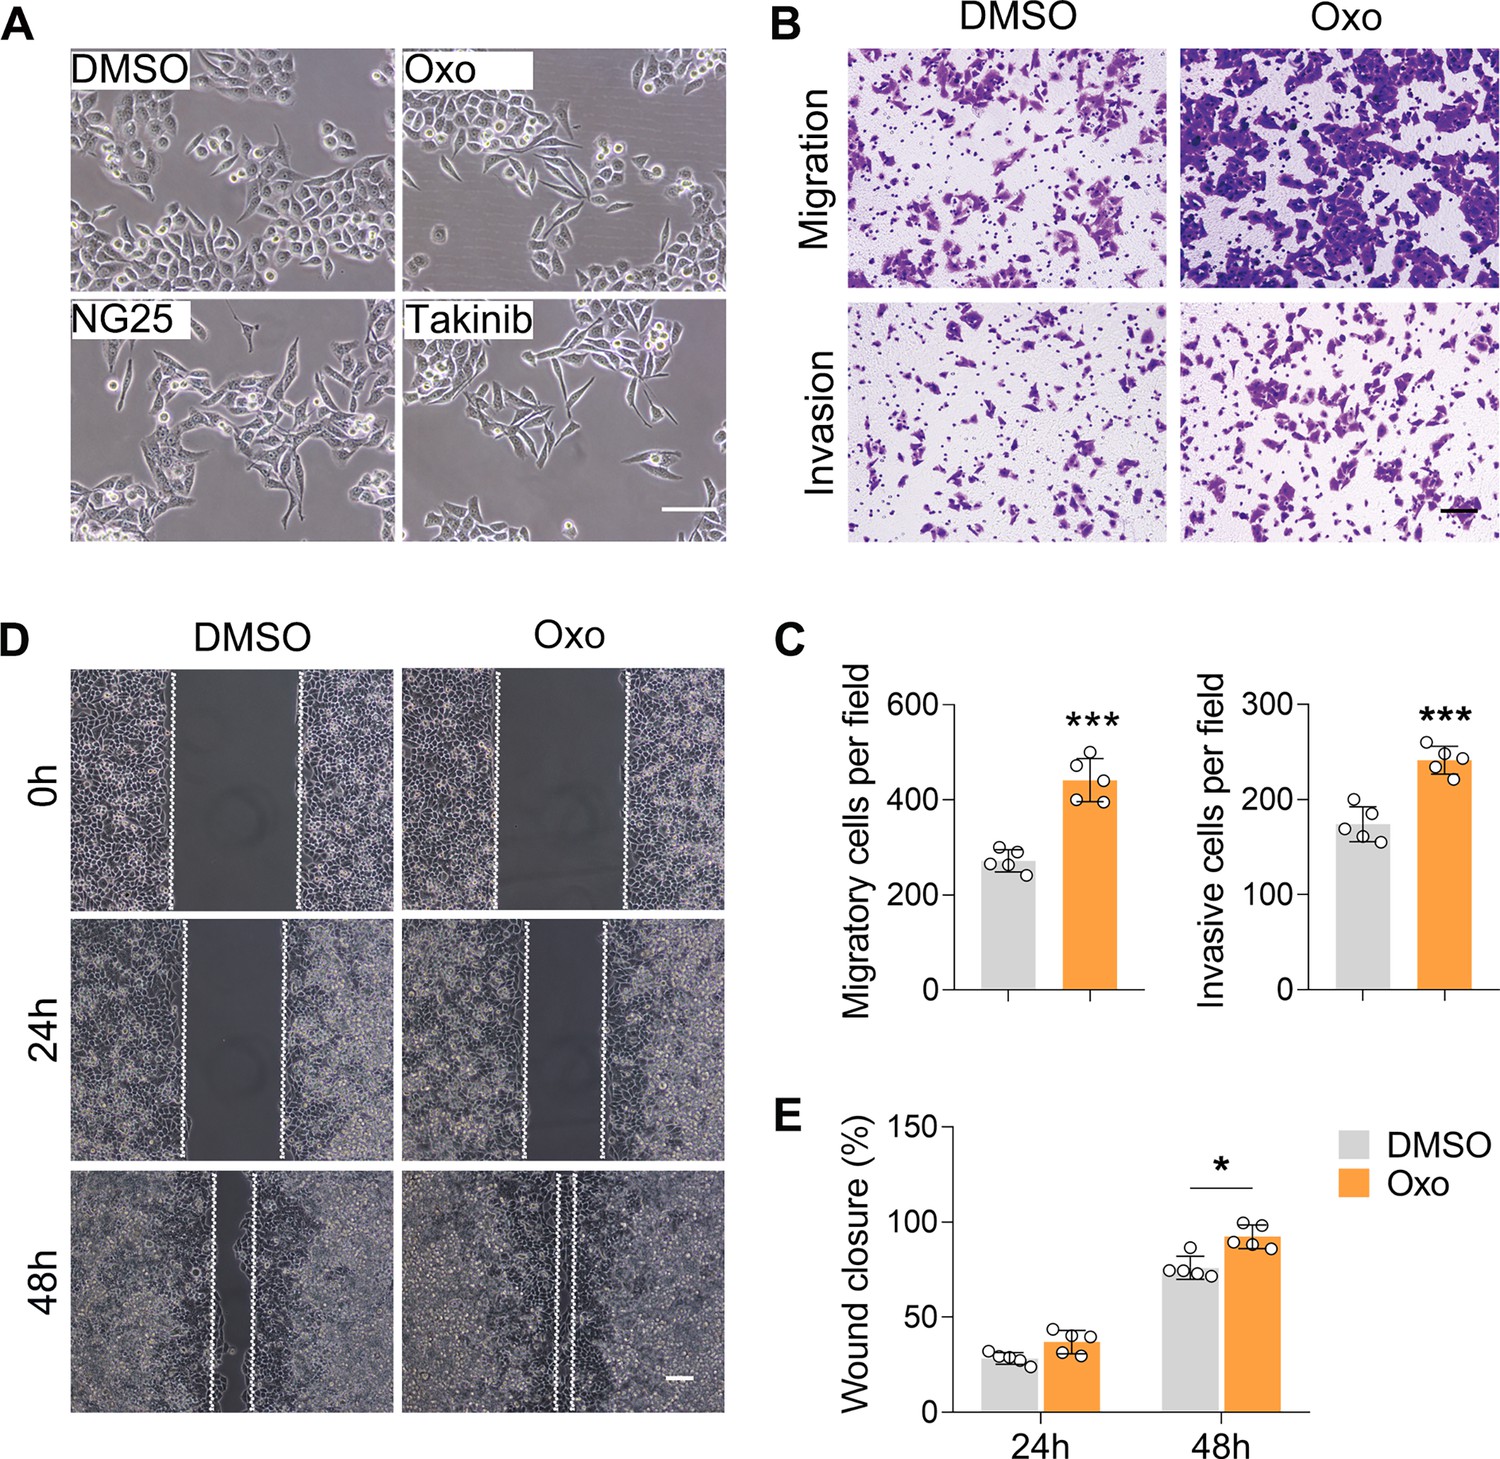
Inhibition of TAK1 potentiates cell migration and invasion in ECA-109 cells.
Cells were treated with (5Z)-7-oxozeaenol (Oxo; 10 µM), or NG25 (10 µM), or Takinib (10 µM) for 24 hr, and then cell morphology, migration, and invasion were analyzed. (A) Inhibition of TAK1 promotes morphological changes to form spindle-shaped mesenchymal cells in ECA-109 cells. Scale bar = 100 µm. (B–E) Inhibition of TAK1 promotes cell migration and invasion in ECA-109 cells. Cell migration and invasion were analyzed by transwell (B, C) and wound healing (D, E) assays. Scale bar = 500 µm (B); scale bar = 100 µm (D). n=5 biologically independent replicates. Data are presented as mean ± SD. Statistical significance was tested by unpaired Student’s t-test. *p<0.05 and ***p<0.001.
-
Figure 1—figure supplement 5—source data 1
Inhibition of TAK1 potentiates cell migration and invasion in ECA-109 cells.
- https://cdn.elifesciences.org/articles/97373/elife-97373-fig1-figsupp5-data1-v1.xlsx
Figure 2 with 1 supplement
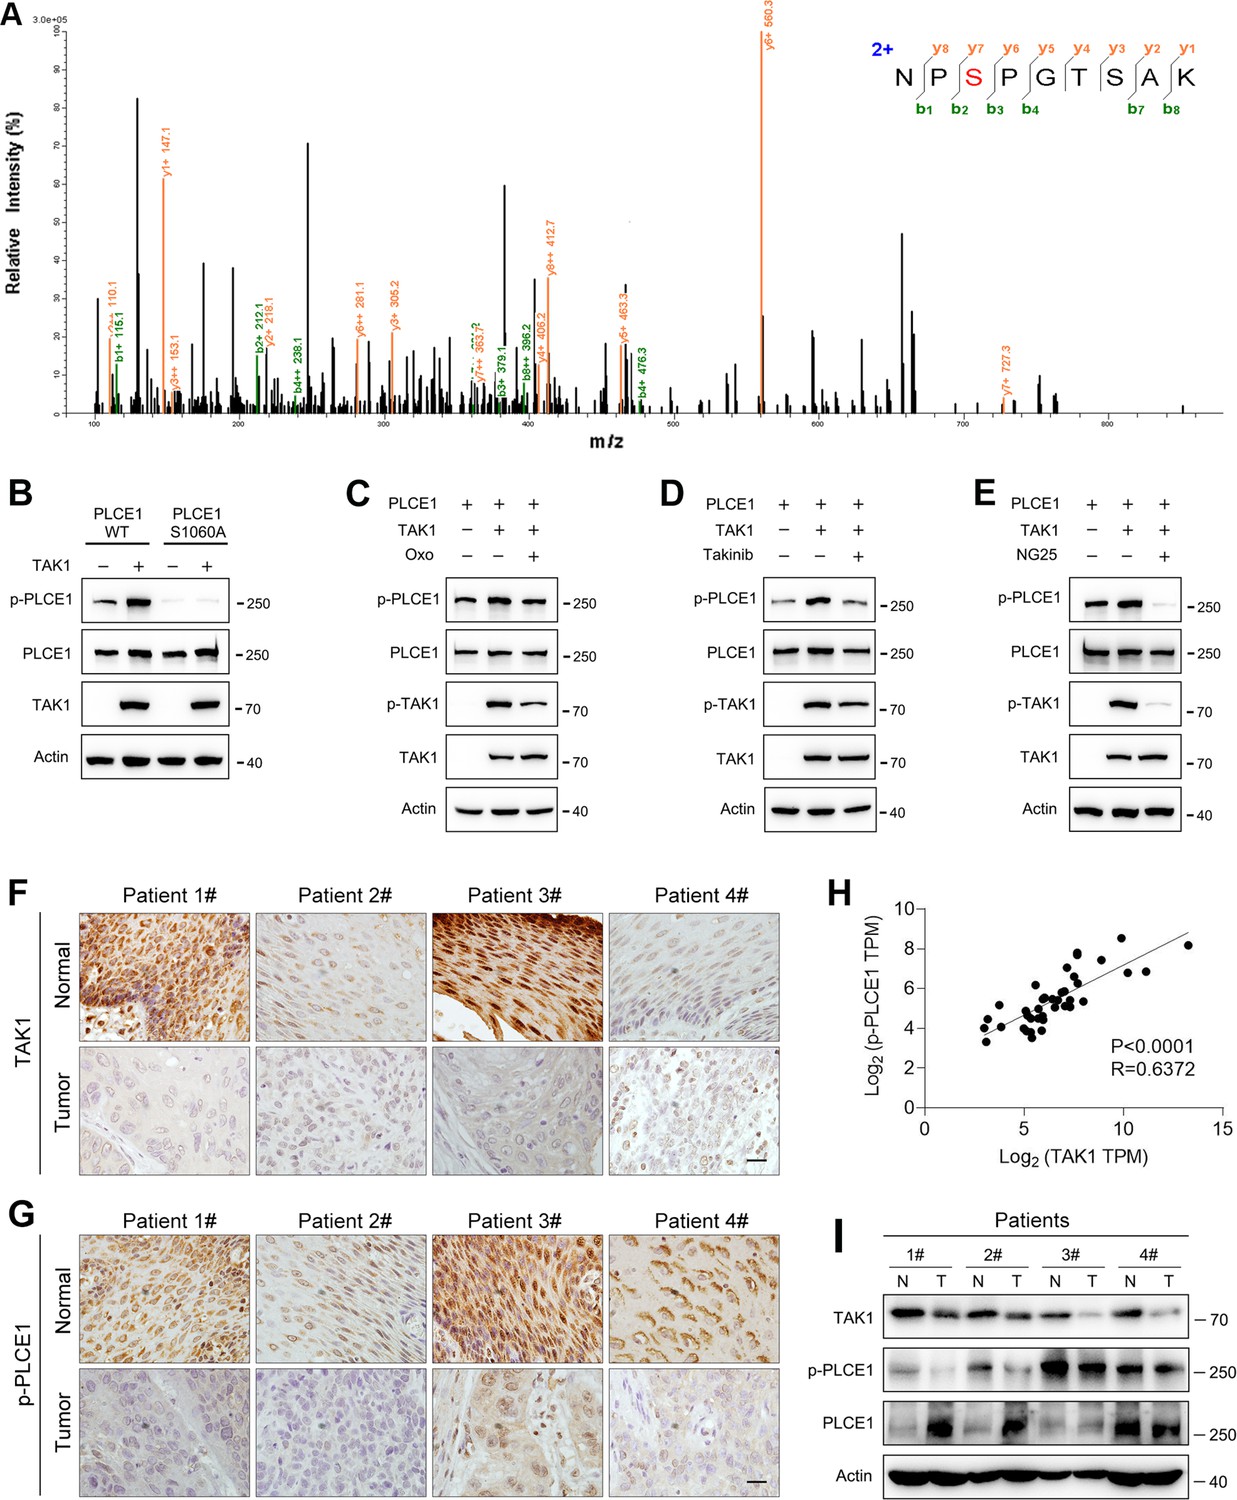
TAK1 phosphorylates PLCE1 at serine 1060.
(A) Tandem mass spectrometry showing serine 1060 (S1060) in PLCE1 was phosphorylated by TAK1. ECA-109 cells were transfected with a plasmid expressing Map3k7. 24 hr post-transfection, cells were harvested and subjected to co-immunoprecipitation. The resulting immunocomplex was analyzed by liquid chromatography coupled with tandem mass spectrometry (LC-MS/MS). (B) TAK1 fails to phosphorylate PLCE1S1060A. ECA-109 cells were co-transfected with the plasmids carrying wildtype (WT) Plce1, mutated Plce1 (PLCE1S1060A), or Map3k7 as indicated. 24 hr post-transfection, cells were collected for western blot analysis. (C–E) Inhibition of TAK1 reduces PLCE1 phosphorylation at S1060. ECA-109 cells were co-transfected with the plasmids expressing Plce1 or Map3k7. 6 hr post-transfection, TAK1 inhibitor (5Z)-7-oxozeaenol (Oxo; 10 µM) (C), or 10 µM Takinib (D), or 10 µM NG25 (E) was added in culture medium, and cells were cultured for additional 18 hr. Cells were then subjected to western blot analysis. Actin was used as a loading control. (F–G) Immunohistochemical analysis of TAK1 (F) and p-PLCE1 (G) expression in normal and esophageal squamous tumor tissues. n=4 biologically independent replicates. Scale bar = 20 µm. (H) Correlation between p-PLCE1 and TAK1 based on immunohistochemical data as shown in (F–G). 10 views for each sample were randomly chosen for Pearson’s correlation test. (I) TAK1 and p-PLCE1 protein levels in clinical samples. Protein levels were analyzed by western blot, and Actin was used as a loading control. n=4 biologically independent replicates. N: normal tissue; T: tumor tissue.
-
Figure 2—source data 1
TAK1 phosphorylates PLCE1 at serine 1060.
- https://cdn.elifesciences.org/articles/97373/elife-97373-fig2-data1-v1.xlsx
-
Figure 2—source data 2
PDF file containing original western blots for Figure 2B, C, D, E, and I, indicating the relevant bands.
- https://cdn.elifesciences.org/articles/97373/elife-97373-fig2-data2-v1.zip
-
Figure 2—source data 3
Original files for western blot analysis displayed in Figure 2B, C, D, E, and I.
- https://cdn.elifesciences.org/articles/97373/elife-97373-fig2-data3-v1.zip
Figure 2—figure supplement 1
TAK1 phosphorylates PLCE1 at serine 1060.
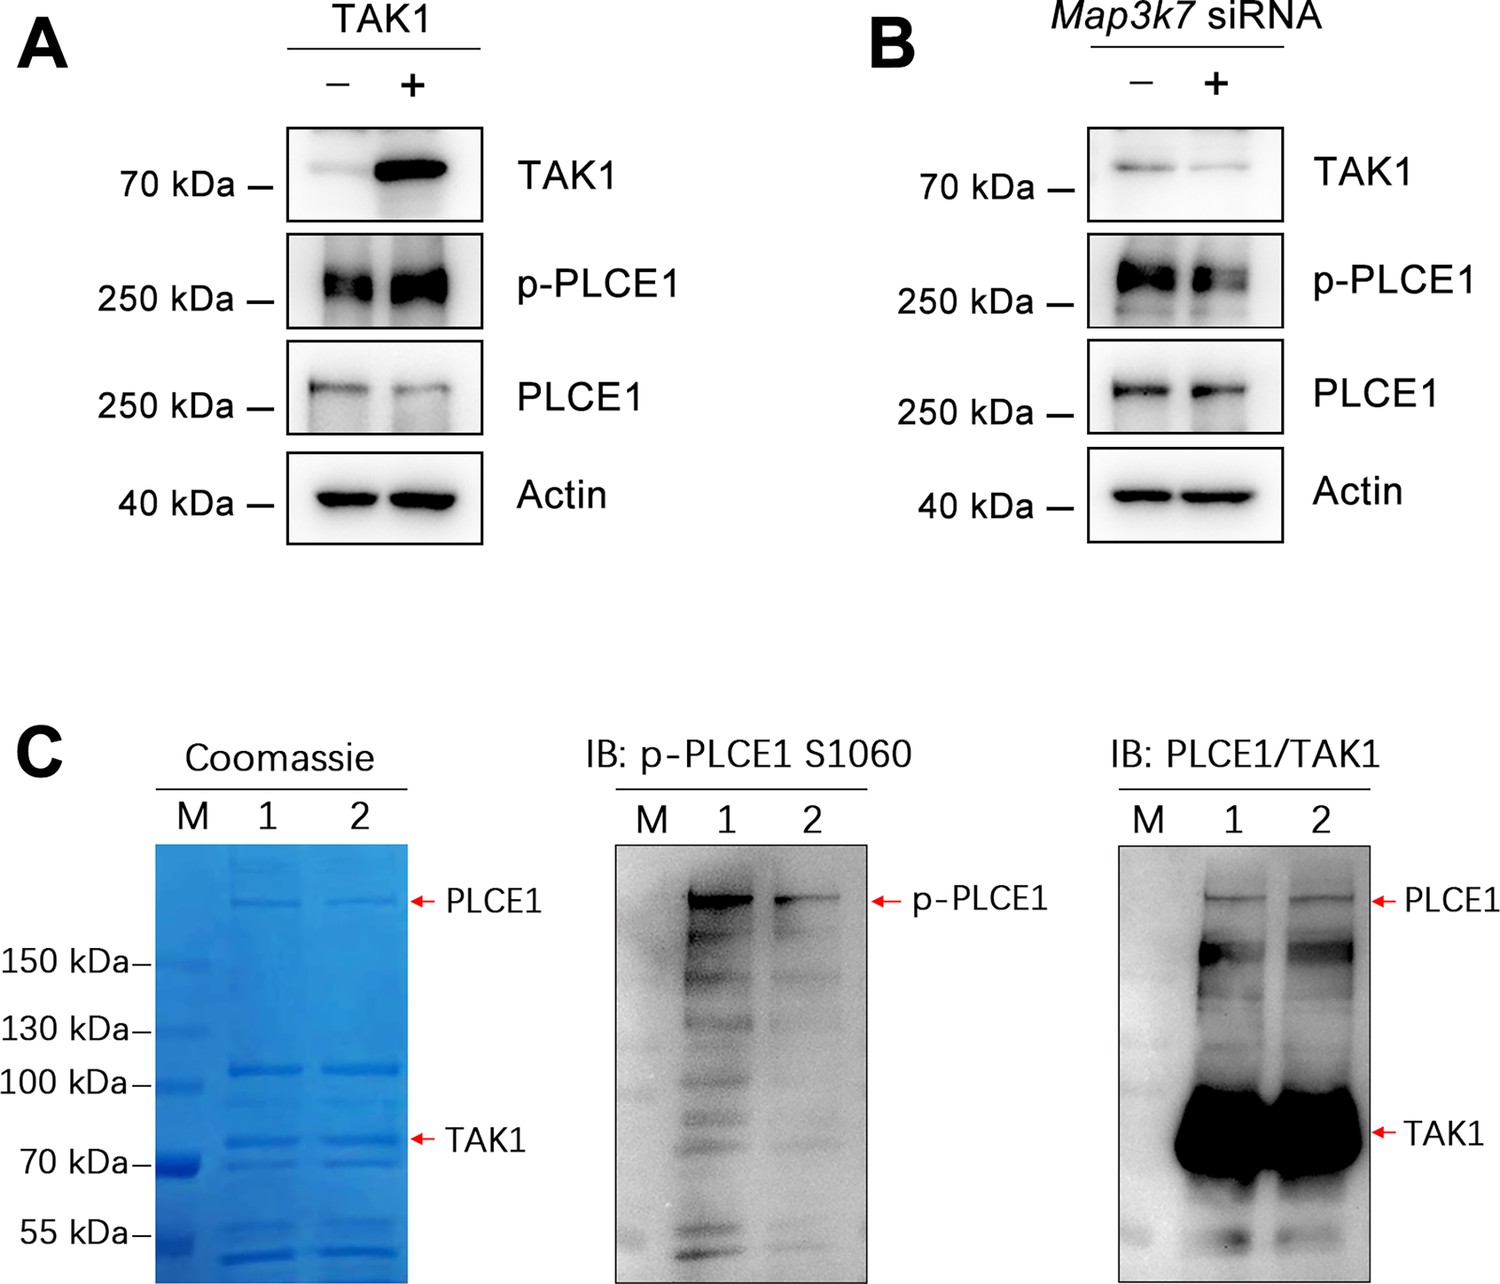
(A) TAK1 overexpression induces endogenous PLCE1 phosphorylation at serine 1060 (p-PLCE1 S1060). ECA-109 cells were transfected with a plasmid expressing TAK1. 24 hr post-transfection, cells were harvested and subjected to western blot analysis. Actin was used as a loading control. (B) TAK1 knockdown reduces endogenous p-PLCE1 S1060. ECA-109 cells were transfected with Map3k7 siRNA. 48 hr post-transfection, cells were collected for analyzing p-PLCE1 S1060. Actin was used as a loading control. (C) TAK1 phosphorylates PLCE1 at S1060 in an in vitro kinase assay. ECA-109 cells were transfected with a plasmid carrying S protein tagged TAK1 (SP-TAK1), Myc tagged PLCE1 (Myc-PLCE1), or Myc tagged PLCE1 S1060A (Myc-PLCE1 S1060A). 24 hr post-transfection, cells were harvested and subjected to protein pull-down, the resulting purified SP-TAK1, Myc-PLCE1, and Myc-PLCE1 S1060A were incubated in a kinase assay buffer. The reaction mixtures were then resolved by SDS-PAGE, the resulting gels were analyzed by Coomassie blue staining or western blot. Lane M: marker; Lane 1: SP-TAK1+Myc-PLCE1; Lane 2: SP-TAK1+Myc-PLCE1 S1060A. The observed band for p-PLCE1 in lane 2 is likely due to the presence of endogenous wildtype PLCE1 in the TAK1 pull-down samples.
-
Figure 2—figure supplement 1—source data 1
PDF file containing original western blots for Figure 2—figure supplement 1A, B, and C, indicating the relevant bands.
- https://cdn.elifesciences.org/articles/97373/elife-97373-fig2-figsupp1-data1-v1.zip
-
Figure 2—figure supplement 1—source data 2
Original files for western blot analysis displayed in Figure 2—figure supplement 1A, B, and C.
- https://cdn.elifesciences.org/articles/97373/elife-97373-fig2-figsupp1-data2-v1.zip
Figure 3 with 4 supplements
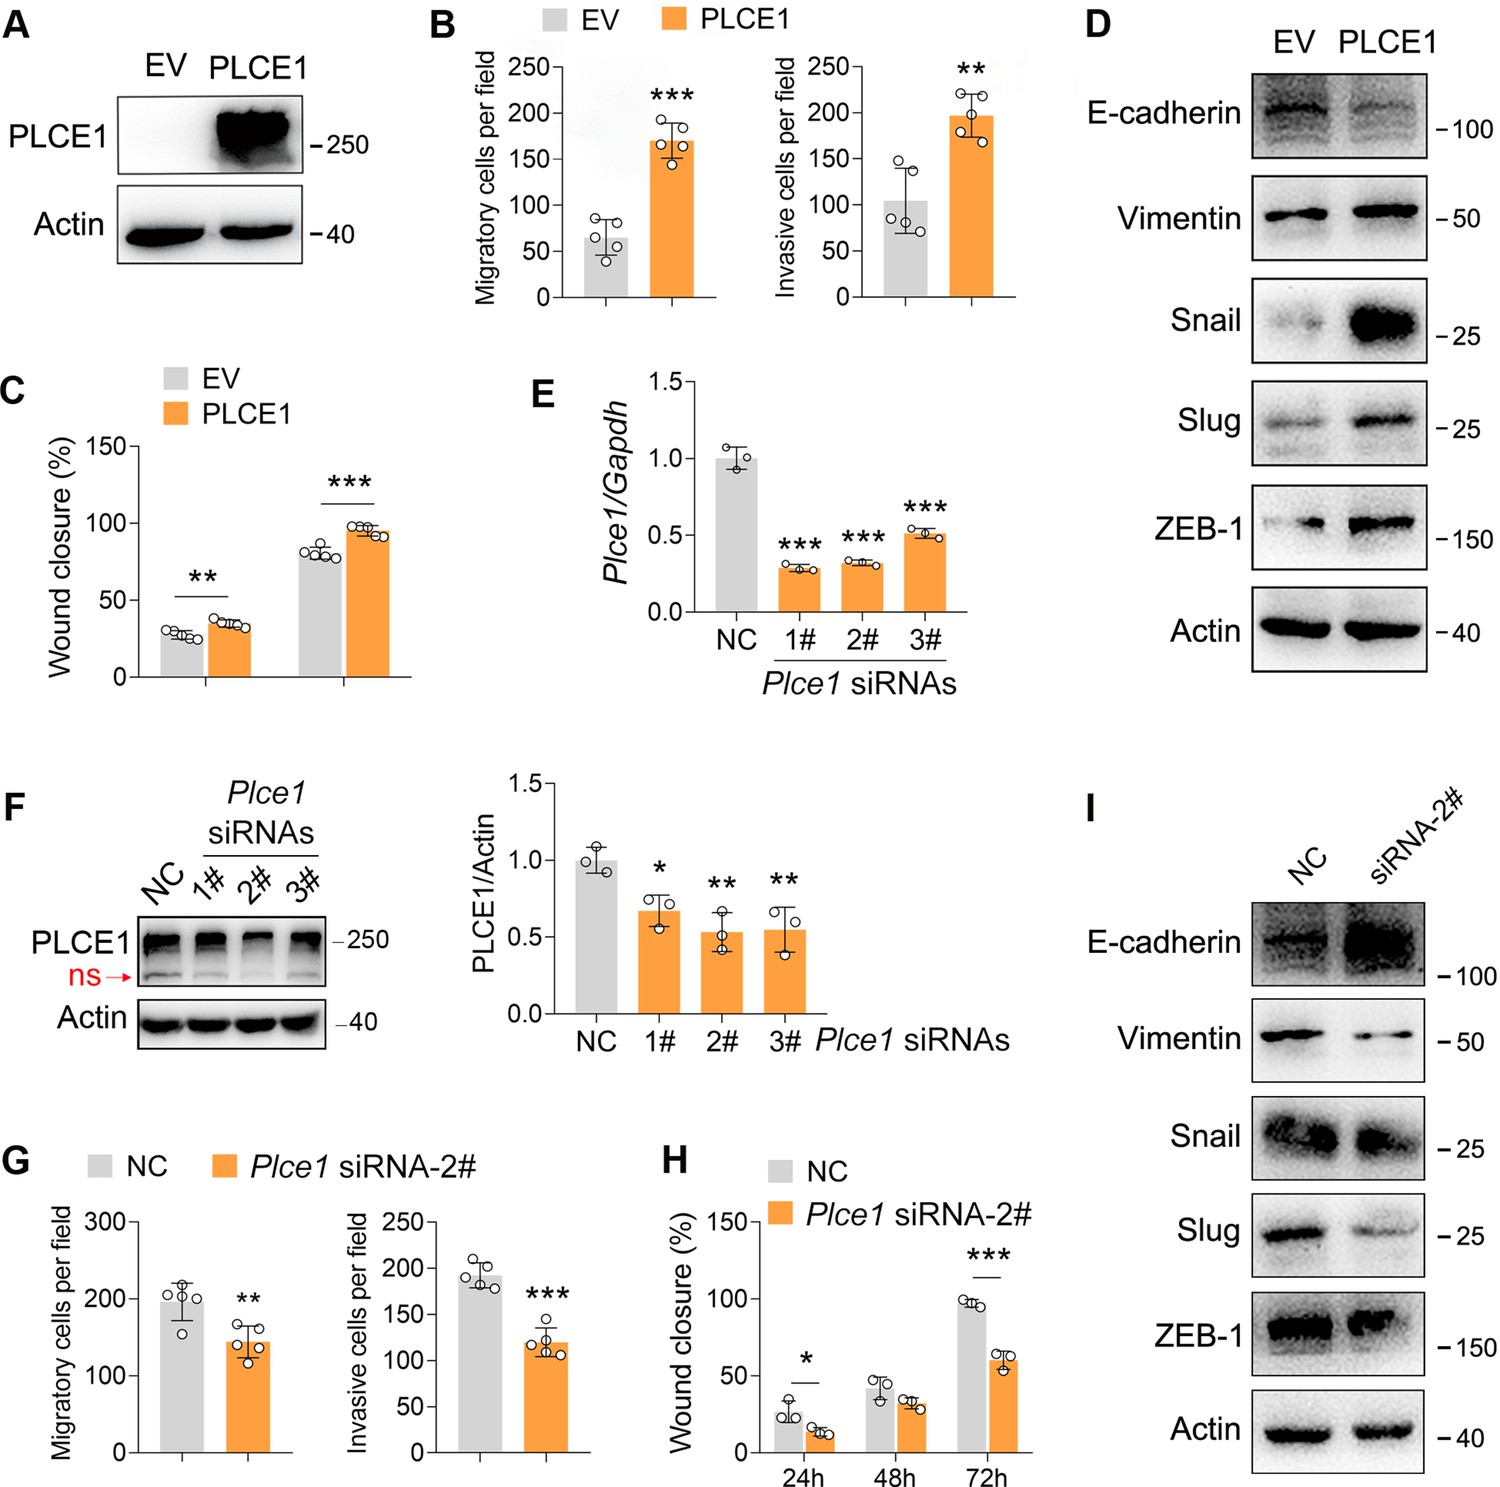
PLCE1 positively regulates esophageal squamous cell carcinoma (ESCC) migration and invasion.
(A) Increased expression of PLCE1 in ECA-109 cells transfected with a plasmid expressing Plce1. (B–C) Increased expression of PLCE1 enhances cell migration and invasion. ECA-109 cells were transfected with the plasmid carrying Plce1. 24 hr post-transfection, cells were subjected to transwell (B) or wound healing (C) assay. n=5 biologically independent replicates. (D) Increased expression of PLCE1 in ECA-109 cells induces mesenchymal protein marker expression, while reduces epithelial protein marker expression. (E–F) Knockdown of PLCE1. ECA-109 cells were transfected with siRNAs targeting Plce1. 72 hr post-transfection, cells were harvested for analyzing PLCE1 expression by quantitative real time-PCR (qRT-PCR) (E) and western blot (F). (G–H) Reduced expression of PLCE1 inhibits cell migration and invasion. ECA-109 cells were transfected with Plce1 siRNA-2. 48 hr post-transfection, cells were subjected to transwell (G) or wound healing (H) assay. n=3–5 biologically independent replicates. (I) Knockdown of PLCE1 promotes epithelial protein marker expression, while represses mesenchymal protein marker expression. ECA-109 cells were transfected with Plce1 siRNA-2. 72 hr post-transfection, cells were harvested and subjected to western blot analysis. Protein level was detected by western blot, and Actin was used as a loading control. Gene expression was analyzed by qRT-PCR, and Gapdh was used as a house-keeping gene. Data are presented as mean ± SD. Statistical significance was tested by unpaired Student’s t-test. *p<0.05, **p<0.01, and ***p<0.001.
-
Figure 3—source data 1
PLCE1 positively regulates esophageal squamous cell carcinoma (ESCC) migration and invasion.
- https://cdn.elifesciences.org/articles/97373/elife-97373-fig3-data1-v1.xlsx
-
Figure 3—source data 2
PDF file containing original western blots for Figure 3A, D, F, and I, indicating the relevant bands.
- https://cdn.elifesciences.org/articles/97373/elife-97373-fig3-data2-v1.zip
-
Figure 3—source data 3
Original files for western blot analysis displayed in Figure 3A, D, F, and I.
- https://cdn.elifesciences.org/articles/97373/elife-97373-fig3-data3-v1.zip
Figure 3—figure supplement 1
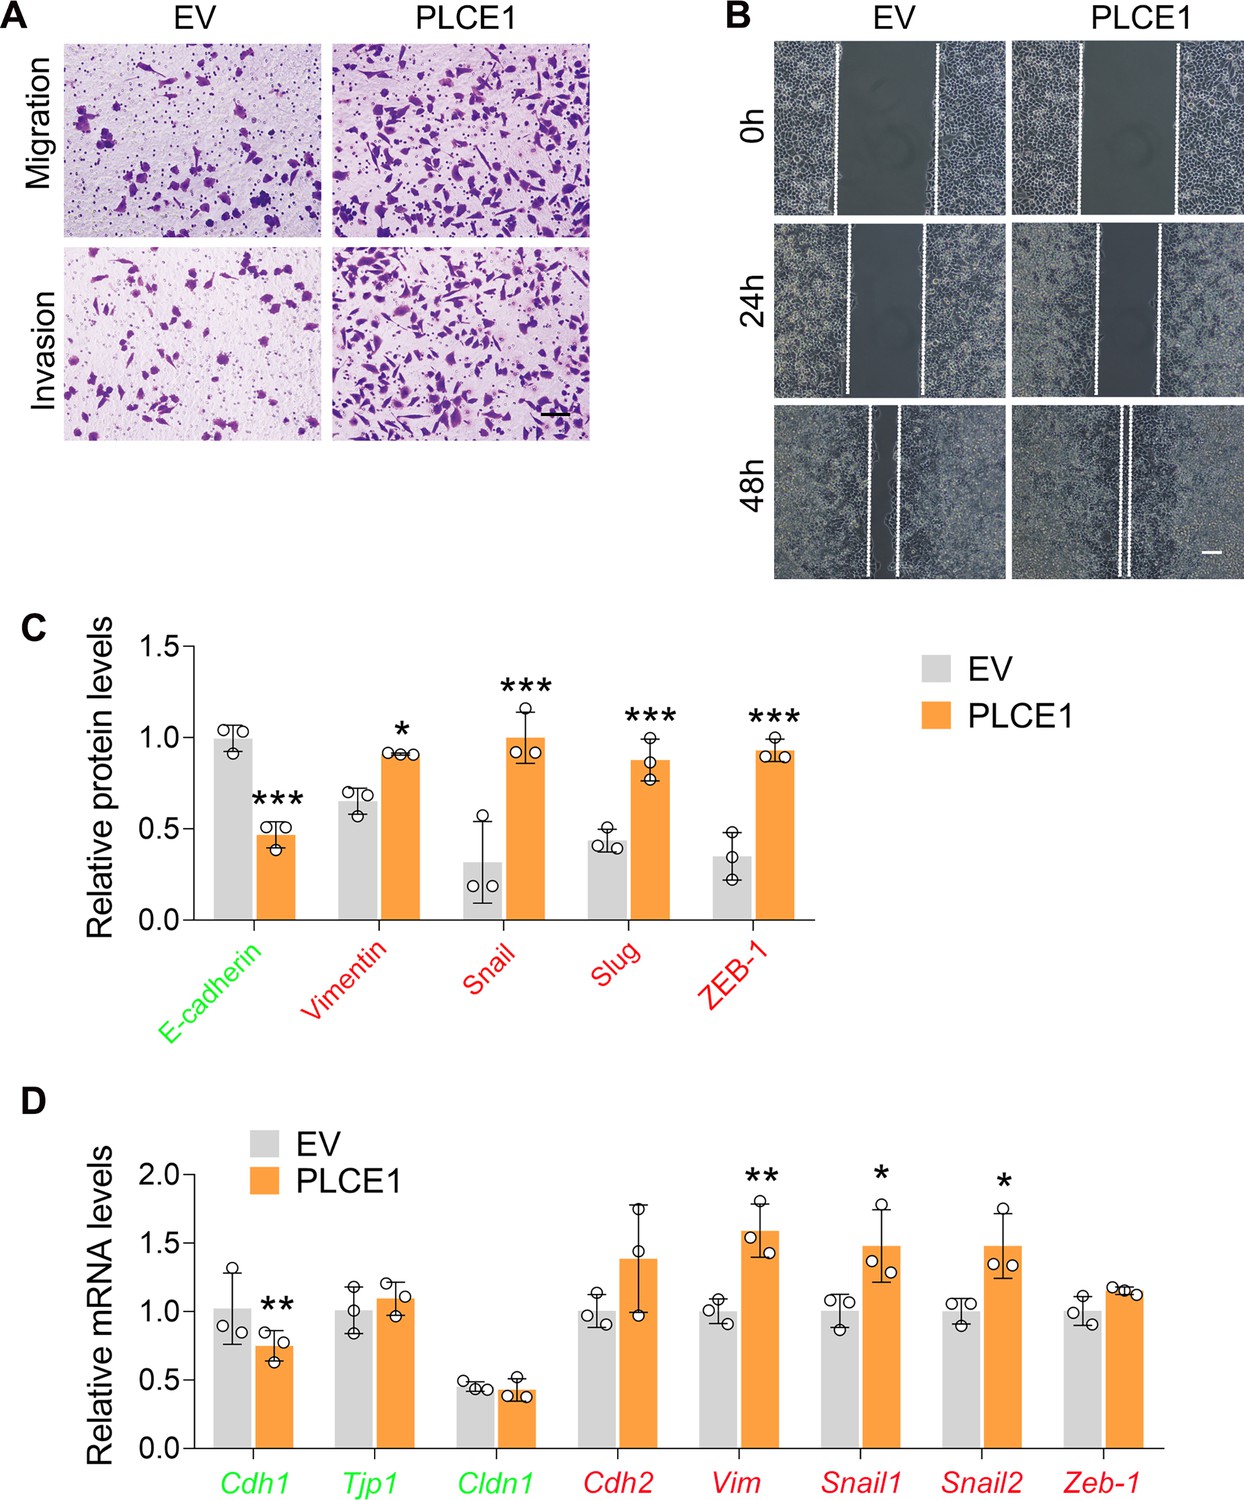
PLCE1 promotes cell migration and invasion in ECA-109 cells.
(A–B) PLCE1 enhances cell migration and invasion in ECA-109 cells (A, transwell assay, scale bar = 500 µm; B, wound healing assay, scale bar = 100 µm). (C) Quantitative analysis of the western blot data as shown in Figure 3D. (D) PLCE1 increased expression of endogenous mesenchymal markers in ECA-109 cells, while decreased the expression of epithelial markers. Gene expression was analyzed by quantitative real time-PCR (qRT-PCR). Gapdh was used as a house-keeping gene. EV: empty vector. Data are presented as mean ± SD (error bars). Statistical significance was tested by unpaired Student’s t-test. n=3 biologically independent replicates. *p<0.05, **p<0.01, and ***p<0.001 vs EV.
-
Figure 3—figure supplement 1—source data 1
PLCE1 promotes cell migration and invasion in ECA-109 cells.
- https://cdn.elifesciences.org/articles/97373/elife-97373-fig3-figsupp1-data1-v1.xlsx
Figure 3—figure supplement 2
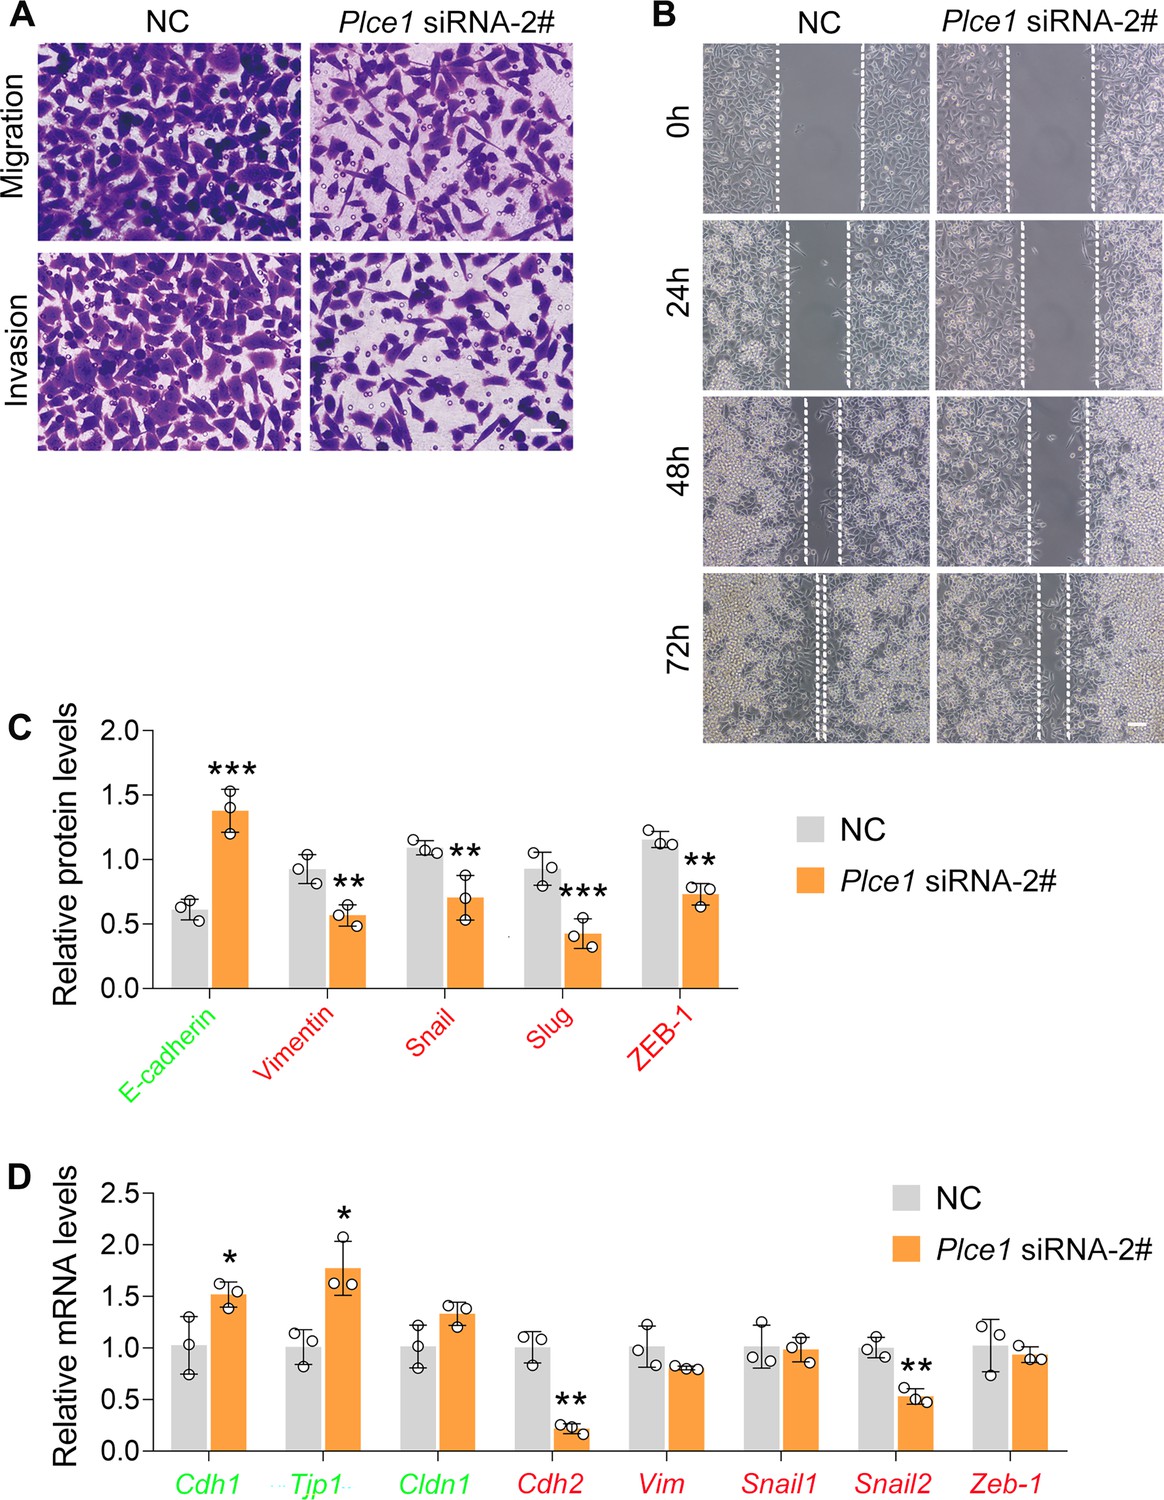
PLCE1 silencing inhibits cell migration and invasion in ECA-109 cells.
(A–B) Reduced expression of PLCE1 inhibits cell migration and invasion in ECA-109 cells. Cell migration and invasion were analyzed by transwell (A) or wound healing assay (B). Scale bar = 50 µm (A) or 100 µm (B). (C) The quantified data of western blots as shown in Figure 3I. (D) Reduced expression of PLCE1 decreased endogenous mesenchymal marker gene expression in ECA-109 cells, while increased epithelial marker gene expression. Gene expression was assayed by quantitative real time-PCR (qRT-PCR), and Gapdh was used as a house-keeping gene. NC: negative control. Data are presented as mean ± SD (error bars). n=3 biologically independent replicates. Statistical significance was tested by unpaired Student’s t-test. *p<0.05, **p<0.01, and ***p<0.001 vs NC.
-
Figure 3—figure supplement 2—source data 1
PLCE1 silencing inhibits cell migration and invasion in ECA-109 cells.
- https://cdn.elifesciences.org/articles/97373/elife-97373-fig3-figsupp2-data1-v1.xlsx
Figure 3—figure supplement 3
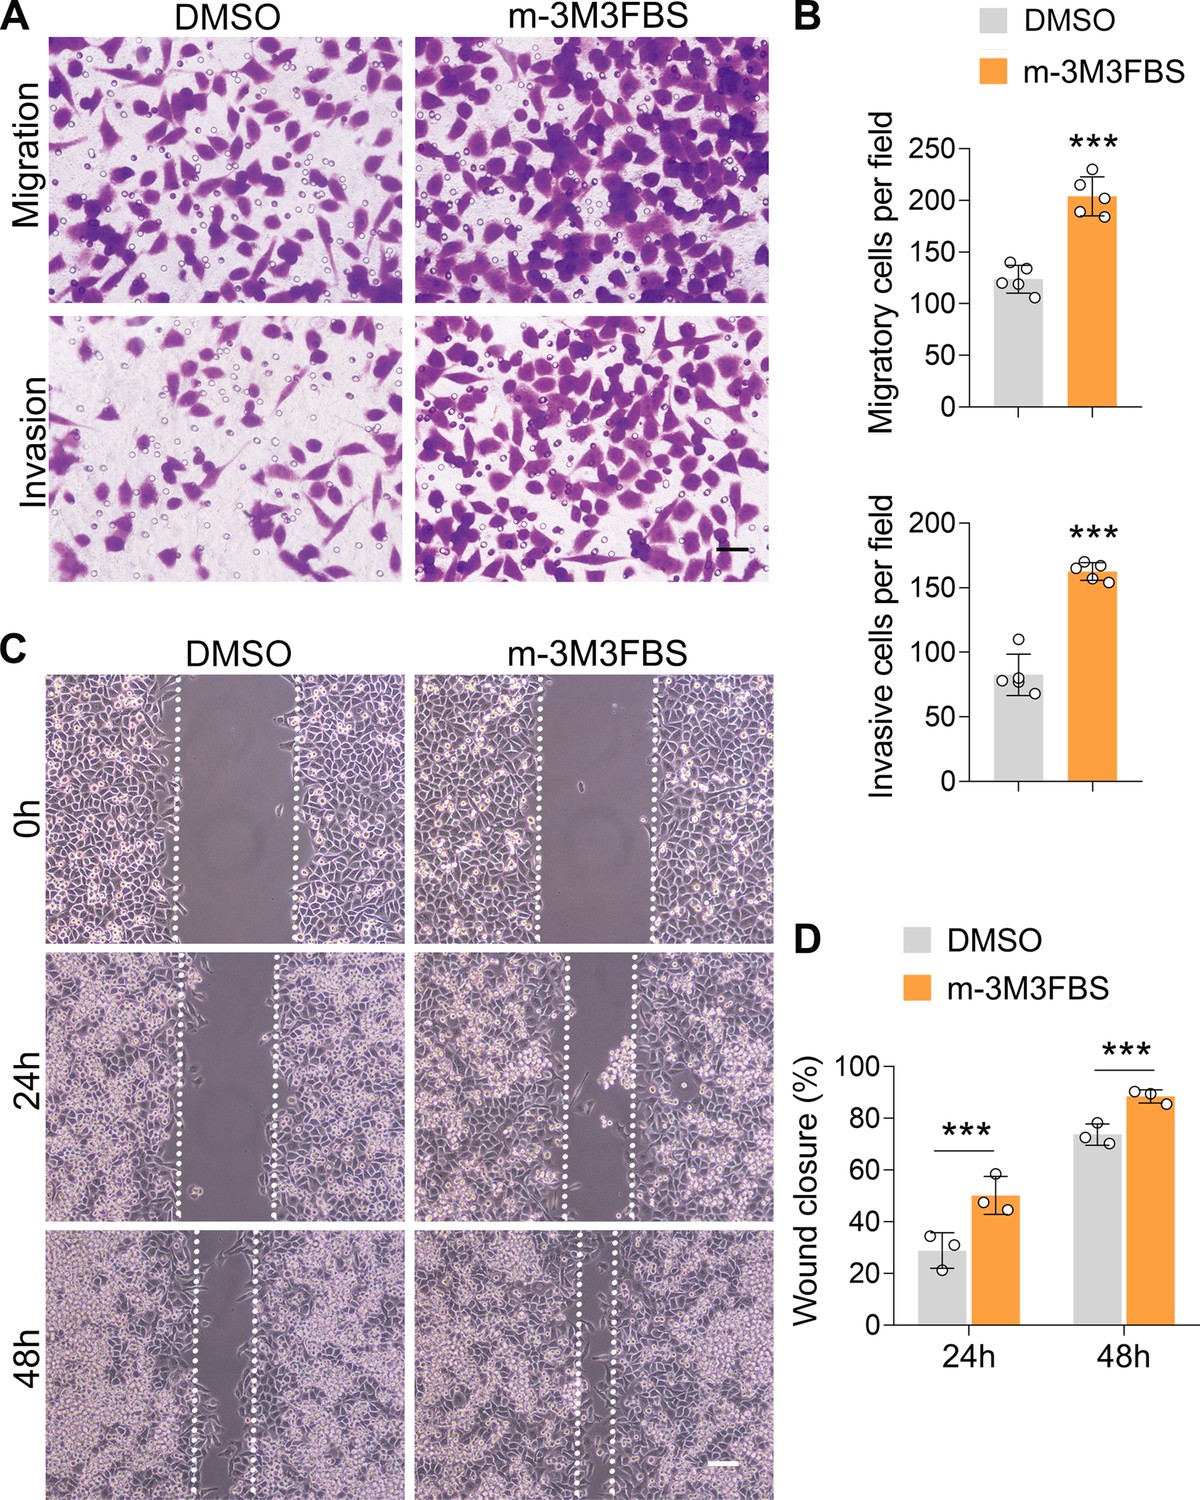
Activation of PLCE1 stimulates cell migration and invasion in ECA-109 cells.
Cells were treated with 1 µM of m-3M3FBS for 24 hr. (A–D) Activation of PLCE1 by m-3M3FBS promotes cell migration and invasion (A–B, transwell assay, scale bar = 50 µm, n=5 biologically independent replicates; C–D, wound healing assay, scale bar = 100 µm, n=3 biologically independent replicates). Data are presented as mean ± SD. Statistical significance was tested by unpaired Student’s t-test. ***p<0.001.
-
Figure 3—figure supplement 3—source data 1
Activation of PLCE1 stimulates cell migration and invasion in ECA-109 cells.
- https://cdn.elifesciences.org/articles/97373/elife-97373-fig3-figsupp3-data1-v1.xlsx
Figure 3—figure supplement 4
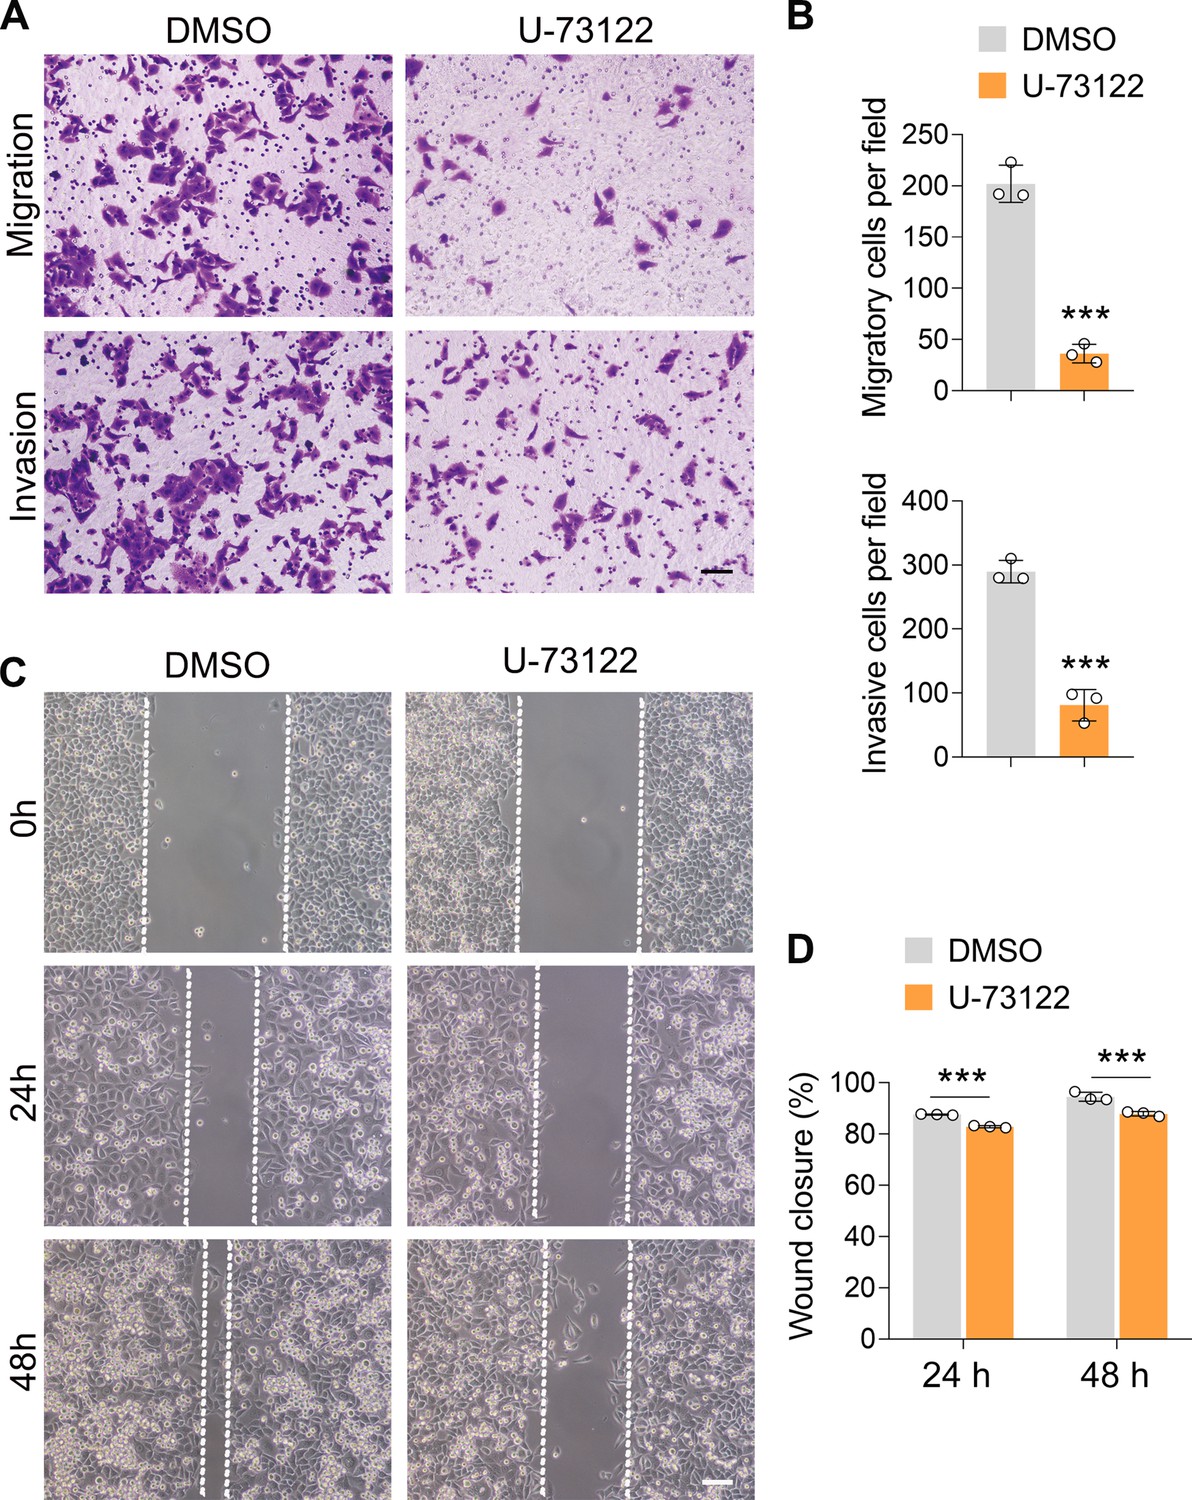
Inhibition of PLCE1 reduces cell migration and invasion in ECA-109 cells.
Cells were treated with 10 µM of U-73122 for 24 hr. (A–D) Inhibition of PLCE1 attenuates cell migration and invasion in ECA-109 cells (A–B, transwell assay, scale bar = 500 µm; C–D, wound healing assay, scale bar = 100 µm). n=3 biologically independent replicates. Data are presented as mean ± SD. Statistical significance was tested by unpaired Student’s t-test. ***p<0.001 vs DMSO.
-
Figure 3—figure supplement 4—source data 1
Inhibition of PLCE1 reduces cell migration and invasion in ECA-109 cells.
- https://cdn.elifesciences.org/articles/97373/elife-97373-fig3-figsupp4-data1-v1.xlsx
Figure 4 with 2 supplements
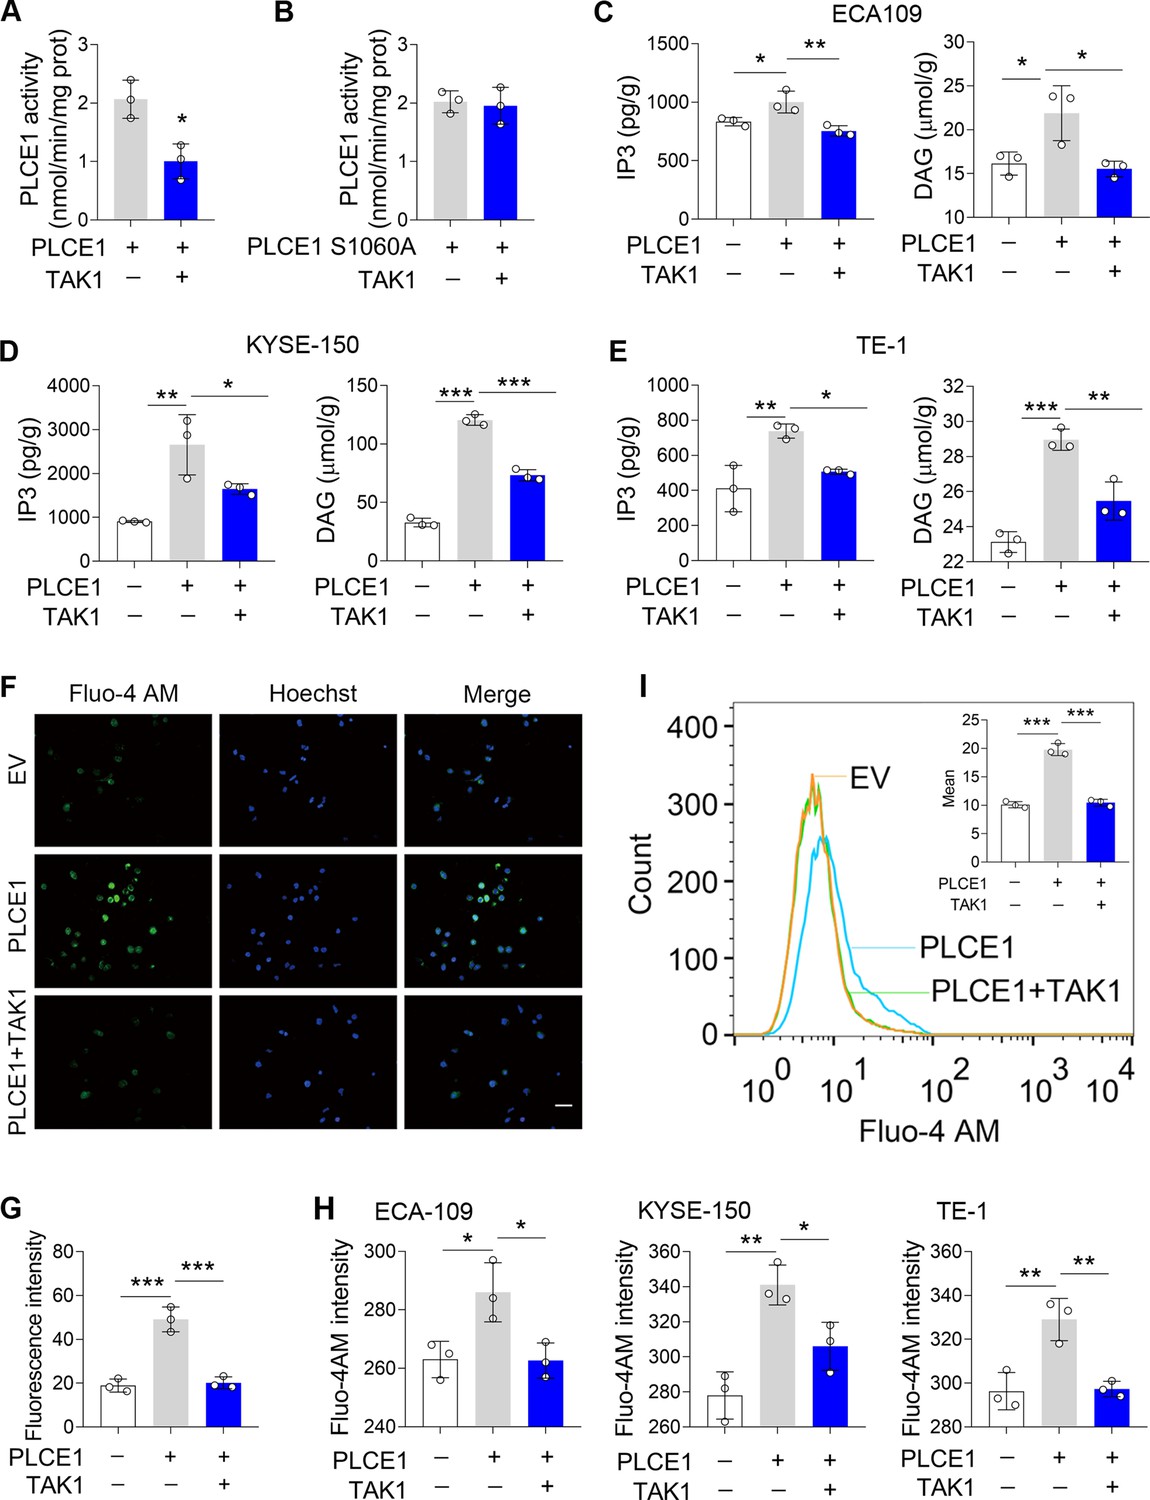
TAK1 inhibits PLCE1 enzyme activity.
(A–B) Effects of TAK1 on PLCE1 (A) and PLCE1 S1060A (B) enzyme activity. ECA-109 cells were co-transfected with the plasmids expressing Plce1-Myc or Map3k7. 24 hr post-transfection, cells were subjected to pull-down assay by using the beads with anti-Myc antibody. PLCE1 enzyme activity was assayed by Phospholipases C (PLC) Activity Assay Kit. n=3 biologically independent replicates. (C–E) TAK1 abolishes PLCE1-induced inositol 1,4,5-trisphosphate (IP3) and diacylglycerol (DAG) in ECA-109 (C), KYSE-150 (D), and TE-1 cells (E). Cells were transfected with the plasmids bearing Plce1 or Map3k7 as indicated. 24 hr post-transfection, cells were harvested for measuring IP3 and DAG. n=3 biologically independent replicates. (F) TAK1 attenuates PLCE1-induced intracellular Ca2+ ([Ca2+]). ECA-109 cells were transfected with the plasmids bearing Plce1 or Map3k7 as indicated. [Ca2+] was labeled with Fluo-4 AM, which was then detected by a fluorescent microscope. Scale bar = 20 µm. (G) Quantified fluorescence intensity of [Ca2+] in ECA-109 cells. n=3 biologically independent replicates. (H) Fluorescence intensity of Fluo-4 in ECA-109, KYSE-150, and TE-1 cells was examined with a fluorospectrophotometer. n=3 biologically independent replicates. (I) Flow cytometry analysis of [Ca2+]. Cell treatments were described in (F). Data are presented as mean ± SD. Statistical significance was tested by unpaired Student’s t-test (A–B) or two-tailed one-way ANOVA test (C–E, G–I). *p<0.05, **p<0.01, and ***p<0.001.
-
Figure 4—source data 1
TAK1 inhibits PLCE1 enzyme activity.
- https://cdn.elifesciences.org/articles/97373/elife-97373-fig4-data1-v1.xlsx
Figure 4—figure supplement 1
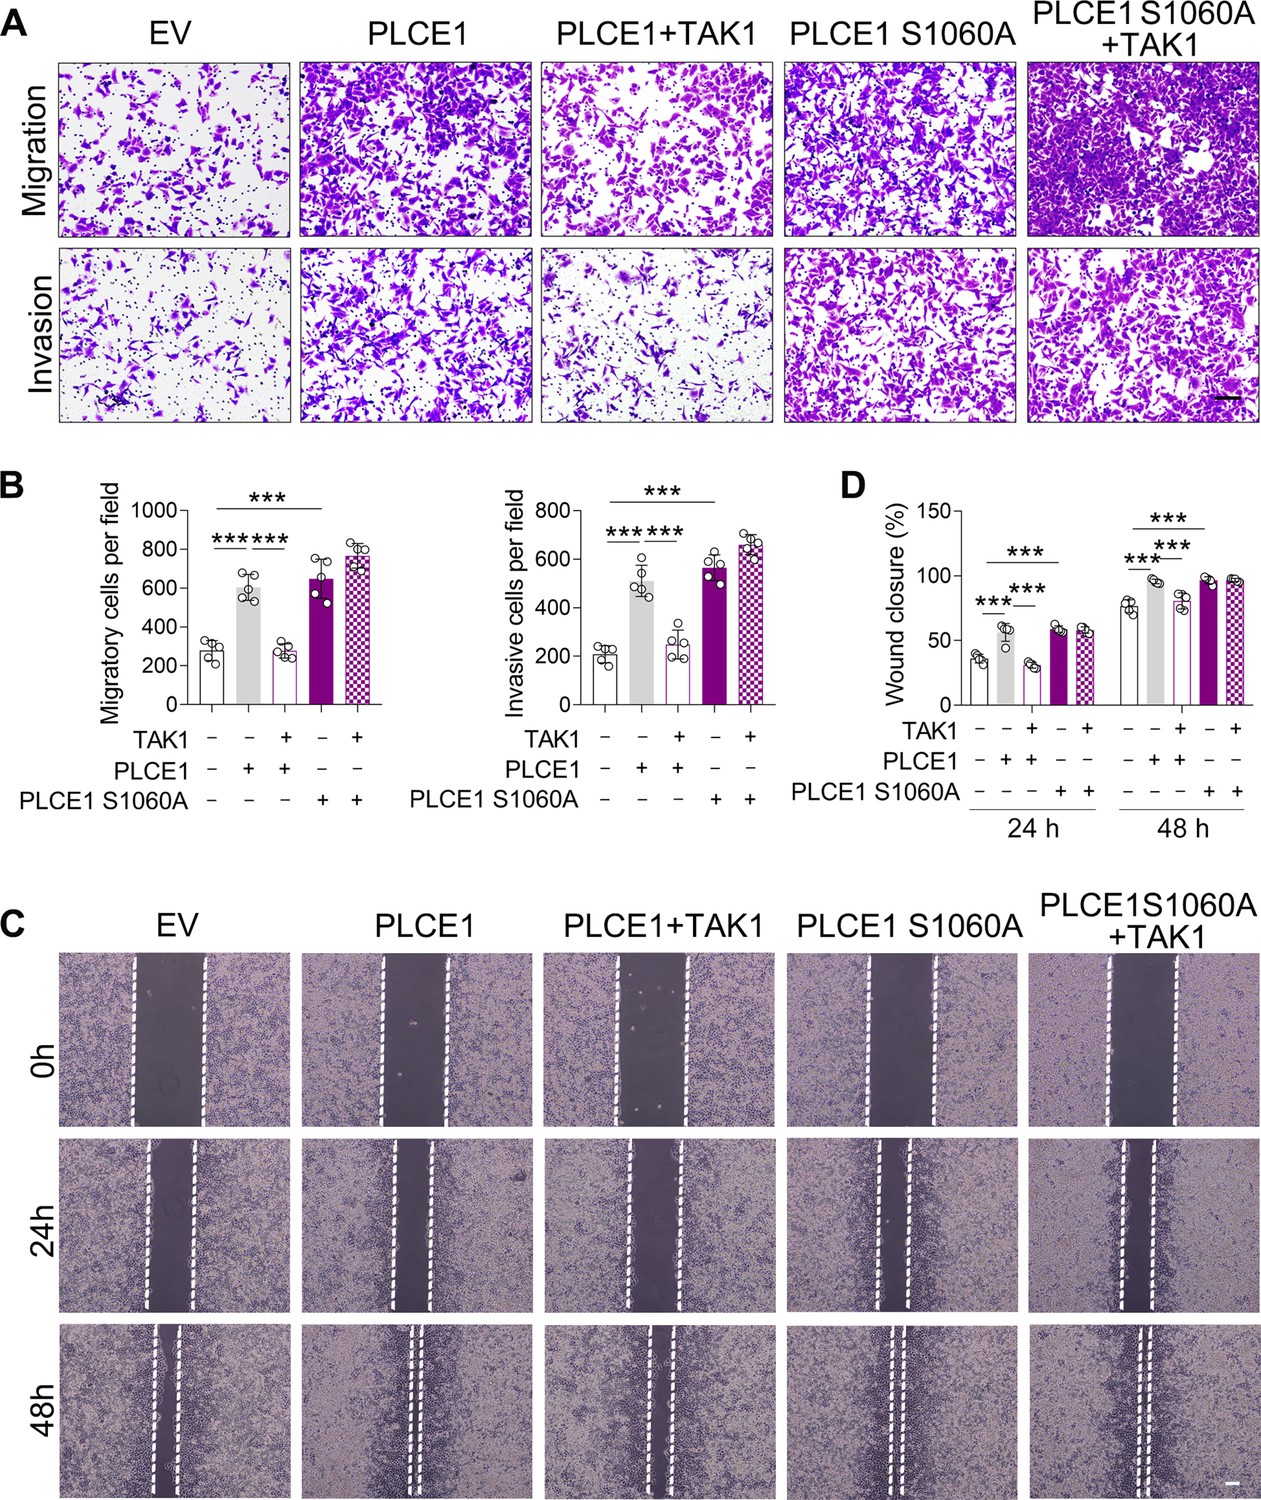
The negative impact of TAK1 on PLCE1-induced cell migration and invasion requires TAK1 kinase activity.
ECA-109 cells were transfected with plasmids expressing Plce1, mutated Plce1 (S1060A), or Map3k7 as indicated. 36 hr post-transfection, cell migration and invasion were assayed by transwell assay (A–B) and wound healing assay (C–D). n=5 biologically independent replicates. Scale bar = 500 µm (A); scale bar = 100 µm (C). Data are presented as mean ± SD. Statistical significance was tested by two-tailed one-way ANOVA test. ***p<0.001.
-
Figure 4—figure supplement 1—source data 1
The negative impact of TAK1 on PLCE1-induced cell migration and invasion requires TAK1 kinase activity.
- https://cdn.elifesciences.org/articles/97373/elife-97373-fig4-figsupp1-data1-v1.xlsx
Figure 4—figure supplement 2
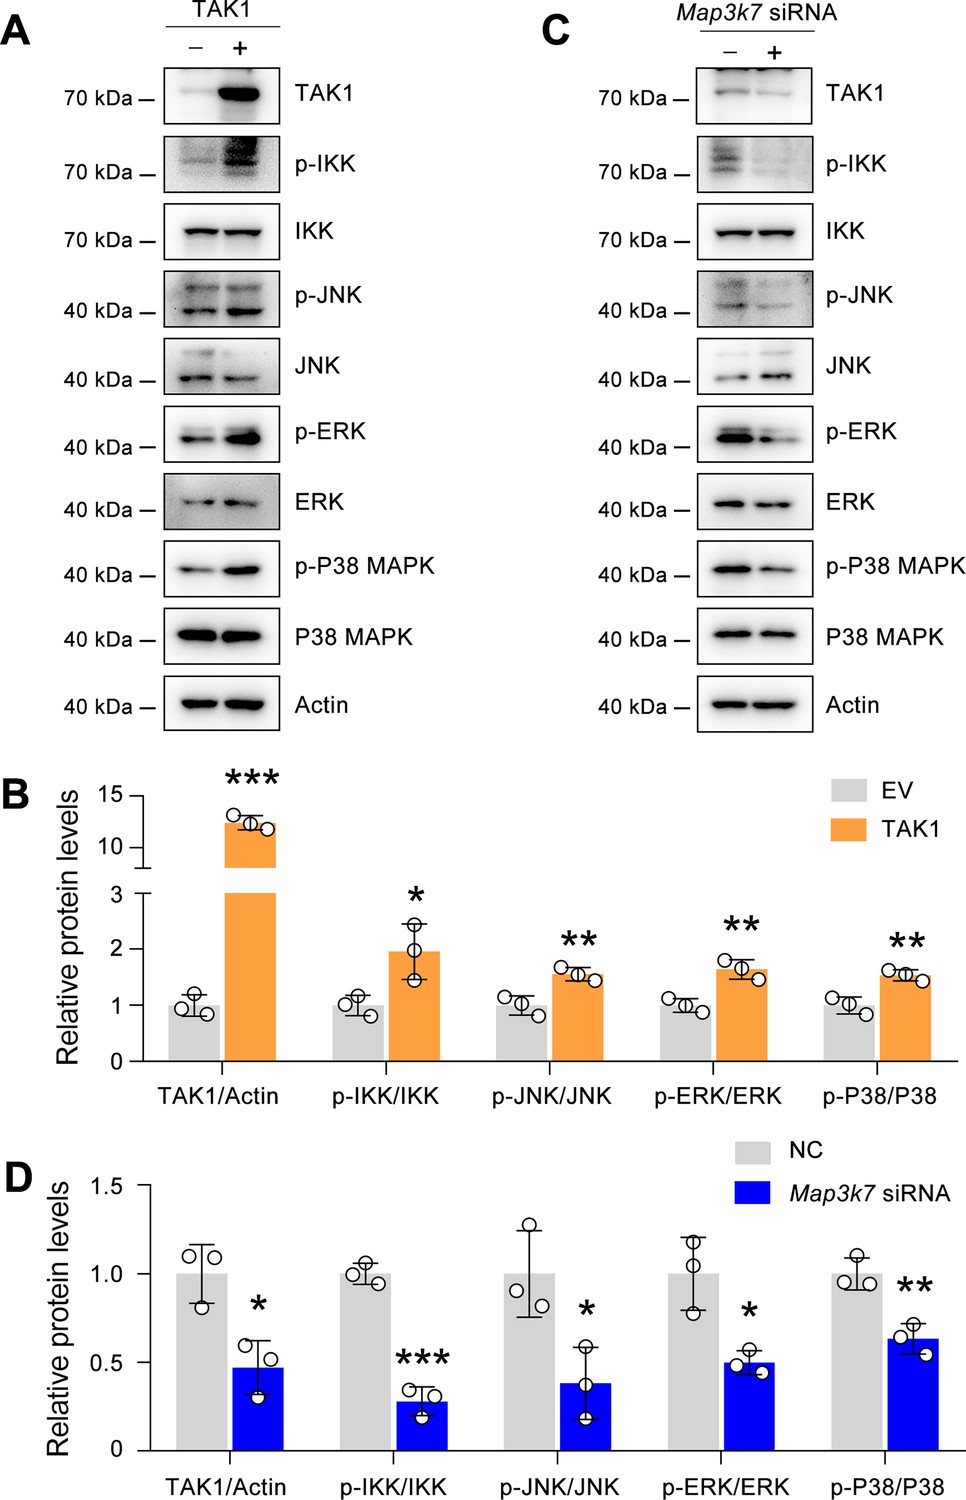
Effects of TAK1 on p-IKK, p-JNK, p-ERK, and p-P38 MAPK in ECA-109 cells.
(A) TAK1 overexpression activates p-IKK, p-JNK, p-ERK, p-P38 MAPK. ECA-109 cells were transfected with a plasmid expressing TAK1. 24 hr post-transfection, cells were collected for western blot analysis. (B) Quantification data for the blots in (A). (C) TAK1 knockdown represses p-IKK, p-JNK, p-ERK, p-P38 MAPK. ECA-109 cells were transfected with Map3k7 siRNA. 48 hr post-transfection, cells were harvested for western blot analysis. (D) Quantification data for the blots in (C). EV: empty vector; NC: negative control. Actin was used a loading control. *p<0.05, **p<0.01, and ***p<0.001, by unpaired Student’s t-test.
-
Figure 4—figure supplement 2—source data 1
Effects of TAK1 on p-IKK, p-JNK, p-ERK, and p-P38 MAPK in ECA-109 cells.
- https://cdn.elifesciences.org/articles/97373/elife-97373-fig4-figsupp2-data1-v1.xlsx
-
Figure 4—figure supplement 2—source data 2
PDF file containing original western blots for Figure 4—figure supplement 2A and C, indicating the relevant bands.
- https://cdn.elifesciences.org/articles/97373/elife-97373-fig4-figsupp2-data2-v1.zip
-
Figure 4—figure supplement 2—source data 3
Original files for western blot analysis displayed in Figure 4—figure supplement 2A and C.
- https://cdn.elifesciences.org/articles/97373/elife-97373-fig4-figsupp2-data3-v1.zip
Figure 5 with 7 supplements

TAK1 inhibits PLCE1-induced signal transduction in the axis of PKC/GSK-3β/β-Catenin.
(A) IP3R blocking inhibits PLCE1-induced signal transduction in the axis of PKC/GSK-3β/β-Catenin. ECA-109 cells were transfected with the plasmid expressing Plce1 for 6 hr and then treated with 2-APB (10 µM) for additional 18 hr. (B) [Ca2+] blocking represses signal transduction in the axis of PKC/GSK-3β/β-Catenin induced by PLCE1. ECA-109 cells were transfected with the plasmid expressing Plce1 for 6 hr and then treated with BAPTA-AM (10 µM) for additional 18 hr. (C) PKC inhibition blocks PLCE1 stimulated signal transduction in the axis of PKC/GSK-3β/β-Catenin. ECA-109 cells were transfected with the plasmid expressing Plce1. 6 hr post-transfection, cells were treated with 100 nM of Midostaurin for additional 18 hr. (D) PKC inhibition represses PLCE1-induced nuclear translocation of β-Catenin in ECA-109 cells. Cells were transfected with the plasmid expressing PLCE1. 6 hr post-transfection, 2-APB (10 µM), BAPTA-AM (10 µM), or Midostaurin (100 nM) was added in culture medium, and cells were cultured for additional 18 hr. Scale bar = 10 µm. Immunofluorescence was used to examine subcellular distribution of β-Catenin. (E) TAK1 counteracts PLCE1-induced signal transduction in the axis of PKC/GSK-3β/β-Catenin. ECA-109 cells were transfected with the plasmids expressing Plce1 or Map3k7 as indicated for 24 hr. (F) TAK1 reduces PLCE1-induced nuclear distribution of β-Catenin in ECA-109 cells. Cells were transfected with the plasmids expressing Plce1 or Map3k7 as indicated. Scale bar = 10 µm. (G) Dominant negative TAK1 (K63W) fails to block signal transduction in the axis of PKC/GSK-3β/β-Catenin/MMP2 induced by PLCE1. ECA-109 cells were transfected with the plasmids expressing Plce1 or mutated Map3k7 (TAK1 K63W) for 24 hr. (H) TAK1 has no effect on PLCE1 S1060A-induced signal transduction in the axis of PKC/GSK-3β/β-Catenin. ECA-109 cells were transfected with the plasmids expressing PLCE1 S1060A or TAK1 for 24 hr. Protein levels were analyzed by western blot, and Actin was used as a loading control. Representative blots were shown.
-
Figure 5—source data 1
PDF file containing original western blots for Figure 5A, B, C, E, G, and H, indicating the relevant bands.
- https://cdn.elifesciences.org/articles/97373/elife-97373-fig5-data1-v1.zip
-
Figure 5—source data 2
Original files for western blot analysis displayed in Figure 5A, B, C, E,G, and H.
- https://cdn.elifesciences.org/articles/97373/elife-97373-fig5-data2-v1.zip
Figure 5—figure supplement 1
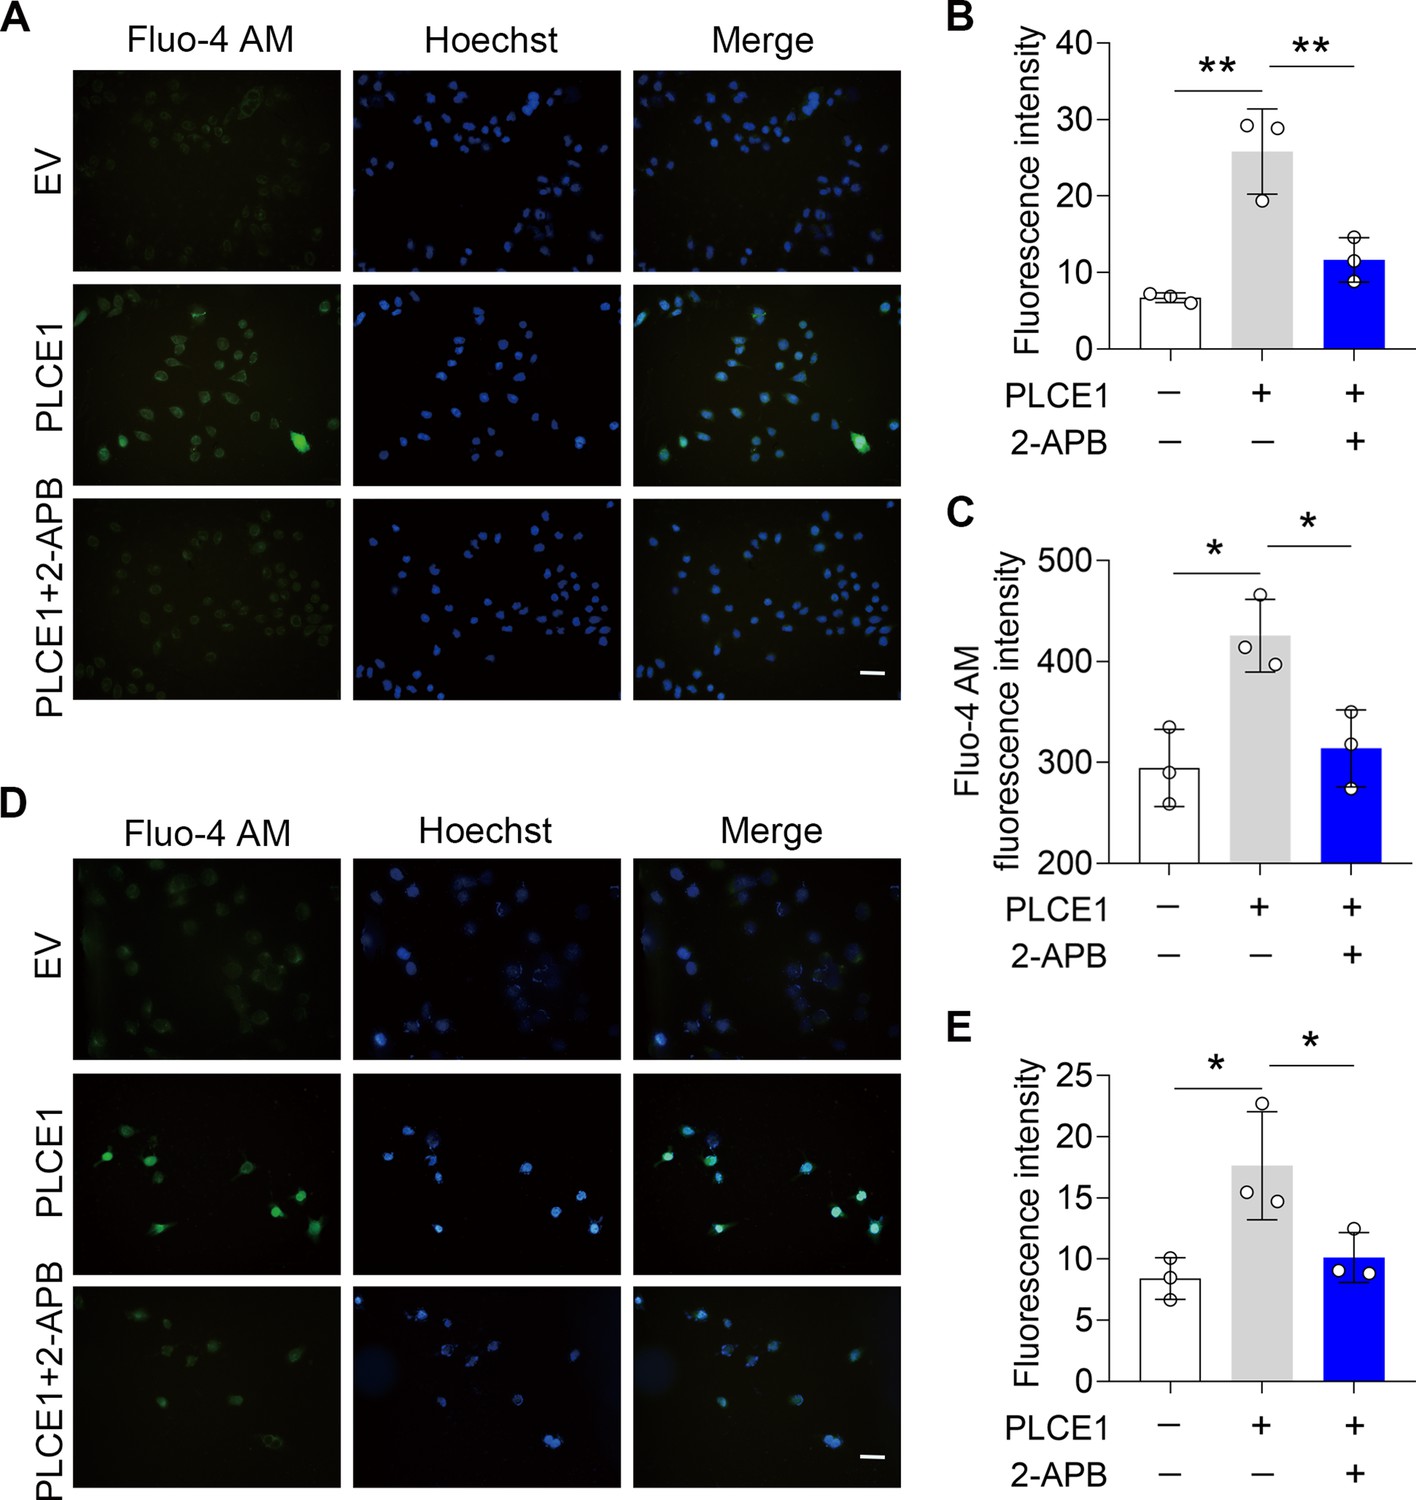
IP3R blockade inhibits PLCE1-induced intracellular calcium accumulation.
ECA-109 and KYSE-150 cells were transfected with a plasmid expressing Plce1 for 6 hr and then treated with 2-APB (10 µM) for additional 18 hr. The intracellular calcium [Ca2+] was labeled with Fluo-4 AM. (A) Fluorescent imaging of the [Ca2+] in ECA-109 cells. Scale bar = 20 µm. (B) Quantitative analysis of Fluo-4 AM fluorescence intensity as shown in (A). (C) Fluorescence intensity of Fluo-4 in ECA-109 cells was examined under an absorbance photometer. n=3 biologically independent replicates. (D) Fluorescent imaging of the [Ca2+] in KYSE-150 cells. Scale bar = 20 µm. (E) Quantitative analysis of Fluo-4 AM fluorescence intensity in KYSE-150 cells as shown in (D). Data are presented as mean ± SD. Statistical significance was tested by two-tailed one-way ANOVA test. *p<0.05 and **p<0.01.
-
Figure 5—figure supplement 1—source data 1
IP3R blockade inhibits PLCE1-induced intracellular calcium accumulation.
- https://cdn.elifesciences.org/articles/97373/elife-97373-fig5-figsupp1-data1-v1.xlsx
Figure 5—figure supplement 2
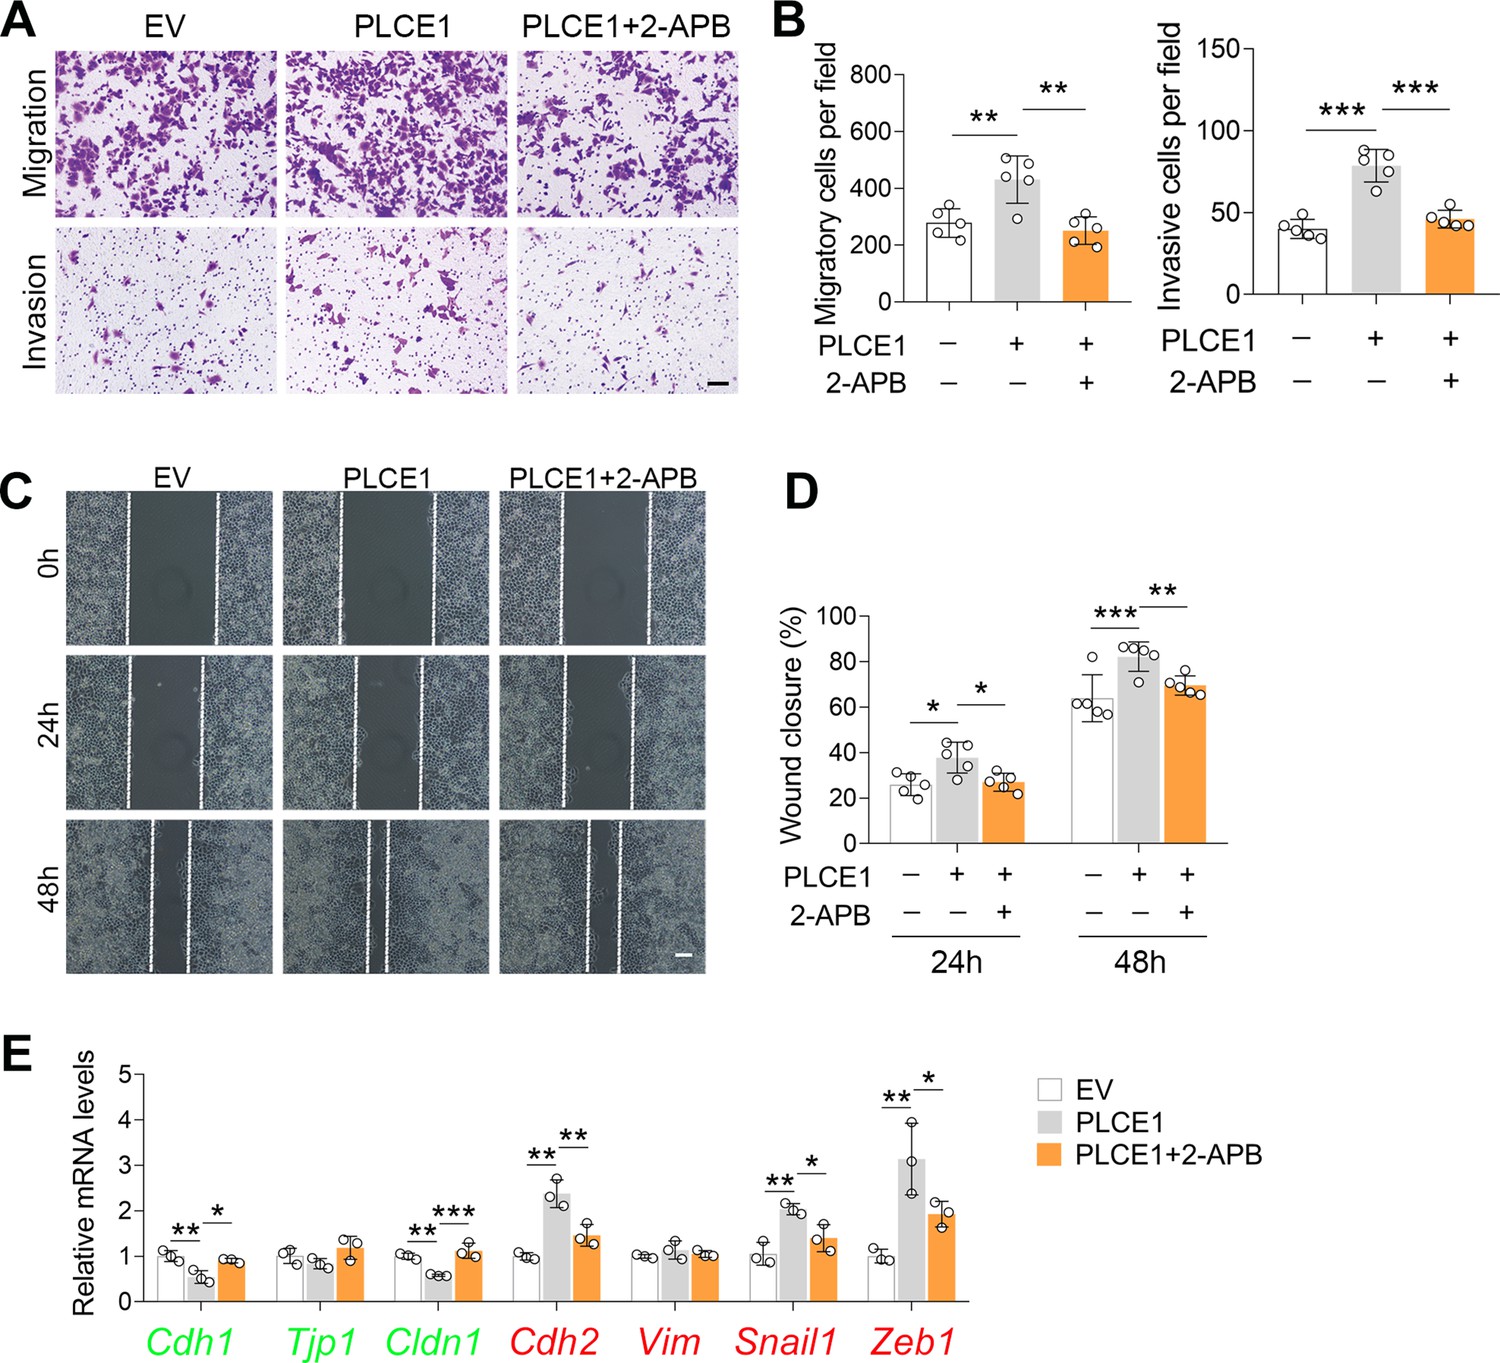
2-APB treatment counteracts PLCE1-induced cell migration.
(A–D) IP3R blocking inhibits PLCE1 promoted cell migration and invasion. ECA-109 cells were transfected with the plasmid expressing Plce1 for 6 hr and then cells were treated with 2-APB (10 µM) for additional 18 hr. Cell migration and invasion were analyzed by transwell (A, B) or wound healing (C, D) assay. n=5 biologically independent replicates. Scale bar = 500 µm (A) and 100 µm (C). (E) IP3R blocking counteracts PLCE1-induced changes in epithelial-mesenchymal transition (EMT) gene expression. The levels of mRNA were analyzed by quantitative real time-PCR (qRT-PCR), and Gapdh was used as a house-keeping gene. n=3 biologically independent replicates. Data are presented as mean ± SD. Statistical significance was tested by two-tailed one-way ANOVA test. *p<0.05, **p<0.01, and ***p<0.001.
-
Figure 5—figure supplement 2—source data 1
2-APB treatment counteracts PLCE1-induced cell migration.
- https://cdn.elifesciences.org/articles/97373/elife-97373-fig5-figsupp2-data1-v1.xlsx
Figure 5—figure supplement 3
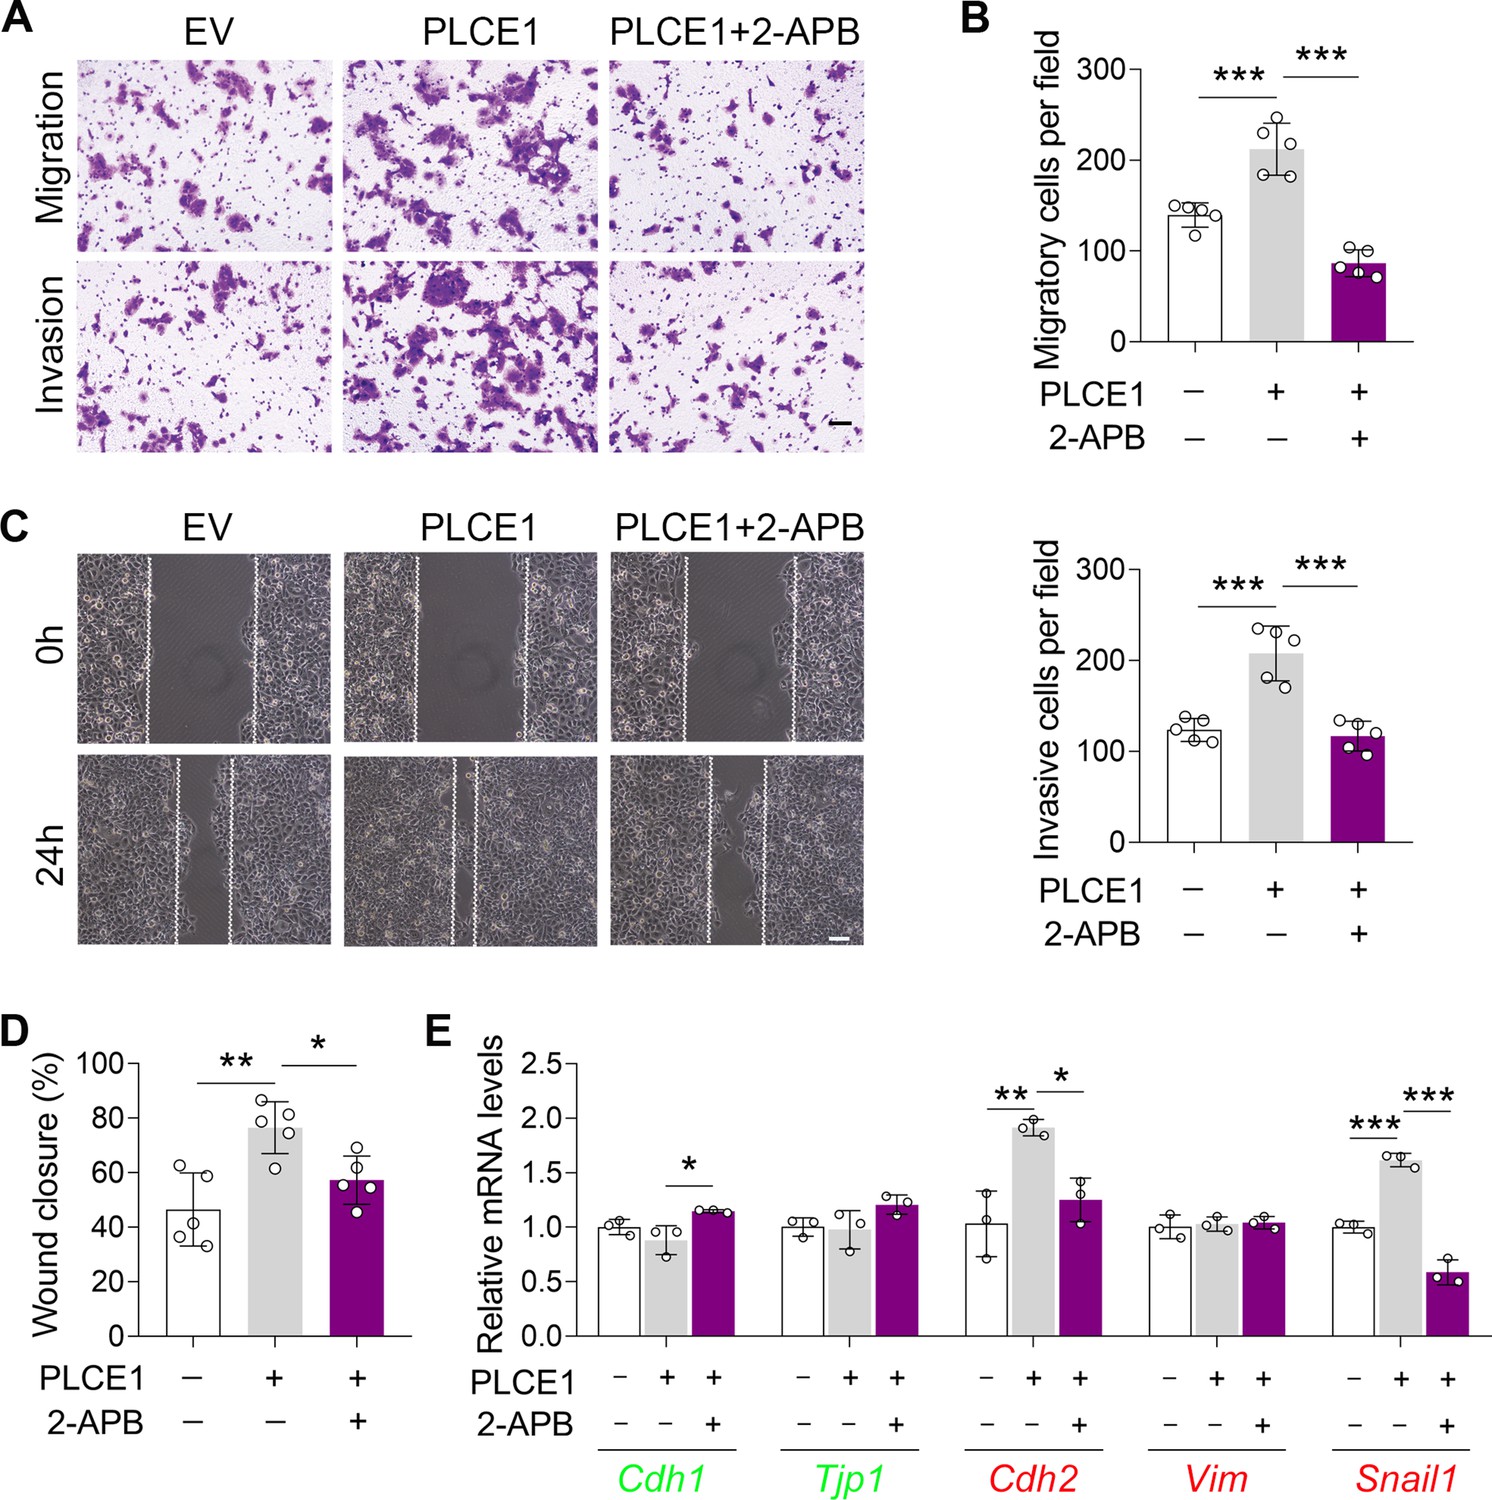
IP3R inhibition represses PLCE1-stimulated cell migration and invasion in KYSE-150 cells.
Cells were transfected with plasmid expressing Plce1 for 6 hr and then treated with 2-APB (10 µM) for additional 18 hr. (A–B) Transwell assay showing the application of 2-APB attenuates cell migration and invasion induced by PLCE1. Scale bar = 500 µm. n=5 biologically independent replicates. (C–D) Wound healing assay showing the treatment of 2-APB represses cell migration induced by PLCE1. Scale bar = 100 µm. n=5 biologically independent replicates. (E) 2-APB counteracts PLCE1-induced changes in epithelial-mesenchymal transition (EMT) gene expression. The mRNA levels were detected by quantitative real time-PCR (qRT-PCR), and Gapdh was used as a house-keeping gene. n=3 biologically independent replicates. Data are presented as mean ± SD. Statistical significance was tested by two-tailed one-way ANOVA test. *p<0.05, **p<0.01, and ***p<0.001.
-
Figure 5—figure supplement 3—source data 1
IP3R inhibition represses PLCE1-stimulated cell migration and invasion in KYSE-150 cells.
- https://cdn.elifesciences.org/articles/97373/elife-97373-fig5-figsupp3-data1-v1.xlsx
Figure 5—figure supplement 4
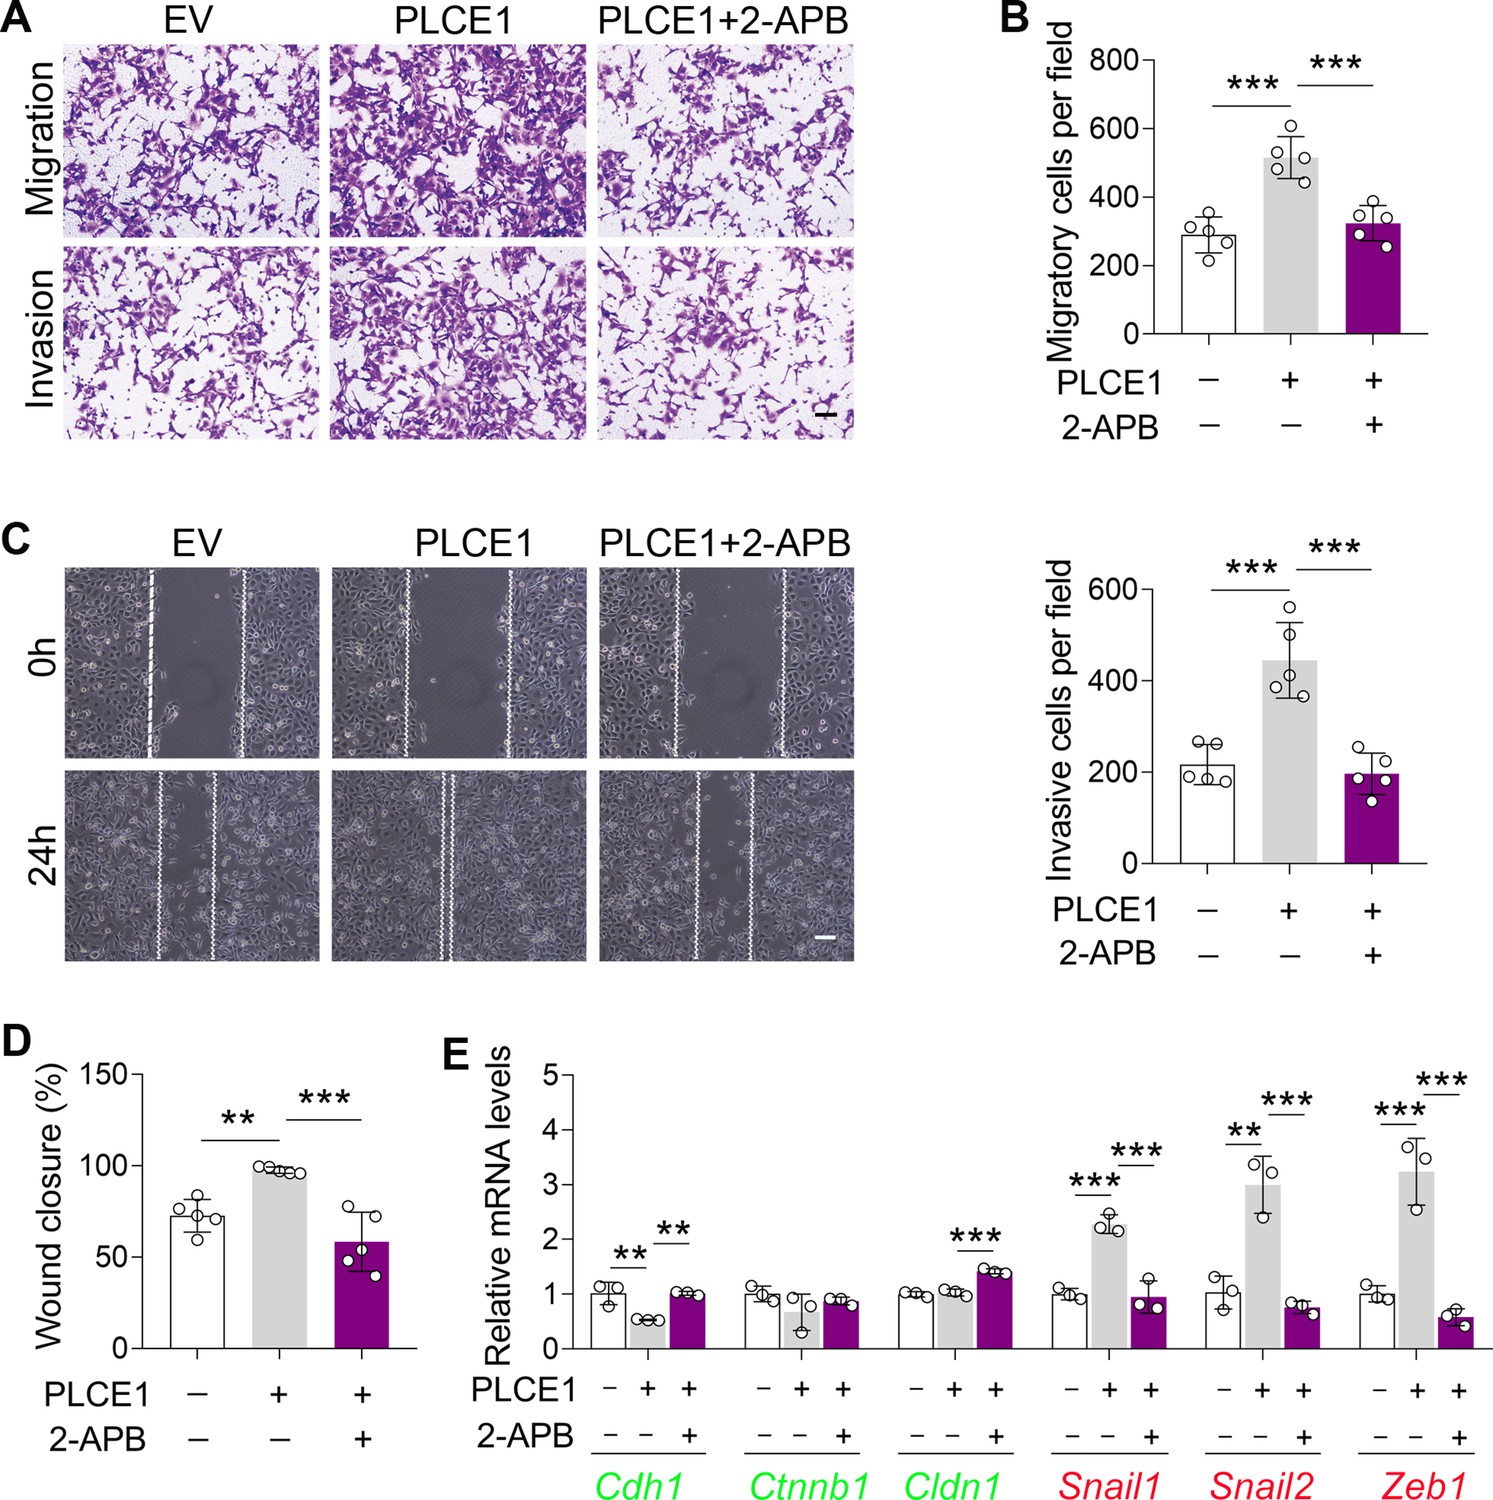
IP3R inhibition reduces PLCE1-stimulated cell migration and invasion in TE-1 cells.
Cells were transfected with plasmid expressing Plce1 for 6 hr and then treated with 2-APB (10 µM) for additional 18 hr. (A–D) Cell migration and invasion induced by PLCE1 were repressed by the application of 2-APB in TE-1 cells. Cell migration and invasion were analyzed by transwell assay (A–B, scale bar = 500 µm) and wound healing assay (C–D, scale bar = 100 µm). n=5 biologically independent replicates. (E) 2-APB abolishes PLCE1-induced changes in epithelial-mesenchymal transition (EMT) gene expression in TE-1 cells. Gene expression was analyzed by quantitative real time-PCR (qRT-PCR), and Gapdh was used as a house-keeping gene. n=3 biologically independent replicates. Data are presented as mean ± SD. Statistical significance was tested by two-tailed one-way ANOVA test. **p<0.01 and ***p<0.001.
-
Figure 5—figure supplement 4—source data 1
IP3R inhibition reduces PLCE1-stimulated cell migration and invasion in TE-1 cells.
- https://cdn.elifesciences.org/articles/97373/elife-97373-fig5-figsupp4-data1-v1.xlsx
Figure 5—figure supplement 5
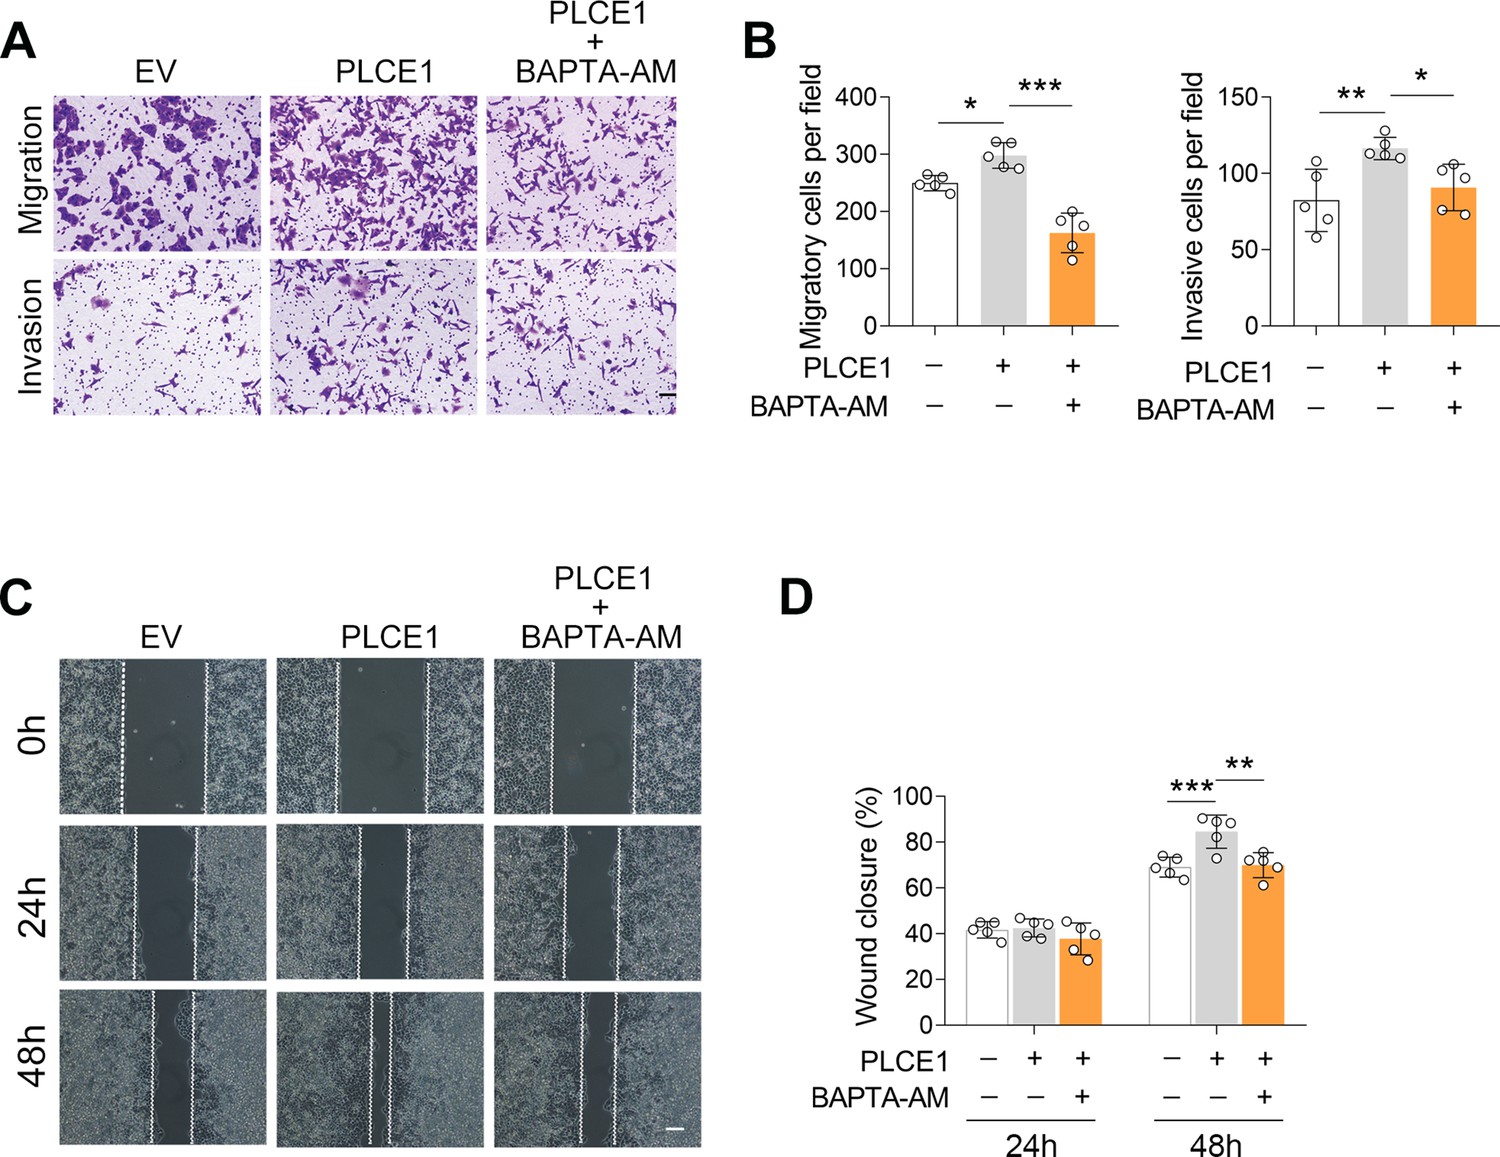
[Ca2+] blockade inhibits PLCE1-induced cell migration and invasion in ECA-109 cells.
(A–D) [Ca2+] blocking inhibits PLCE1 promoted cell migration and invasion. ECA-109 cells were transfected with the plasmid expressing Plce1 for 6 hr and then treated with BAPTA-AM (10 µM) for additional 18 hr. Cell migration and invasion were tested by transwell (A, B) or wound healing (C, D) assay. n=5 biologically independent replicates. Scale bar = 500 µm (A) and 100 µm (C). Data are presented as mean ± SD. Statistical significance was tested by two-tailed one-way ANOVA test. **p<0.01 and ***p<0.001.
-
Figure 5—figure supplement 5—source data 1
[Ca2+] blockade inhibits PLCE1-induced cell migration and invasion in ECA-109 cells.
- https://cdn.elifesciences.org/articles/97373/elife-97373-fig5-figsupp5-data1-v1.xlsx
Figure 5—figure supplement 6
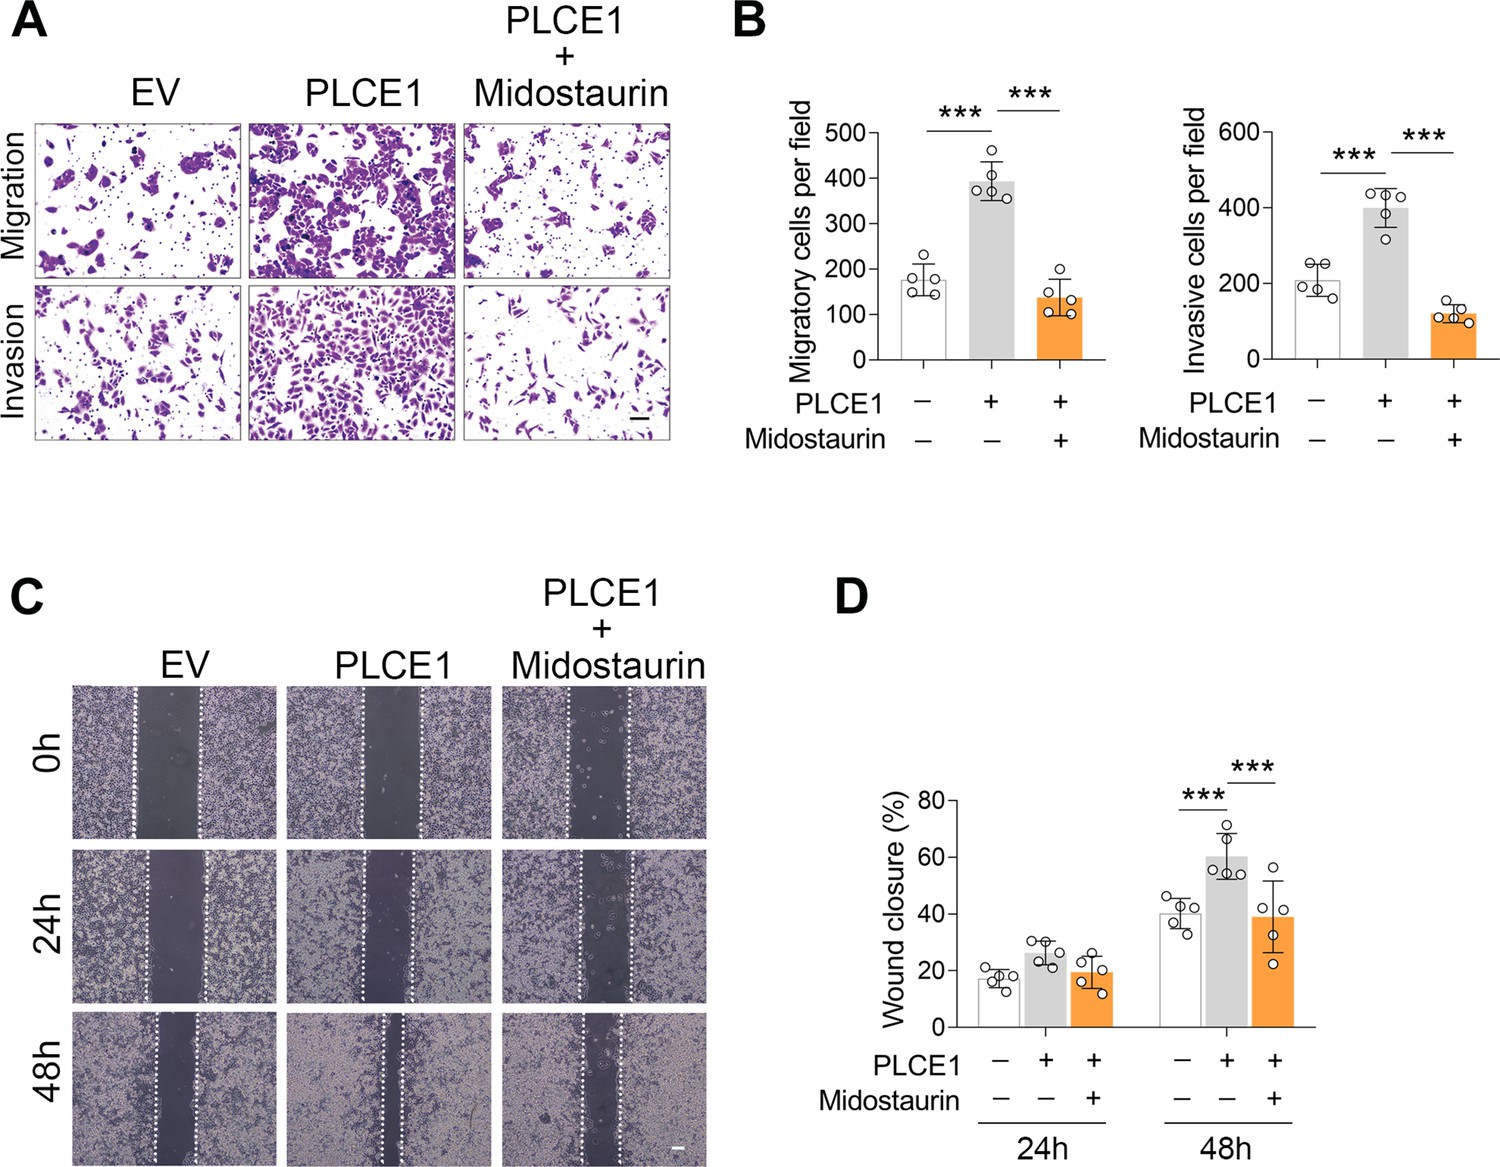
PKC inhibition counteracts PLCE1-induced cell migration and invasion.
(A–D) ECA-109 cells were transfected with the plasmid expressing Plce1 for 6 hr and then treated with Midostaurin (100 nM) for additional 18 hr. Cell migration and invasion were tested by transwell (A, B) or wound healing (C, D) assay. n=5 biologically independent replicates. Scale bar = 500 µm (A) and 100 µm (C). Data are presented as mean ± SD. Statistical significance was tested by two-tailed one-way ANOVA test. *p<0.05, **p<0.01, and ***p<0.001.
-
Figure 5—figure supplement 6—source data 1
PKC inhibition counteracts PLCE1-induced cell migration and invasion.
- https://cdn.elifesciences.org/articles/97373/elife-97373-fig5-figsupp6-data1-v1.xlsx
Figure 5—figure supplement 7
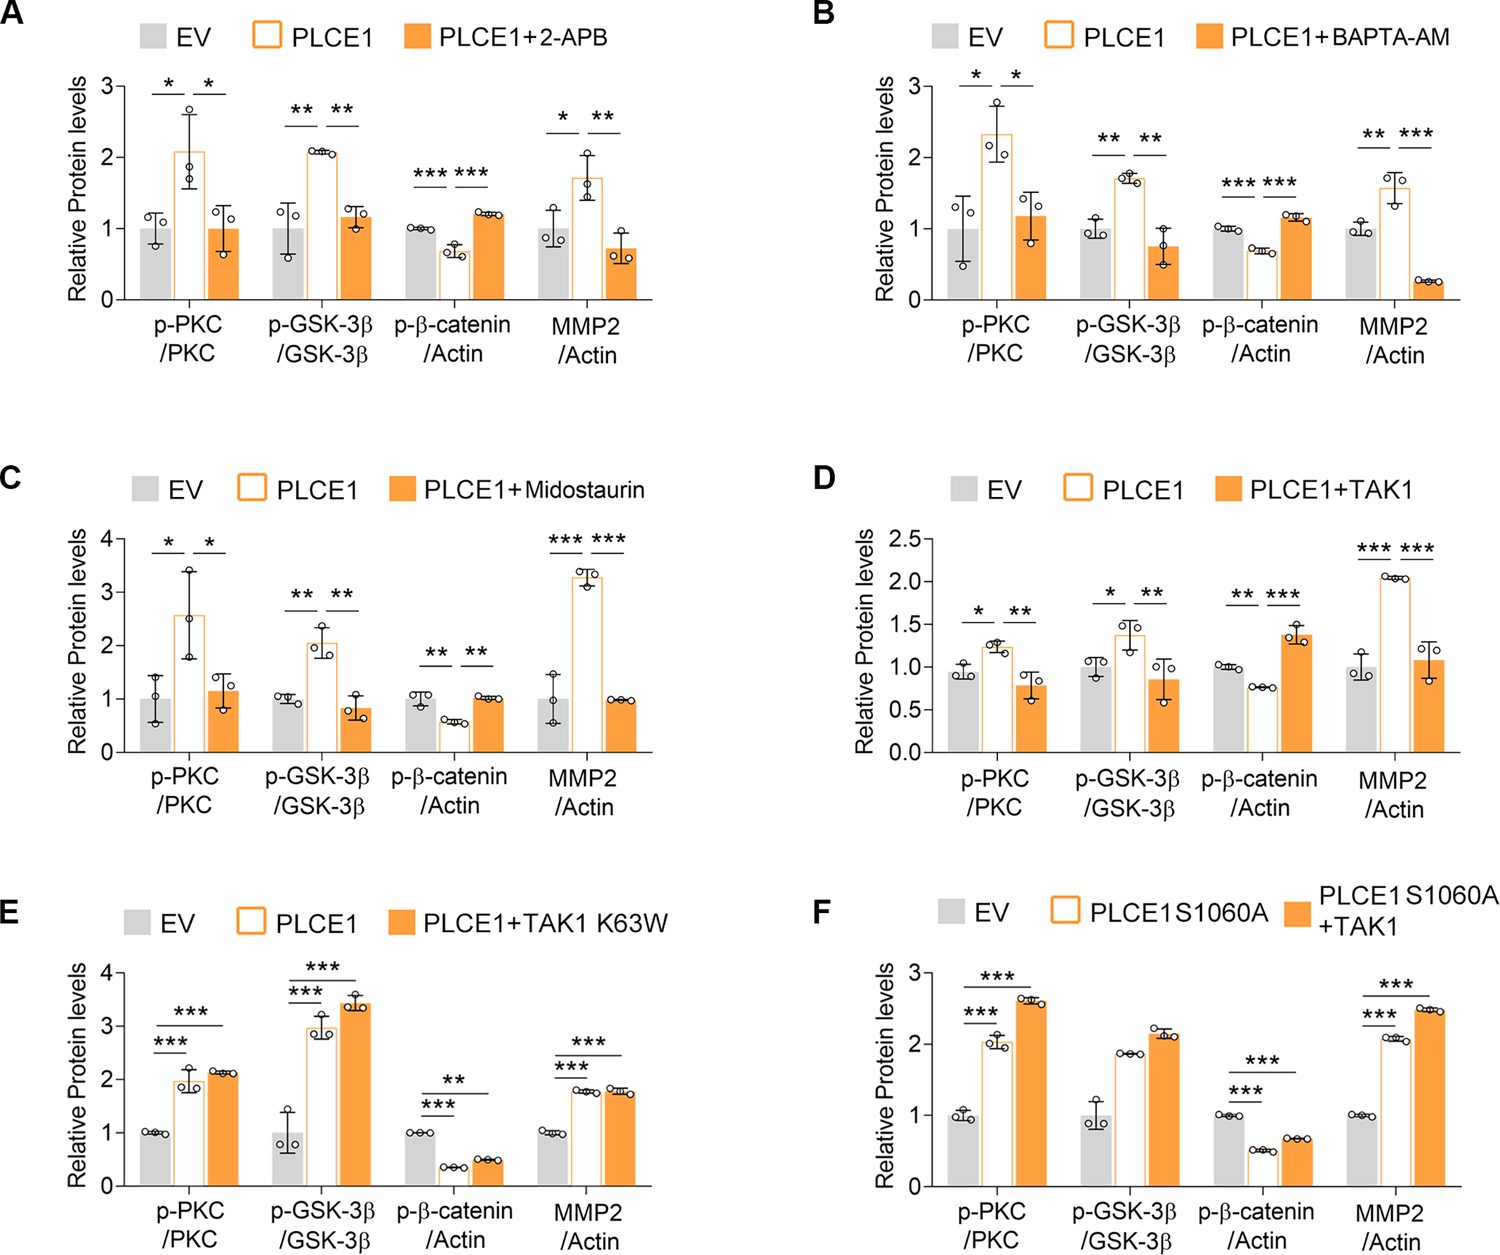
TAK1 mitigates PLCE1-induced signal transduction in the axis of PKC/GSK-3β/β-Catenin.
(A–F) Quantified data for the western blots as shown in Figure 5. n=3 biologically independent replicates. Data are presented as mean ± SD. Statistical significance was tested by two-tailed one-way ANOVA test. *p<0.05, **p<0.01, and ***p<0.001.
-
Figure 5—figure supplement 7—source data 1
TAK1 mitigates PLCE1-induced signal transduction in the axis of PKC/GSK-3β/β-Catenin.
- https://cdn.elifesciences.org/articles/97373/elife-97373-fig5-figsupp7-data1-v1.xlsx
Figure 6 with 1 supplement
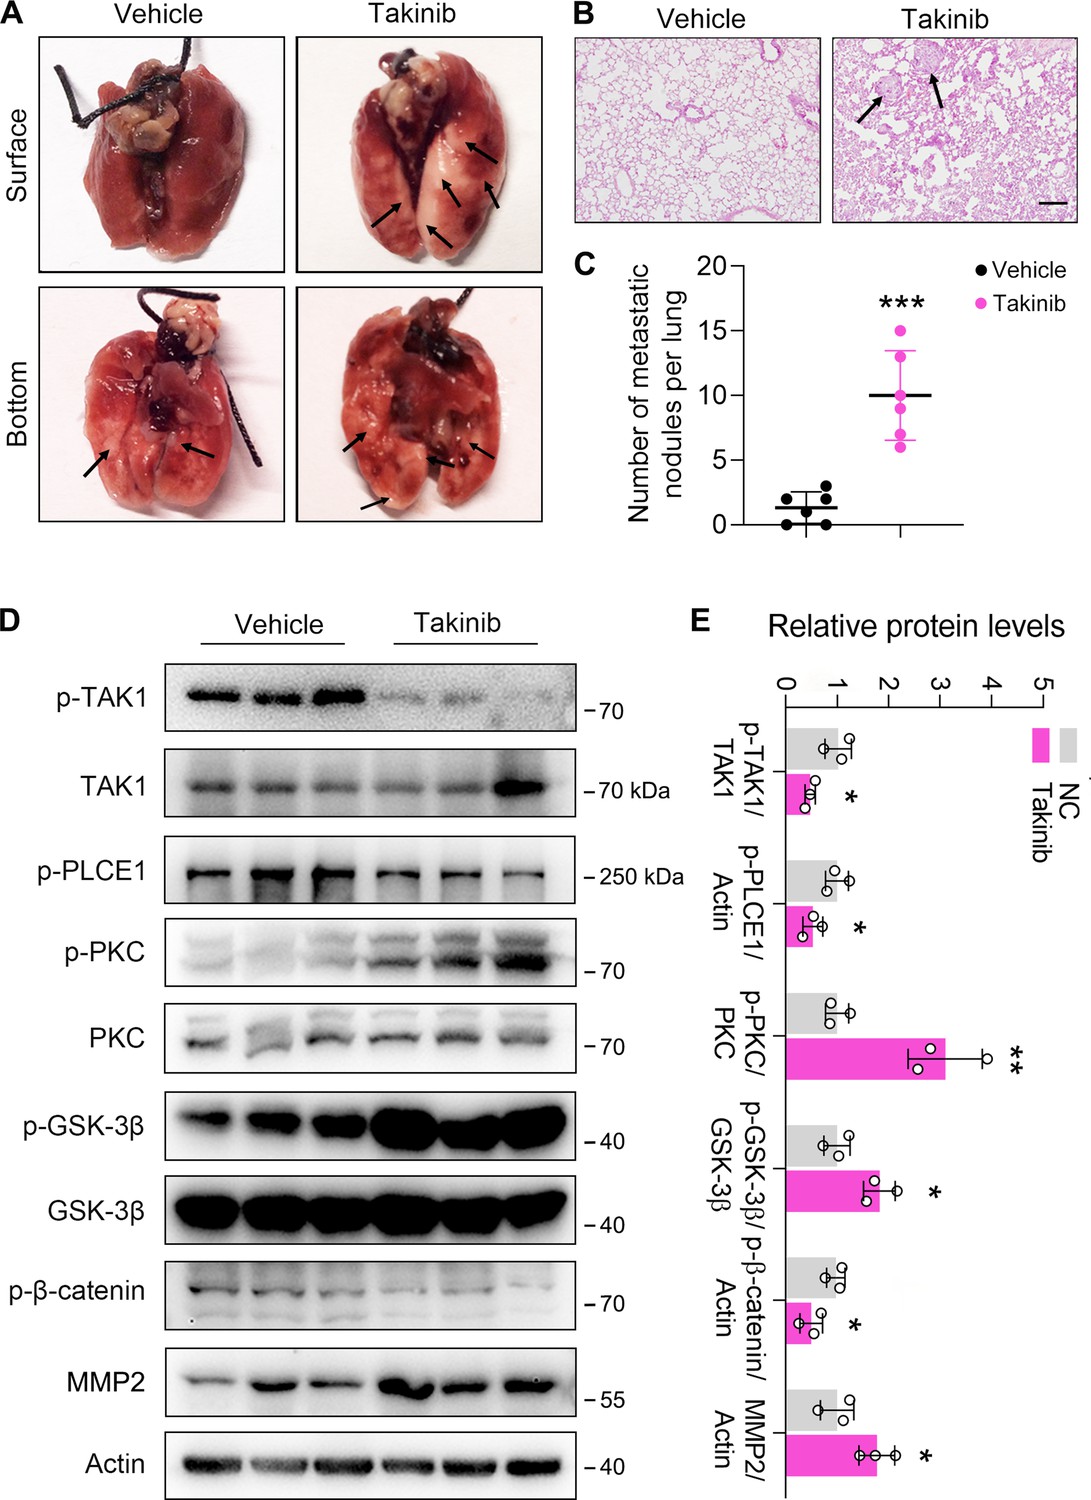
Inhibition of TAK1 by Takinib promotes esophageal squamous cell carcinoma (ESCC) metastasis in nude mice.
Each mouse was intravenously injected with 1×10⁶ ECA-109 cells diluted in 100 µl PBS. Mice were treated with Takinib at the dosage of 50 mg/kg/day for 15 days, mice in control group were received vehicle (corn oil). Eight weeks later, mice were sacrificed, and the lungs and livers from each group were collected and photographed. (A) Typical images of specimens. (B) Hematoxylin and eosin staining of metastatic nodules in lungs. (C) The number of nodules in lungs. (D) Takinib treatment induces signal transduction in the axis of PKC/GSK-3β/β-Catenin. Protein levels were analyzed by western blot, and Actin was used as a loading control. n=3 biologically independent replicates. (E) Quantitative analysis of the western blot data shown in (D). Data are presented as mean ± SD. Statistical significance was tested by unpaired Student’s t-test. *p<0.05, **p<0.01, and ***p<0.001.
-
Figure 6—source data 1
Inhibition of TAK1 by Takinib promotes esophageal squamous cell carcinoma (ESCC) metastasis in nude mice.
- https://cdn.elifesciences.org/articles/97373/elife-97373-fig6-data1-v1.xlsx
-
Figure 6—source data 2
PDF file containing original western blots for Figure 6D, indicating the relevant bands.
- https://cdn.elifesciences.org/articles/97373/elife-97373-fig6-data2-v1.zip
-
Figure 6—source data 3
Original files for western blot analysis displayed in Figure 6D.
- https://cdn.elifesciences.org/articles/97373/elife-97373-fig6-data3-v1.zip
Figure 6—figure supplement 1
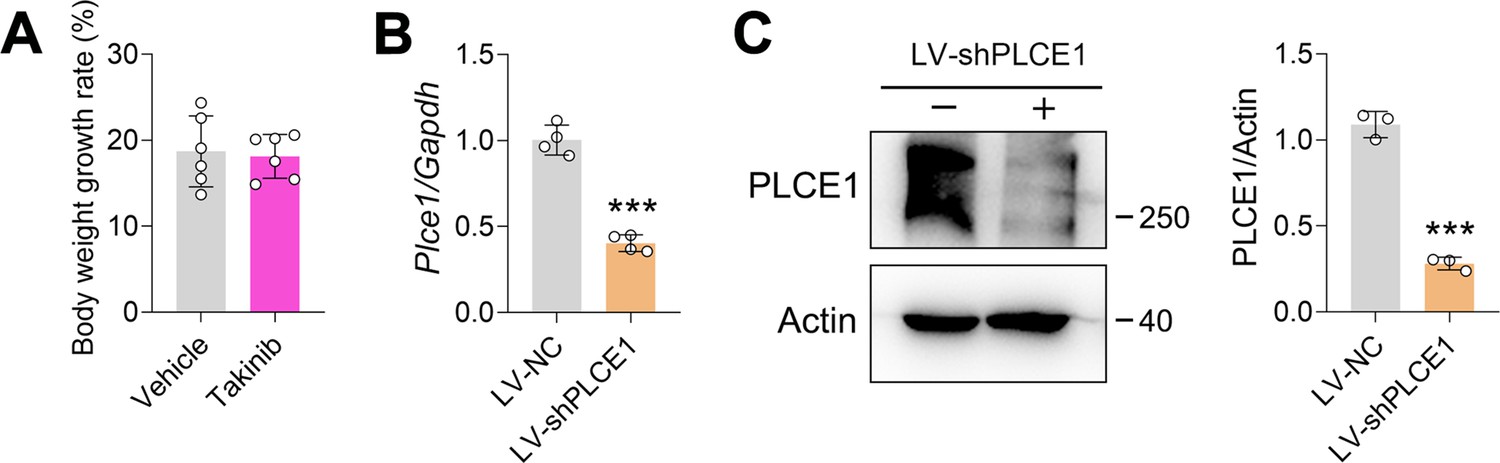
The effects of Takinib on mouse body weight and knockdown of PLCE1 by lentivirus in ECA-109 cells.
(A) The body weight growth rate was not altered by Takinib. (B) The mRNA levels of Plce1 were decreased by LV-shPLCE1. ECA-109 cells were transduced with LV-shPLCE1 for 48 hr, gene expression was analyzed by quantitative real time-PCR (qRT-PCR), and Gapdh was used as a house-keeping gene. n=4 biologically independent replicates. (C) The protein levels of PLCE1 were decreased by LV-shPLCE1. ECA-109 cells were transduced with LV-shPLCE1 for 48 hr, protein expression was analyzed by western blot, and Actin was used as a loading control. n=3 biologically independent replicates. ***p<0.001, unpaired Student’s t-test.
-
Figure 6—figure supplement 1—source data 1
The effects of Takinib on mouse body weight and knockdown of PLCE1 by lentivirus in ECA-109 cells.
- https://cdn.elifesciences.org/articles/97373/elife-97373-fig6-figsupp1-data1-v1.xlsx
-
Figure 6—figure supplement 1—source data 2
PDF file containing original western blots for Figure 6—figure supplement 1C, indicating the relevant bands.
- https://cdn.elifesciences.org/articles/97373/elife-97373-fig6-figsupp1-data2-v1.zip
-
Figure 6—figure supplement 1—source data 3
Original files for western blot analysis displayed in Figure 6—figure supplement 1C.
- https://cdn.elifesciences.org/articles/97373/elife-97373-fig6-figsupp1-data3-v1.zip
Figure 7
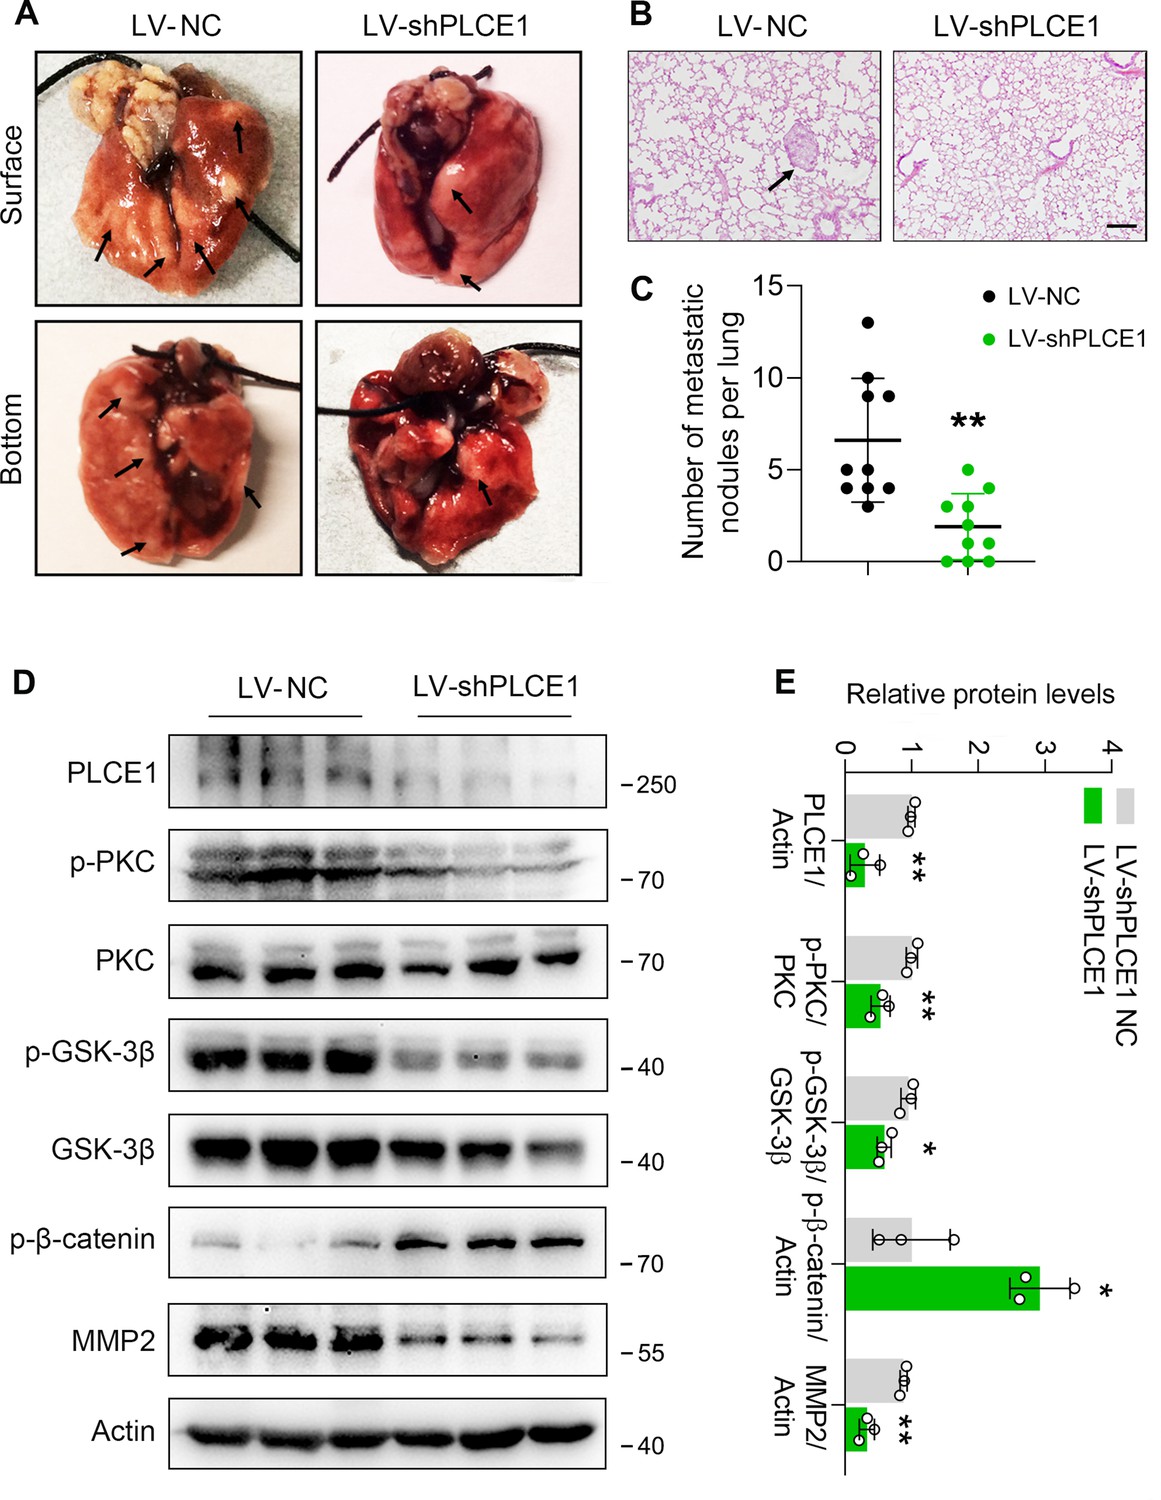
PLCE1 knockdown inhibits esophageal squamous cell carcinoma (ESCC) metastasis in nude mice.
ECA-109 cells were transduced with lentivirus bearing PLCE1 shRNA (LV-shPLCE1) or NC shRNA (LV-shPLCE1 NC). Each mouse was intravenously injected with the LV transduced cells (1×10⁶ cells/mouse). Eight weeks later, mice were sacrificed, and the lungs and livers from each group were collected and photographed. (A) Typical images of lung specimens. (B) Hematoxylin and eosin staining of metastatic nodules in lungs. (C) The number of nodules in lungs. (D) PLCE1 knockdown represses signal transduction in the axis of PKC/GSK-3β/β-Catenin. Protein levels were analyzed by western blot, and Actin was used as a loading control. n=3 biologically independent replicates. (E) Quantitative analysis of the western blot data shown in (D). Data are presented as mean ± SD. Statistical significance was tested by unpaired Student’s t-test. **p<0.01 and ***p<0.001.
-
Figure 7—source data 1
PLCE1 knockdown inhibits esophageal squamous cell carcinoma (ESCC) metastasis in nude mice.
- https://cdn.elifesciences.org/articles/97373/elife-97373-fig7-data1-v1.xlsx
-
Figure 7—source data 2
PDF file containing original western blots for Figure 7D, indicating the relevant bands.
- https://cdn.elifesciences.org/articles/97373/elife-97373-fig7-data2-v1.zip
-
Figure 7—source data 3
Original files for western blot analysis displayed in Figure 7D.
- https://cdn.elifesciences.org/articles/97373/elife-97373-fig7-data3-v1.zip
Tables
Appendix 1—key resources table
| Reagent type (species) or resource | Designation | Source or reference | Identifiers | Additional information |
|---|---|---|---|---|
| Gene (Homo sapiens) | Map3k7 | GenBank | Gene ID:6885 | |
| Gene (Homo sapiens) | Plce1 | GenBank | Gene ID: 51196 | |
| Strain, strain background (Escherichia coli) | DH5α | Vazyme | C502 | Competent cells |
| Cell line (Homo sapiens) | ECA-109 | SIBCB | TCHu69 | |
| Cell line (Homo sapiens) | KYSE-150 | SIBCB | TCHu236 | |
| Cell line (Homo sapiens) | TE-1 | SIBCB | TCHu 89 | |
| Cell line (Homo sapiens) | HEK-293 | ATCC | CRL-1573 | |
| Transfected construct (human) | Map3k7 shRNA/ shNC | Hanbio | This paper | Lentiviral construct to transfect and express the shRNA. |
| Transfected construct (human) | Plce1 shRNA/shNC | OBiO | This paper | Lentiviral construct to transfect and express the shRNA. |
| Transfected construct (human) | siRNA to Map3k7 | RiboBio | This paper | Transfected construct (human) |
| Transfected construct (human) | siRNA to Plce1 | RiboBio | This paper | Transfected construct (human) |
| Antibody | Anti-TAK1 (Rabbit monoclonal) | Cell Signaling Technology | Cat#: 5206 | WB (1:1000) |
| Antibody | Anti-phospho- TAK1 (Ser412) (Rabbit monoclonal) | Cell Signaling Technology | Cat#: 9339 | WB (1:1000) |
| Antibody | Anti-PLCE1 (Rabbit polyclonal) | Invitrogen | Cat#: PA5-100856 | WB (1:1000) |
| Antibody | Anti-phospho-PLCE1 (Ser1060) (Rabbit polyclonal) | Absin | This paper | WB (1:1000) IHC (1:1000) |
| Antibody | Anti-PKCα (Rabbit monoclonal) | Cell Signaling Technology | Cat#: 2056 | WB (1:1000) |
| Antibody | Anti-phospho-PKC (pan) (gamma Thr514) (Rabbit monoclonal) | Cell Signaling Technology | Cat#: 38938 | WB (1:1000) |
| Antibody | Anti-GSK-3β (Rabbit monoclonal) | Cell Signaling Technology | Cat#: 9315 | WB (1:1000) |
| Antibody | Anti-phospho-GSK-3β (Ser9) (Rabbit monoclonal) | Cell Signaling Technology | Cat#: 5558 | WB (1:1000) |
| Antibody | Anti-β-Catenin (Rabbit monoclonal) | Cell Signaling Technology | Cat#: 8480- | WB (1:1000) |
| Antibody | Anti-phospho-β-Catenin (Ser33/37/Thr41) (Rabbit monoclonal) | Cell Signaling Technology | Cat#: 9561 | WB (1:1000) |
| Antibody | Anti-MMP-2 (Rabbit monoclonal) | Cell Signaling Technology | Cat#: 87809- | WB (1:1000) |
| Antibody | Anti-Actin (Mouse monoclonal) | Cell Signaling Technology | Cat#: 3700- | WB (1:1000) |
| Antibody | Myc-Tag (Sepharose Bead Conjugate) | Cell Signaling Technology | Cat#: 55464 | IP (1:20) |
| Antibody | Epithelial-Mesenchymal Transition (EMT) antibody sample kit | Cell Signaling Technology | Cat#: 9782 | WB (1:1000) |
| Antibody | Anti-IKK (Rabbit monoclonal) | Cell Signaling Technology | Cat#: 61294 | WB (1:1000) |
| Antibody | Anti-phosphor-IKK (Rabbit monoclonal) | Cell Signaling Technology | Cat#: 2078 | WB (1:1000) |
| Antibody | Anti-JNK (Rabbit monoclonal) | Cell Signaling Technology | Cat#: 9252 | WB (1:1000) |
| Antibody | Anti-phosphor-JNK (Rabbit monoclonal) | Cell Signaling Technology | Cat#: 4668 | WB (1:1000) |
| Antibody | Anti-ERK (Rabbit monoclonal) | Cell Signaling Technology | Cat#: 9102 | WB (1:1000) |
| Antibody | Anti-phospho-ERK (Rabbit monoclonal) | Cell Signaling Technology | Cat#: 4370 | WB (1:1000) |
| Antibody | Anti-P38 MPAK (Rabbit monoclonal) | Cell Signaling Technology | Cat#: 9212 | WB (1:1000) |
| Antibody | Anti-phospho-P38 MAPK (Rabbit monoclonal) | Cell Signaling Technology | Cat#: 9211 | WB (1:1000) |
| Antibody | Anti-normal rabbit IgG (Rabbit monoclonal) | Cell Signaling Technology | Cat#: 2729 | WB (1:1000) |
| Recombinant DNA reagent | pcDNA3.1-Map3k7 (plasmid) | This paper | This paper | |
| Recombinant DNA reagent | pRK5-myc Plce1 (plasmid) | This paper | Dr. Friedhelm Hildebrandt (1) | |
| Sequence-based reagent | Map3k7 siRNA | RiboBio | This paper | GGAGTTGTTTGCAAAGCTA |
| Sequence-based reagent | Plce1 siRNA-1 | RiboBio | This paper | GGACTTCAATATCGCAGTA |
| Sequence-based reagent | Plce1 siRNA-2 | RiboBio | This paper | GTCGAAGTGTAGAATTGGA |
| Sequence-based reagent | Plce1 siRNA-3 | RiboBio | This paper | CAATCATCATATCGATTGA |
| Sequence-based reagent | Map3k7 gRNA_F | This paper | PCR primers | ccgAGGGGCTTCGATCATCTCAC |
| Sequence-based reagent | Map3k7 gRNA_R | This paper | PCR primers | aacGTGAGATGATCGAAGCCCCT |
| Sequence-based reagent | Plce1 (S1060A) _F | This paper | PCR primers | TGGAGTGCTCGAAACCCCGCACCCGGAACATCAGCAAA |
| Sequence-based reagent | Plce1 (S1060A) _R | This paper | PCR primers | GGGGTTTCGAGCACTCCACCGTCTGCCACCAAACAA |
| Sequence-based reagent | Map3k7_F | This paper | PCR primers | ATTGTAGAGCTTCGGCAGTTATC |
| Sequence-based reagent | Map3k7_R | This paper | PCR primers | CTGTAAACACCAACTCATTGCG |
| Sequence-based reagent | Plce1_F | This paper | PCR primers | GGGTGACATGGCTGATCCTC |
| Sequence-based reagent | Plce1_R | This paper | PCR primers | GACAGCGTTGTAGTTGCCCA |
| Sequence-based reagent | Cdh1_F | This paper | PCR primers | GCTTTACTGTTTCTCAAGTGT |
| Sequence-based reagent | Cdh1_R | This paper | PCR primers | AATACACAATTATCAGCACCC |
| Sequence-based reagent | Vim_F | This paper | PCR primers | AACTTCTCAGCATCACGAT |
| Sequence-based reagent | Vim_R | This paper | PCR primers | GTAGGAGTGTCGGTTGTT |
| Sequence-based reagent | Ctnnb1_F | This paper | PCR primers | AGAATTGAGTAATGGTGTAGAAC |
| Sequence-based reagent | Ctnnb1_R | This paper | PCR primers | TACCCATACATATCCCAAATAGT |
| Sequence-based reagent | Cldn1_F | This paper | PCR primers | TGTATAGTCCTCTTGGGTTG |
| Sequence-based reagent | Cldn1_R | This paper | PCR primers | AATTGTCAGTGGAGTCAGT |
| Sequence-based reagent | Cdh2_F | This paper | PCR primers | AAAAGGAAAGGAAAGAAAGGG |
| Sequence-based reagent | Cdh2_R | This paper | PCR primers | GTCAGAGGTGTATCATTTATATTCT |
| Sequence-based reagent | Zeb1_F | This paper | PCR primers | GTTGCTCCTTCTTCCTGA |
| Sequence-based reagent | Zeb1_R | This paper | PCR primers | ATGTGGTTCCTGTTCCTAG |
| Sequence-based reagent | Tjp1_F | This paper | PCR primers | TGTGGACATCCTACTTACTTAA |
| Sequence-based reagent | Tjp1_R | This paper | PCR primers | GAGAAGATAAAGAAACTGTTGTATG |
| Sequence-based reagent | Snai1_F | This paper | PCR primers | AGCTATTTCAGCCTCCTG |
| Sequence-based reagent | Snai1_R | This paper | PCR primers | TGTAAACATCTTCCTCCCAG |
| Sequence-based reagent | Snai2_F | This paper | PCR primers | CTGTATGAAACTGAGATGTTGT |
| Sequence-based reagent | Snai2_R | This paper | PCR primers | GAAGCAAGTAAAGTCTCTGAAA |
| Sequence-based reagent | Gapdh_F | This paper | PCR primers | AAGAGCACAAGAGGAAGAG |
| Sequence-based reagent | Gapdh_R | This paper | PCR primers | TAACTGGTTGAGCACAGG |
| Commercial assay or kit | PLC Activity Assay Kit | Jining Shiye | ml076627 | ELISA kit |
| Commercial assay or kit | Fluo-4 AM Assay Kit | Beyotime | S1060 | |
| Commercial assay or kit | Human Inositol 1,4,5-triphosphate enzyme-linked Immunosorbent Assay | Mlbio | ml060362 | ELISA kit |
| Commercial assay or kit | Human Diacylglycerol commercial ELISA Kit | Mlbio | ml026857 | ELISA kit |
| Chemical compound, drug | 5Z-7-oxozeaenol | Sigma-Aldrich | O9890 | TAK1 inhibitor |
| Chemical compound, drug | NG25 | Sigma-Aldrich | SML1332 | TAK1 inhibitor |
| Chemical compound, drug | Takinib | Sigma-Aldrich | SML2216 | TAK1 inhibitor |
| Chemical compound, drug | BAPTA-AM | MedChemExpress | HY-100545 | An intracellular calcium chelator |
| Chemical compound, drug | Midostaurin | MedChemExpress | HY-10230 | A PKC inhibitor |
| Chemical compound, drug | 2-APB | MedChemExpress | HY-W009724 | An IP3R antagonist |
| Peptide, recombinant protein | EGF | Gibco | PHG0311 | |
| Software, algorithm | GraphPad Prism version 8.0 | GraphPad |
Additional files
-
Supplementary file 1
he sequences used in gene knockdown and mutation.
- https://cdn.elifesciences.org/articles/97373/elife-97373-supp1-v1.docx
-
Supplementary file 2
Primer sequences used in quantitative real time-PCR (qRT-PCR).
- https://cdn.elifesciences.org/articles/97373/elife-97373-supp2-v1.docx
-
MDAR checklist
- https://cdn.elifesciences.org/articles/97373/elife-97373-mdarchecklist1-v1.docx
Download links
A two-part list of links to download the article, or parts of the article, in various formats.
Downloads (link to download the article as PDF)
Open citations (links to open the citations from this article in various online reference manager services)
Cite this article (links to download the citations from this article in formats compatible with various reference manager tools)
TAK1-mediated phosphorylation of PLCE1 represses PIP2 hydrolysis to impede esophageal squamous cancer metastasis
eLife 13:RP97373.
https://doi.org/10.7554/eLife.97373.3


