A model-based factorization method for scRNA data unveils bifurcating transcriptional modules underlying cell fate determination
- National Institute for Data Science in Health and Medicine, School of Medicine, Xiamen University, China
- Department of Hematology, The First Affiliated Hospital of Xiamen University and Institute of Hematology, School of Medicine, Xiamen University, China
- School of Informatics, Xiamen University, Xiamen, China
- Department of Scientific Research Management, Weifang People’s Hospital, Shandong Second Medical University, China
Figures
Figure 1
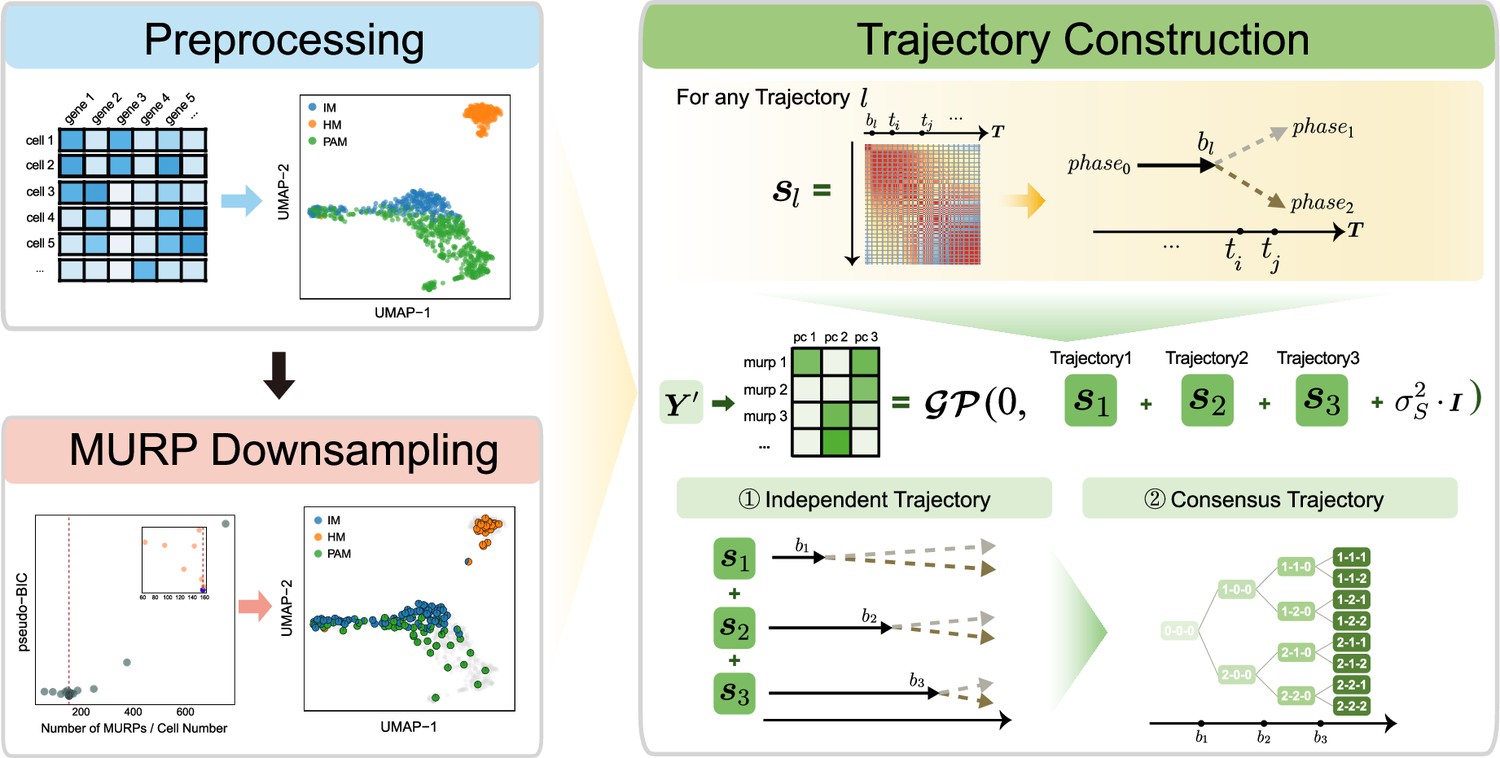
Overview of MGPfact workflow.
The complete workflow comprises two major stages: minimum unbiased representative points (MURP) downsampling with preprocessed data and trajectory reconstruction. In the stage of trajectory reconstruction, the single-cell RNA sequencing (scRNA-seq) data were first factorized into independent bifurcation processes based on mixtures of Gaussian processes, which were then merged into a consensus trajectory.
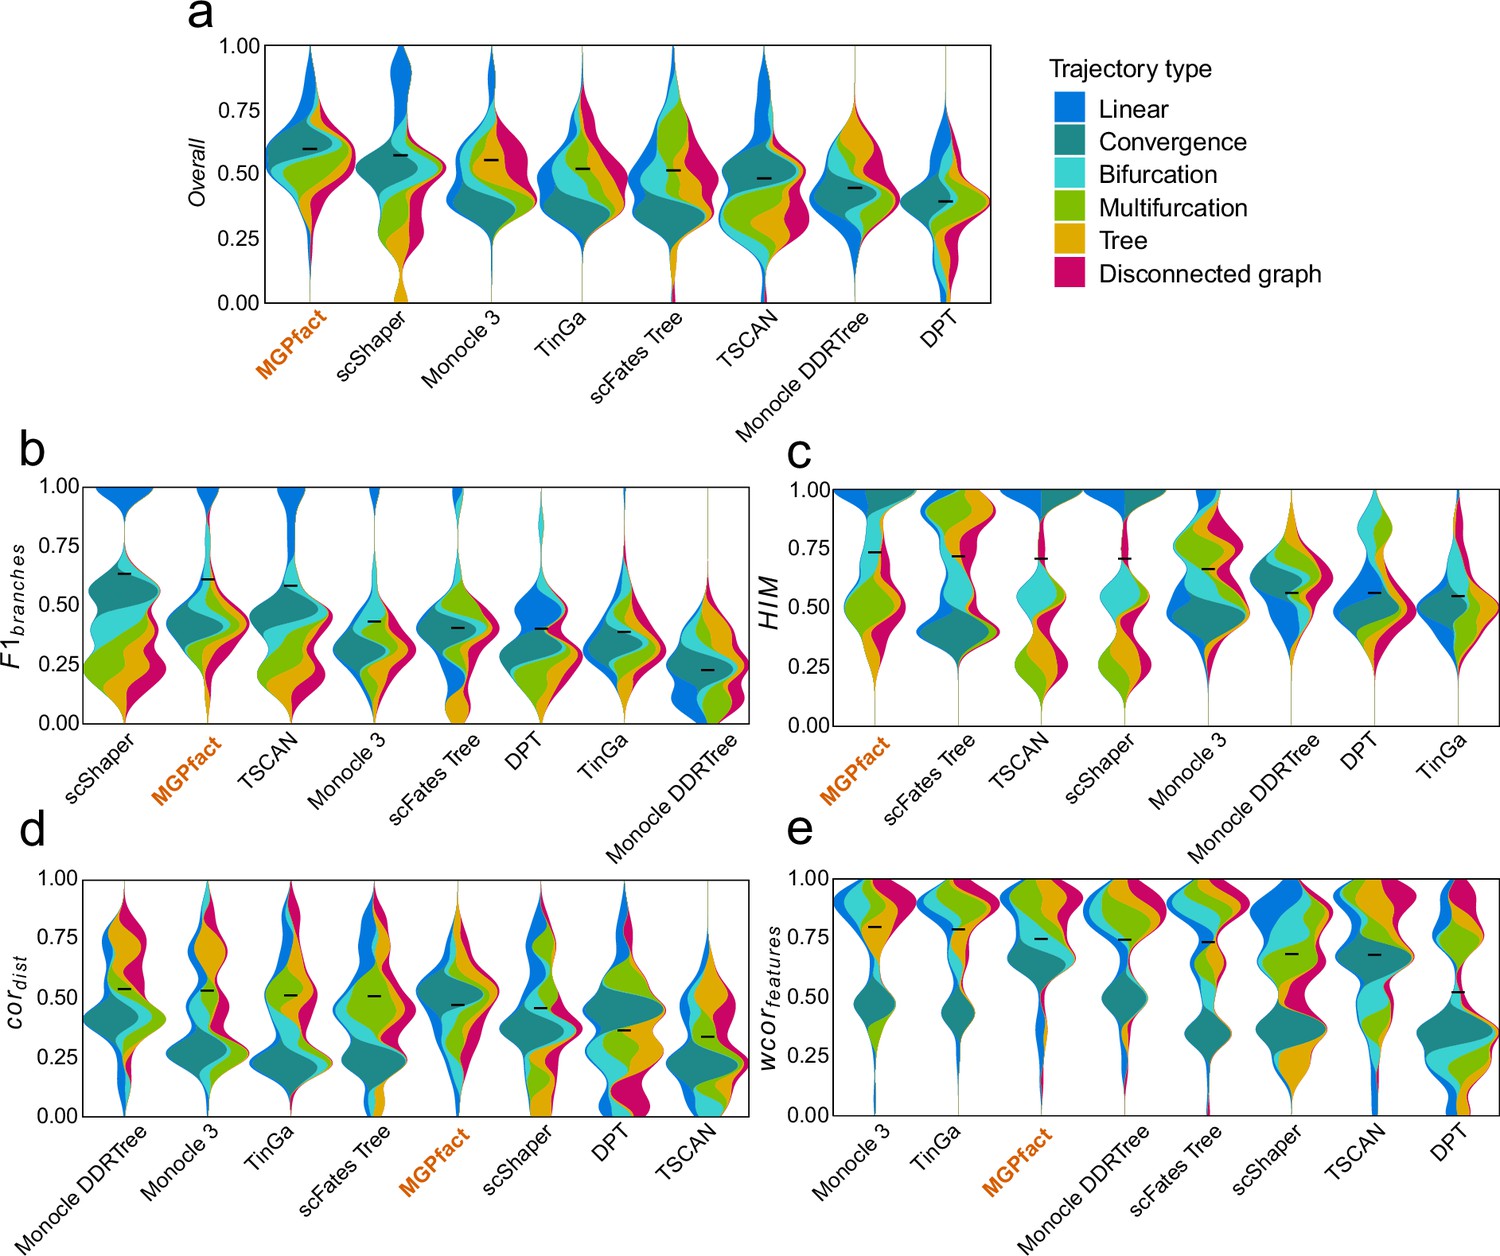
Figure 2 with 4 supplements
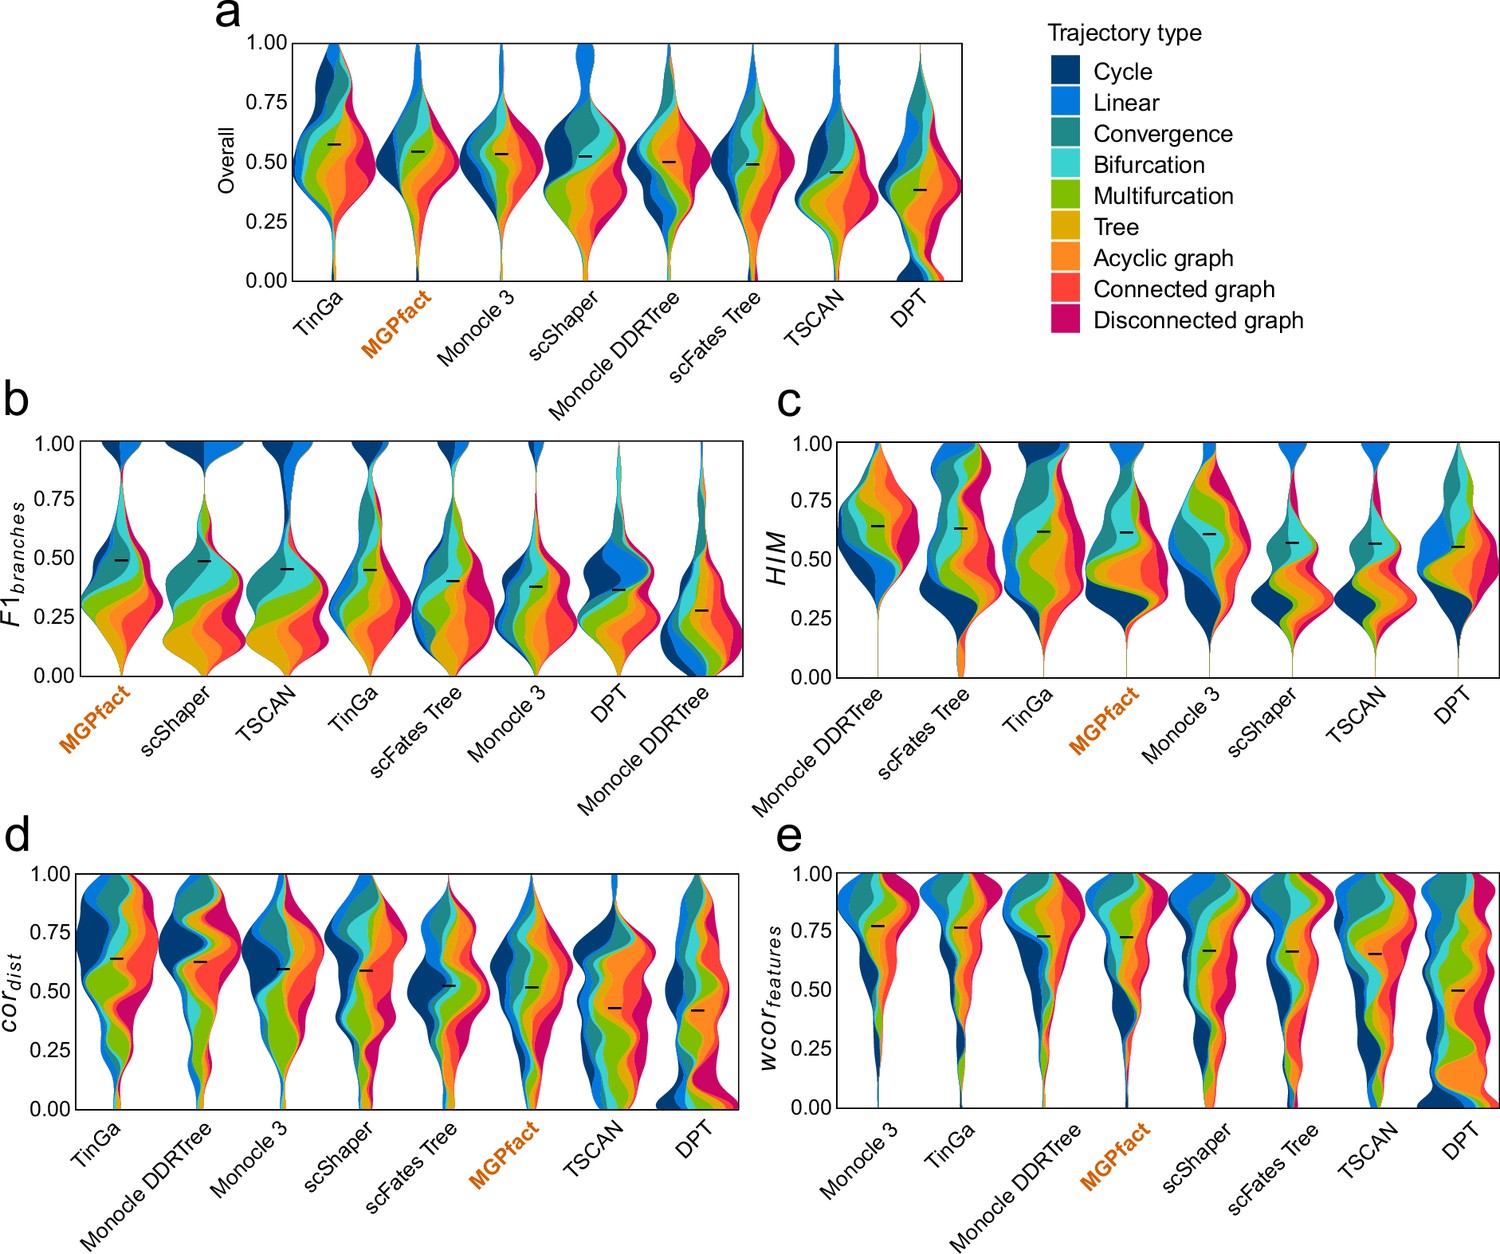
Trajectory inference (TI) performance of state-of-the-art methods in 239 test datasets.
(a) Overall scores; (b) ; (c) ; (d) ; (e) .
All results are color-coded based on the trajectory types, with the black line representing the mean value. The ‘Overall’ assessment is calculated as the geometric mean of all four metrics.
Figure 2—figure supplement 1
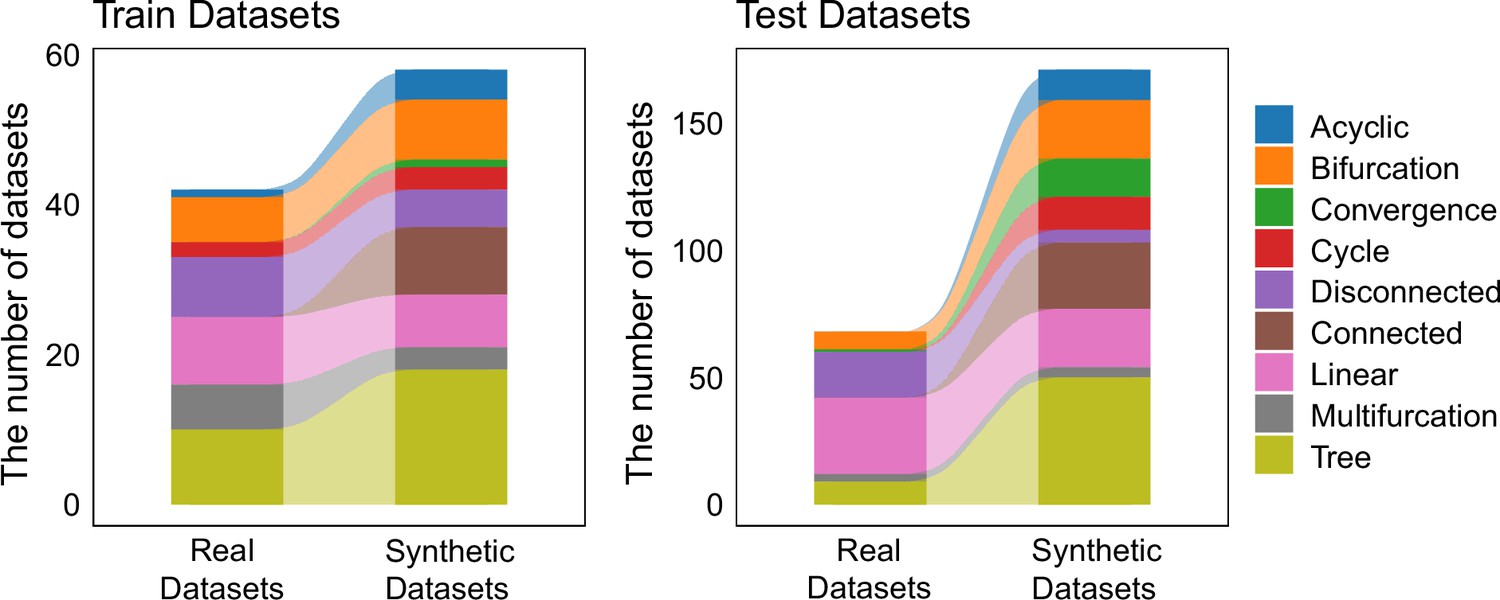
The distribution of trajectory types among training set and test set.
The 339 datasets were randomly split into two groups, serving as the training set and test set, respectively. The training set consists of 100 datasets, while the testing set includes 239 datasets.
Figure 2—figure supplement 2
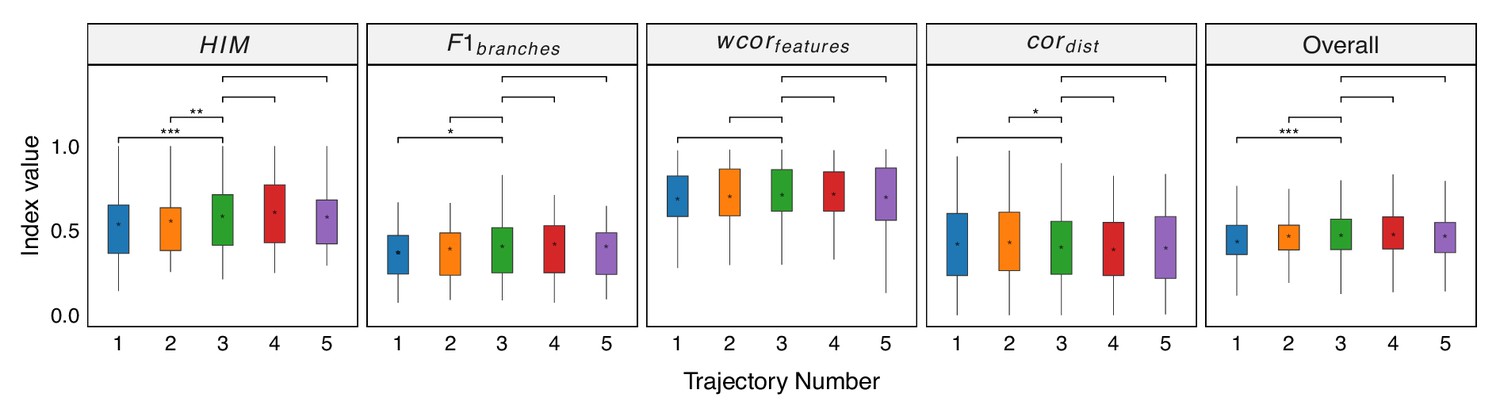
Robustness testing of the number of independent trajectories on 100 training datasets.
With L=3 set as the default, we tested the impact of different L values (1, 2, 4, and 5) on the prediction results. In all box plots, the asterisk represents the mean value, while the whiskers extend to the farthest data points within 1.5 times the interquartile range. Significance is denoted as follows: not annotated indicates non-significant; * P<0.05; ** P<0.01; *** P<0.001; two-sided paired Student’s T-tests.
Figure 2—figure supplement 3
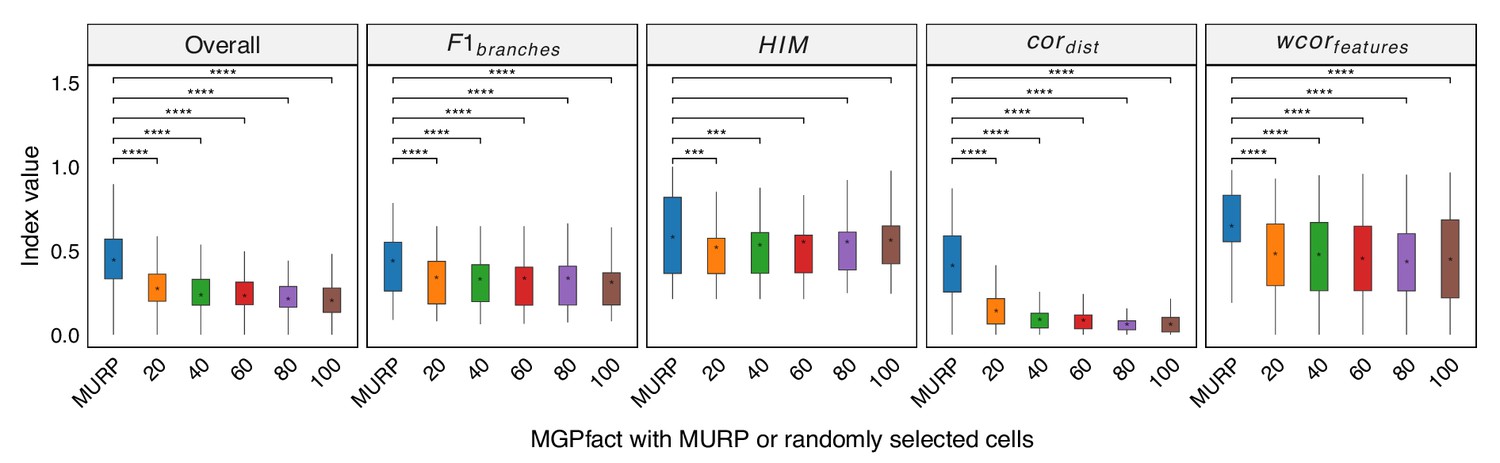
MURP downsampling enhances the performance of MGPfact.
Trajectory inference was conducted by randomly selecting 20, 40, 60, 80, and 100 cells from the original dataset. The results were mapped back to the original data using a KNN graph structure to obtain the final predictions, which were then compared with those obtained through MURP downsampling. In all box plots, the asterisk represents the mean value, while the whiskers extend to the farthest data points within 1.5 times the interquartile range. Significance is denoted as follows: not annotated indicates non-significant; * P<0.05; ** P<0.01; *** P<0.001; two-sided paired Student’s T-tests.
Figure 2—figure supplement 4

Robustness analysis of consensus trees.
Random sampling is performed on the original data at different proportions of 60%, 70%, 80%, and 90%. The MGPfact consensus trajectory predictions are compared with that based on the original, unsampled data using . In all box plots, the asterisk represents the mean value, while the whiskers extend to the farthest data points within 1.5 times the interquartile range.
Figure 3 with 1 supplement
Trajectory inference (TI) performance of state-of-the-art methods in 68 test datasets of real cell population.
(a) Overall scores; (b) ; (c) ; (d) ; (e) . All results are color-coded based on the trajectory types, with the black line representing the mean value for ranking all methods. The ‘Overall’ assessment is calculated as the geometric mean of all four metrics.
Figure 3—figure supplement 1
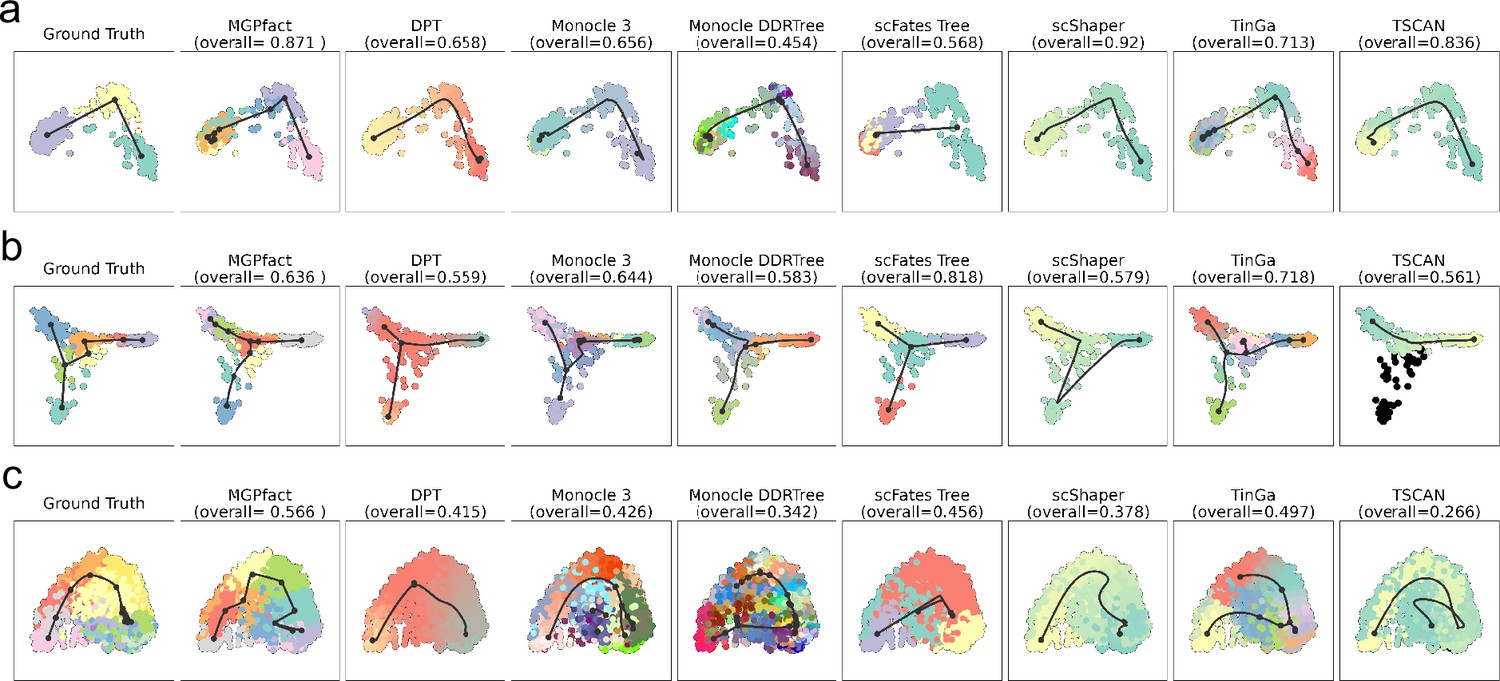
Trajectories identified by different methods on 3 real-world datasets, with reference structures being linear (a) dataset-id=real/silver/germline-human-female_li, bifurcation (b) dataset-id=real/silver/fibroblast-reprogramming_treutlein, and multifurcation (c) dataset-id=real/silver/oligodendrocyte-differentiation-subclusters_marques.
The first column of each row presents the actual cell development trajectory (‘ground truth’), with black lines representing the trajectory structure and the colored dots indicating cells at different stages. These elements highlight the main paths and key bifurcation points of cell differentiation as a reference for evaluating prediction results. Subsequent columns show the trajectory reconstruction results of MGPfact and other methods. The overall score for each method reflects its accuracy in trajectory inference relative to the gold standard, which is represented in the top-left figure.
Figure 4
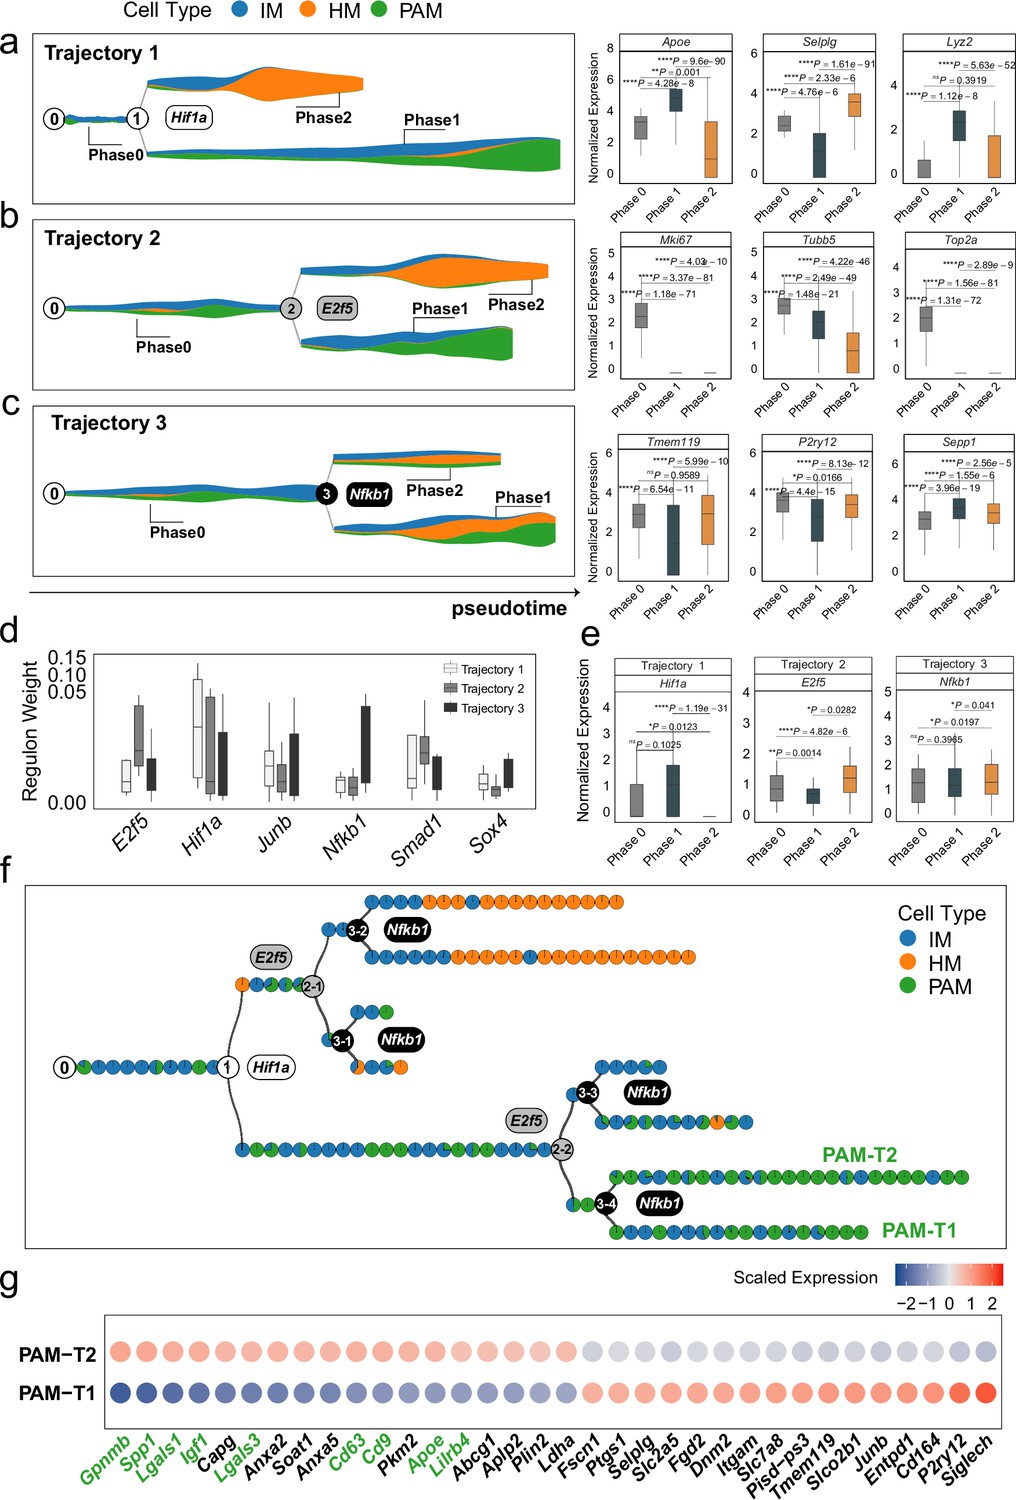
MGPfact reconstructed the developmental trajectory of microglia, recovering known determinants of microglia fate.
(a-c) The inferred independent bifurcation processes with respect to the unique cell types (color-coded) of microglia development, where phase 0 corresponds to the state before bifurcation; and phases 1 and 2 correspond to the states post-bifurcation. Each colored dot represents a metacell of unique cell type defined by MURP. The most highly weighted regulons in each trajectory were labeled by the corresponding transcription factors (left panels). The HWG of each bifurcation process include a set of highly weighted genes, of which the expression levels differ significantly among phases 1, 2, and 3 (right panels). (d) The most highly weighted regulons influencing the three developmental trajectories of microglia. (e) The expression levels of the transcription factors of highly weighted regulons in each trajectory significantly differ among different phases. (f) The consensus developmental trajectory by merging the three bifurcation processes. Point 0 denotes the initial of differentiation, whereas the notion of ‘n-m’ denotes the m-th branch from the branching point n. Each colored circle represents a landmark (MURP) of the trajectory, showing the fraction of cell types. The transcription factors of highly weighted regulons in each bifurcation process were used to label each branching point. Particularly, PAM-T1 and PAM-T2 are the two newly defined subtypes of PAM. (g) Selected differently expressed genes between PAM-T1 and PAM-T2 (|logfc|>0.25, adjusted P-value <0.1) are shown by colored-dots corresponding to the mean expression levels in either cell type. The IDs validated marker genes for PAM are labeled in green. In all box plots, the horizontal line represents the median value, and the whisker extends to the furthest data point within 1.5 times the interquartile range. Significance is denoted as: ns, not significant, * P<0.05, ** P<0.01, *** P<0.001, **** P<0.0001, Wilcoxon rank-sum test.
Figure 5 with 4 supplements
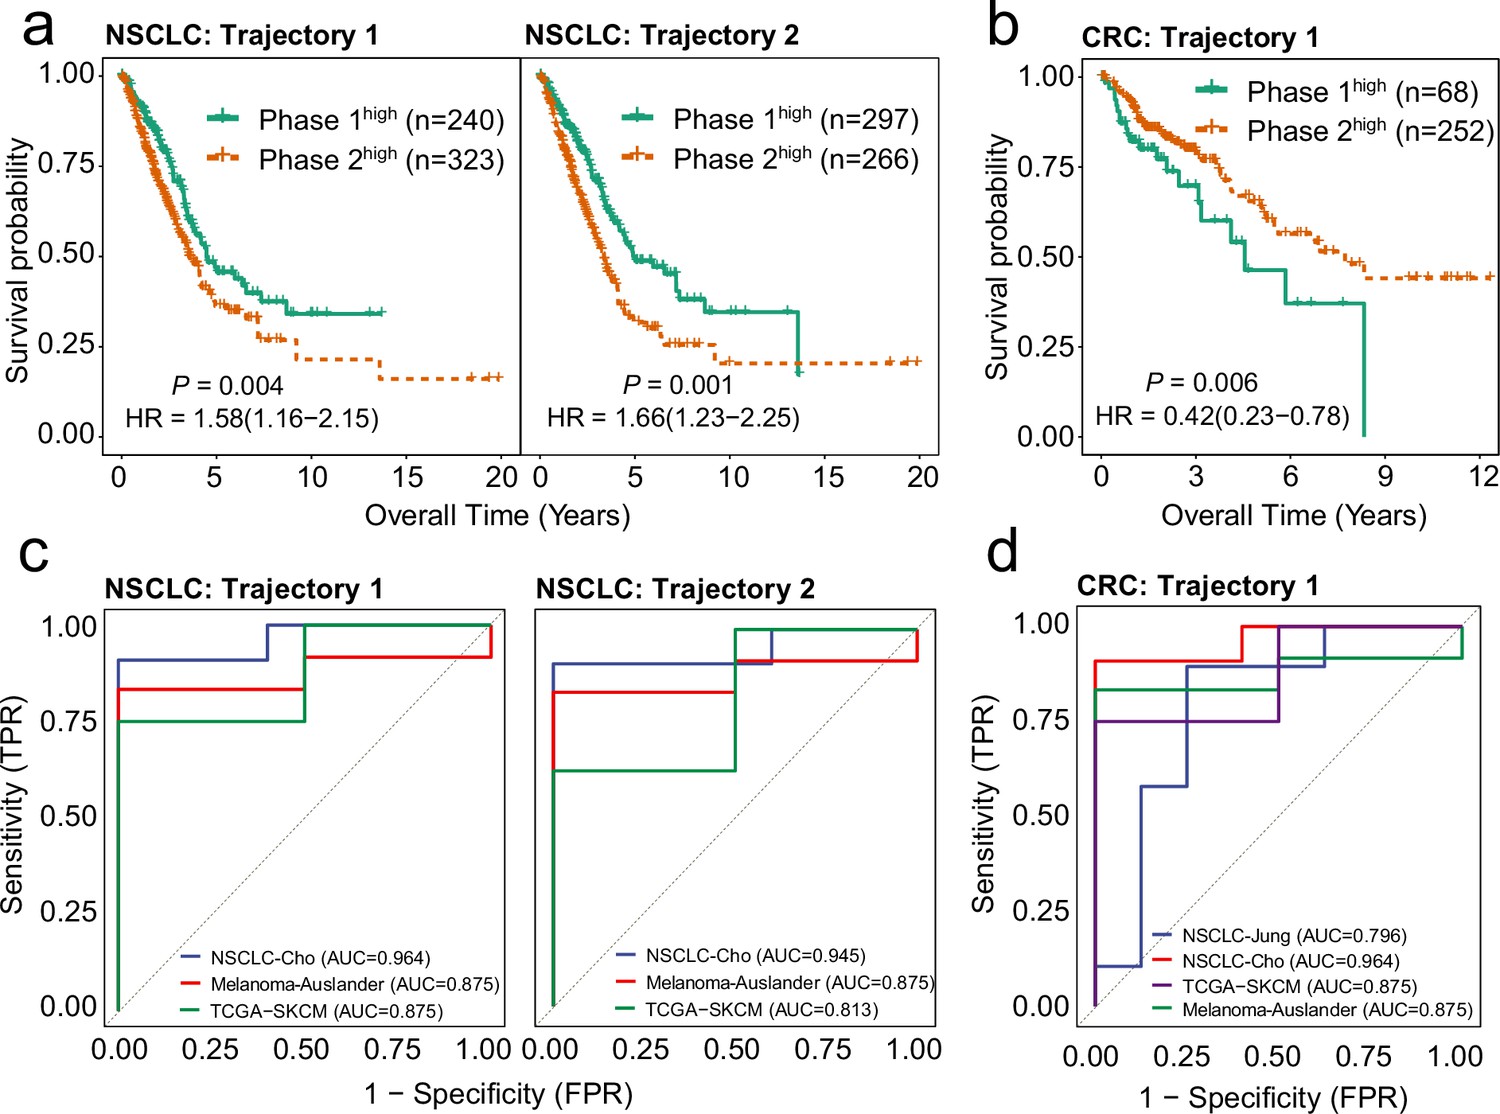
Highly weighted genes (HWG) of the bifurcation processes of CD8+ T cells serve as reliable indicators for clinical outcome and immune checkpoint inhibitor (ICI) treatment response.
(a) Gene expression signatures (GES) corresponding to HWG in CD8+ T cells trajectory 1 and 2 in non-small cell lung cancer (NSCLC) predict overall survival of the TCGA-LUAD cohort. (b) GES corresponding to HWG in CD8+ T cells trajectory 1 in colorectal cancer (CRC) predict overall survival of the TCGA-COAD cohort. (c) ROC curve showing the weighted mean of HWG in Trajectories 1 and 2 in NSCLC significantly associated with ICI response across three independent studies. (d) ROC curve showing the weighted mean of HWG in trajectories 1 and 2 in CRC significantly associated with ICI response across four independent studies.
Figure 5—figure supplement 1
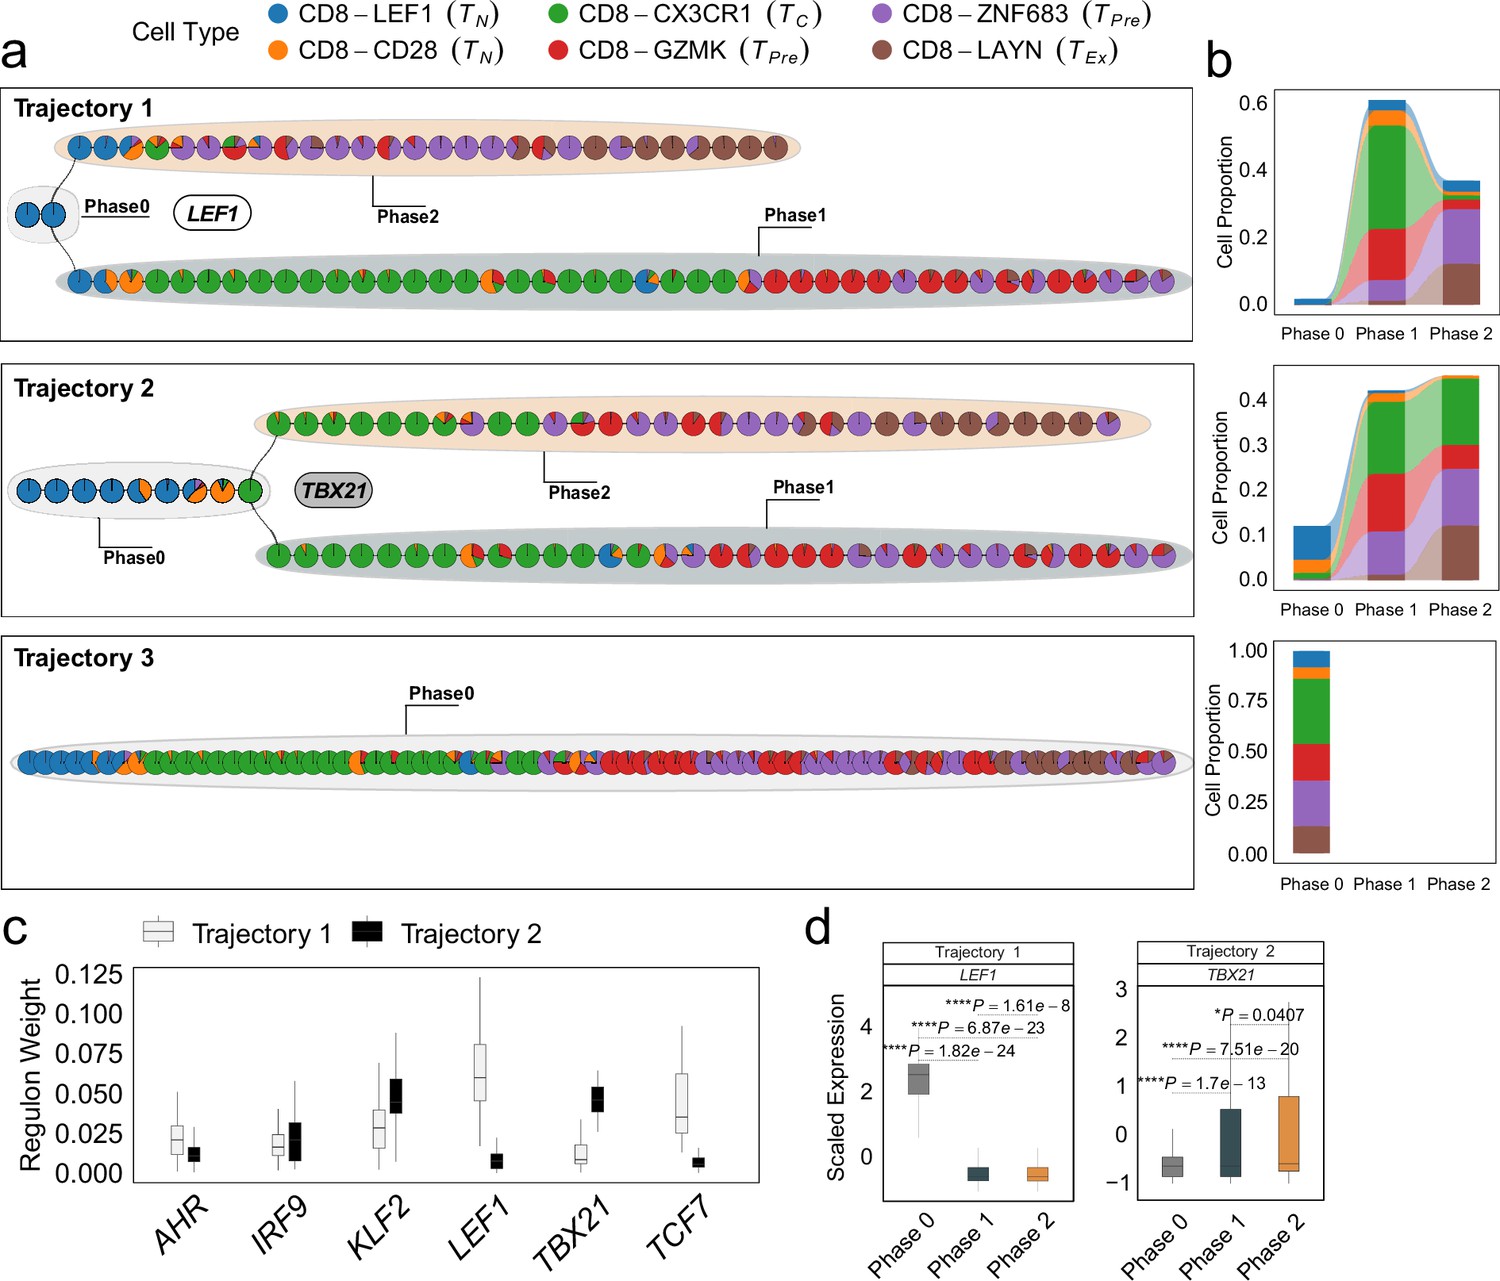
Differentiation process and determinants of CD8+ T cells from non-small cell lung cancer (NSCLC) environment.
(a) The independent trajectories, where phase 0 represents the juncture before bifurcation, while phases 1 and 2 represent the diverging branches post-bifurcation. (b) Proportions of cell types in different phases of independent trajectories; (c) The regulon weight of top regulons of two trajectories. (d) The differential expression of top transcription factors among different phases for each trajectory. In all box plots, the horizontal line represents the median value, and the whisker extends to the furthest data point within 1.5 times the interquartile range. Significance denoted as: *p<0.05, ****p<0.0001, two-sided unpaired Student’s t-test.
Figure 5—figure supplement 2
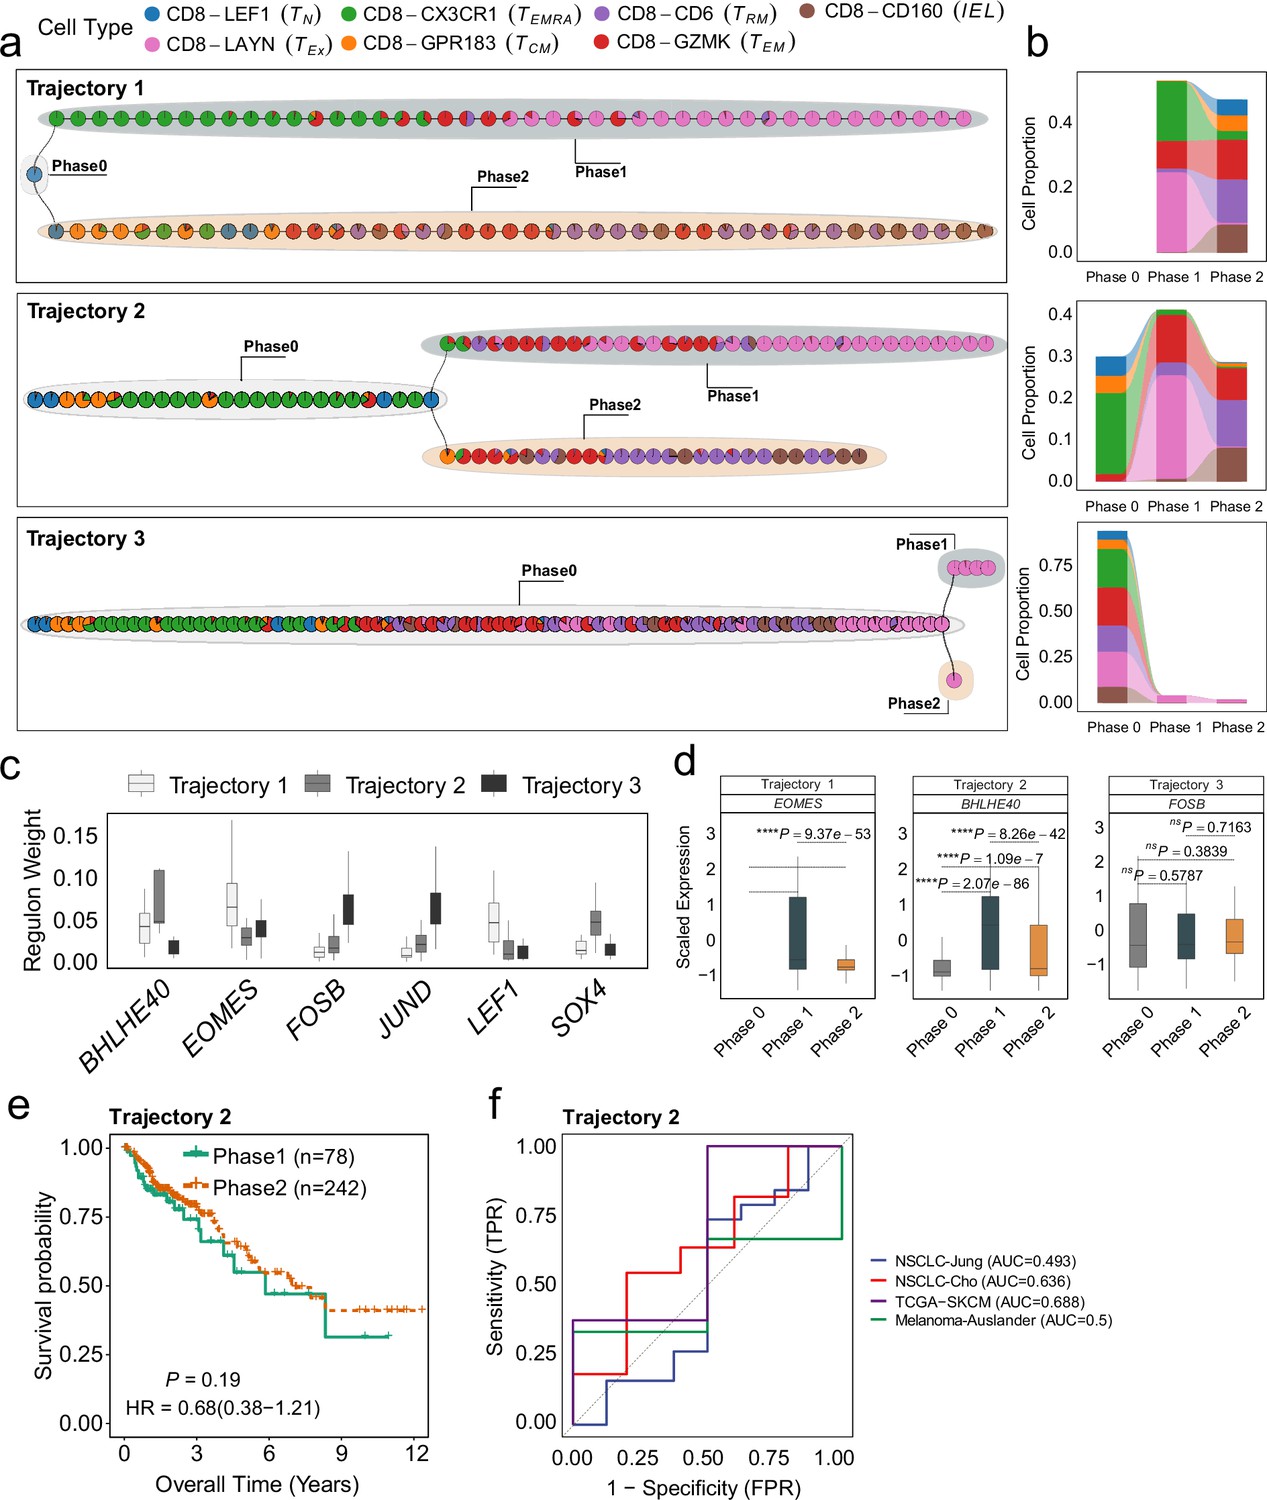
Differentiation process and determinants of CD8+ T cells from colorectal cancer (CRC) environment.
(a) The independent trajectories, where phase 0 represents the juncture before bifurcation, while phases 1 and 2 represent the diverging branches post-bifurcation. (b) Proportions of cell types in different phases of independent trajectories; (c) The regulon weight of top regulons of two trajectories. (d) The differential expression of top transcription factors among different phases for each trajectory. (e) Survival analysis of the patients from TCGA-COAD cohort. The patients are stratified by utilizing the branch event within trajectory 2 from MGPfact analysis. p-values are calculated using multivariate Cox regression, with HR representing the hazard ratio. (f) ROC curve for immune checkpoint inhibitor (ICI) treatment response associated with highly weighted genes related to Trajectories 2 in CRC across four independent studies. In all box plots, the horizontal line represents the median value, and the whisker extends to the furthest data point within 1.5 times the interquartile range. Significance denoted as: ns, not significant, *p<0.05, **p<0.01, ***p<0.001, ****p<0.0001, two-sided unpaired Student’s t-test.
Figure 5—figure supplement 3
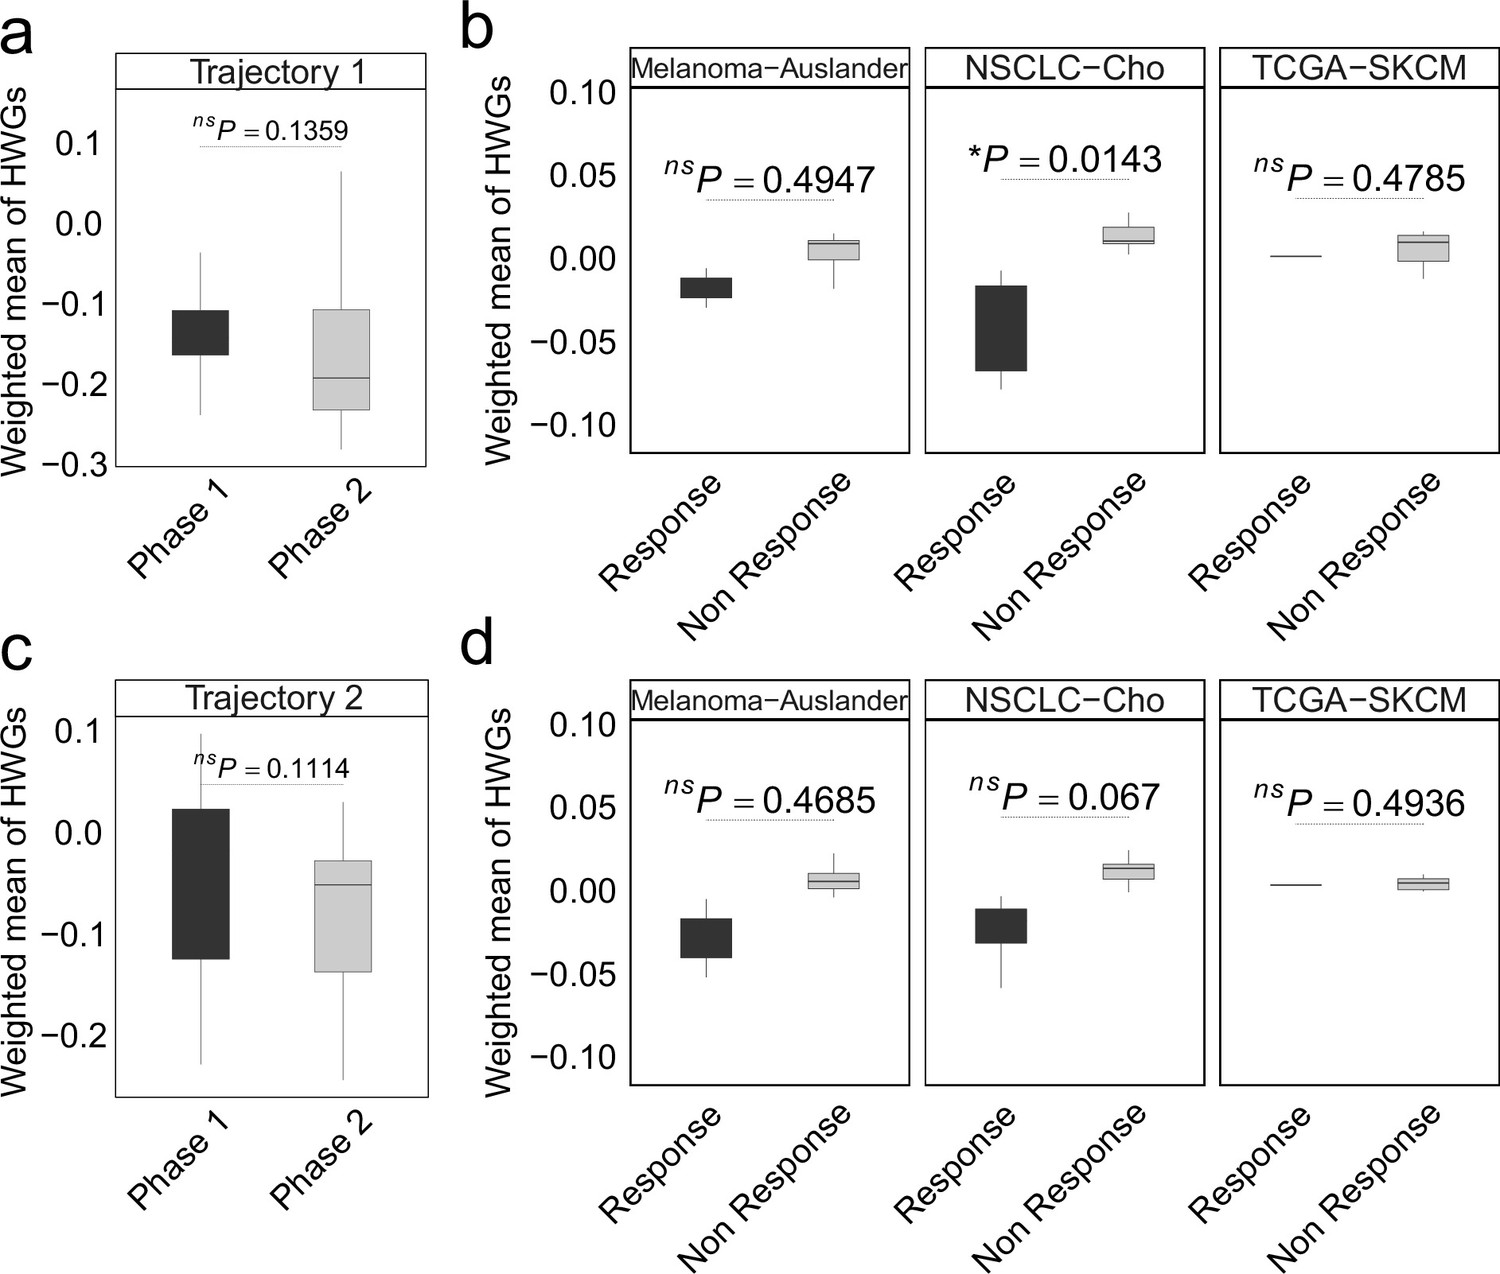
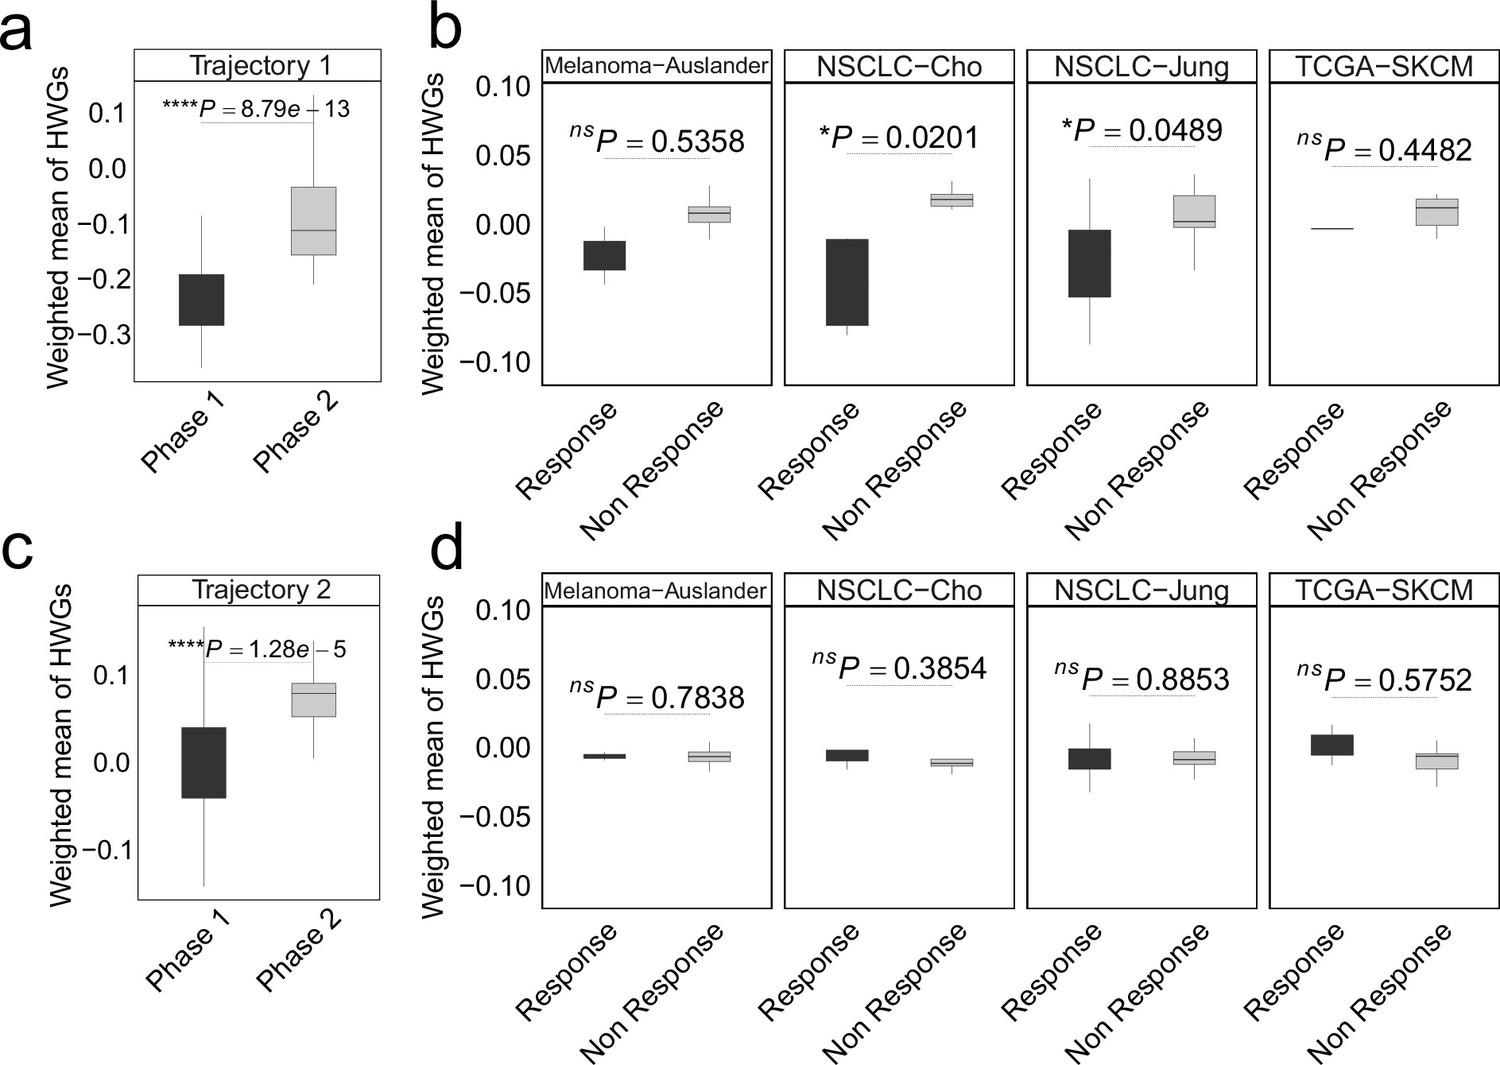
In non-small cell lung cancer (NSCLC), the weighted mean of highly weighted genes (HWG) from independent differentiation trajectories differs between phases (a, c) and immune checkpoint inhibitor (ICI) treatment groups.
(a-b) The HWG obtained from the first branching event. (c-d) The HWG obtained from the first branching event. In all box plots, the horizontal line represents the median value, and the whisker extends to the furthest data point within 1.5 times the interquartile range. Significance denoted as: ns, not significant, *p<0.05, two-sided unpaired Student’s t-test.
Figure 5—figure supplement 4
In colorectal cancer (CRC), the weighted mean of highly weighted genes (HWG) from independent differentiation trajectories differs between phases (a, c) and immune checkpoint inhibitor (ICI) treatment groups.
(a-b) The HWG obtained from the first branching event. (c-d) The HWG obtained from the first branching event. In all box plots, the horizontal line represents the median value, and the whisker extends to the furthest data point within 1.5 times the interquartile range. Significance denoted as: ns, not significant, *p<0.05, ****p<0.0001, two-sided unpaired Student’s t-test.
Figure 6 with 1 supplement
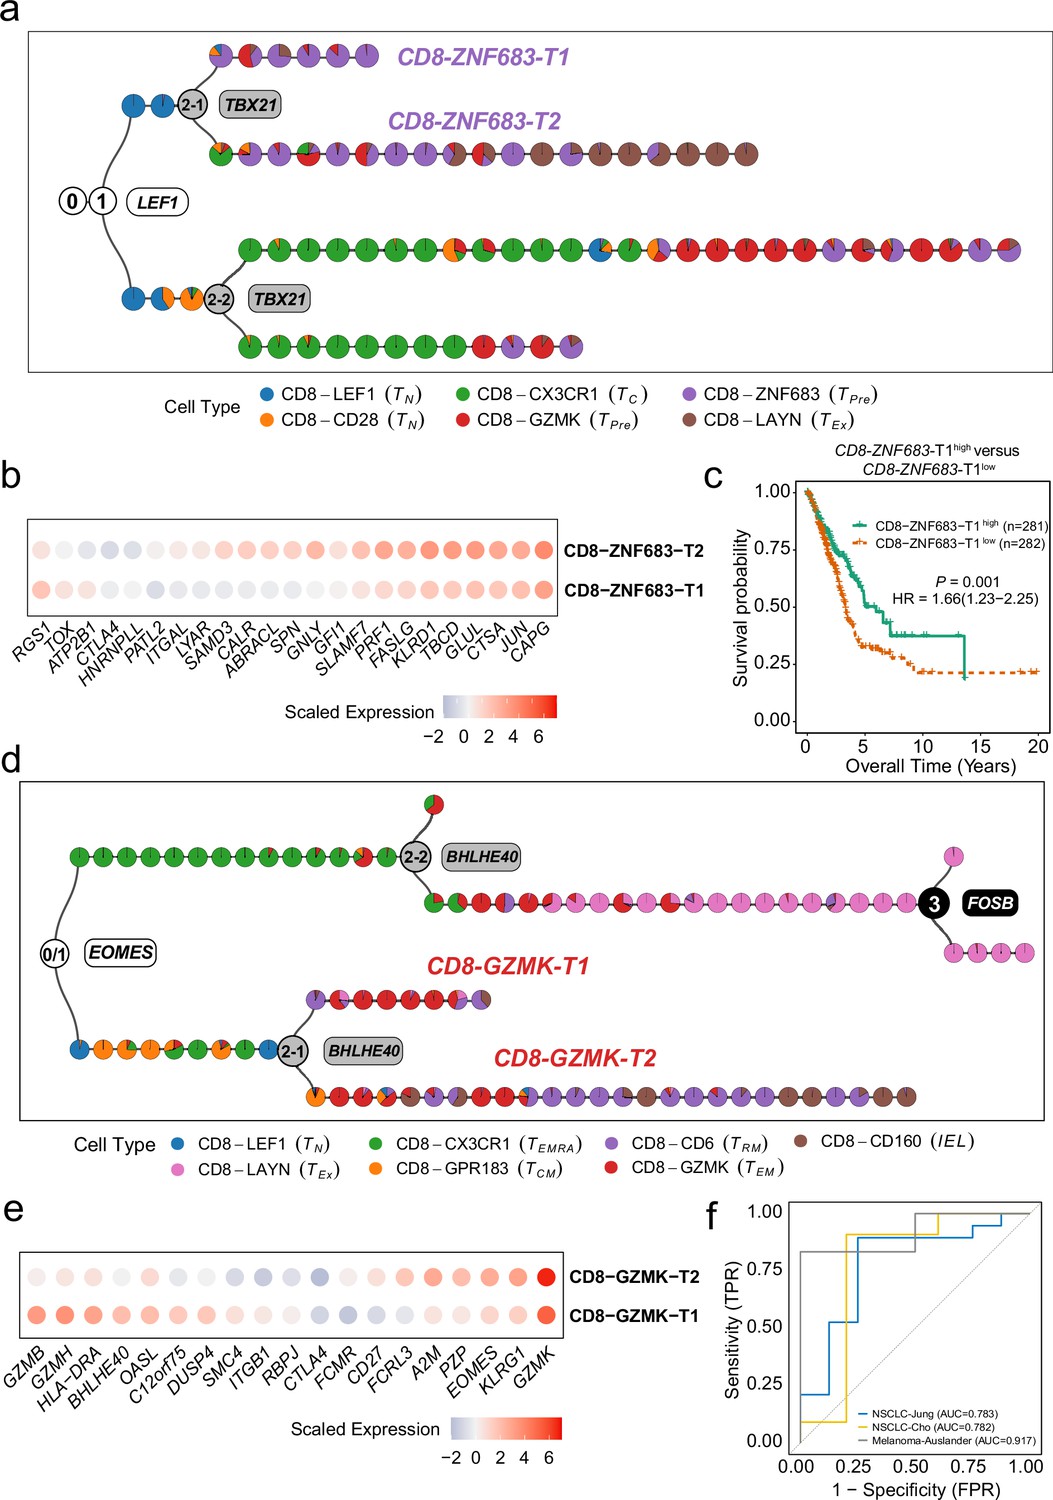
MGPfact serves as an effective approach for characterization of new cellular subtypes.
(a) The consensus trajectory of tumor-associated CD8+ T cells in non-small cell lung cancer (NSCLC) identified CD8-ZNF683-T1 and CD8-ZNF683-T2 as two subtypes of CD8-ZNF683, which are influenced by TBX21. (b) Selected differently expressed genes between CD8-ZNF683-T1 and CD8-ZNF683-T2 (|logfc|>0.25, adjusted p-value <0.1). (c) High expression of CD8-ZNF683-T1 signatures predicts good overall survival in the TCGA LUAD cohort (Methods). p-values were calculated through multivariate Cox regression analysis, and HR represents hazard ratio. (d) The consensus trajectory of tumor-associated CD8+ T cells in colorectal cancer (CRC) identified CD8-GZMK-T1 and CD8-GZMK-T2 as two subtypes of CD8-GZMK. (e) Selected differently expressed genes between CD8-GZMK-T1 and CD8-GZMK-T2 (|logfc|>0.25, adjusted p-value <0.1). (f) ROC curve showing high expression of CD8-GZMK-T1 signature associated with ICI treatment response in three independent studies. The consensus trajectory is formed by merging three bifurcation processes. Each colored circle represents a landmark (minimum unbiased representative points, MURP), indicating the cell type.
Figure 6—figure supplement 1

The CD8-GZMK-T1 scores between immune checkpoint inhibitor (ICI) treatment response groups (Methods).
In all box plots, the horizontal line represents the median value, and the whisker extends to the furthest data point within 1.5 times the interquartile range. Significance denoted as: ns, not significant, *p<0.05, two-sided unpaired Student’s t-test.
Author response image 1

Comparison of MGPfact with scTour and TIGON in trajectory inference performance across 239 test datasets.
(a) Overall scores; (b) F1branches; (c) HIM; (d) cordist; (e) wcorfeatures. All results are color-coded based on the trajectory types, with the black line representing the mean value. The “Overall” assessment is calculated as the geometric mean of all four metrics.
Author response image 2
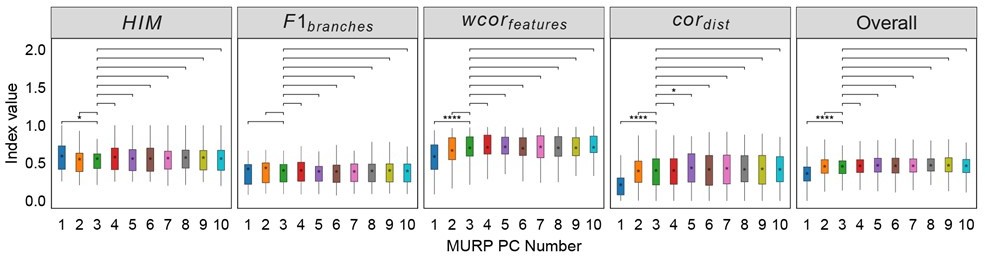
Robustness testing of the number of MURP PCA components on 100 training datasets.
With the number of principal components (PCs) set to 3 by default; we tested the impact of different number of components (1-10) on the prediction results. In all box plots, the asterisk represents the mean value, while the whiskers extend to the farthest data points within 1.5 times the interquartile range. Significance is denoted as follows: not annotated indicates non-significant; * P < 0.05; ** P < 0.01; *** P < 0.001; two-sided paired Student’s T-tests.
Tables
Table 1
MGPfact outperformed state-of-the-art methods in .
P-values based one-sided paired t-tests suggest that the scores of MGPfact were significantly higher than those of the other methods for different trajectory types in the test set.
| Trajectory Type | DPT | MonocleDDRTree | Monocle3 | scFates Tree | scShaper | TinGa | TSCAN |
|---|---|---|---|---|---|---|---|
| Acyclic Graph | 0.169 | 0.735 | 0.341 | 0.167 | 0.006 | 0.485 | 0.002 |
| Bifurcation | 0.559 | 0.001 | 0.015 | 0.298 | 0.010 | 0.772 | 0.002 |
| Convergence | 0.275 | 0.059 | 0.000 | 0.027 | 0.120 | 0.871 | 0.008 |
| Cycle | 0.000 | 0.000 | 0.002 | 0.114 | 0.991 | 0.659 | 0.982 |
| Disconnected Graph | 0.020 | 0.001 | 0.108 | 0.007 | 0.001 | 0.475 | 0.000 |
| Connected Graph | 0.053 | 0.214 | 0.114 | 0.285 | 0.005 | 0.057 | 0.001 |
| Linear | 0.000 | 0.000 | 0.000 | 0.000 | 1.000 | 0.000 | 0.980 |
| Multifurcation | 0.033 | 0.001 | 0.041 | 0.717 | 0.552 | 0.758 | 0.051 |
| Tree | 0.021 | 0.809 | 0.918 | 0.086 | 0.000 | 0.993 | 0.000 |
Table 2
Comparison of the explanatory power for CD8+ T cell fate for MGPfact and three other different methods.
Adjusted R-squared values and P-values based on F-tests demonstrate the relative performance of MGPfact, Monocle 2, Monocle 3, and scFates Tree in fitting the experimentally characterized and annotated CD8+ T cell subtypes.
| MGPfact | Monocle 2 | Monocle 3 | scFates Tree | ||||||
|---|---|---|---|---|---|---|---|---|---|
| Adjust R2 | p | Adjust R2 | p | Adjust R2 | p | Adjust R2 | p | ||
| NSCLC (GSE99254) | CD8-LEF1 | 0.935 | 0.000 | 0.176 | 0.000 | 0.089 | 0.08 | 0.902 | 0.000 |
| CD8-CD28 | 0.195 | 0.002 | 0.170 | 0.000 | 0.108 | 0.06 | 0.006 | 0.145 | |
| CD8-CX3CR1 | 0.634 | 0.000 | 0.259 | 0.000 | 0.629 | 0.000 | 0.882 | 0.000 | |
| CD8-GZMK | 0.259 | 0.000 | 0.189 | 0.000 | 0.855 | 0.000 | 0.547 | 0.000 | |
| CD8-ZNF683 | 0.232 | 0.001 | 0.051 | 0.043 | 0.625 | 0.003 | 0.039 | 0.003 | |
| CD8-LAYN | 0.435 | 0.000 | 0.031 | 0.027 | 0.503 | 0.018 | 0.523 | 0.000 | |
| CRC (GSE108989) | CD8-LEF1 | 0.311 | 0.000 | 0.027 | 0.036 | 0.461 | 0.007 | 0.99 | 0.000 |
| CD8-GPR183 | 0.380 | 0.000 | 0.032 | 0.025 | 0.474 | 0.006 | 0.139 | 0.000 | |
| CD8-CX3CR1 | 0.648 | 0.000 | 0.047 | 0.008 | 0.454 | 0.007 | 0.817 | 0.000 | |
| CD8-GZMK | 0.130 | 0.013 | 0.550 | 0.000 | 0.855 | 0.000 | 0.236 | 0.000 | |
| CD8-CD6 | 0.277 | 0.000 | 0.109 | 0.007 | 0.45 | 0.008 | 0.054 | 0.000 | |
| CD8-CD160 | 0.124 | 0.016 | 0.080 | 0.025 | 0.856 | 0.000 | 0.707 | 0.000 | |
| CD8-LAYN | 0.741 | 0.000 | 0.172 | 0.000 | 0.373 | 0.021 | 0.505 | 0.000 | |
Additional files
-
Supplementary file 1
The specific configuration of parameters contained in the model.
- https://cdn.elifesciences.org/articles/97424/elife-97424-supp1-v1.xlsx
-
Supplementary file 2
p-values associated with one-sided paired t-tests assess whether the performance score (across five metrics) of MGPfact is significantly higher than the other methods on the different trajectory types in test set.
- https://cdn.elifesciences.org/articles/97424/elife-97424-supp2-v1.xlsx
-
Supplementary file 3
Comparison of memory utilization (GB) and temporal efficiency (min).
- https://cdn.elifesciences.org/articles/97424/elife-97424-supp3-v1.xlsx
-
Supplementary file 4
The highly weighted genes associated with independent bifurcating processes in microglia development (absolute gene weight >0.05).
- https://cdn.elifesciences.org/articles/97424/elife-97424-supp4-v1.xlsx
-
Supplementary file 5
List of genes specifically expressed in homeostatic microglia (HM).
PAM-T1 cells (n=113) vs. PAM-T2 cells (n=298), two-sided moderated t-test with limma.
- https://cdn.elifesciences.org/articles/97424/elife-97424-supp5-v1.xlsx
-
Supplementary file 6
Comparison of the explanatory power for CD8+ T cell fate for MGPfact and three other different methods.
Adjusted R-squared values and p-values based on F-tests demonstrate the relative performance of MGPfact, Monocle 2, Monocle 3, and scFates Tree in fitting the experimentally characterized and annotated CD8+ T cell subtypes.
- https://cdn.elifesciences.org/articles/97424/elife-97424-supp6-v1.xlsx
-
Supplementary file 7
The highly weighted genes associated with the CD8+ T cell-independent bifurcating processes in non-small cell lung cancer (NSCLC) (absolute gene weight >0.05).
- https://cdn.elifesciences.org/articles/97424/elife-97424-supp7-v1.xlsx
-
Supplementary file 8
The highly weighted genes associated with the CD8+ T cell-independent bifurcating processes in colorectal cancer (CRC) (absolute gene weight >0.05).
- https://cdn.elifesciences.org/articles/97424/elife-97424-supp8-v1.xlsx
-
Supplementary file 9
GO Enrichment Analysis Results for Highly Weighted Genes Associated with Trajectory 1 of non-small cell lung cancer (NSCLC) (Benjamini–Hochberg-adjusted p-value <0.05).
- https://cdn.elifesciences.org/articles/97424/elife-97424-supp9-v1.xlsx
-
Supplementary file 10
GO Enrichment Analysis Results for Highly Weighted Genes Associated with Trajectory 1 of colorectal cancer (CRC) (Benjamini–Hochberg-adjusted p-value <0.05).
- https://cdn.elifesciences.org/articles/97424/elife-97424-supp10-v1.xlsx
-
Supplementary file 11
List of genes specifically expressed in CD8-ZNF683.
CD8-ZNF683-T1 cells (n=204) vs. CD8-ZNF683-T2 cells (n=395), two-sided moderated t-test with limma.
- https://cdn.elifesciences.org/articles/97424/elife-97424-supp11-v1.xlsx
-
Supplementary file 12
List of genes specifically expressed in CD8-GZMK.
CD8-GZMK-T1 cells (n=155) vs. CD8-GZMK-T2 cells (n=221), two-sided moderated t-test with limma.
- https://cdn.elifesciences.org/articles/97424/elife-97424-supp12-v1.xlsx
-
MDAR checklist
- https://cdn.elifesciences.org/articles/97424/elife-97424-mdarchecklist1-v1.docx
Download links
A two-part list of links to download the article, or parts of the article, in various formats.
Downloads (link to download the article as PDF)
Open citations (links to open the citations from this article in various online reference manager services)
Cite this article (links to download the citations from this article in formats compatible with various reference manager tools)
A model-based factorization method for scRNA data unveils bifurcating transcriptional modules underlying cell fate determination
eLife 13:RP97424.
https://doi.org/10.7554/eLife.97424.3


