Sir2 and Fun30 regulate ribosomal DNA replication timing via MCM helicase positioning and nucleosome occupancy
- Translational Science and Therapeutics Division, Human Biology Division, Fred Hutchinson Cancer Center, United States
- Department of Biochemistry and Department of Medicine, University of Washington, United States
Figures
Figure 1 with 1 supplement
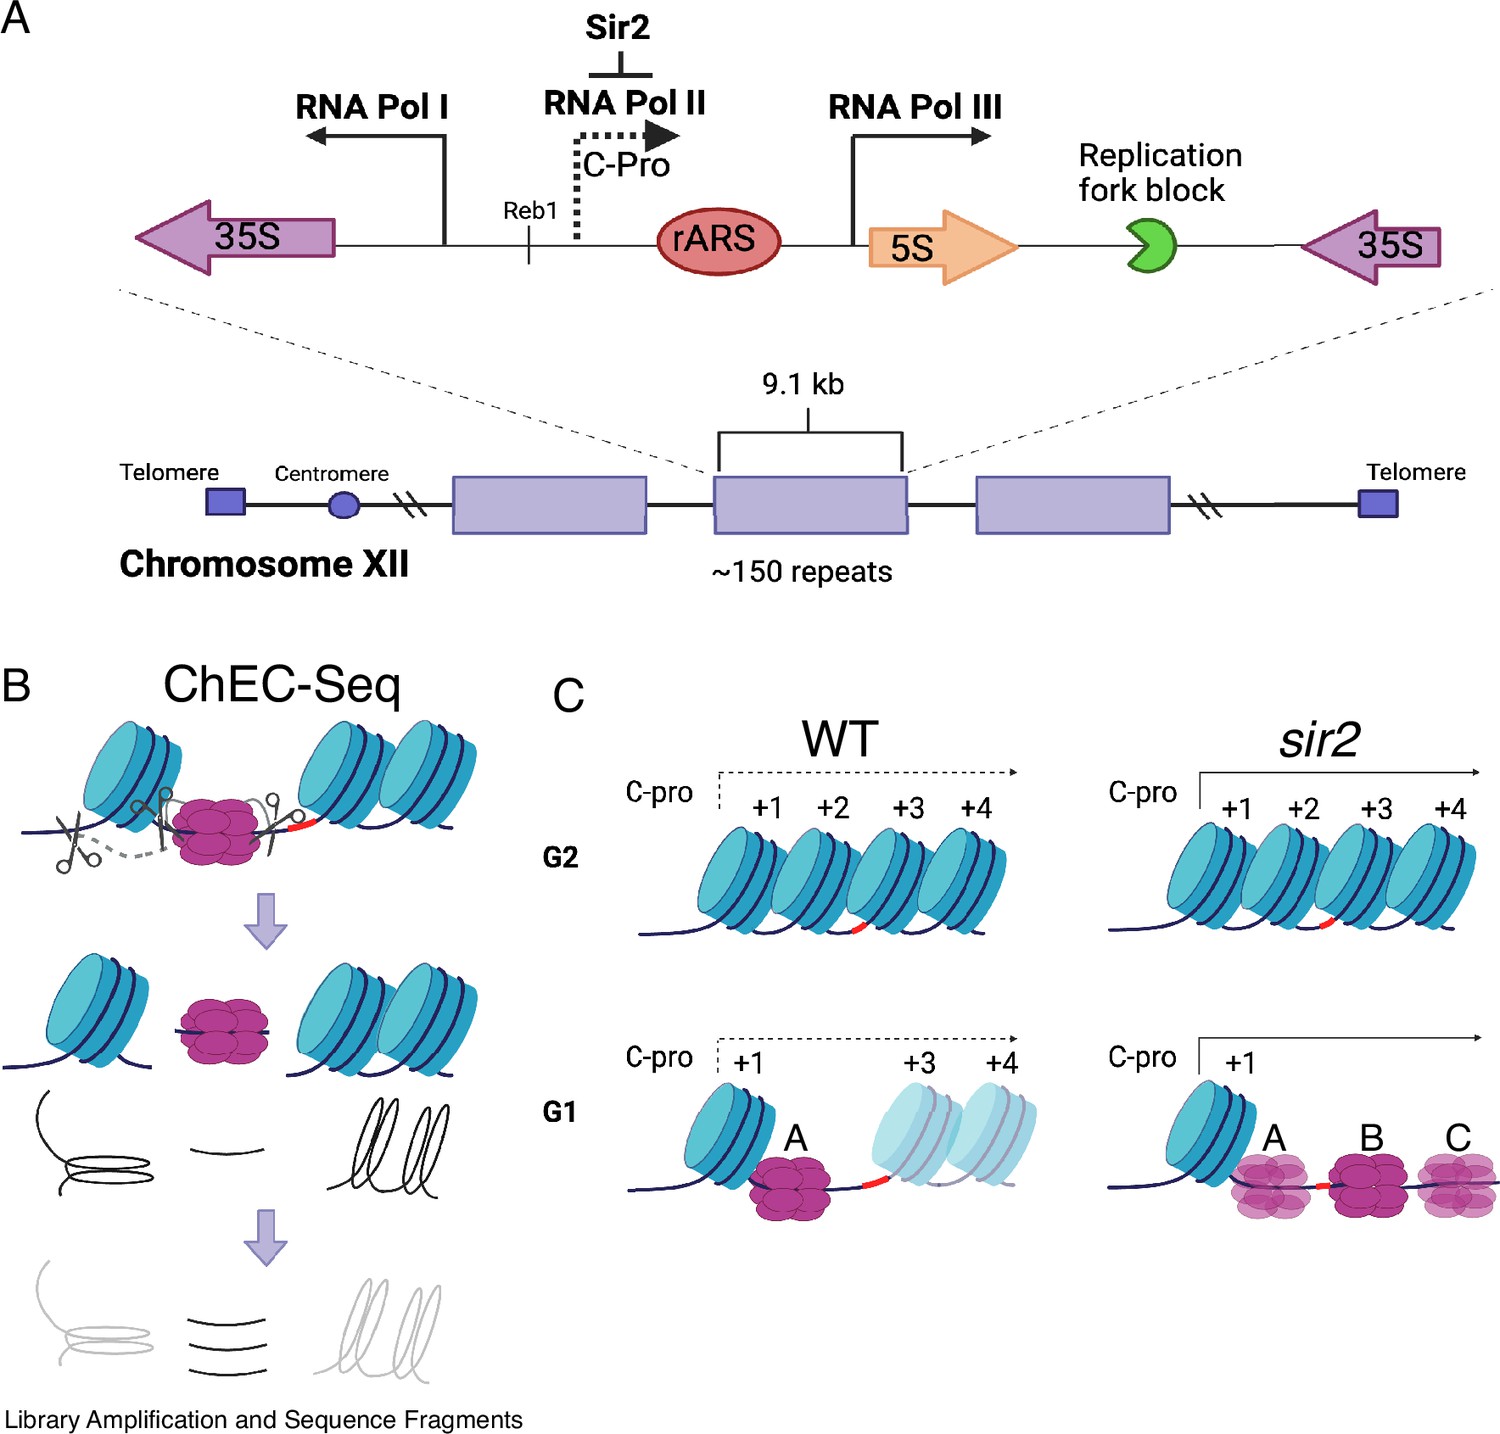
Ribosomal DNA (rDNA) structure, chromatin endogenous cleavage (ChEC), and MCM displacement in sir2.
(A) The 1.4 megabase rDNA region on chromosome XII is composed of approximately one hundred and fifty 9.1 kb repeats. Each repeat encodes both the 35S and 5S ribosomal RNAs (rRNA), which are transcribed by RNA polymerase I (PolI) and RNA polymerase III (PolIII), respectively. The ribosomal origin of replication (rARS) is located between the 5' ends of these genes. The C-pro transcript, which is suppressed by Sir2, initiates approximately 200 base pairs from the rARS. The unidirectional replication fork block, which functions to prevent collision between replication and transcription machinery, is depicted in green. The probe used in Southern blots in Figure 3 to assess licensing is marked by *. (B) In ChEC-seq, micrococcal nuclease (MNase; depicted as scissors) is fused to the protein of interest, in this case MCM2. The double-hexameric MCM helicase complex, MCM2-7, is depicted in purple, and nucleosomes are in blue. Cleavage is induced by addition of calcium to permeabilized cells. Due to the proximity of nucleosome entrance and exit sites, MCM2-ChEC can reveal not only the binding site of the MCM complex but also that of the adjacent nucleosome. (C) Depiction of nucleosomes and MCM complex in wild-type and sir2 in G1 and G2. Nucleosomes are numbered with respect to C-pro transcription. De-repression of C-pro transcription in sir2 causes RNA PolII to displace the MCM complex to the right. The three different MCM helicase complexes depicted in the bottom right panel are intended to convey the three most prominent locations for the complex in sir2; this is not intended to indicate that there is ever more than one MCM complex in the same rDNA repeat. Created with BioRender.com.
Figure 1—figure supplement 1

Computer-generated visualization of nondisplaced and displaced MCM complexes, as determined by MCM2-chromatin endogenous cleavage (ChEC).
Sequencing reads from G1 cultures processed for MCM2-ChEC for wild-type (16747) (left) and sir2 (16769) (right) were plotted according to genomic location (x-axis) and library insert size (y-axis), with read depths indicated by color intensity. Note that these images are not agarose gels. The signal generated from inserts in the 50–100 base pair range (y-axis) reflects the MCM complexes, whereas the signal from inserts in the 150–200 base pair range reflects the +1 nucleosome (see main text). De-repression of C-pro transcription in sir2 causes RNA PolII to push the MCM helicase complex from its normal location (arrow labeled ‘1’) to the right, with the most prominent signals arising at the sites indicated by arrows labeled ‘2’ and ‘3’. Note that the presence of multiple MCM footprints in these composite images does not indicate the presence of multiple MCM complexes in any individual repeat.
-
Figure 1—figure supplement 1—source data 1
Source data for Figure 1—figure supplement 1.
- https://cdn.elifesciences.org/articles/97438/elife-97438-fig1-figsupp1-data1-v1.zip
Figure 2 with 3 supplements
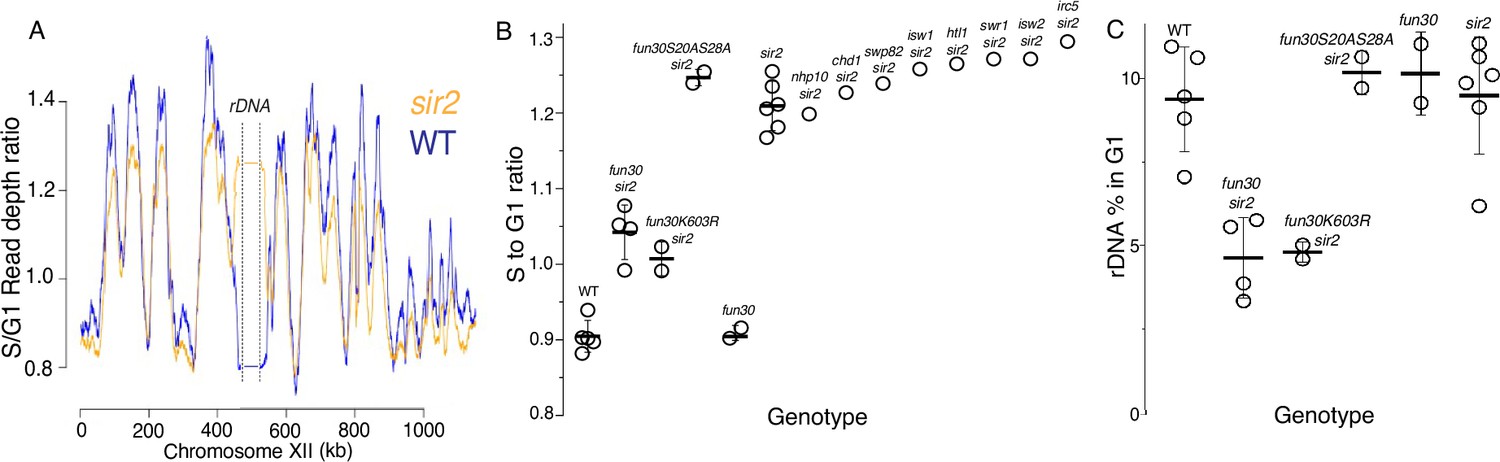
S-seq applied to ribosomal DNA (rDNA) replication timing and copy number determination.
(A) S-seq replication profile of Chromosome XII. The region in the middle noted as the rDNA has been collapsed. Note that the rDNA replicates much earlier in sir2 (16559) (orange) than in wild-type (16535) (blue). (B) rDNA replication timing in double mutants between sir2 and various chromatin remodeling enzymes: nhp10 (16729), chd1 (16725), swp82 (17061), isw1 (16724), htl1 (17059), swr1 (16728), isw2 (16673), and irc5 (16723). fun30-S20A S28A (17113 and 17114) is non-phosphorylatable, and fun30-K603R (17345 and 17346) is catalytically inactive. The S to G1 ratio values (mean ± SD) were 0.90±0.02 for WT, 1.04±0.04 for fun30sir2 (16909), 1.01±0.02 for fun30K603R, and 1.21±0.03 for sir2 (p<0.001 for WT vs sir2, sir2 vs fun30 sir2, and sir2 vs fun30K603Rsir2 using t-test). (C) Effect of sir2 and fun30 mutation on rDNA size, as determined from the fraction of G1 sequencing reads that arise from 450 to 470 kb on chrXII. The values (% mean ± SD) were 9.4±1.6 for WT, 4.6±1.2 for fun30sir2, 4.8±0.3 for fun30K603R, and 9.2±1.8 for sir2 (p<0.001 for WT vs sir2, sir2 vs fun30sir2, and sir2 vs fun30K603R sir2 using t-test).
-
Figure 2—source data 1
Source data for plots displayed in Figure 2A–C.
These files contain read depths arranged according to coordinate (1 row per coordinate) and library fragment size (columns) which correspond to the x and y axes, respectively, of each figure.
- https://cdn.elifesciences.org/articles/97438/elife-97438-fig2-data1-v1.zip
Figure 2—figure supplement 1

Ribosomal DNA (rDNA) size as determined by qPCR.
rDNA size for multiple isolates from each genotype were determined by qPCR, as described (Materials and methods). Control strains with 35 (EK342) and 180 (EK68) copies of the rDNA were generated in fob1 backgrounds to ensure copy number stability and were used as standards. Copy numbers were 160±7, 156±7, 38±3, and 147±7 for wild-type (WT) (14141), sir2 (16668), sir2 fun30 (17263), and fun30 (17248), respectively (p<0.001 by t-test for sir2 vs sir2fun30).
-
Figure 2—figure supplement 1—source data 1
Source data for the plot displayed in Figure 2—figure supplement 1.
- https://cdn.elifesciences.org/articles/97438/elife-97438-fig2-figsupp1-data1-v1.zip
Figure 2—figure supplement 2

Changes in ribosomal DNA (rDNA) size of fob1 strains with continuous passaging.
Changes in rDNA size with passaging for 0 (closed circles), 60 (open circles), and 120 (open triangles) generations were determined by qPCR, as described (Materials and methods) for the following genotypes (strain numbers in parentheses): fob1 fun30 (17476), fob1 sir2 fun30 (17548), fob1 (17549), and fob1 sir2 (17562). Control strains with 35 (EK342) and 180 (EK68) copies of the rDNA repeat were used as standards. The copy numbers (mean ± SD) at 0, 60, and 120 divisions for different genotypes were as follows: 204±21, 191±22, and 203±14 for fob1 (p NS by two-tailed t-test for any pairwise comparison); 208±29, 190±27, and 218±11 for sir2 fob1 (p NS by t-test for any pairwise comparison); 152±8, 107±22, and 85±8 for sir2 fun30 fob1 (p<0.001 by t-test for any pairwise comparison); and 231±7, 225±28, and 199±48 for fun30 fob1 (p NS by t-test for any pairwise comparison).
-
Figure 2—figure supplement 2—source data 1
Source data for the plot displayed in Figure 2—figure supplement 2.
- https://cdn.elifesciences.org/articles/97438/elife-97438-fig2-figsupp2-data1-v1.zip
Figure 2—figure supplement 3
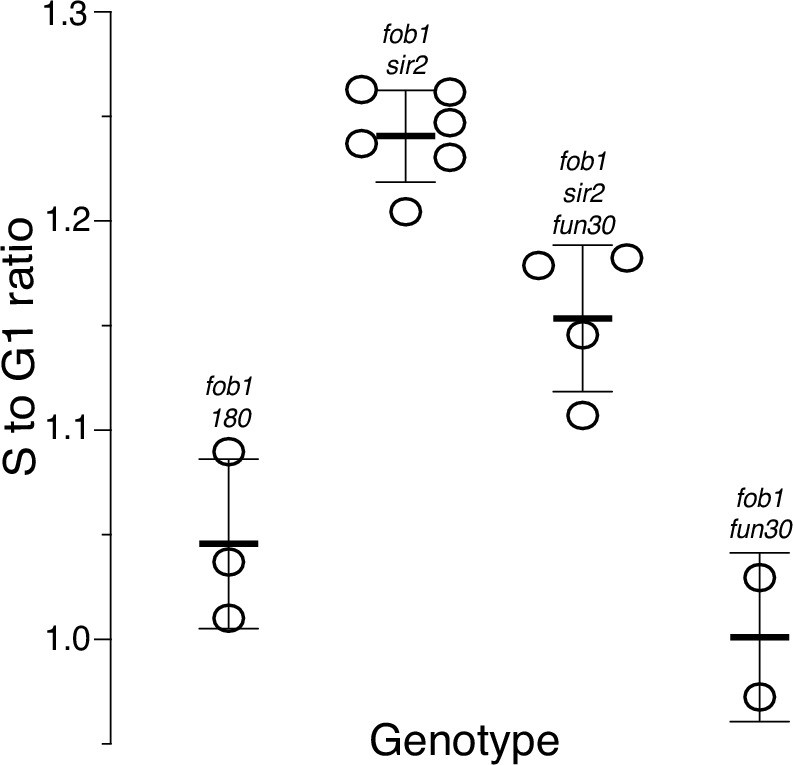
Ribosomal DNA (rDNA) replication timing in fob1 strains.
Relative timing (Trel) of replication of the rDNA was determined as described in the main text. A value of 1 indicates that replication occurred at the genome-wide average; higher or lower values reflect earlier or later replication, respectively. Strains numbers used were as follows: fob1 (16630, 17549, and 17550), fob1 sir2 (17561), fob1 sir2 fun30 (17548), and fob1 fun30 (17477 and 17542). Trel values (mean ± SD) were 1.05±0.04 for fob1, 1.24±0.02 for fob1 sir2, 1.15±0.04 for fob1 sir2 fun30, and 1.00±0.04 for fob1 fun30; p<0.01 by t-test for fob1 sir2 vs fob1 sir2 fun30 and for fob1 vs fob1 sir2.
-
Figure 2—figure supplement 3—source data 1
Source data for the plot displayed in Figure 2—figure supplement 3.
- https://cdn.elifesciences.org/articles/97438/elife-97438-fig2-figsupp3-data1-v1.zip
Figure 3 with 1 supplement

Licensing at the rARS, as determined by Southern blot.
Activation of MCM-micrococcal nuclease (MNase) in G1-arrested wild-type (WT) (16747), sir2 (16769), sir2fun30 (17257), and fun30 (17256) cells at the rARS with calcium will eliminate the 3.5 kb XmnI fragment (upper panel). PIK1, a single-copy gene in which we detect no MCM binding, is used as a loading control. Normalized ARS1200 band intensity at 15 m is expressed relative to time 0. Quantitation of the uncut band was used to infer relative ribosomal DNA (rDNA) array size in sir2 fun30 mutant at 0.35 relative to WT.
-
Figure 3—source data 1
PDF file containing original Southern blots displayed in Figure 3 indicating the relevant bands, treatments and band sizes.
- https://cdn.elifesciences.org/articles/97438/elife-97438-fig3-data1-v1.zip
-
Figure 3—source data 2
Original files for Southern blot analysis displayed in Figure 3.
- https://cdn.elifesciences.org/articles/97438/elife-97438-fig3-data2-v1.zip
-
Figure 3—source data 3
Quantification of bands in Southern blots and calculations of MCM loading displayed in Figure 3.
- https://cdn.elifesciences.org/articles/97438/elife-97438-fig3-data3-v1.xlsx
Figure 3—figure supplement 1

Licensing at the rARS using Southern blot (replica of Figure 3).
Activation of MCM-micrococcal nuclease (MNase) in G1-arrested cells. PIK1 serves as a loading control. Normalized ARS1200 band intensity at 15 min is expressed relative to time 0. Quantitation of the uncut band was used to infer relative ribosomal DNA (rDNA) array size in sir2 fun30 mutant at 0.38 relative to wild-type (WT).
-
Figure 3—figure supplement 1—source data 1
PDF file containing original Southern blots displayed in Figure 3—figure supplement 1 indicating the relevant bands and treatments.
- https://cdn.elifesciences.org/articles/97438/elife-97438-fig3-figsupp1-data1-v1.zip
-
Figure 3—figure supplement 1—source data 2
Original files for Southern blot analysis displayed in Figure 3—figure supplement 1.
- https://cdn.elifesciences.org/articles/97438/elife-97438-fig3-figsupp1-data2-v1.zip
-
Figure 3—figure supplement 1—source data 3
Quantification of bands in Southern blots and calculations of MCM loading (Figure 3—figure supplement 1).
- https://cdn.elifesciences.org/articles/97438/elife-97438-fig3-figsupp1-data3-v1.xlsx
Figure 4
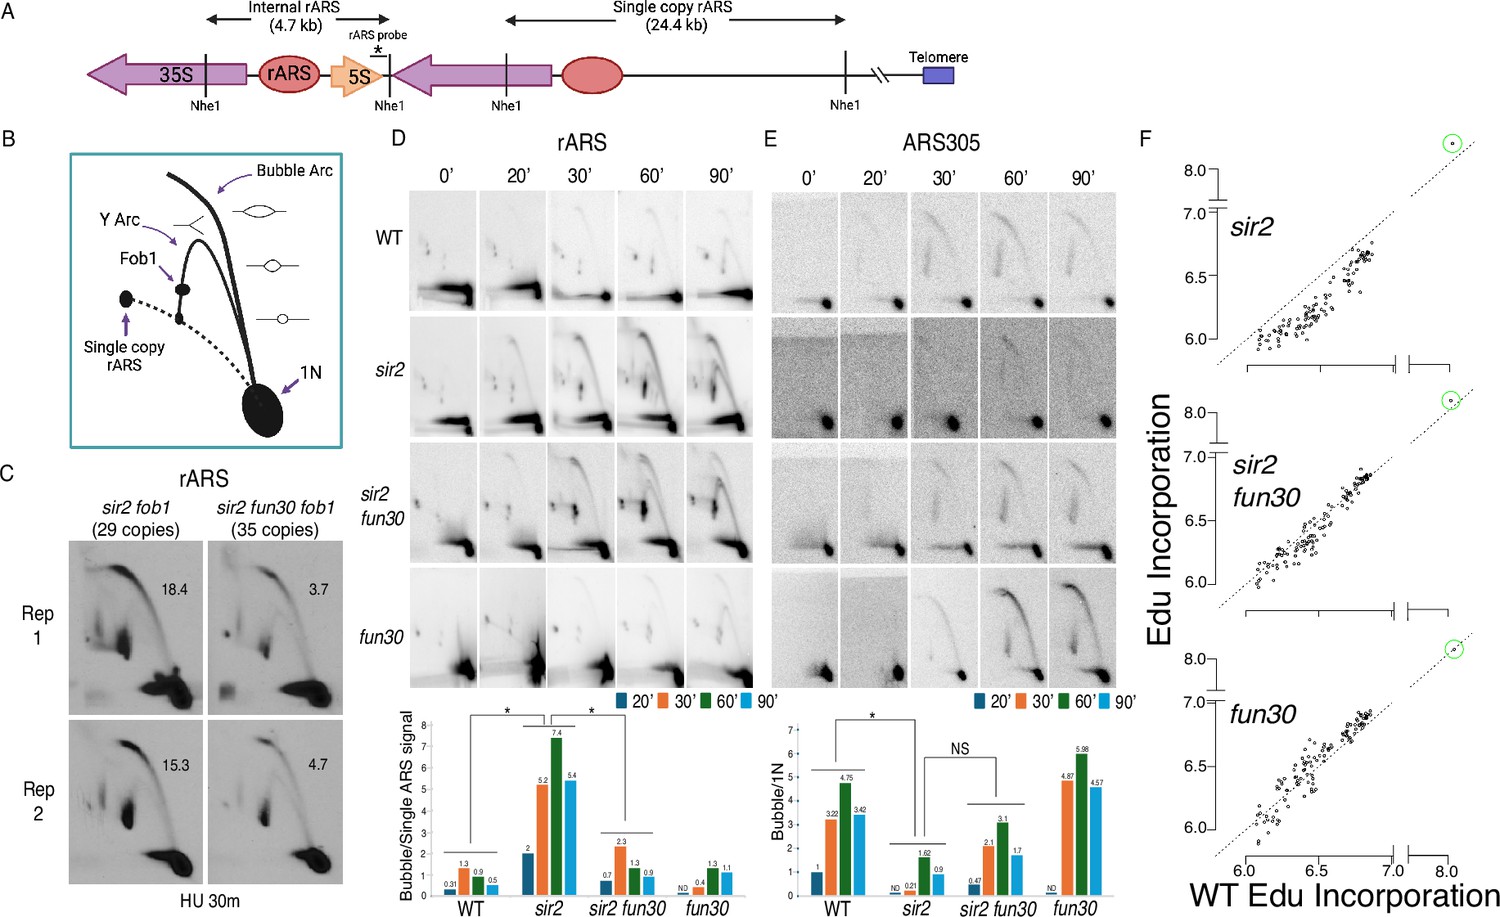
Deletion of FUN30 suppresses origin activity at ribosomal DNA (rDNA) and promotes it elsewhere in the genome.
(A) Schematic of the right end of the rDNA locus depicting Nhe1 cut sites. Digestion with Nhe1 releases multiple copies of a 4.7 kb rARS-containing internal fragment (1N) and a single copy of a 24.4 kb fragment that contains the rightmost rDNA origin. (B) Diagram of replication structures detected by two-dimensional (2D) gel. (C) Replicas of 2D gels showing replication at the rDNA locus 30 min after release from alpha factor into hydroxyurea (HU) in sir2 fob1 (17564) or sir2 fun30 fob1 (17556) strains with short (29 copies and 35 copies, respectively) rDNA arrays. Numbers indicate the ratio of bubble arc to single copy ARS signal, reflecting the number of activate origins per cell. The average number of activate origins (mean ± SD) for sir2 fob1 is 16.9±2.2 vs 4.2±0.7 (p<0.05 by t-test). (D) 2D gels showing replication at the rDNA. Cells were arrested in G1 with alpha factor and then released into medium containing 200 mM HU. Quantitation of the ratio of bubble arc to 24.4 kb single-copy rARS is shown below. * indicates significant differences (p≤0.05 as determined by comparing combined signals from all four time points by Student’s t-test). Strain numbers used were as follows: wild-type (16747), sir2 (16769), sir2 fun30 (17257), and fun30 (17256). (E) Replication of ARS305 was examined as in D, but the 1N spot was used for normalization and ratios of bubble arc to 1N spot were normalized to this ratio for the 20 min time point in wild-type. (F) Ethynyl-deoxy-uridine (EdU) incorporation at 111 early origins 1 hr after release from G1 into medium containing 200 mM HU. Total genome-wide read counts in each sample were normalized to the number of reads in the sample with the highest total, thereby normalizing numbers to genome-wide incorporation of EdU. Each dot represents a single origin, with read depths summed across a 5 kb window centered on the MCM binding site within each origin. Points are plotted according to EdU signal in wild-type on the x-axis and in the mutant in question on the y-axis. Suppression of origin activity is reflected in points dropping below the dotted line at 45°. The rARS is circled in green. Strain numbers used were as follows: wild-type (17265), sir2 (17271), sir2 fun30 (17279), and fun30 (17281).
-
Figure 4—source data 1
PDF file containing original Southern blots displayed in Figure 4C indicating the relevant bands and treatments.
- https://cdn.elifesciences.org/articles/97438/elife-97438-fig4-data1-v1.zip
-
Figure 4—source data 2
Original files for Southern blot analysis displayed in Figure 4C.
- https://cdn.elifesciences.org/articles/97438/elife-97438-fig4-data2-v1.zip
-
Figure 4—source data 3
Calculations of bubble to single-ARS ratios shown in Figure 4C.
- https://cdn.elifesciences.org/articles/97438/elife-97438-fig4-data3-v1.zip
-
Figure 4—source data 4
PDF file containing original Southern blots of two-dimensional (2D) gels displayed in Figure 4C and D indicating the relevant genotypes and time points for rARS and ARS305.
- https://cdn.elifesciences.org/articles/97438/elife-97438-fig4-data4-v1.zip
-
Figure 4—source data 5
Original files for Southern blot analysis displayed in Figure 4C and D.
- https://cdn.elifesciences.org/articles/97438/elife-97438-fig4-data5-v1.zip
-
Figure 4—source data 6
Calculations of bubble to 1N ratios plotted in bar graphs in Figure 4C and D.
- https://cdn.elifesciences.org/articles/97438/elife-97438-fig4-data6-v1.zip
-
Figure 4—source data 7
Source data for plots in Figure 4F and statistical analysis of MCM abundance.
- https://cdn.elifesciences.org/articles/97438/elife-97438-fig4-data7-v1.zip
Figure 5 with 6 supplements
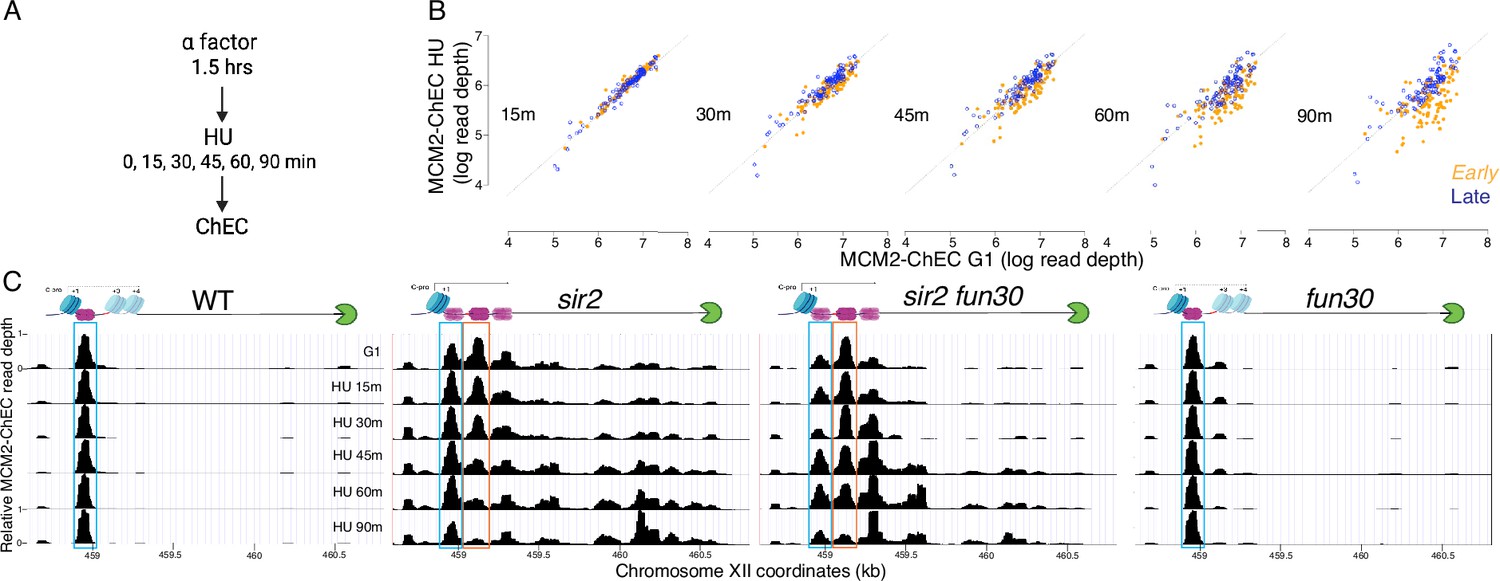
Disappearance of MCM2-chromatin endogenous cleavage (ChEC) signal can be used to monitor origin firing.
(A) Cells were synchronized in G1 phase using alpha factor for 1.5 hr before being released into media supplemented with hydroxyurea (HU). Cells were harvested at various time points post-release (15–90 min) and subjected to MCM2-ChEC analysis. (B) Decrease in MCM2-ChEC signal in wild-type (16747) for 111 early (orange) and 101 late (blue) origins. MCM2-ChEC signal was quantified over 200 base pair windows centered on the MCM binding site within each origin. Each point is plotted according to MCM2-ChEC signal at the time point in question on the y-axis and the corresponding signal in G1 on the x-axis, thus decrease in signal appears as a drop below the 45° diagonal. (C) MCM signal at the ribosomal DNA (rDNA). MCM2-ChEC signal in G1 appears predominantly at the location indicated by the blue rectangle seen in wild-type (16747) and fun30 (17256), whereas it is spread across both the blue and orange rectangles in the absence of Sir2. The displaced MCM2-ChEC signal (orange rectangle) in sir2 (16769) disappears more rapidly than its nondisplaced counterpart, and this effect is suppressed by fun30 (17257). Decrease of MCM2-ChEC signal at the rARS is accompanied by increased signal to the right.
-
Figure 5—source data 1
Source data for plots in Figure 5B, Figure 5—figure supplement 1.
- https://cdn.elifesciences.org/articles/97438/elife-97438-fig5-data1-v1.zip
-
Figure 5—source data 2
Source data for plots in Figure 5C.
- https://cdn.elifesciences.org/articles/97438/elife-97438-fig5-data2-v1.zip
Figure 5—figure supplement 1

Quantification of MCM2-chromatin endogenous cleavage (ChEC) signal at 111 early (orange) and 101 late (blue) origins as cells progress through S phase (quantitation of Figure 5B).
Cells were arrested in G1, released into medium containing 200 mM hydroxyurea (HU), and analyzed by MCM2-ChEC-seq at different time points. Total genome-wide read counts for each sample were normalized to the genome-wide read counts for the sample with the highest count. Strain is the same one used in Figure 5B. At each time point, we used Student’s t-test to determine MCM2-ChEC signal was different between early and late origins. Significance of two-tailed t-tests are abbreviated as ‘NS’ (not significant), ** (p≤0.01), *** (p≤0.001), and **** (p≤0.0001).
-
Figure 5—figure supplement 1—source data 1
Statistical analysis of data plotted in Figure 5—figure supplement 1.
- https://cdn.elifesciences.org/articles/97438/elife-97438-fig5-figsupp1-data1-v1.zip
Figure 5—figure supplement 2
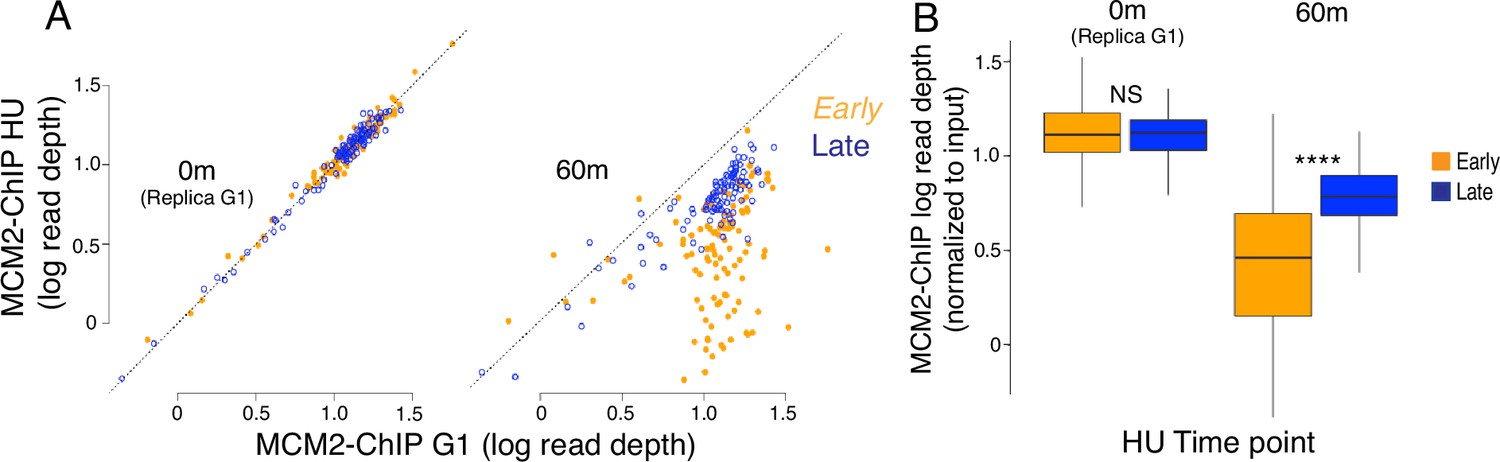
Quantitation of early and late origins using MCM2-chromatin immunoprecipitation (ChIP).
ChIP of FLAG-tagged MCM2 was used to measure levels of 111 early and 101 late origins in G1 and 60 min after release from G1 into medium containing 200 mM hydroxyurea (HU). Analysis was performed as done with MCM2-chromatin endogenous cleavage (ChEC) in Figure 5B, Figure 5—figure supplement 1. (A) The MCM2-ChIP signal over a 200 base pair window at 111 early (orange) and 101 late (blue) origins in wild-type (WT) (17558) G1-arrested cells is compared to the signal in cells released into hydroxyurea for 60 min. The signal at early origins diminishes more than the signal at late origins. (B) Box plots for MCM2-ChIP signal at early and late origins. p-Values by two-tailed t-test for the signal abundance at early vs late origins: **** (p≤0.0001).
-
Figure 5—figure supplement 2—source data 1
Source data for plots in Figure 5—figure supplement 2.
- https://cdn.elifesciences.org/articles/97438/elife-97438-fig5-figsupp2-data1-v1.zip
Figure 5—figure supplement 3
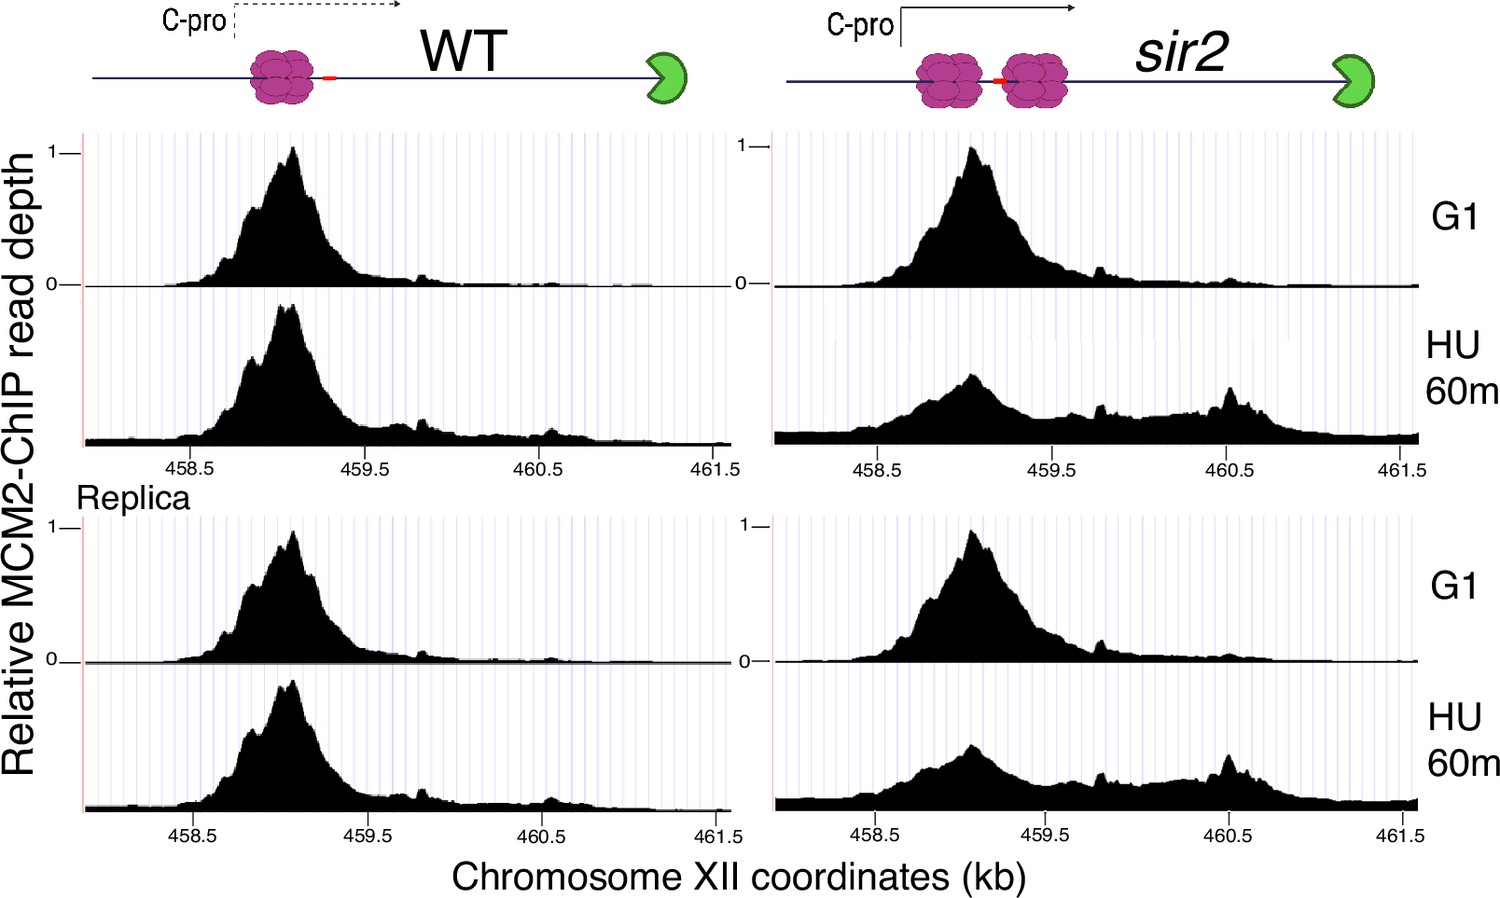
Change in localization of MCM2-chromatin immunoprecipitation (ChIP) signal at the ribosomal DNA (rDNA) with progression from G1 into S phase.
Wild-type (left; strain 17558) and sir2 (right; strain 17559) cells with FLAG-tagged MCM2 were arrested in G1 prior to release into media containing 200 mM hydroxyurea (HU) and analyzed by ChIP. Relative MCM2-CHIP read depth is plotted according to chrXII coordinates. Diagrams at top show MCM double-hexamers in purple, the replication fork barrier (RFB) in green, and the location of the C-pro transcript, either transcribed (solid line) or repressed (dotted line).
Figure 5—figure supplement 4
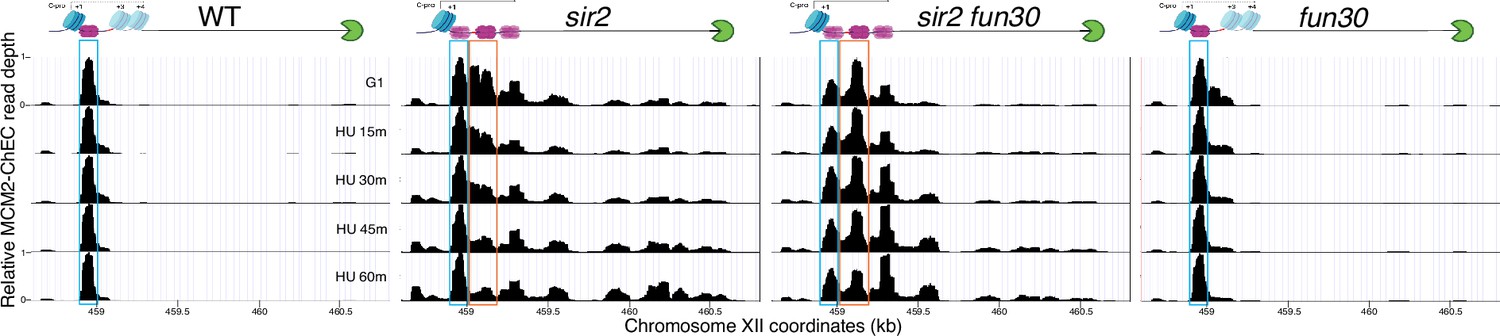
Deletion of FUN30 suppresses activation of the displaced MCM complex at the ribosomal DNA (rDNA) (replica of results in Figure 5C).
Each panel shows MCM2-chromatin endogenous cleavage (ChEC) data for cultures that were arrested in G1 and then released into medium containing 200 mM hydroxyurea (HU). Nondisplaced and displaced MCM complexes are indicated by blue and orange rectangles, respectively. MCM2-ChEC data were quantified for the 51–100 base pair size range. Strains are the same as those used in Figure 5C. Diagrams at top show MCM double-hexamers in purple, the replication fork barrier (RFB) in green, nucleosomes in blue, and the location of the C-pro transcript, either transcribed (solid line) or repressed (dotted line).
-
Figure 5—figure supplement 4—source data 1
Source data for plots in Figure 5—figure supplement 4.
- https://cdn.elifesciences.org/articles/97438/elife-97438-fig5-figsupp4-data1-v1.zip
Figure 5—figure supplement 5

Displaced MCM complex is activated early in wild-type (WT).
Enlarged region from Figure 5C shows that, although only a small proportion of MCM complexes are displaced in WT (16747), this displaced population, indicated by arrows, is activated early, as is the case with in sir2 (16769). Cartoons at top show nucleosomes in blue, MCM double-hexamers in purple, C-pro transcription, or lack thereof, as solid or dotted lines, respectively.
Figure 5—figure supplement 6

C-pro transcript levels.
C-pro transcript levels in G1-arrested cells in sir2 (16316), sir2 fun30 (16727), and fun30 (16711) were measured in triplicate using qPCR and expressed relative to wild-type (WT) (14141). All values are normalized to ribosomal DNA (rDNA) array size. *** denotes p<0.001 for comparison with WT using t-test.
-
Figure 5—figure supplement 6—source data 1
Source data for plots in Figure 5—figure supplement 6.
- https://cdn.elifesciences.org/articles/97438/elife-97438-fig5-figsupp6-data1-v1.zip
Figure 6 with 1 supplement
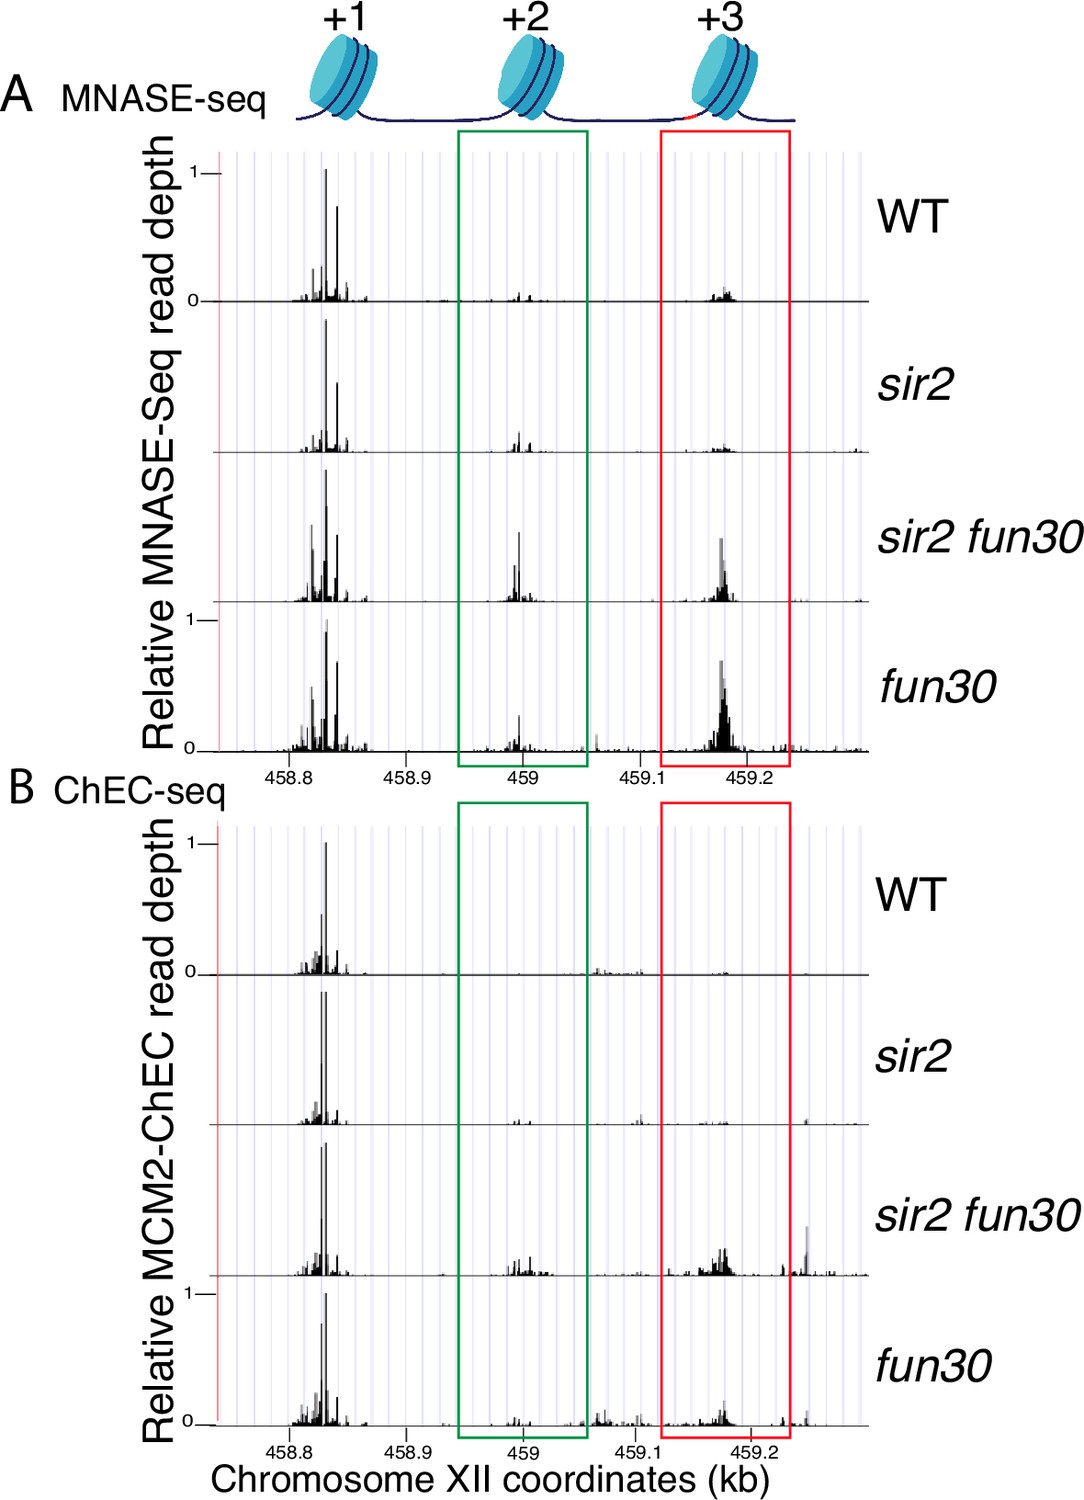
Nucleosome occupancy assessed by micrococcal nuclease (MNase)-seq and MCM2-chromatin endogenous cleavage (ChEC).
(A) Analysis of nucleosome occupancy at ribosomal DNA (rDNA) origins using MNase-seq revealed a consistent high occupancy of the +1 nucleosome across wild-type (WT) (16747), sir2 (16769), sir2 fun30 (17257), and fun30 (17256), which served as our normalization reference. Occupancy at the +2 (green box) and +3 (red box) positions was increased by deletion of FUN30 in both sir2 and SIR2. MCM2-ChEC signal was quantified specifically from the 151–200 base pair (nucleosome) size range. (B) Analysis of nucleosome occupancy with MCM2-ChEC (see Figure 1B) reveals nucleosome occupancy in that subset of cells and rDNA repeats in which MCM is present. Deletion of FUN30 leads to increased occupancy at the +2 and +3 positions in a sir2 background. MCM2-ChEC signal was quantified specifically from the 151–200 base pair (nucleosome) size range.
-
Figure 6—source data 1
Source data for plots in Figure 6.
- https://cdn.elifesciences.org/articles/97438/elife-97438-fig6-data1-v1.zip
Figure 6—figure supplement 1
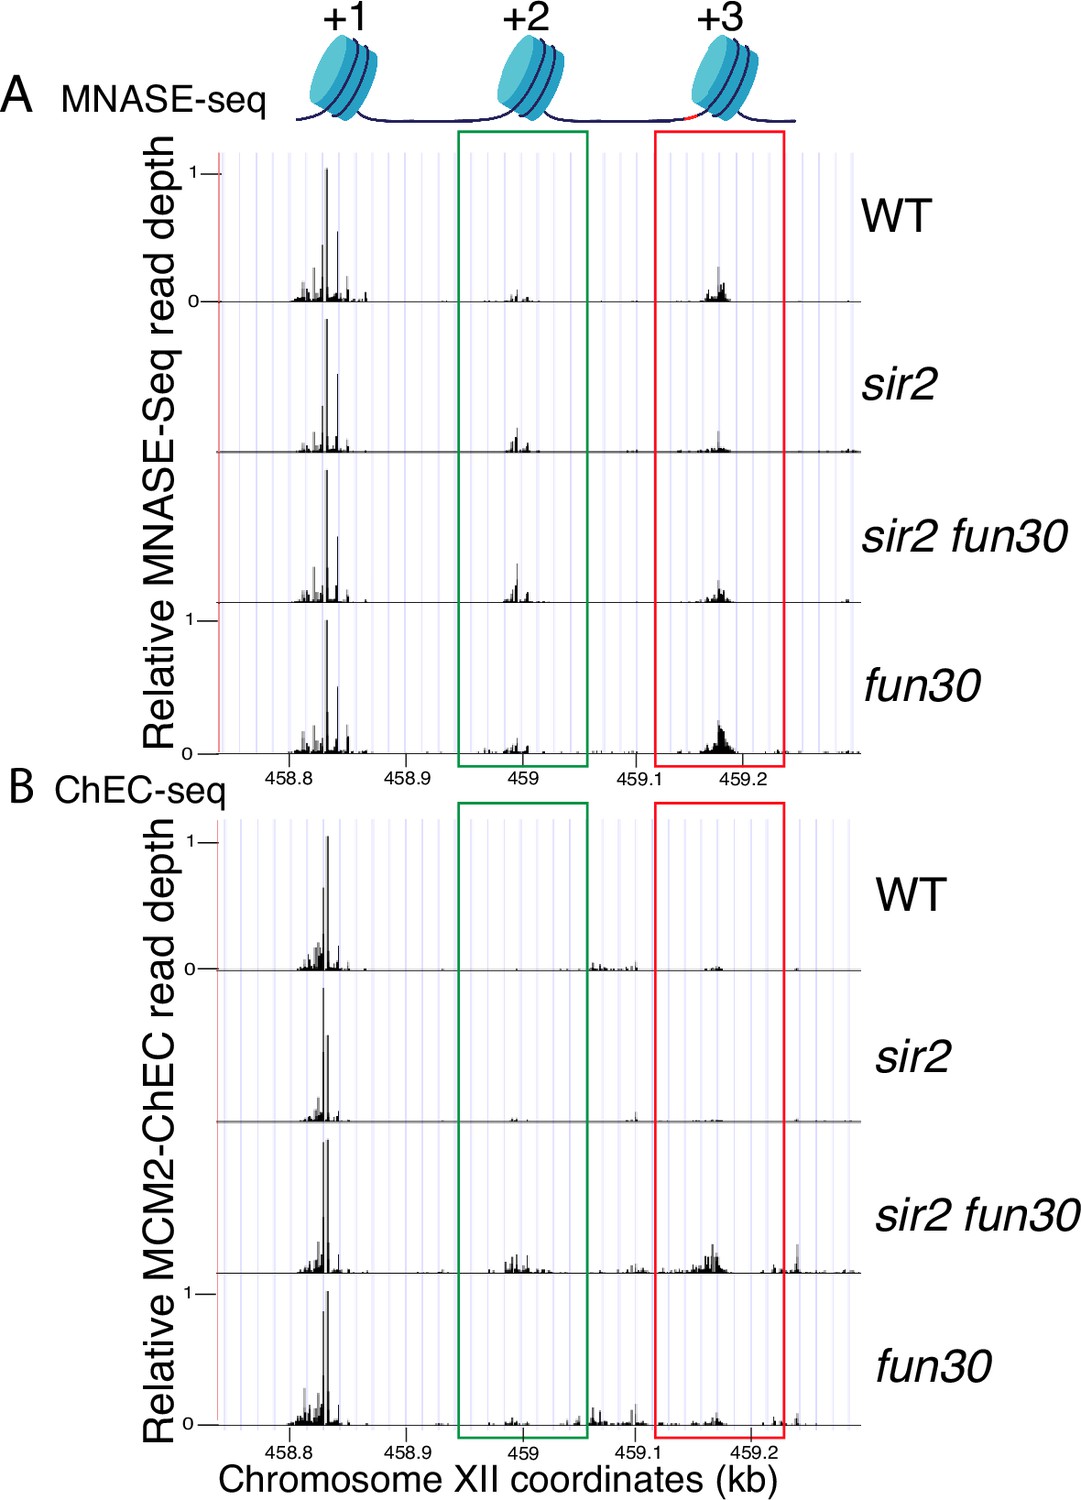
Nucleosome occupancy assessed by micrococcal nuclease (MNase)-seq and MCM2-chromatin endogenous cleavage (ChEC) (replica of Figure 6).
(A) MNase-seq analysis of nucleosome occupancy at ribosomal DNA (rDNA) origins. Deletion of FUN30 increased occupancy at +2 (green) and +3 (red) positions in both sir2 and SIR2 backgrounds. Strains are the same as those used in Figure 6. (B) MCM2-ChEC analysis confirmed that FUN30 deletion increases +2 and +3 nucleosome occupancy in a sir2 background.
-
Figure 6—figure supplement 1—source data 1
Source data for plots in Figure 6—figure supplement 1.
- https://cdn.elifesciences.org/articles/97438/elife-97438-fig6-figsupp1-data1-v1.zip
Figure 7
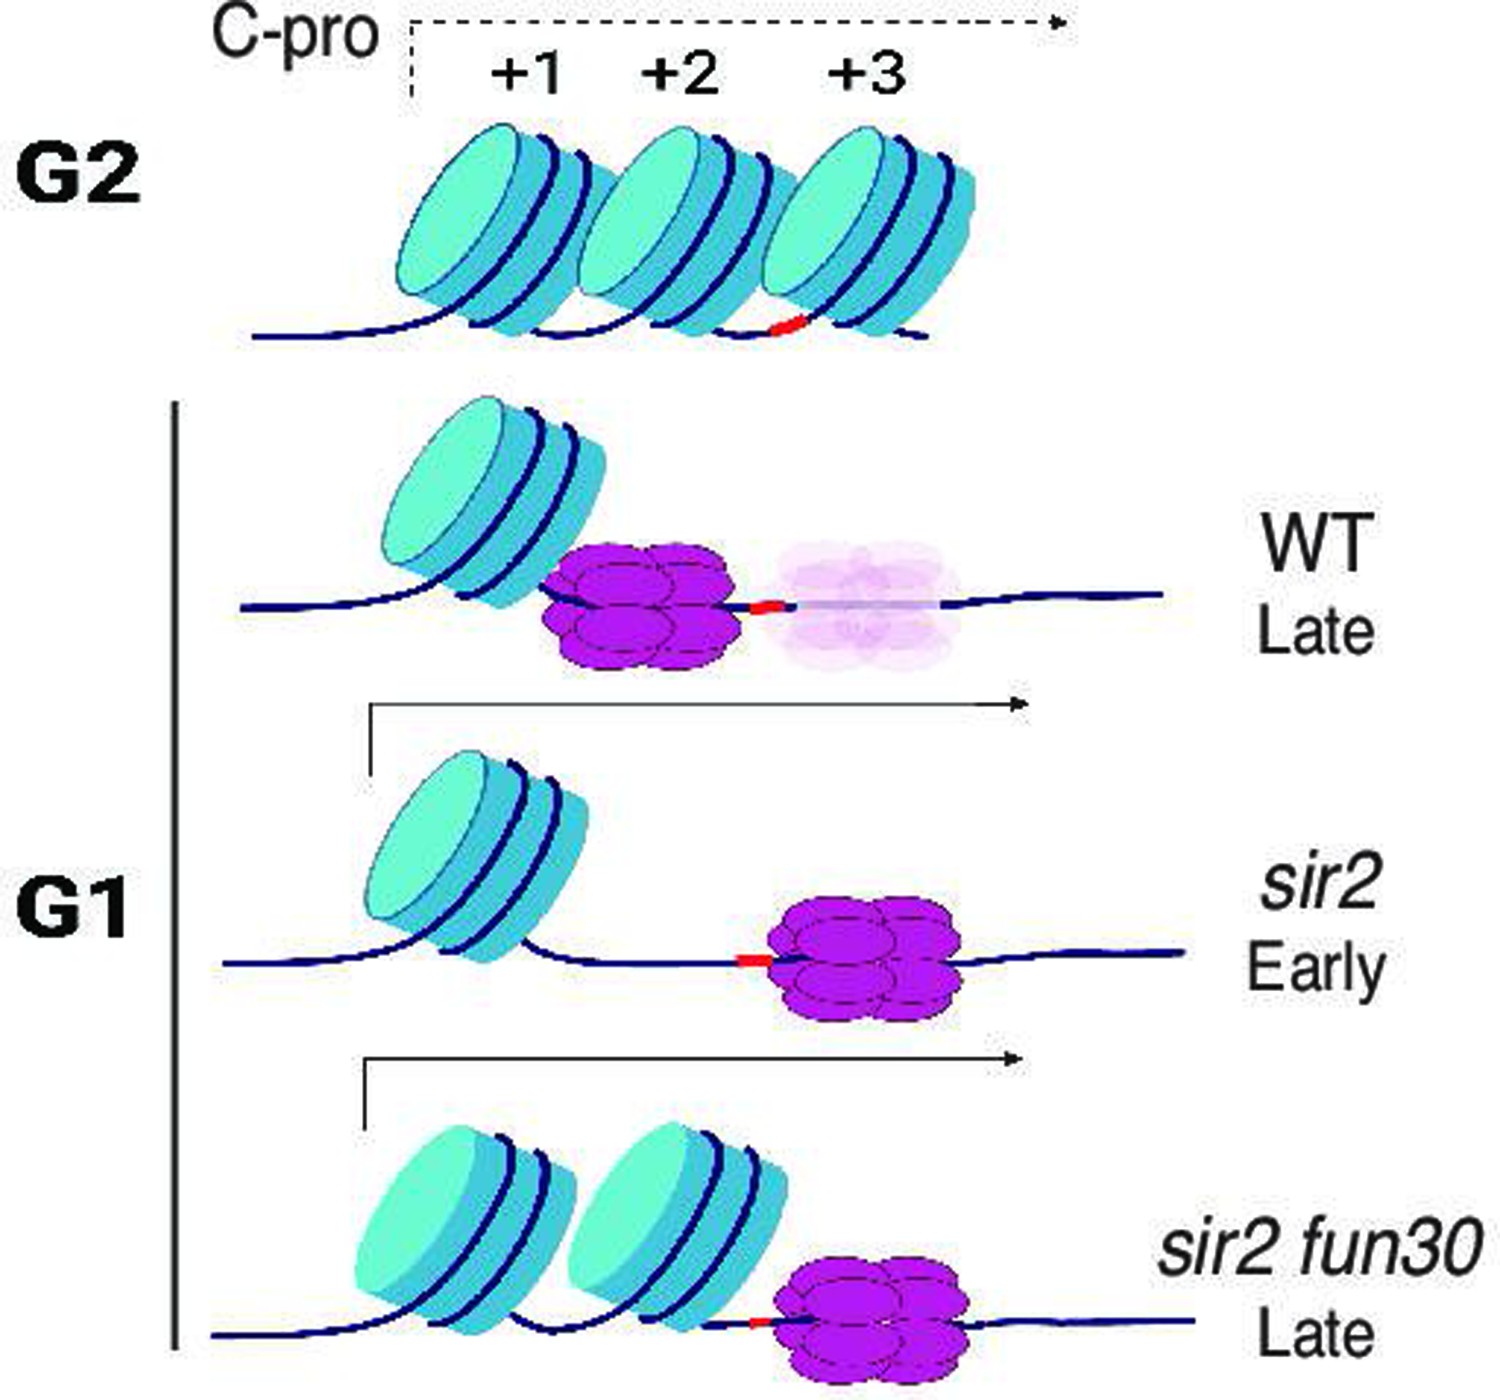
Model for relationship between MCM location and replication timing at the ribosomal DNA (rDNA).
MCM helicase complex (purple ovals) in wild-type abuts the +1 nucleosome (blue cylinder) in G1, making it relatively resistant to activation. Deletion of SIR2 de-represses C-pro transcription (arrow pointing to the right), and RNA PolII pushes MCM complex to a nucleosome-free area, where it is more prone to activation. Deletion of FUN30 in a sir2 mutant leads to increased nucleosome occupancy at the +2 position, adjacent to MCM complex, making this complex resistant to activation. Short red stretch of DNA (e.g. between +2 and +3 nucleosomes in top row) indicates ARS consensus sequence (ACS). ‘Ghost’ Mcm complex in wild-type indicates the small fraction of Mcm that is displaced even in wild-type cells (see Figure 5—figure supplement 5). Created with BioRender.com.
Additional files
-
MDAR checklist
- https://cdn.elifesciences.org/articles/97438/elife-97438-mdarchecklist1-v1.pdf
-
Supplementary file 1
Table with the description of the yeast strains.
- https://cdn.elifesciences.org/articles/97438/elife-97438-supp1-v1.xlsx
-
Supplementary file 2
Table with primer sequences.
- https://cdn.elifesciences.org/articles/97438/elife-97438-supp2-v1.xlsx
Download links
A two-part list of links to download the article, or parts of the article, in various formats.
Downloads (link to download the article as PDF)
Open citations (links to open the citations from this article in various online reference manager services)
Cite this article (links to download the citations from this article in formats compatible with various reference manager tools)
Sir2 and Fun30 regulate ribosomal DNA replication timing via MCM helicase positioning and nucleosome occupancy
eLife 13:RP97438.
https://doi.org/10.7554/eLife.97438.4


