Microglia aging in the hippocampus advances through intermediate states that drive activation and cognitive decline
- Department of Anatomy, University of California, San Francisco, United States
- Department of Physical Therapy and Rehabilitation Science, University of California San Francisco, United States
- Bakar Aging Research Institute, University of California, San Francisco, United States
Figures
Figure 1 with 2 supplements

Hippocampal microglia exhibit progressive age-related transcriptional inflammatory activation.
(A) UMAP plot of microglia separated into transcriptional clusters (n=1 pool of five animals for each age). (B) Superimposition of ages onto the UMAP plot with dashed lines signifying relative cluster demarcation. (C) Percent composition of each cluster by age. (D) Dotplot of expression of cluster markers sorted by age. Percent of cells expressing the gene and average normalized expression are represented. (E) Violin plots of genes with dynamic age-related expression patterns. (F) Representative images and quantification of C1q (yellow), C3 (red), and Iba1 (cyan) staining in the hilus and molecular layer (ML) of 6- and 24-month-old mice (n=4–5 mice per group; mixed effects analysis followed by Dunnett’s multiple comparisons; *p<0.05, **p<0.01, ****p<0.0001). (G) Number of differentially expressed genes from the 6-month timepoint at each age. Bars above the intersect represent increased expression and those below represent decreased expression. (H) The average expression change at all ages for genes differentially regulated genes at individual ages represented by the color scheme in (B, I, J, K), Volcano plots of differentially expressed genes in microglia between 6 and 12 months (I), 6 and 18 months (J), and 6 and 24 months (K) and corresponding gene ontology analysis of genes with significantly increased (brown) or decreased (green) expression for each comparison. Data are shown as mean ± s.e.m.
Figure 1—figure supplement 1
Hippocampal microglia exhibit age-related heterogeneity during aging.
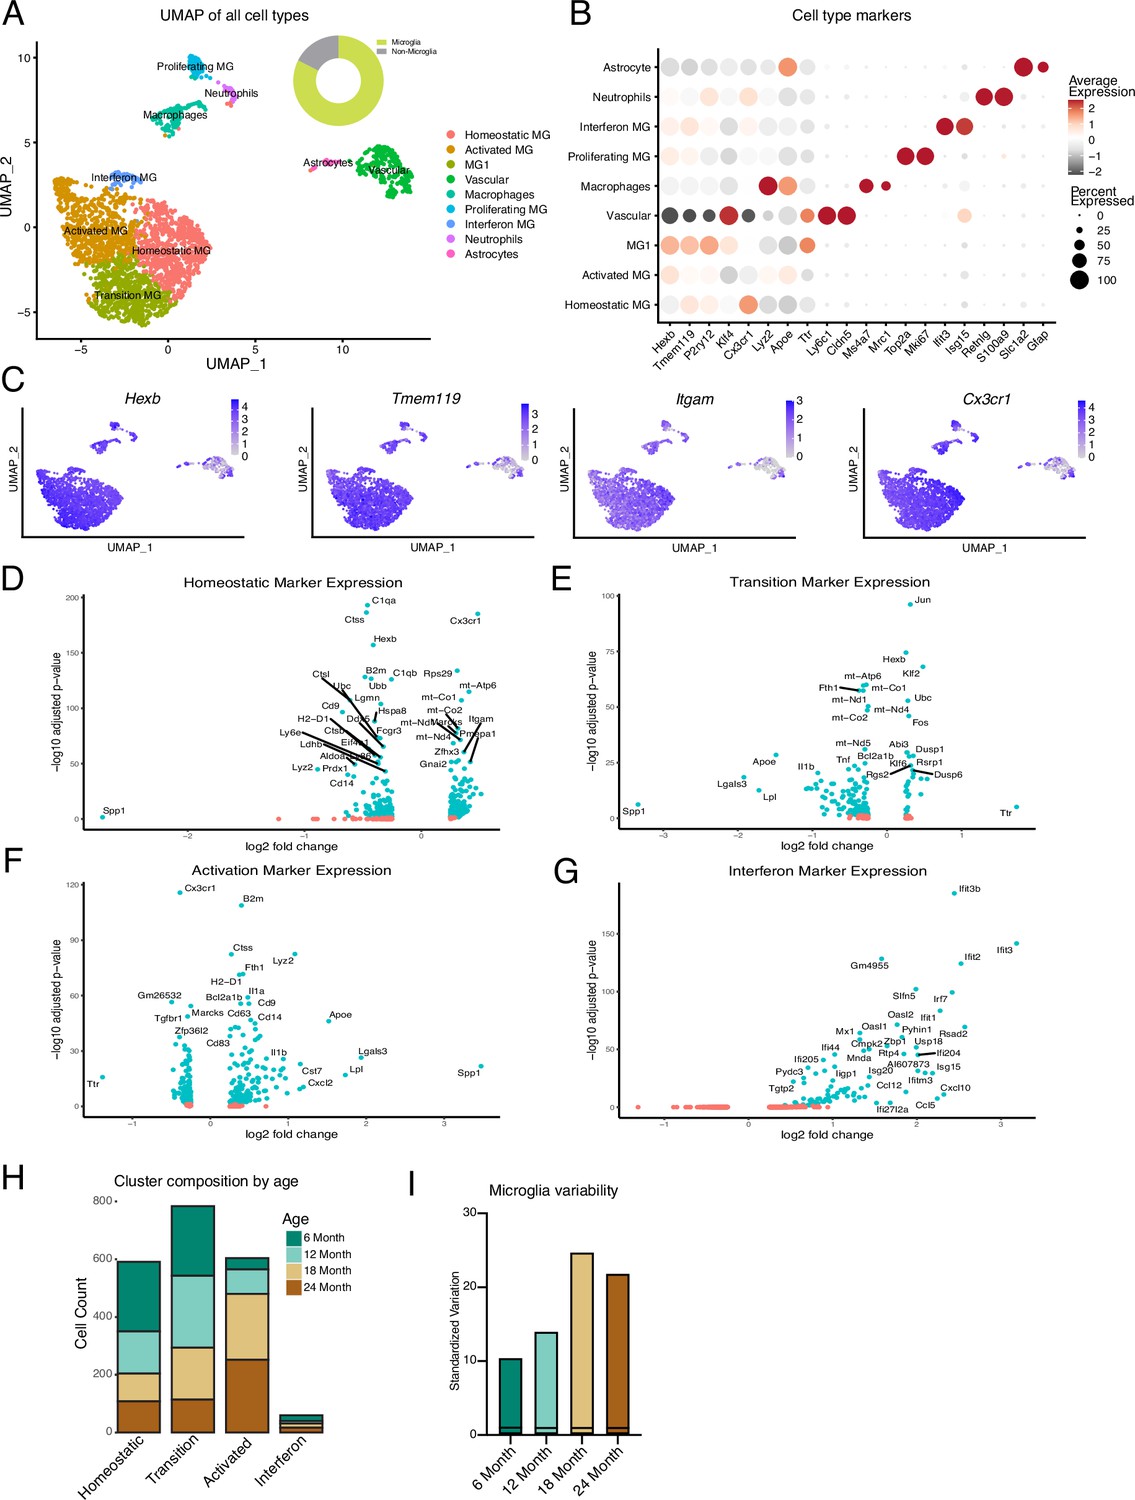
(A) UMAP plot of all Cd11b+ cells. Several adjacent clusters of microglia were identified, as well as a cluster of proliferating microglia. Smaller populations of peripheral immune cell types – macrophages and neutrophils – were identified. Clusters of astrocytes and vascular cells were also found. Overall, greater than 82% of cells were microglia (n=1 pool of five animals for each age). (B) Dotplot showing expression (average expression and percent of cells expressing) of top two markers for each cluster. (C) UMAP plots with expression levels of microglia markers superimposed onto cells. Notice that peripheral immune cells express microglia markers; however, they are distinguished from microglia based on marker expression from (B). (D–G) Volcano plots of differential gene expression for the clusters identified in Figure 1A compared to every other cluster for homeostatic (D), transition (E), activation (F), and interferon (G) microglia clusters. (H) Cluster composition of non-proliferating microglia by age. (I) Standardized variation of non-proliferating microglia for each age.
Figure 1—figure supplement 2
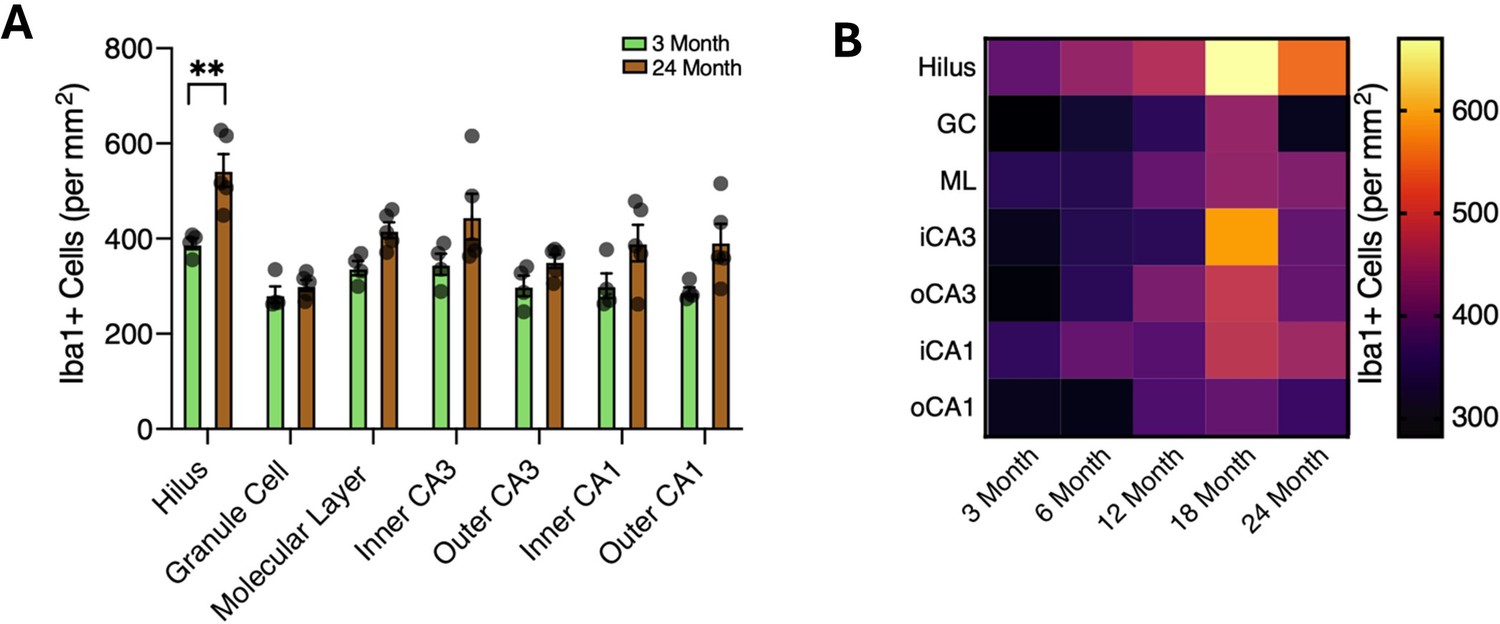
Spatiotemporal kinetics of microglial inflammatory activation in the aging hippocampus.
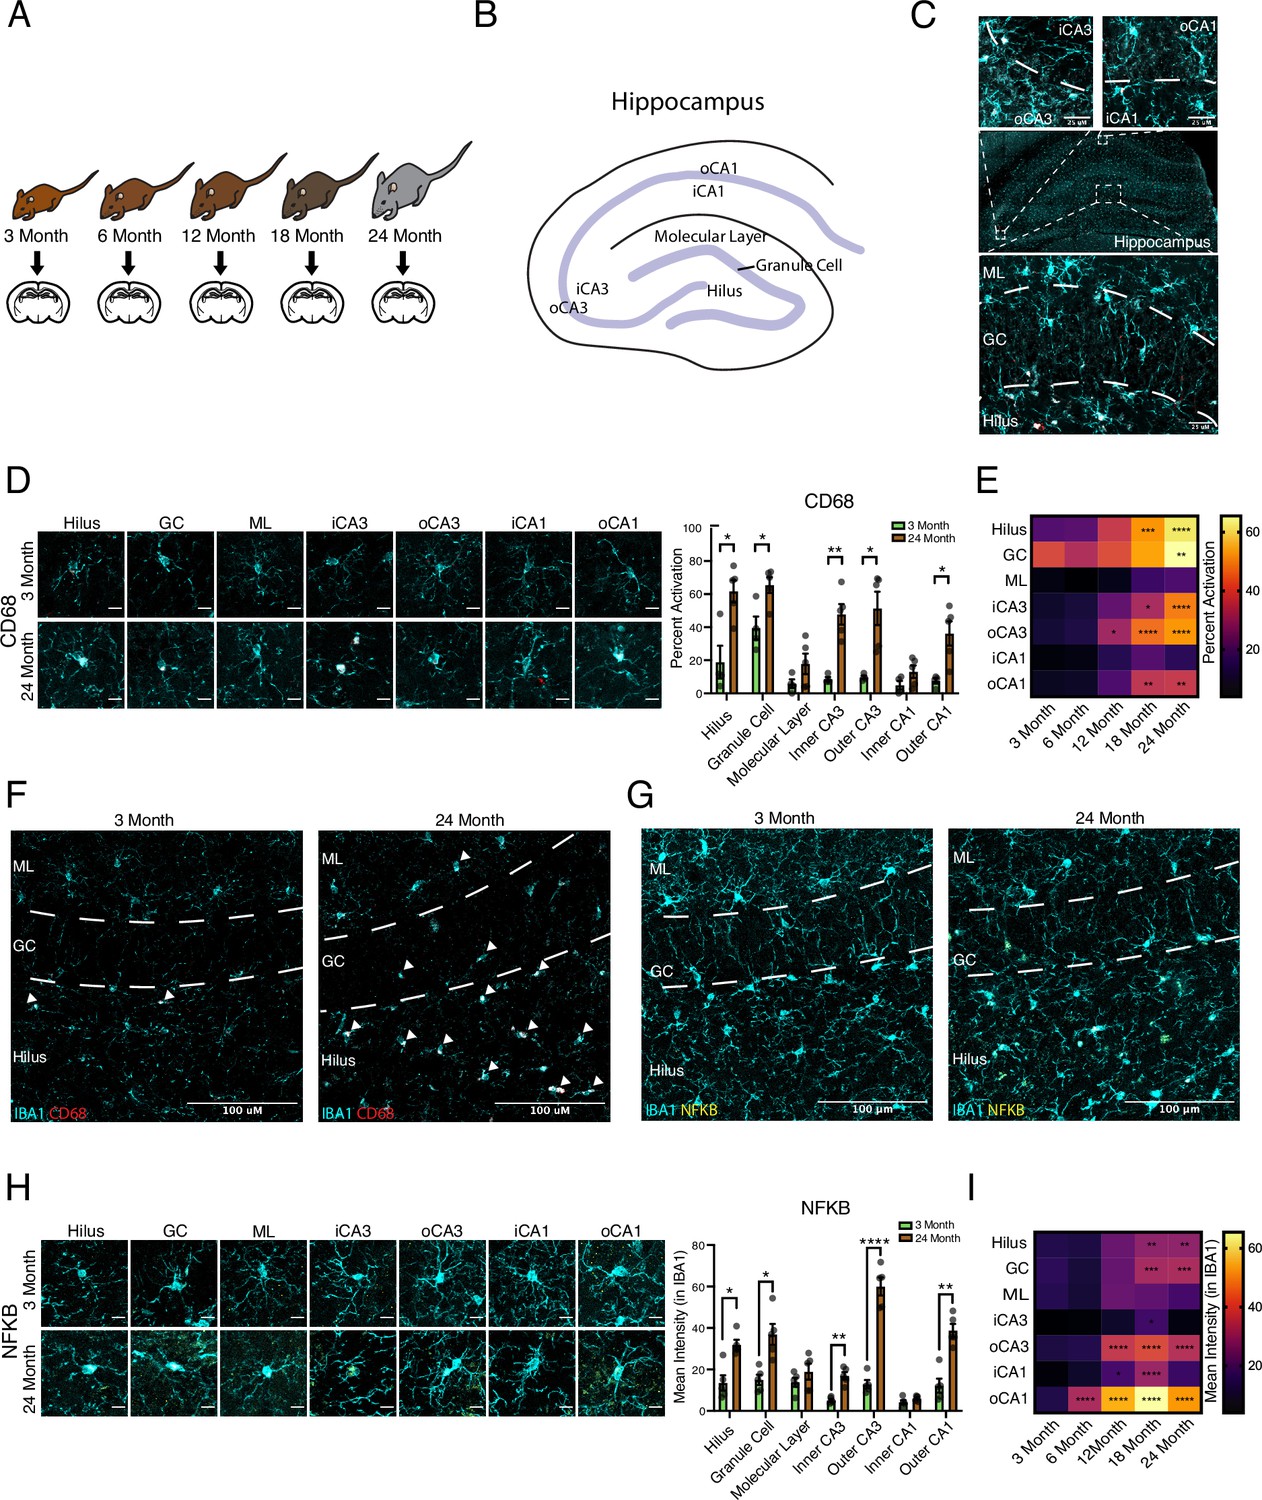
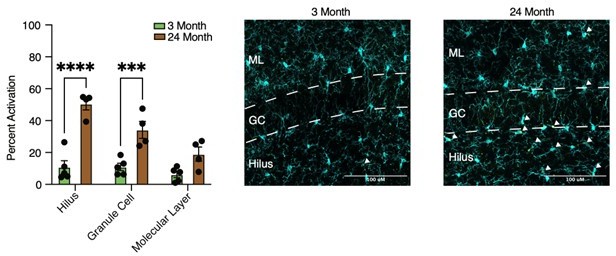
(A) Diagram depicting ages utilized for immunohistochemical analysis. (B) Diagram of the hippocampus labeled with the regions analyzed. (C) Illustration of subregions analyzed by immunohistochemistry. (D) Representative images and quantification of IBA1 (cyan)/CD68 (red)-positive microglia across hippocampal subregions in 3- and 24-month-old mice. Scale bars are 10 μM (n=5 per group; t-test with Holm–Sidak correction; *p<0.05, **p<0.01). (E) Heatmap of the quantification of activated microglia across ages and subregions. (F) Representative wide-field images of IBA1 (cyan)/CD68 (red) in the dentate gyrus in 3- and 24-month-old mice. Scale bars are 100 μM. (G) Representative wide field images of Iba1 (cyan)/NFKB p65 (yellow) in the dentate gyrus in 3- and 24-month-old mice. Scale bars are 100 μM. (H) Representative images and quantification of Iba1 (cyan)/NFKB p65 (yellow) staining across hippocampal subregions. Scale bars are 10 μM (n=5 per group; t-test with Holm–Sidak correction; *p<0.05, **p<0.01, ****p<0.0001). (I) Heatmap of the quantification of NFKB signal in microglia across ages and subregions. n=4–5 mice per condition.
Figure 2 with 1 supplement

Hippocampal microglia aging advances through intermediate states that respond to systemic interventions or disease states.
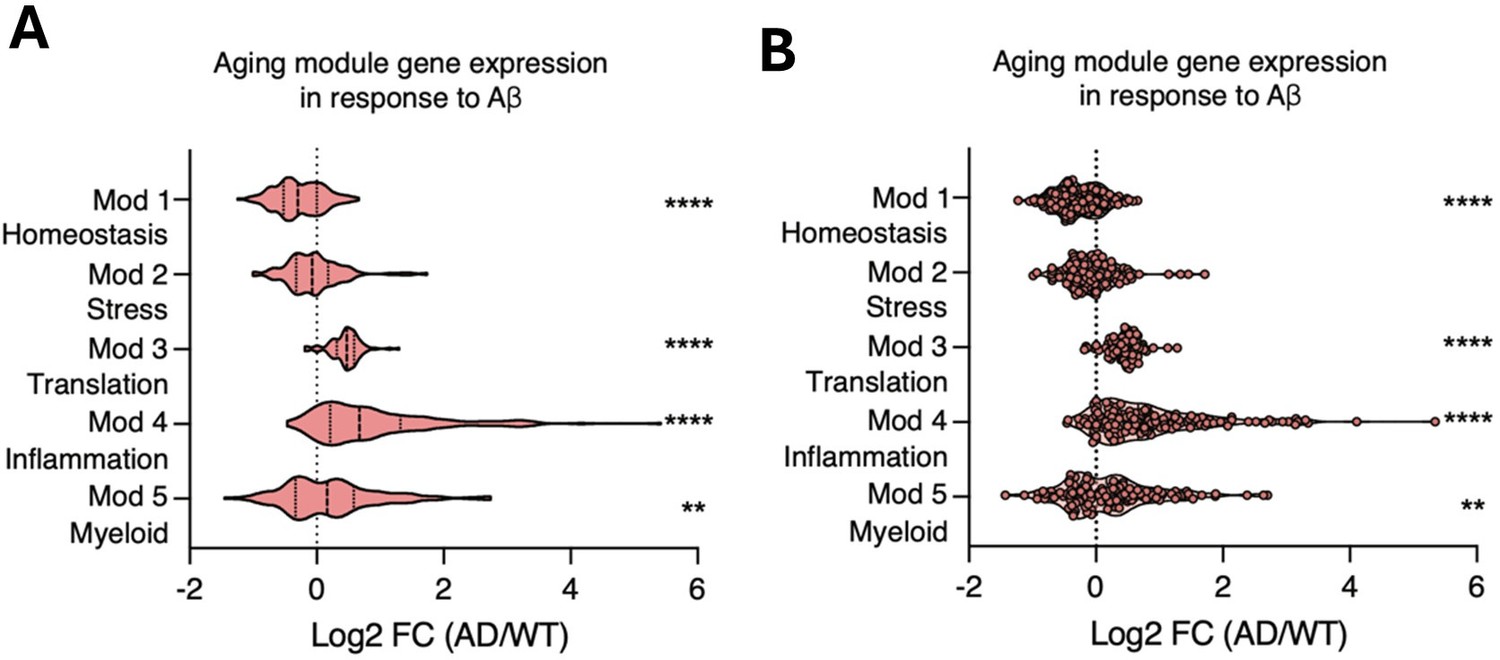
(A) Pseudotime trajectories of microglia from an anchor point located in 6-month microglia presented in a UMAP plot (n=1 pool of five animals for each age). (B) Microglia ages superimposed over pseudotime trajectories. (C) Gene expression modules representing sections of the inflammatory aging trajectory over the right half of the UMAP plot (left). Modules were discovered using Moran’s I autocorrelation test. Top gene ontology terms and representative genes in each module (right). (D) Dotplot of pseudotime modules sorted by age. Percent of cells expressing the gene and average normalized expression are represented. (E–G) Average gene expression changes for each aging module represented as log2 fold change of 12 months (E), 18 months (F), or 24 months (G) over 6 months. (H) Representative images and quantification of KLF2 (magenta) and IBA1 (cyan) staining in the hippocampus across ages (n=3 mice per group; one-way ANOVA with Tukey’s post-hoc test; *p<0.05). (I) Diagram of the heterochronic parabiosis model with the comparisons made in scRNA-Seq. (J) Representative images and quantification of CD68 (red) and IBA1 (cyan) staining in the hippocampus of isochronic young (IY) and heterochronic young (HY) (n=5 mice per group; unpaired Student’s t-test; ***p<0.001). (K) Average gene expression changes for each aging module represented as log2 fold change of heterochronic young (HY) over isochronic young (IY) adult parabionts. Data from Pálovics et al., 2022. (L) Diagram of microglia surrounding an Aβ plaque. (M) Average gene expression changes for each aging module represented as log2 fold change of the AppNL-G-F genotype (AD) over wildtype (WT). Data from Sala Frigerio et al., 2019 (one-sample t-test with the expected value of 0 [no change]; *p<0.05, **p<0.01, ***p<0.001, ****p<0.0001). Data are shown as mean ± s.e.m.
Figure 2—figure supplement 1
Hippocampal microglia aging advances through intermediate states that respond to systemic interventions or disease states.
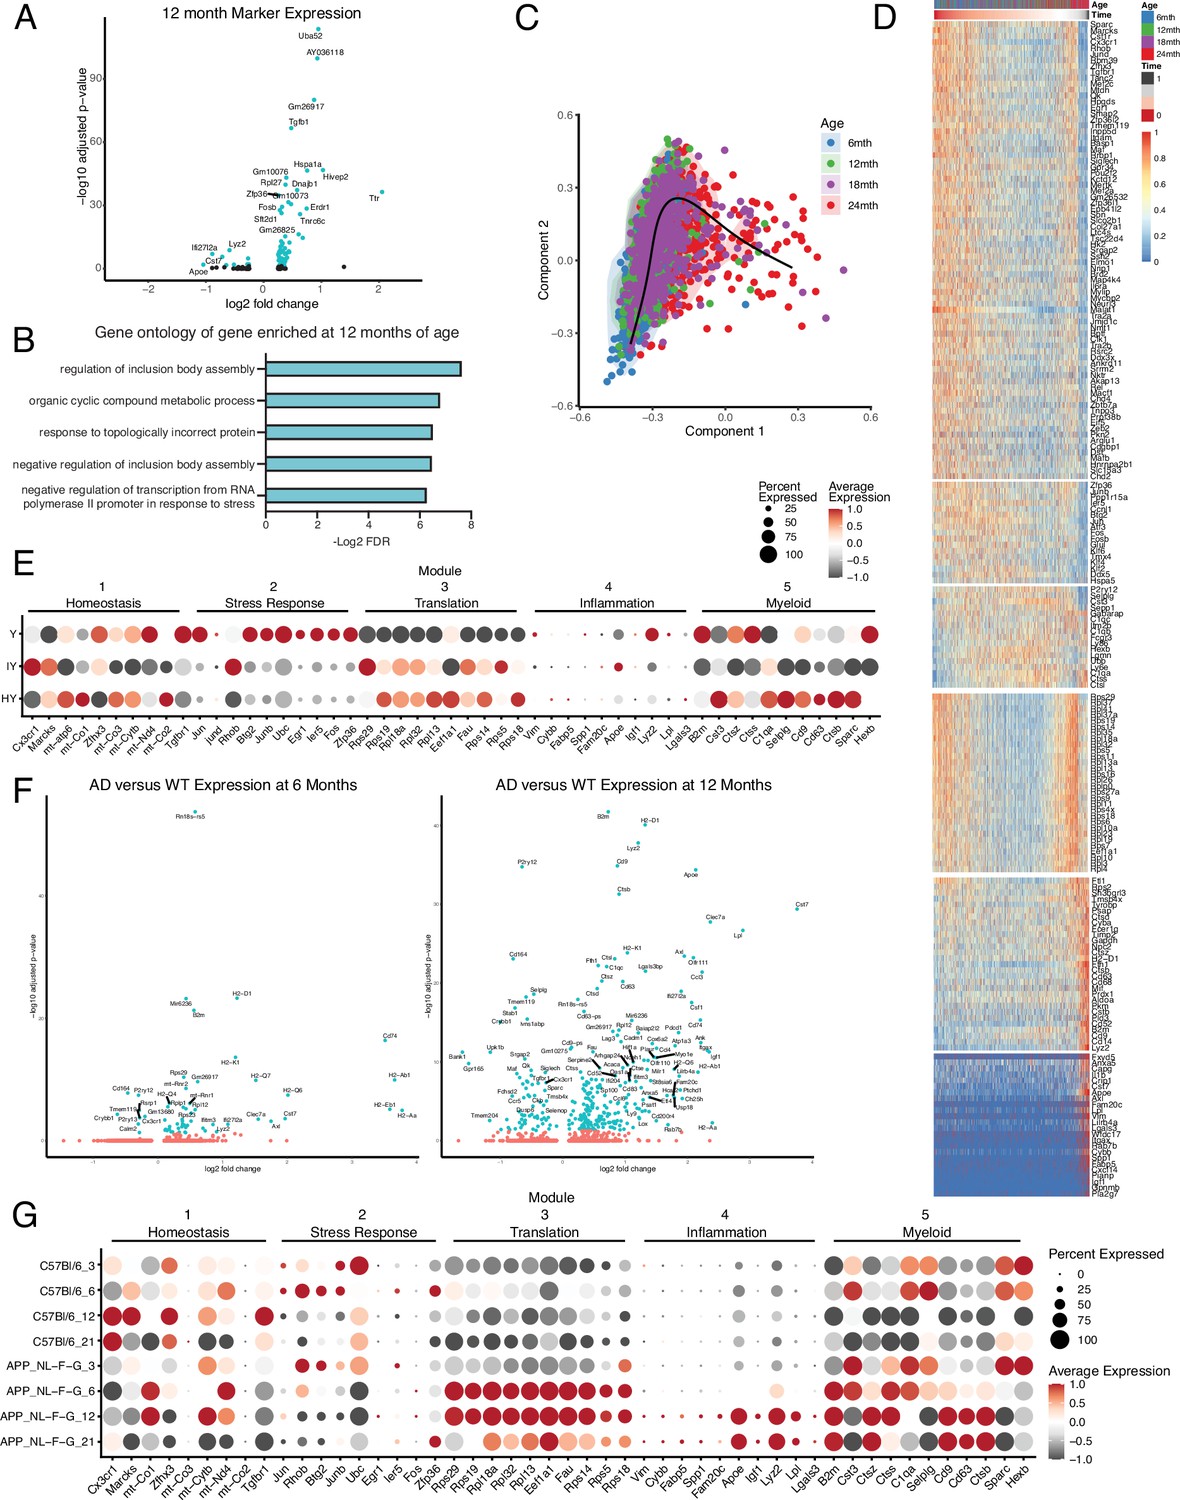
(A) Volcano plot of differential gene expression of 12-month microglia versus all other ages with significant genes in teal. (B) Gene ontology analysis of biological processes enriched in those genes with increased expression at 12 months of age. (C) Representative images and quantification of CD68 (red) and IBA1 (cyan) staining in the hippocampus of isochronic young (IY) and heterochronic young (HY) along with a diagram of the comparisons (n=5 mice per group; unpaired Student’s t-test; ***p<0.001). Data are shown as mean ± s.e.m. (D) Dotplot of pseudotime modules in young (Y), isochronic young (IY), and heterochronic young (HY) parabiont microglia. Data is from Pálovics et al., 2022. Percent of cells expressing the gene and average normalized expression are represented. (E) Volcano plots of differential gene expression of AppNL-G-F genotype (AD) over wildtype (WT) microglia at 6 (left) and 12 months of age. Significant genes are in teal. Data is from Pasciuto et al., 2020. (F) Dotplot of pseudotime modules across ages (3, 6, 12, and 21 months old) and genotypes (AppNL-G-F genotype (AD) over C57Bl/6 (WT)). Data is from Sala Frigerio et al., 2019. (G) Percent of cells expressing the gene and average normalized expression are represented.
Figure 3 with 1 supplement

Intermediate states of microglia aging act as checkpoints on inflammatory progression.
(A) Representation of the microglia aging trajectory over the UMAP plot highlighting the region of peak Tgfb1 expression. (B) Representative RNAscope images and quantification of Tgfb1 (red) expression in IBA1 (cyan) cells across ages (n=5 per group; one-way ANOVA with Dunnett’s post hoc test; *p<0.05). (C) Dotplot of the expression values of TGFB1 signaling components from scRNA-Seq of aging hippocampal microglia (6-, 12-, 18-, and 24-month-old). Percent of cells expressing the gene and average normalized expression are represented. (D) Schematic of the heterochronic parabiosis model and quantification of hippocampal microglia expression of Tgfb1 from isochronic young (IY) and heterochronic young (HY) adult parabionts. Data derived from Pálovics et al., 2022. (E) Top gene ontology terms for the set of genes with significantly decreased expression in bulk microglia RNA-Seq following TGFB1 treatment compared to control (DMSO) in LPS-treated microglia (n=5 per group). (F) Heatmap of top 10 genes in each aging module following TGFB1 compared to DMSO in LPS-treated microglia. (G) Average gene expression changes for each aging module represented as log2 fold change of TGFB1 treatment over DMSO (one-sample t-test with the expected value of 0 [no change]; *p<0.05, ***p<0.001, ****p<0.0001). (H) Representation of the microglia aging trajectory over the UMAP plot highlighting the stage where CX-5461 modulates the trajectory. (I) Representative images of S6 (magenta) and Iba1 (cyan) staining in the hippocampus of 6- and 24-month-old mice and quantification across aging (n=3 mice per group; one-way ANOVA with Tukey’s post hoc test; *p<0.05, **p<0.005, ****p<0.0001). (J) Schematic of the heterochronic parabiosis model and quantification of hippocampal microglia expression of translation module from isochronic young (IY) and heterochronic young (HY) adult parabionts. Data derived from Pálovics et al., 2022 (one-sample t-test with the expected value of 0 [no change]; **p<0.01). (K) Top gene ontology terms for the set of genes with significantly decreased expression in bulk microglia RNA-Seq following CX-5461 treatment compared to control (DMSO) in LPS-treated microglia (n=3 per group) (L) Heatmap of top 10 genes in each aging module following CX-5461 compared to DMSO in LPS-treated microglia. (M) Average gene expression changes for each aging module represented as log2 fold change of CX-5461 treatment over DMSO (one-sample t-test with the expected value of 0 [no change]; *p<0.05, **p<0.01, ****p<0.0001).
Figure 3—figure supplement 1
Intermediate states of microglia aging act as checkpoints on inflammatory progression.
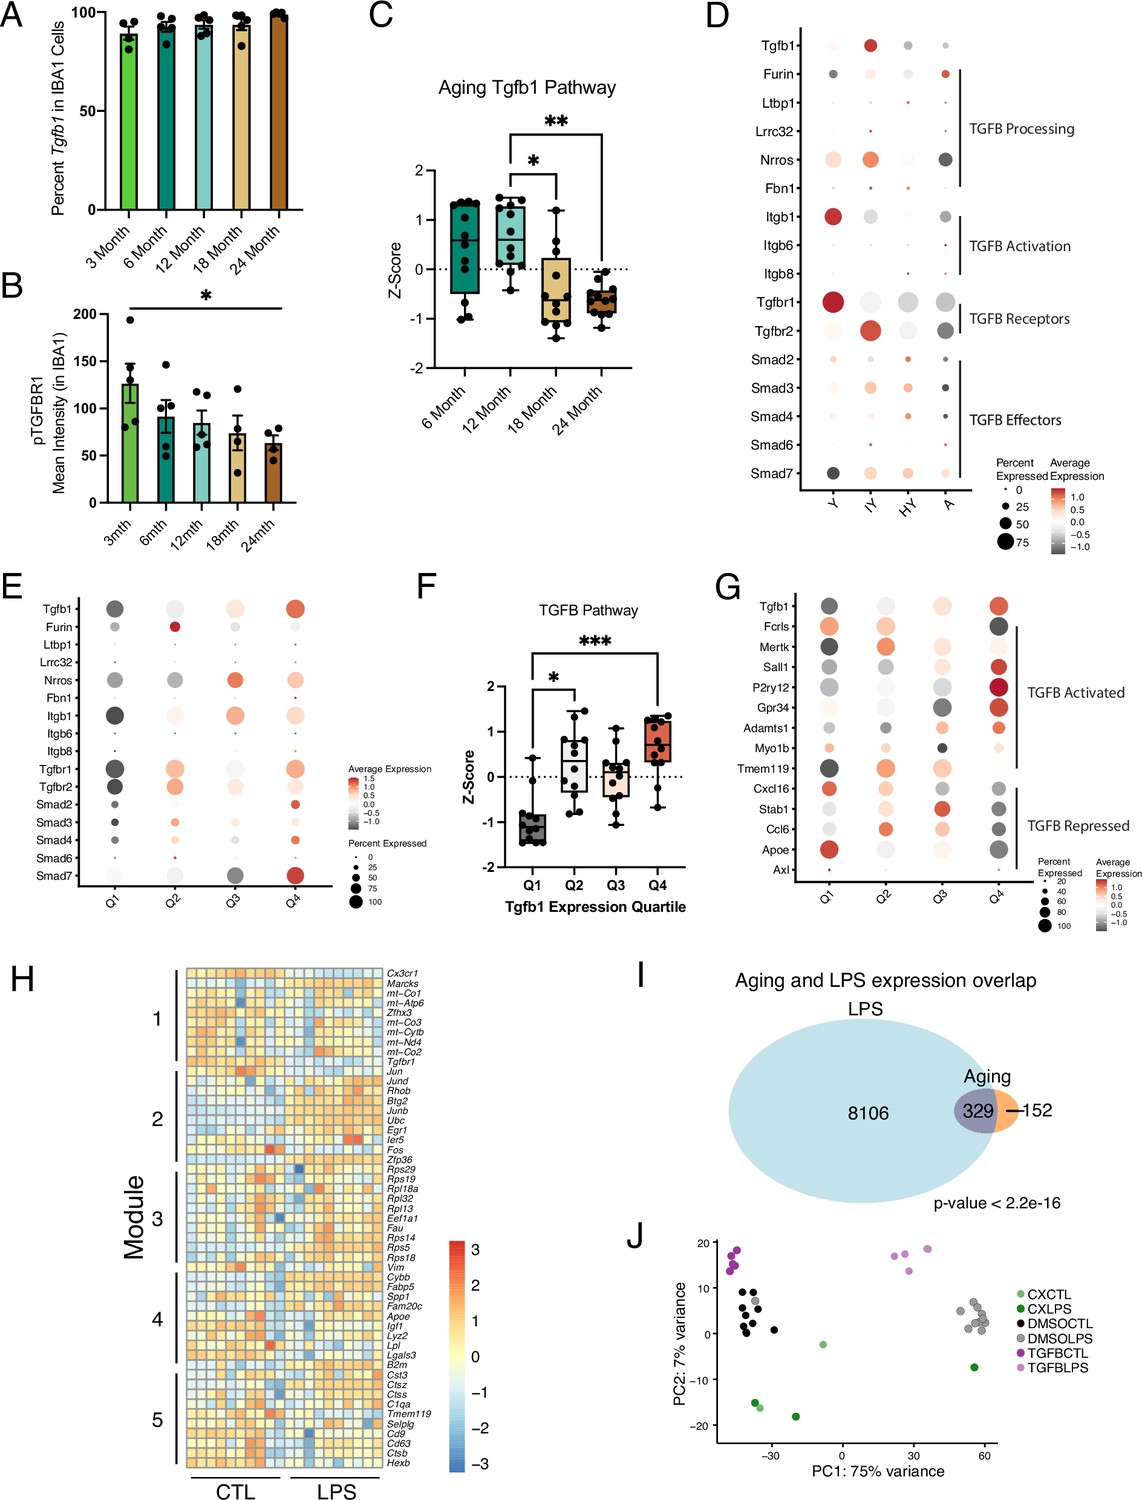
(A) Quantification of percentage of Tgfb1 RNAscope signal within IBA1 cells. (B) Quantification of IHC of pTGFBR1 signal in IBA1 cells across ages (n=4–5 mice per group; one-way ANOVA; *p<0.05). (C) Quantification of the expression of TGFB1 signaling components from Figure 3C. Expression values for the genes are represented as Z-scores (n=12 genes with reads in >25% of cells; Friedman test followed by Dunn’s multiple comparisons test; *p<0.05, ***p<0.001). (D) Dotplot of the expression values of TGFB1 signaling components in young (Y), aged (A), isochronic young (IY), and heterochronic young (HY) parabiont microglia. Data is from Pálovics et al., 2022. Percent of cells expressing the gene and average normalized expression are represented. UMAP plot of Tgfb1 scRNA-Seq colored by genotype. (E) Dotplot of the expression values of TGFB1 signaling components in aging microglia categorized by the expression of Tgfb1 into quartiles with Q1 having the lowest expression of Tgfb1 and Q4 having the highest expression. (F) Quantification of the expression of TGFB1 signaling components from (E). Expression values for the genes are represented as Z-scores (n=12 genes with reads in >25% of cells; Friedman test followed by Dunn’s multiple comparisons test; *p<0.05, ***p<0.001). (G) Dotplot of the expression values of selected TGFB signaling targets (activated and repressed, genes found in both Butovsky et al., 2014 and Qin et al., 2018) in aging microglia categorized by the expression of Tgfb1. (H) Heatmap of gene expression changes in the top 10 genes in each aging module induced by LPS. (I) Overlap between microglia gene expression changes induced by LPS and aging (χ2<2.2e-16). (J) PCA plot of pharmacological manipulations with or without LPS treatment.
Figure 4 with 2 supplements
Targeting age-related changes in microglia-derived TGFB1 promotes microglia advancement along inflammatory trajectories in the hippocampus and impairs cognition.
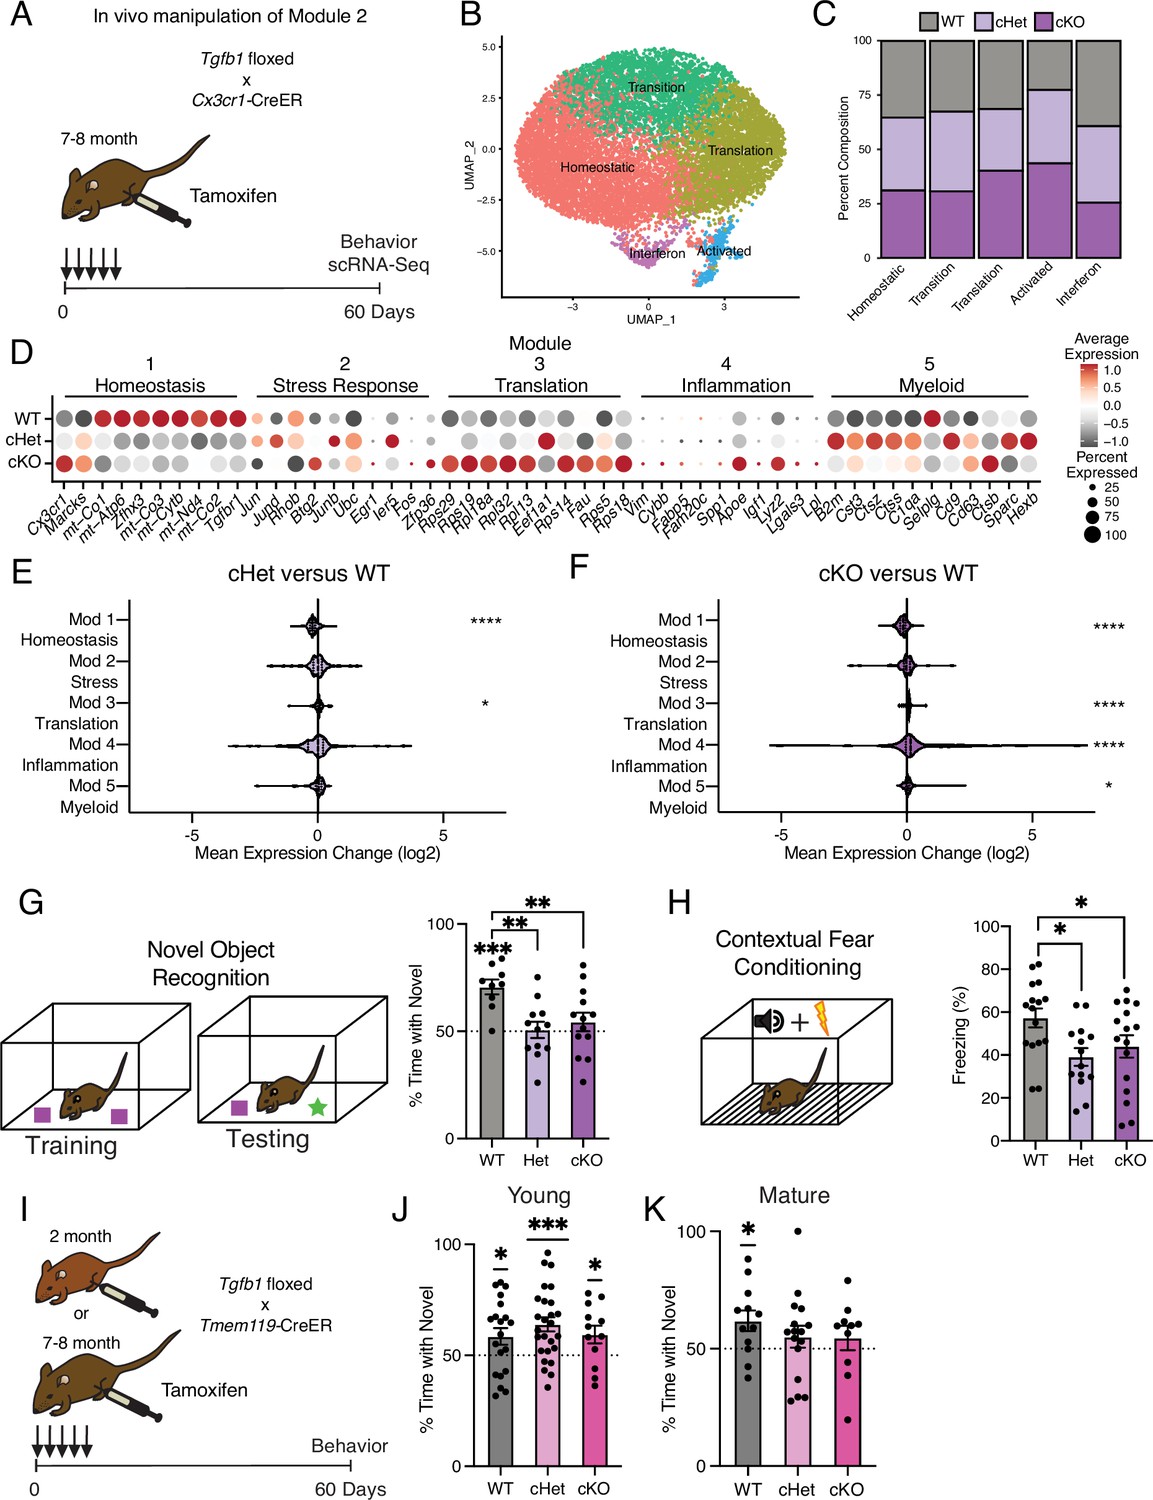
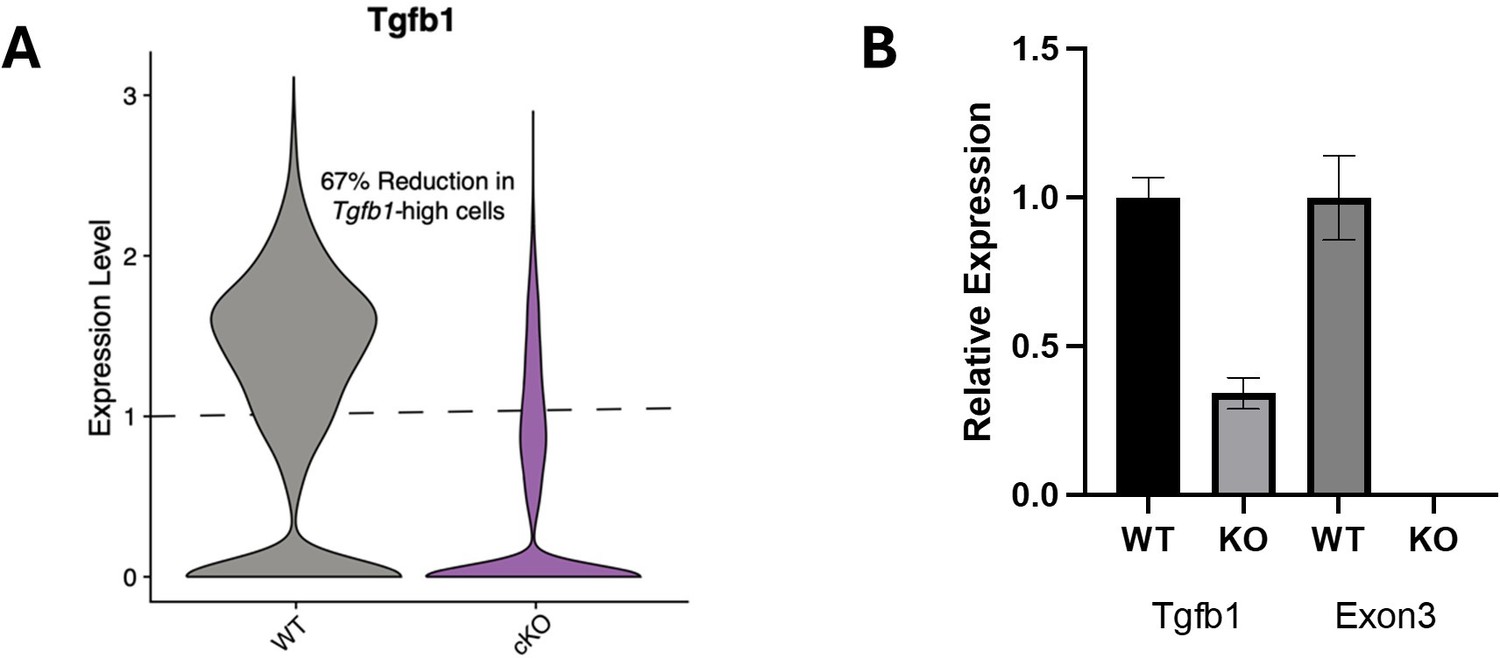
(A) Schematic of in vivo manipulation schema of Module 2. Mature (7–8 months) littermate Cx3cr1Cre-ER/+; Tgfb1flox/flox (cKO), Cx3cr1Cre-ER/+; Tgfb1flow/wt (Het), and Cx3cr1Cre-ER/+; Tgfb1wt/wt (WT) mice were administered tamoxifen and subject to hippocampal microglia scRNA-Seq and behavior analysis two months later. (B) UMAP plot of microglia separated into transcriptional clusters (n=2 pools of three animals per genotype). (C) Stacked bar plot of the normalized relative percentage of cells of each genotype in the identified clusters. (D) Dotplot of expression of aging module markers sorted by genotype. Percent of cells expressing the gene and average normalized expression are represented. (E, F) Average gene expression changes for each aging module represented as log2 fold change of either Het over WT (E) or KO over WT (F) (one-sample t-test with the expected value of 0 [no change]; *p<0.05, ****p<0.0001). (G) Novel object recognition task. (Top) Diagram of the training and testing phases of the novel object recognition paradigm. (Bottom) Quantification of the NOR testing phase represented as a percentage of time spent with the novel object (over the total time spent interacting with the objects) (n=9–13 per genotype; one-sample t-test with the expected value of 50 [equal time spent with each object]; ***p<0.001) (differences between groups determined by one-way ANOVA; **p<0.01). (H) Contextual fear conditioning. (Top) Diagram of the fear conditioning paradigm. (Bottom) Quantification of the percentage of time mice froze in the contextual fear conditioning testing phase (n=14–16 per genotype; one-way ANOVA; *p<0.05). Data are shown as mean ± s.e.m. (I) Schematic of in vivo manipulation of Tgfb1 at young and mature ages. Young (2 month) or mature (7–8 months) littermate Tmem119Cre-ER/+; Tgfb1flox/flox (cKO), Tmem119Cre-ER/+; Tgfb1flow/wt (Het), and Tmem119Cre-ER/+; Tgfb1wt/wt (WT) mice were administered tamoxifen and subject to behavioral analysis two months later. (J, K) Quantification of the NOR testing phase represented as a percentage of time spent with the novel object (over the total time spent interacting with the objects) for young (J) and mature (K) Tmem119Cre-ER::Tgfb1 mice n=12–26 in young and n=10–16 in mature mice per genotype; one-sample t-test with the expected value of 50 (equal time spent with each object; *p<0.05, ***p<0.001).
Figure 4—figure supplement 1
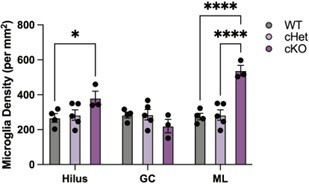
Targeting age-related changes in microglia-derived TGFB1 promotes microglia advancement along inflammatory trajectories in the hippocampus.
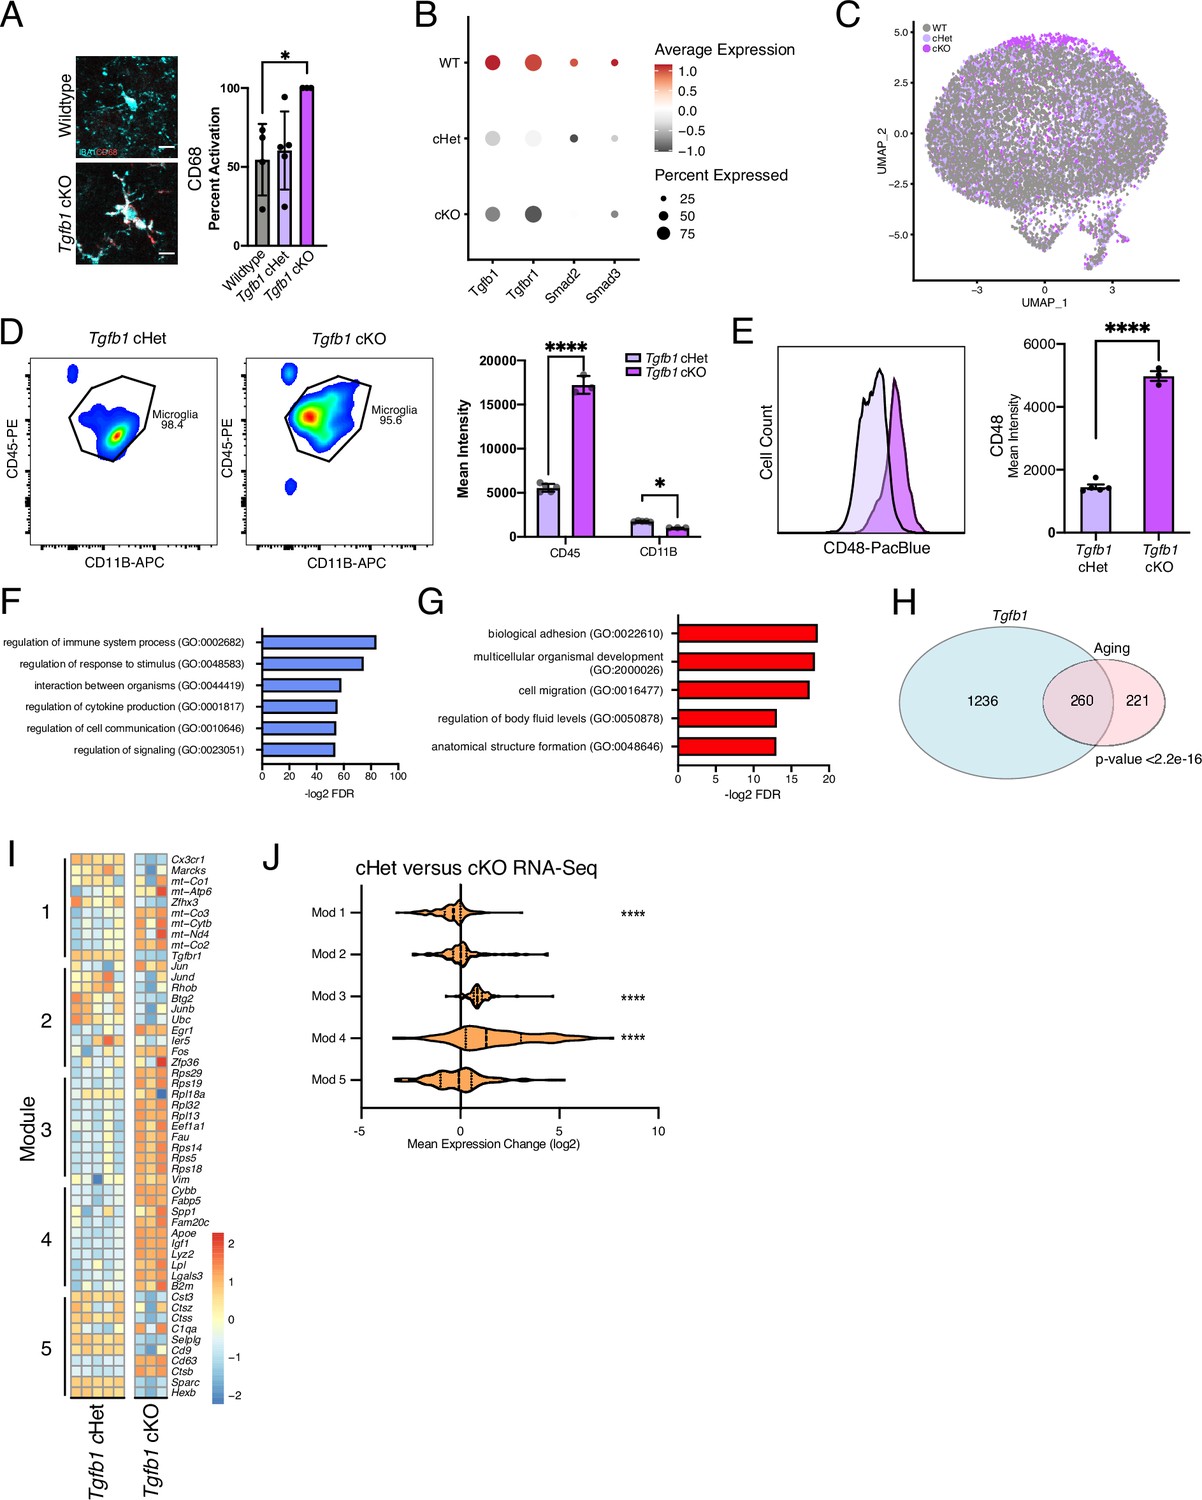
(A) Representative images and quantification of IBA1 (cyan)/CD68 (red)-positive microglia in wildtype, Tgfb1 cHet, and Tgfb1 cKO hippocampi (n=3–5; one way ANOVA with Tukey post hoc test; *p<0.05). (B) Dotplot of the expression values of TGFB1 signaling components from scRNA-Seq of Tgfb1 WT, cHet, and cKO microglia (n=2 pools of three animals per genotype). (C) UMAP plot of Tgfb1 scRNA-Seq colored by genotype. (D) FACS plots of gating strategy for microglia isolation for RNA-Seq in cHet and cKO hippocampi. Quantification of the flow cytometry analysis of CD11b and CD45 (n=3–5; mixed effects analysis; *p<0.05, ****p<0.0001). (E) Example histogram and quantification of CD48 in control and Tgfb1 cKO FACS-sorted microglia (n=3–5 per group; t-test; ****p<0.0001). (F) Top gene ontology terms associated with genes significantly increased in microglia bulk RNA-Seq in Tgfb1 cKO samples (n=3–5 samples per genotype). (G) Top gene ontology terms associated with genes significantly decreased in microglia bulk RNA-Seq in Tgfb1 cKO samples. (H) Overlap between concordant microglia gene expression changes induced by Tgfb1 knockout and aging. (χ2<2.2e-16). (I) Heatmap of gene expression of the top 10 genes in each aging module in control and Tgfb1 cKO microglia. (J) Average gene expression changes for each aging module represented as log2 fold change of Tgfb1 cKO over control (one-sample t-test with the expected value of 0 [no change]; ****p<0.0001). Data are shown as means ± s.e.m.
Figure 4—figure supplement 2
Targeting age-related changes in microglia-derived TGFB1 impairs cognition.
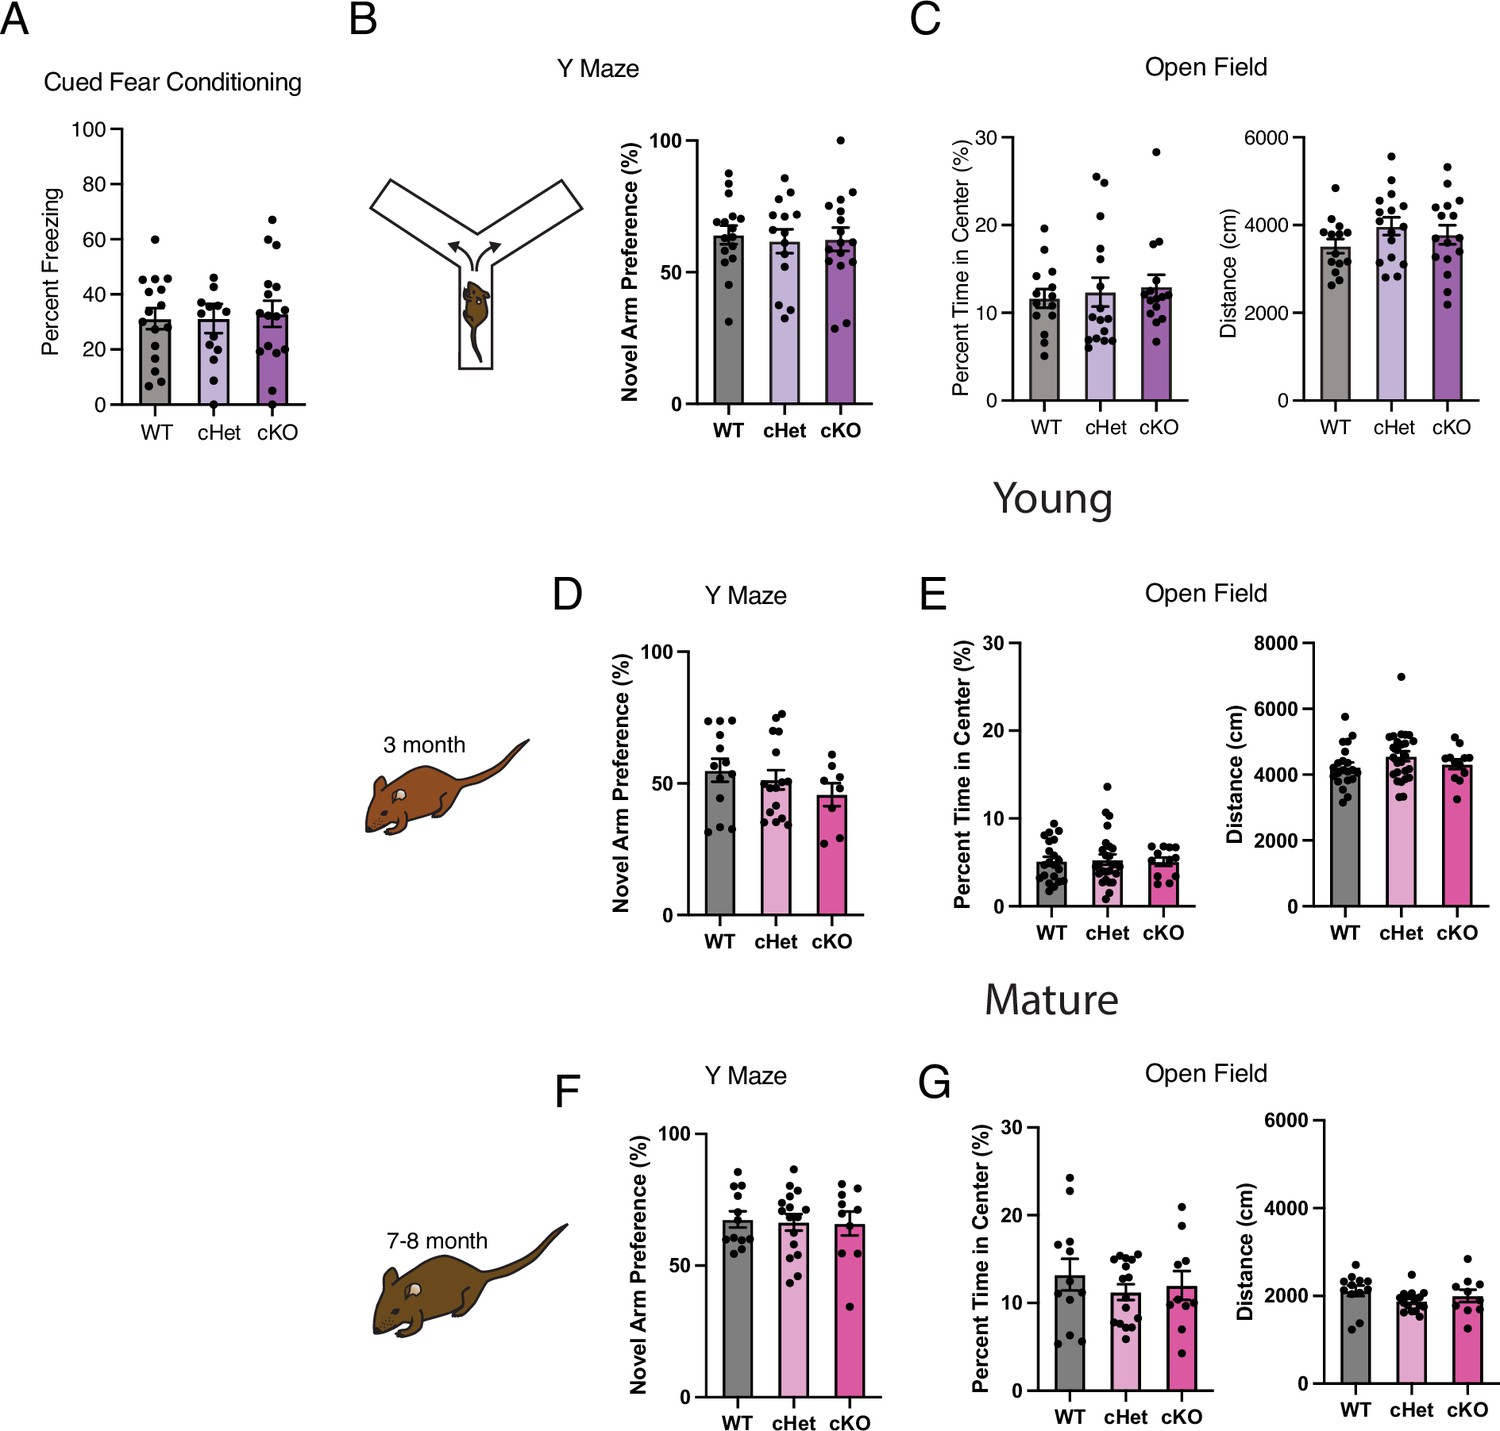
(A) Freezing during the cued fear conditioning phase of the fear conditioning test for the Cx3cr1Cre-ER::Tgfb1 cohort. The percent freezing was calculated for the last 30 seconds of the test following the conditioned stimulus (n=13–16 per genotype). (B) Diagram and results of Y maze test for the Cx3cr1Cre-ER::Tgfb1 cohort. Results are presented as preference for the novel arm versus the trained armed (time in novel arm/(time in novel arm + trained arm) × 100) (n=14–16 per genotype). (C) Percent time in the center of the open field and distance traveled during the open-field test for the Cx3cr1Cre-ER::Tgfb1 cohort (n=14–16 per genotype). (D, F) Results of Y maze test for the young (D) and mature (F) Tmem119-Cre-ER::Tgfb1 cohort (n=8–16 per genotype for young and n=10–16 per genotype for mature). (E, G) Percent time in the center of the open field and distance traveled during the open-field test for the Tmem119Cre-ER::Tgfb1 cohort (n=12–26 per genotype for young and n=10–16 per genotype for mature). Data are shown as mean ± s.e.m.
Author response image 1
Author response image 2
Author response image 3
Author response image 4
Author response image 5
Tables
Key resources table
| Reagent type (species) or resource | Designation | Source or reference | Identifiers | Additional information |
|---|---|---|---|---|
| Strain, strain background (Mus musculus) | C57BL/6J | Jackson Laboratories | RRID:IMSR_JAX:000664 | |
| Strain, strain background (M. musculus) | Cx3cr1Cre-ER | Jackson Laboratories | RRID:IMSR_JAX:021160 | |
| Strain, strain background (M. musculus) | Tmem119Cre-ER | Jackson Laboratories | RRID:IMSR_JAX:031820 | |
| Strain, strain background (M. musculus) | Tgfb1-flox | Jackson Laboratories | RRID:MMRRC_065809-JAX | |
| Commercial assay or kit | Neural Dissociation Kits (P) | Miltenyi | 130-092-628 | |
| Commercial assay or kit | Myelin Removal Beads | Miltenyi | 1130-096-731 | |
| Antibody | CD11b-APC | eBioscience | 17-0112-82, RRID:AB_469343 | FACS 1:200 |
| Antibody | CD45-PE | eBioscience | 12-0451-82, RRID:AB_465668 | FACS 1:200 |
| Antibody | CD48-Pacific Blue | BioLegend | 103417, RRID:AB_756139 | FACS 1:200 |
| Software, algorithm | DeSeq2 (1.42.1) | https://bioconductor.org/packages/release/bioc/html/DESeq2.html | RRID:SCR_015687 | |
| Commercial assay or kit | Cd11b magnetic beads | Miltenyi | 130-126-725 | |
| Software, algorithm | Cell Ranger (v5.0.1) | 10x Genomics | RRID:SCR_021160 | |
| Software, algorithm | Seurat (v3.2.1) | https://satijalab.org/seurat/articles/install_v5 | RRID:SCR_007322 | |
| Software, algorithm | Monocle3 (v1.3.4) | https://cole-trapnell-lab.github.io/monocle3/docs/installation/ | RRID:SCR_018685 | |
| Software, algorithm | Scorpius (v1.0.9) | https://github.com/rcannood/SCORPIUS; Cannoodt, 2021 | ||
| Antibody | Anti-Iba1, rabbit | Wako | 019-19741, RRID:AB_839504 | 1:1000 IHC |
| Antibody | Anti-CD68, rat | Bio-Rad | MCA1957, RRID:AB_322219 | 1:250 IHC |
| Antibody | Anti-NFKB p65, rabbit | SantaCruz | sc-372, RRID:AB_632037 | 1:500 IHC |
| Antibody | Anti-Iba1, guinea pig | Synaptic Systems | 234-004, RRID:AB_2493179 | 1:1000 IHC |
| Antibody | Anti-C1q, rabbit | Abcam | ab182451, RRID:AB_2732849 | 1:1000 IHC |
| Antibody | Anti-C3, rat | Abcam | ab11862, RRID:AB_2066623 | 1:1000 IHC |
| Antibody | Anti-S6, rabbit | Cell Signaling | 2217, RRID:AB_331355 | 1:500 IHC |
| Antibody | Anti-KLF2, rabbit | Bioss | bs-2772R, RRID:AB_10857057 | 1:250 IHC |
| Peptide, recombinant protein | M-CSF | Peprotech | 315-02 | 10 ng/mL |
| Peptide, recombinant protein | TGFβ1 | Thermo Fisher Scientific | PHG9204 | 10 ng/mL |
| Chemical compound, drug | CX-5461 | EMD Millipore | 509265 | 100 nM |
| Sequence-based reagent | Tgfb1 RNAScope Probe | ACD | 443571C2 | |
| Software, algorithm | ggplot2 | https://ggplot2.tidyverse.org/ | RRID:SCR_014601 | |
| Software, algorithm | Prism 8.0 | GraphPad | RRID:SCR_002798 |
Additional files
-
MDAR checklist
- https://cdn.elifesciences.org/articles/97671/elife-97671-mdarchecklist1-v1.docx
-
Supplementary file 1
Gene markers for each age group and differential expression between the 6- and 12-, 18-, or 24-month-old microglia in single-cell RNA-Seq of aging hippocampal microglia.
The tables contain genes selectively increased or decreased in each age group when compared to every other age group combined and genes differentially expressed between 6- and 12-, 18-, or 24-month microglia. The tables contain the average log fold change, the percentage of cells in each group with expression, and the adjusted p-value.
- https://cdn.elifesciences.org/articles/97671/elife-97671-supp1-v1.xlsx
-
Supplementary file 2
Pseudotime trajectories of aging microglia.
The pseudotime analysis contains the spatial autocorrelation analysis. Moran’s I was used to detect focal expression of genes that were consequently constructed into co-regulated modules using Louvain community analysis. The table contains the adjusted p-value (q-value) and module information.
- https://cdn.elifesciences.org/articles/97671/elife-97671-supp2-v1.xlsx
-
Supplementary file 3
RNA-Seq analysis of primary microglia treated with LPS and TGFB1 or CX-5461.
The tables contain the RNA-Seq differential expression analysis of control and LPS activated primary microglia, DMSO and CX-5461-treated primary microglia activated by LPS, and DMSO and TGFB1-treated primary microglia activated by LPS, respectively. The tables contain expression values of genes for the samples that were compared along with mean expression values for all samples combined, log fold change between sample groups, and adjusted p-values. in the RNA-Seq differential expression analysis of control and LPS activated primary microglia, DMSO and CX-5461-treated primary microglia activated by LPS, and DMSO and TGFB1-treated primary microglia activated by LPS, respectively.
- https://cdn.elifesciences.org/articles/97671/elife-97671-supp3-v1.xlsx
-
Supplementary file 4
Differential expression analysis of control and Tgfb1 cKO hippocampal microglia.
The table contains expression values of genes for the samples that were compared along with mean expression values for all samples combined, log fold change between sample groups, and adjusted p-values.
- https://cdn.elifesciences.org/articles/97671/elife-97671-supp4-v1.xlsx
Download links
A two-part list of links to download the article, or parts of the article, in various formats.
Downloads (link to download the article as PDF)
Open citations (links to open the citations from this article in various online reference manager services)
Cite this article (links to download the citations from this article in formats compatible with various reference manager tools)
Microglia aging in the hippocampus advances through intermediate states that drive activation and cognitive decline
eLife 13:RP97671.
https://doi.org/10.7554/eLife.97671.3


