Single-cell sequencing provides clues about the developmental genetic basis of evolutionary adaptations in syngnathid fishes
- Institute of Ecology and Evolution, University of Oregon, United States
- Knight Campus for Accelerating Scientific Impact, University of Oregon, United States
- School of Computer and Data Science, University of Oregon, United States
Figures
Figure 1
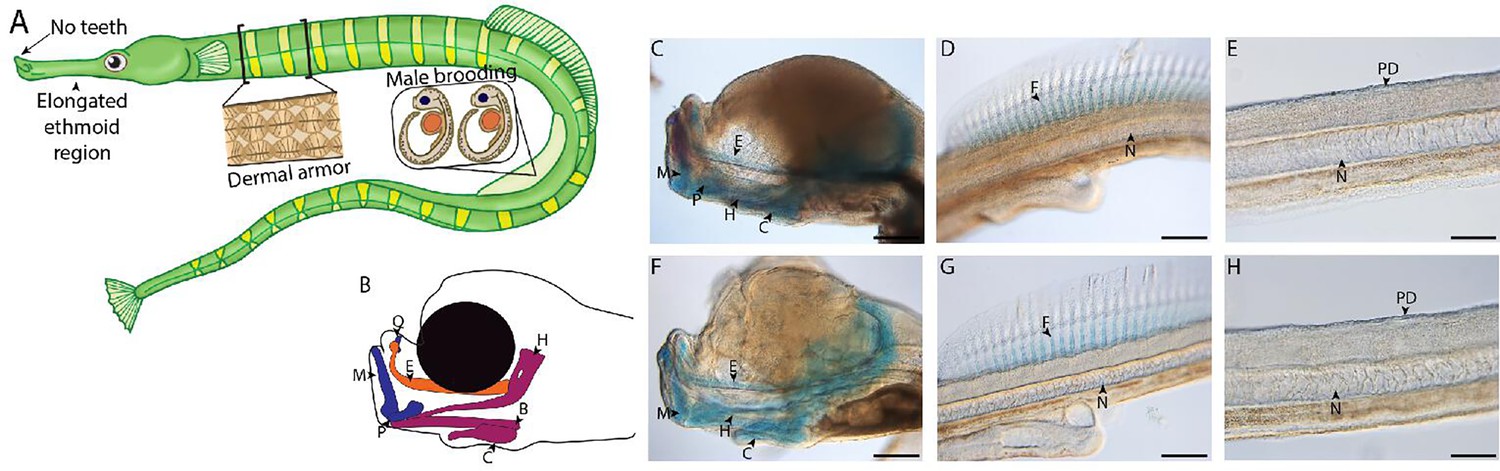
Gulf pipefish exemplify syngnathid-derived traits.
Gulf pipefish have elongate snouts, have lost teeth on their oral and pharyngeal jaws, possess dermal armor, and have brood pouches in males (A, B). Cartilage (alcian in blue) and bone (alizarin in red) stained clutch siblings of embryos from the two single-cell RNA sequencing (scRNAseq) samples are shown in C-H. Embryos have cartilaginous craniofacial skeletons (B, C, F; E marks the (Mes)ethmoid cartilage, C indicates the Ceratohyal, H shows the Hyosymplectic cartilage, M marks the Meckel’s cartilage, Q indicates the quadrate, B shows the Basihyal, and P marks the palatoquadrate) with the onset of ossification in the jaw. They have cartilaginous fin radials in the dorsal fin (D, G; F indicates fin radials and N denotes the notochord). The embryos do not have signs of ossification in the trunk where the exoskeleton will form later (E, H; PD show the region where dermal armor primordia will arise). Panels C, D, F, and G, scale bar 200 µm; E, H scale bar 100 µm.
Figure 2 with 74 supplements
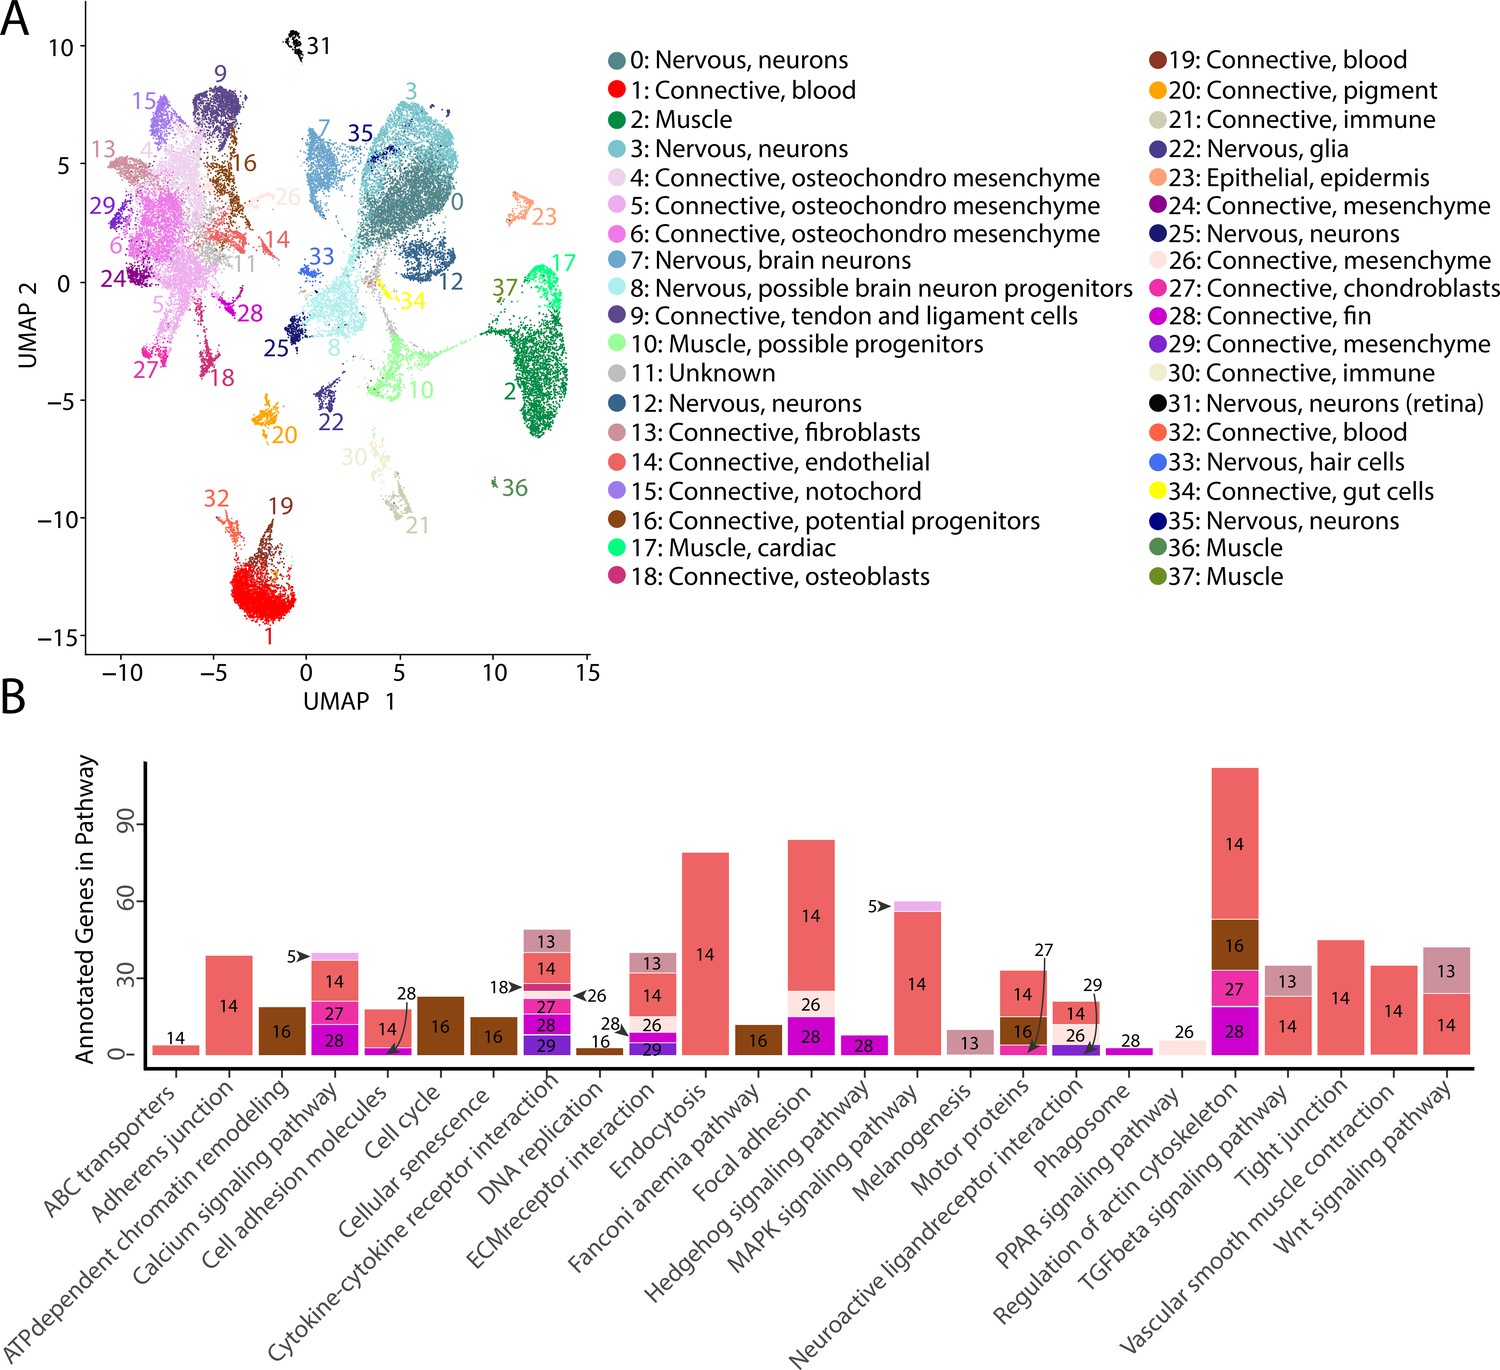
Gulf pipefish single-cell atlas contains cells from the entire embryo and identifies genetic pathways active in different cell types.
The UMAP plot (A) shows all of the cell clusters and their identities reduced to the first two UMAP dimensions. The graph in (B) displays the results of the KEGG pathway analysis in cell clusters identified as connective tissue (excluding blood, pigment, digestive, and immune cells). The number of Seurat-identified marker genes for each cluster that was a part of each pathway is displayed on the y-axis. Bars are colored and labeled by cell cluster.
Figure 2—figure supplement 1
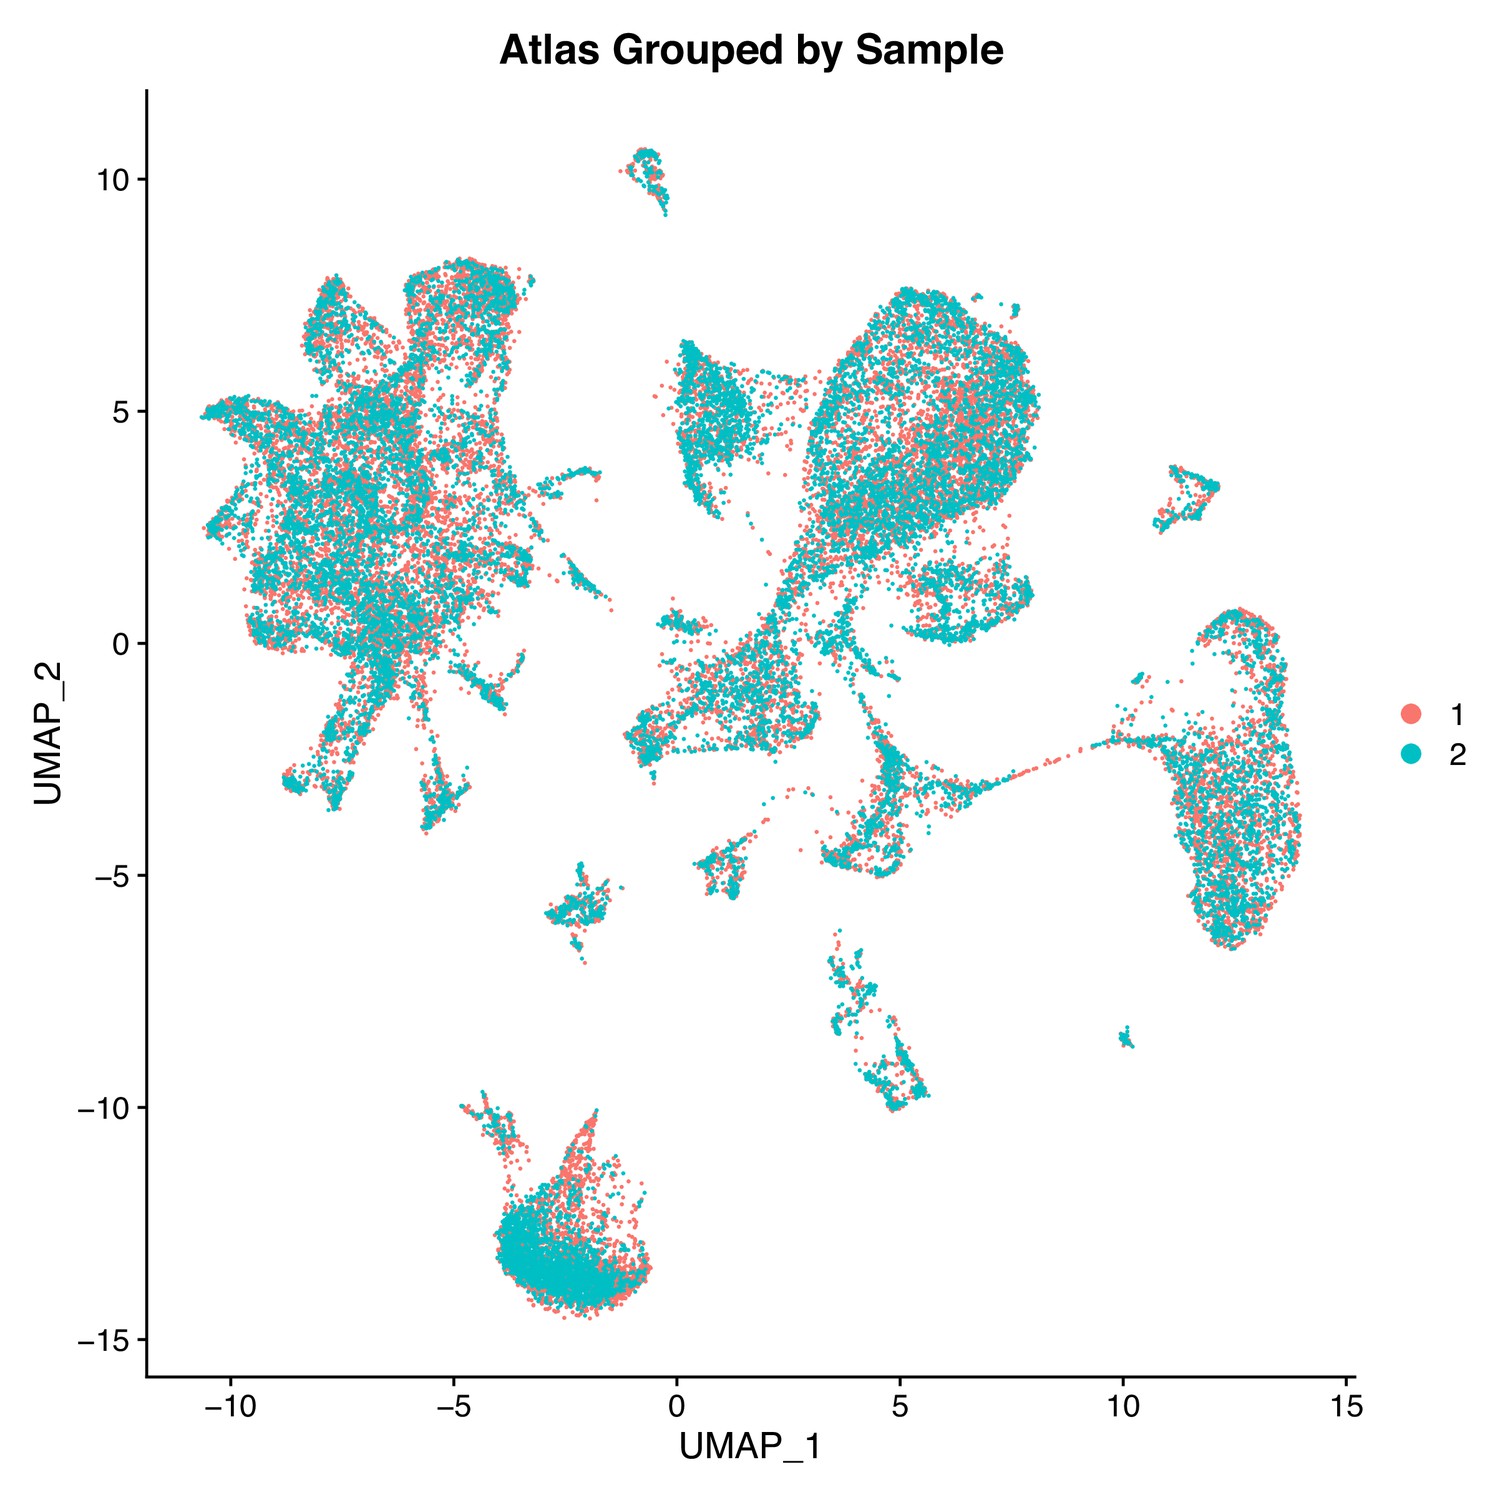
Two Gulf pipefish samples have similar contributions to cell clusters.
This UMAP features cells plotted by sample (sample one in orange and sample two in cyan) in the first two UMAP dimensions.
Figure 2—figure supplement 2
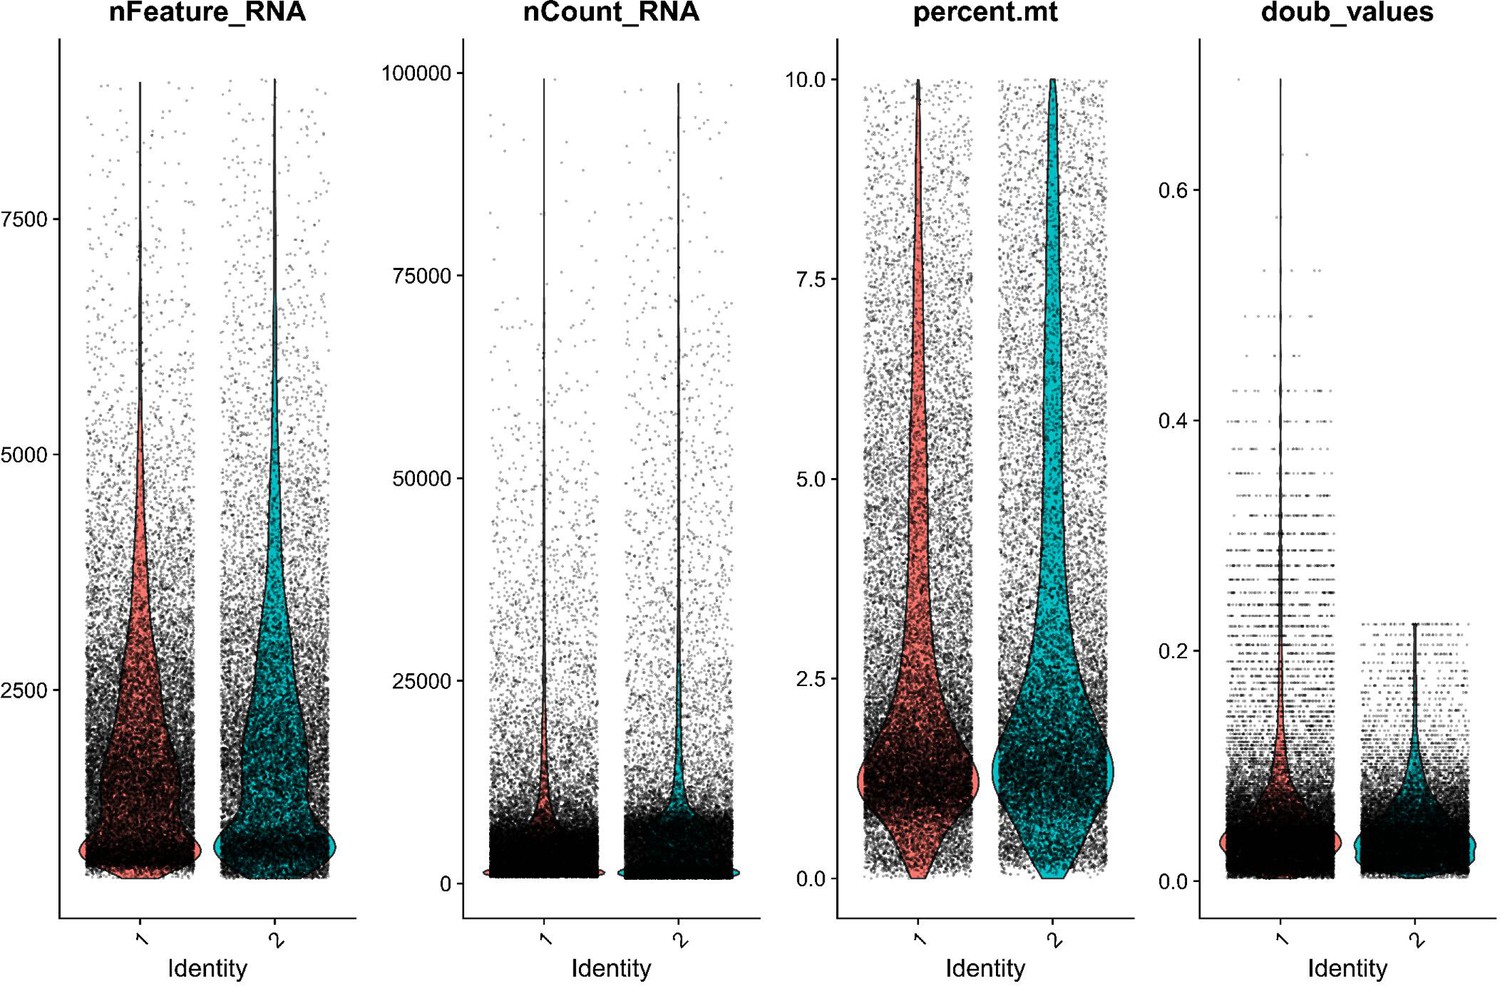
QC metrics for both Gulf pipefish samples show similar sample quality after initial filtering.
Sample quality was assessed using the number of genes identified (nFeatureRNA), the total RNA counts (nCountRNA), the percentage of mitochondrial reads (percent.mt), and the likelihood of being a doublet (doub_values). Gulf pipefish sample data post-filtering is displayed for each of these metrics.
Figure 2—figure supplement 3
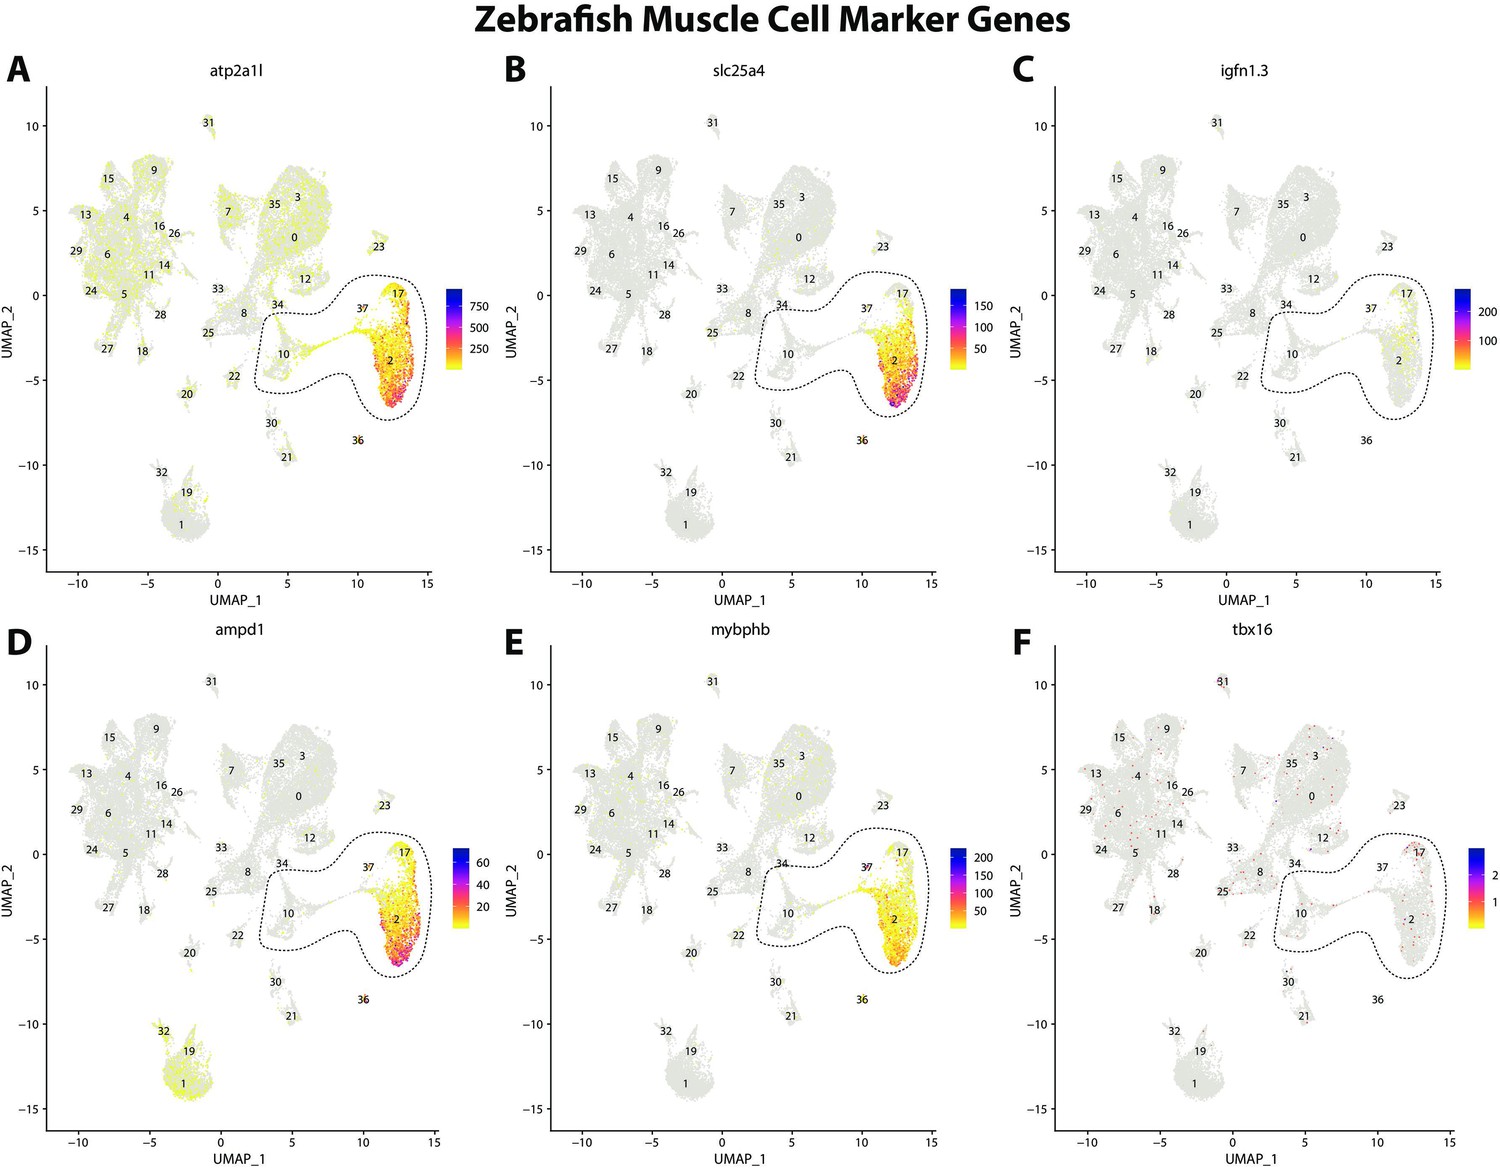
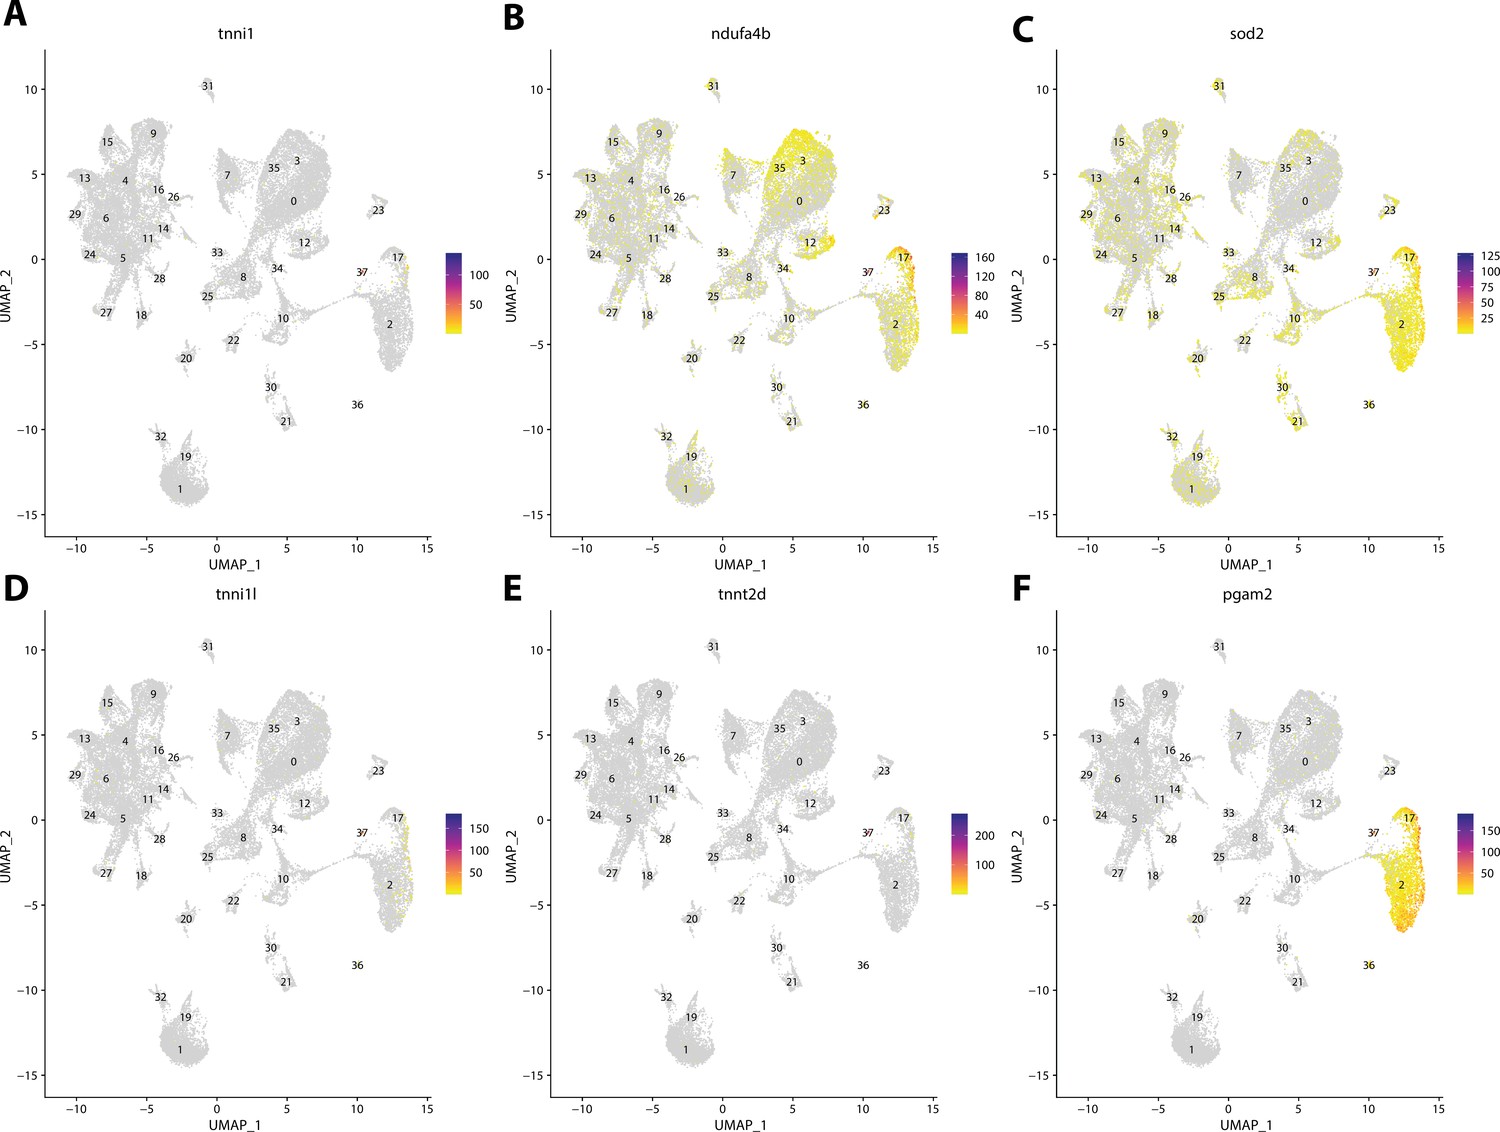
Zebrafish muscle cell marker genes expression patterns correspond with annotated muscle cells in the Gulf pipefish atlas.
Feature plots of zebrafish muscle cell marker genes identified from the Daniocell single-cell RNA sequencing (scRNAseq) database demonstrate Gulf pipefish expression. Annotated muscle cell clusters in pipefish are distinguished by a dashed outline.
Figure 2—figure supplement 4
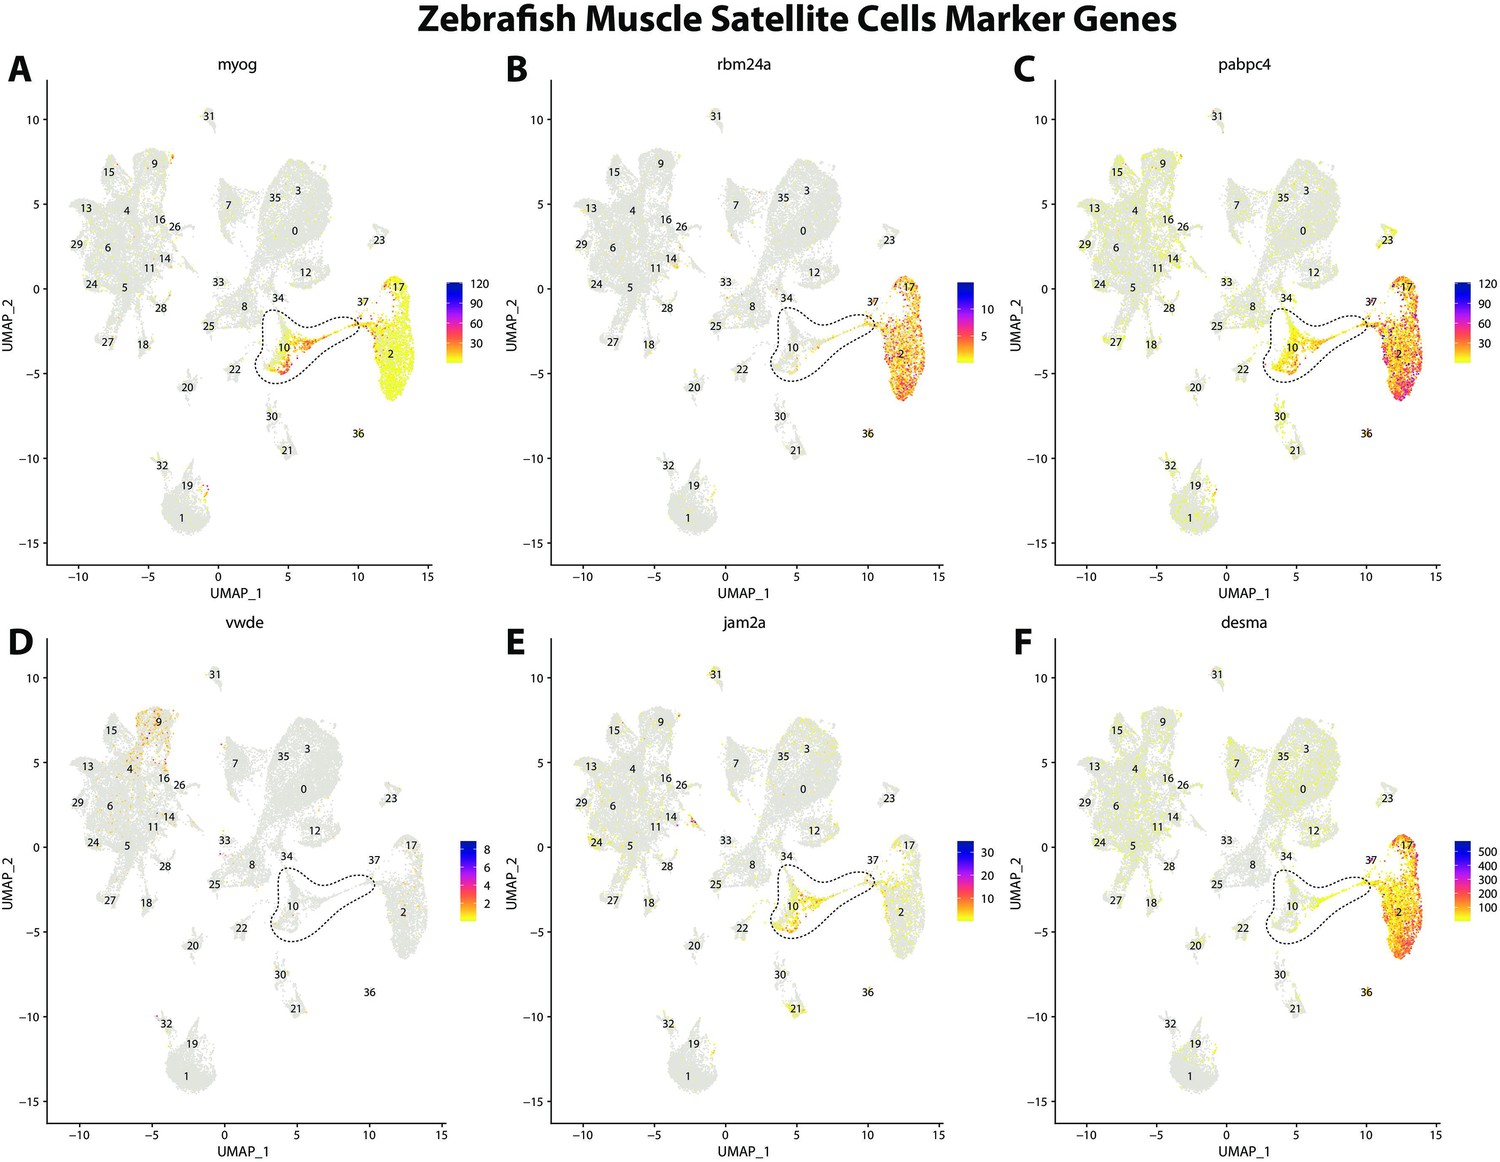
Zebrafish muscle satellite cell marker genes expression patterns correspond with annotated muscle primordia cells in the Gulf pipefish atlas.
Feature plots of zebrafish muscle satellite cell marker genes identified from the Daniocell single-cell RNA sequencing (scRNAseq) database demonstrate Gulf pipefish expression. Annotated muscle primordia cell cluster in pipefish is distinguished by a dashed outline.
Figure 2—figure supplement 5
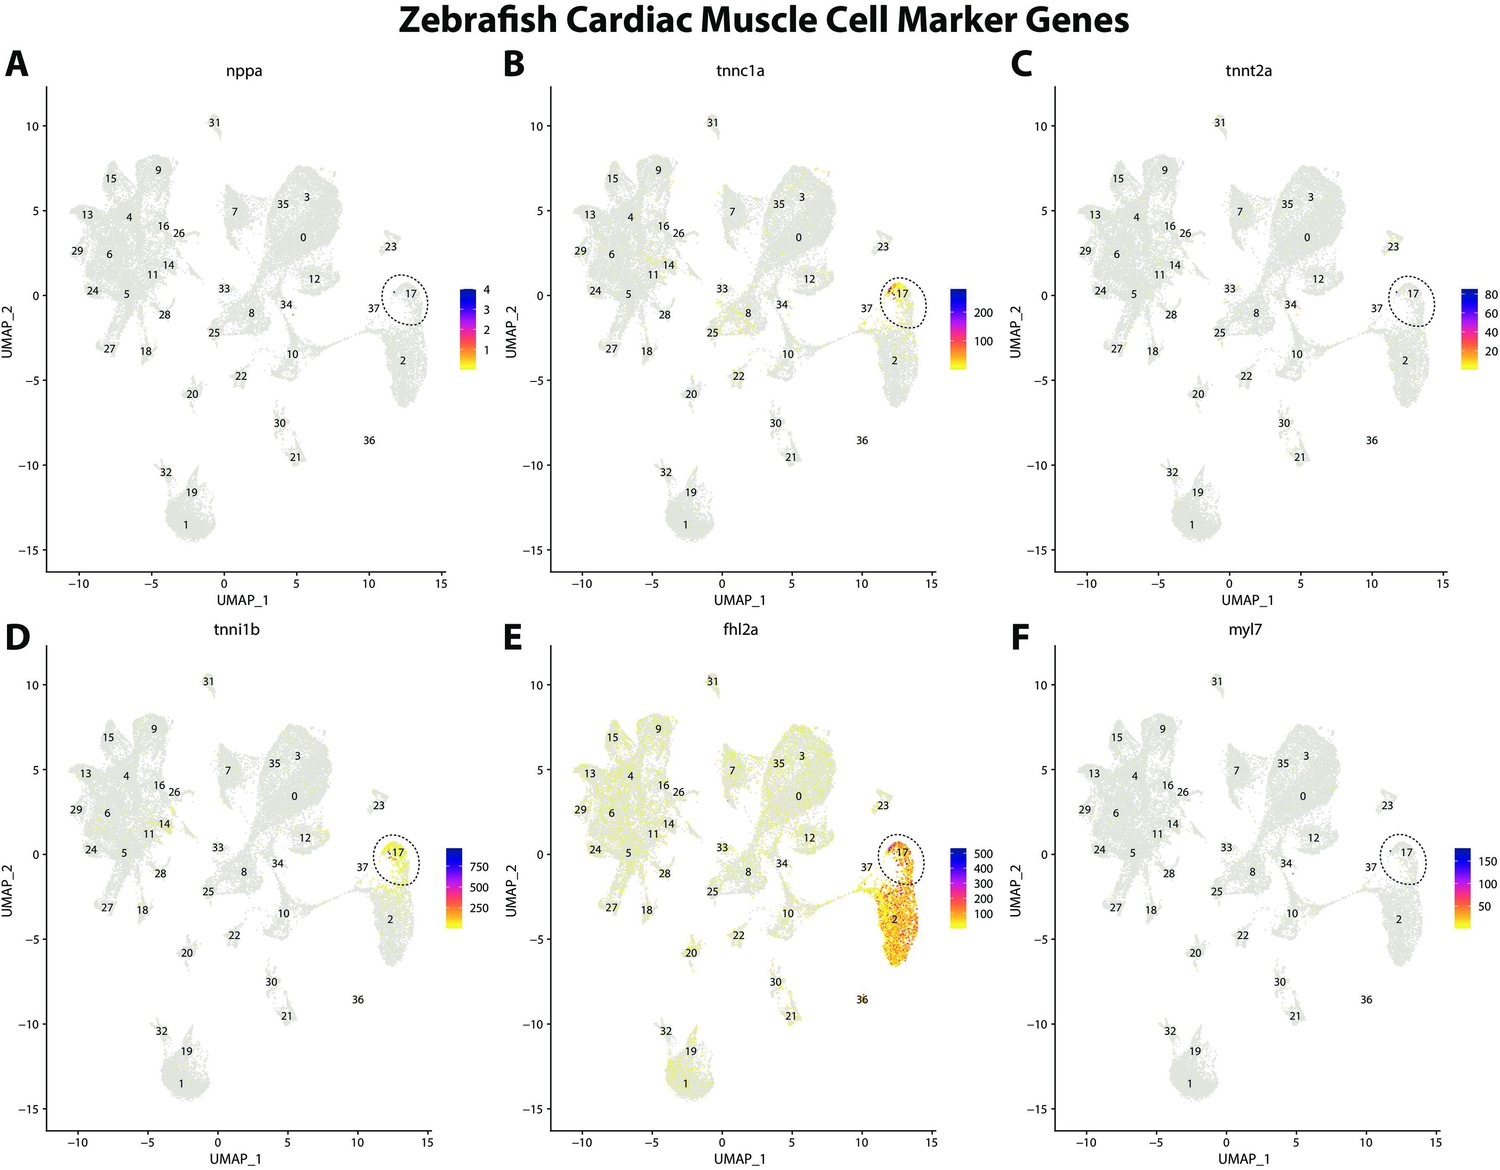
Zebrafish cardiac muscle cell marker gene expression patterns correspond with annotated cardiac muscle cells in the Gulf pipefish atlas.
Feature plots of zebrafish cardiac muscle cell marker genes identified from the Daniocell single-cell RNA sequencing (scRNAseq) database demonstrate Gulf pipefish expression. Annotated cardiac muscle cell cluster in pipefish is distinguished by a dashed outline.
Figure 2—figure supplement 6
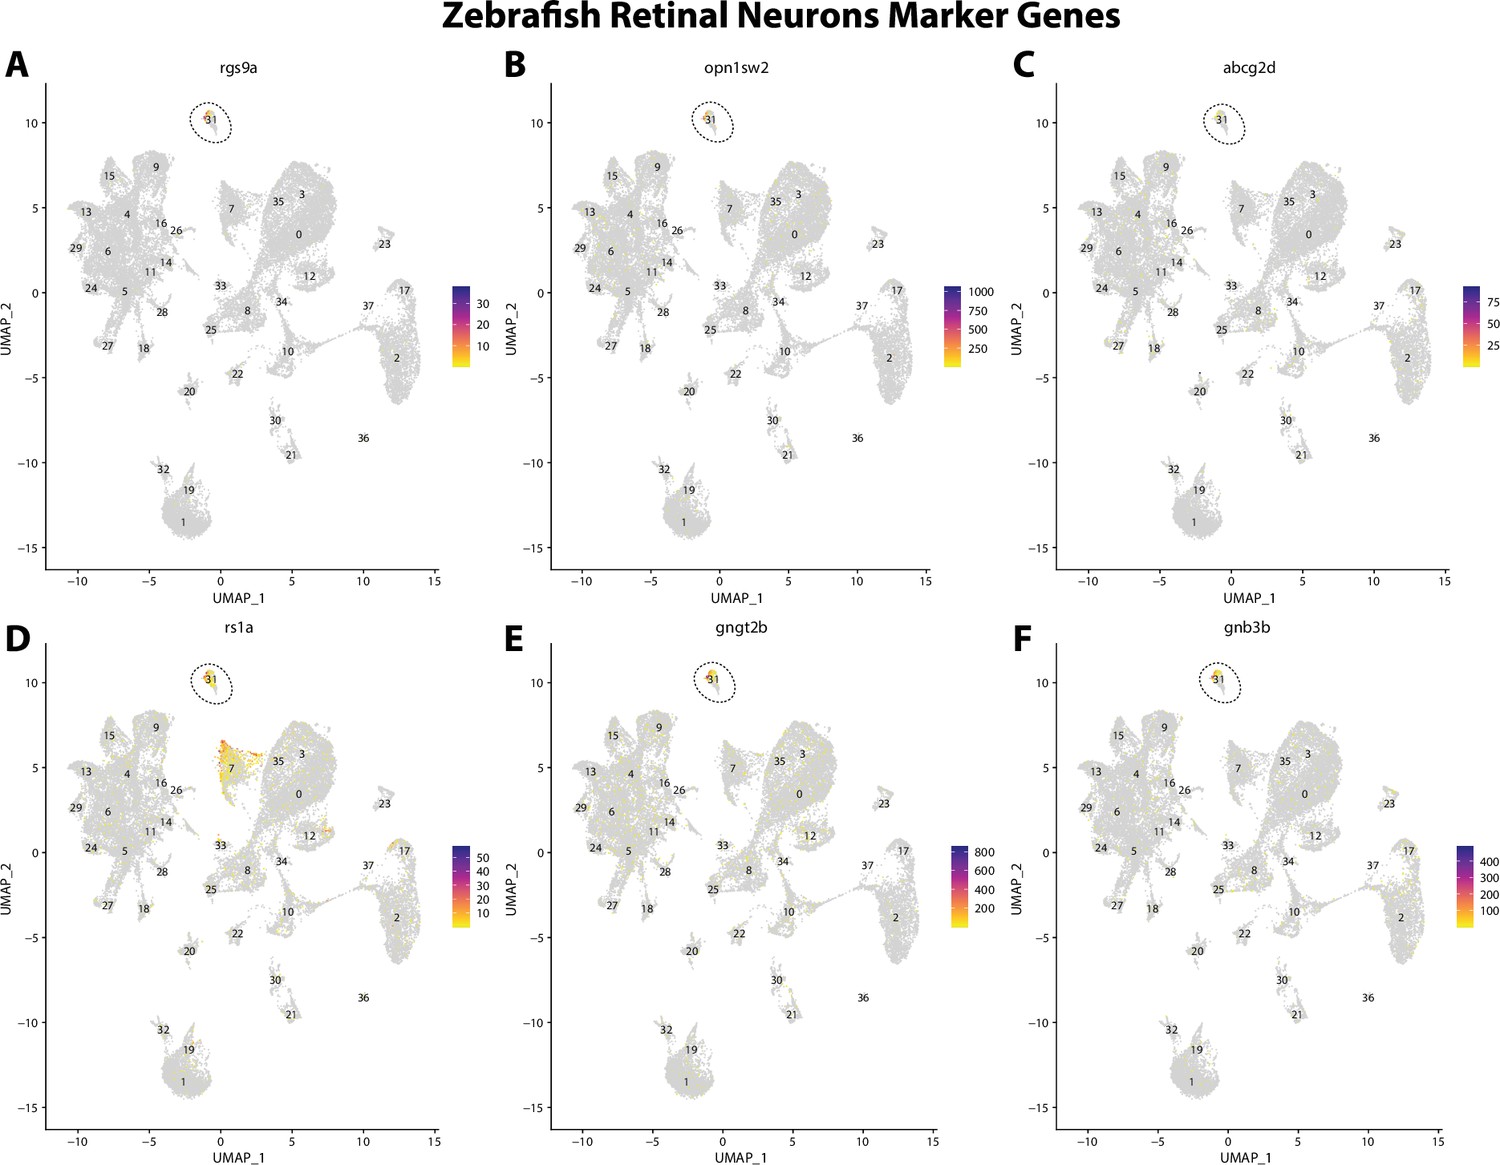
Zebrafish retinal cell marker gene expression patterns correspond with annotated retinal cells in the Gulf pipefish atlas.
Feature plots of zebrafish retinal cell marker genes identified from the Daniocell single-cell RNA sequencing (scRNAseq) database demonstrate Gulf pipefish expression. Annotated retinal cell cluster in pipefish is distinguished by a dashed outline.
Figure 2—figure supplement 7
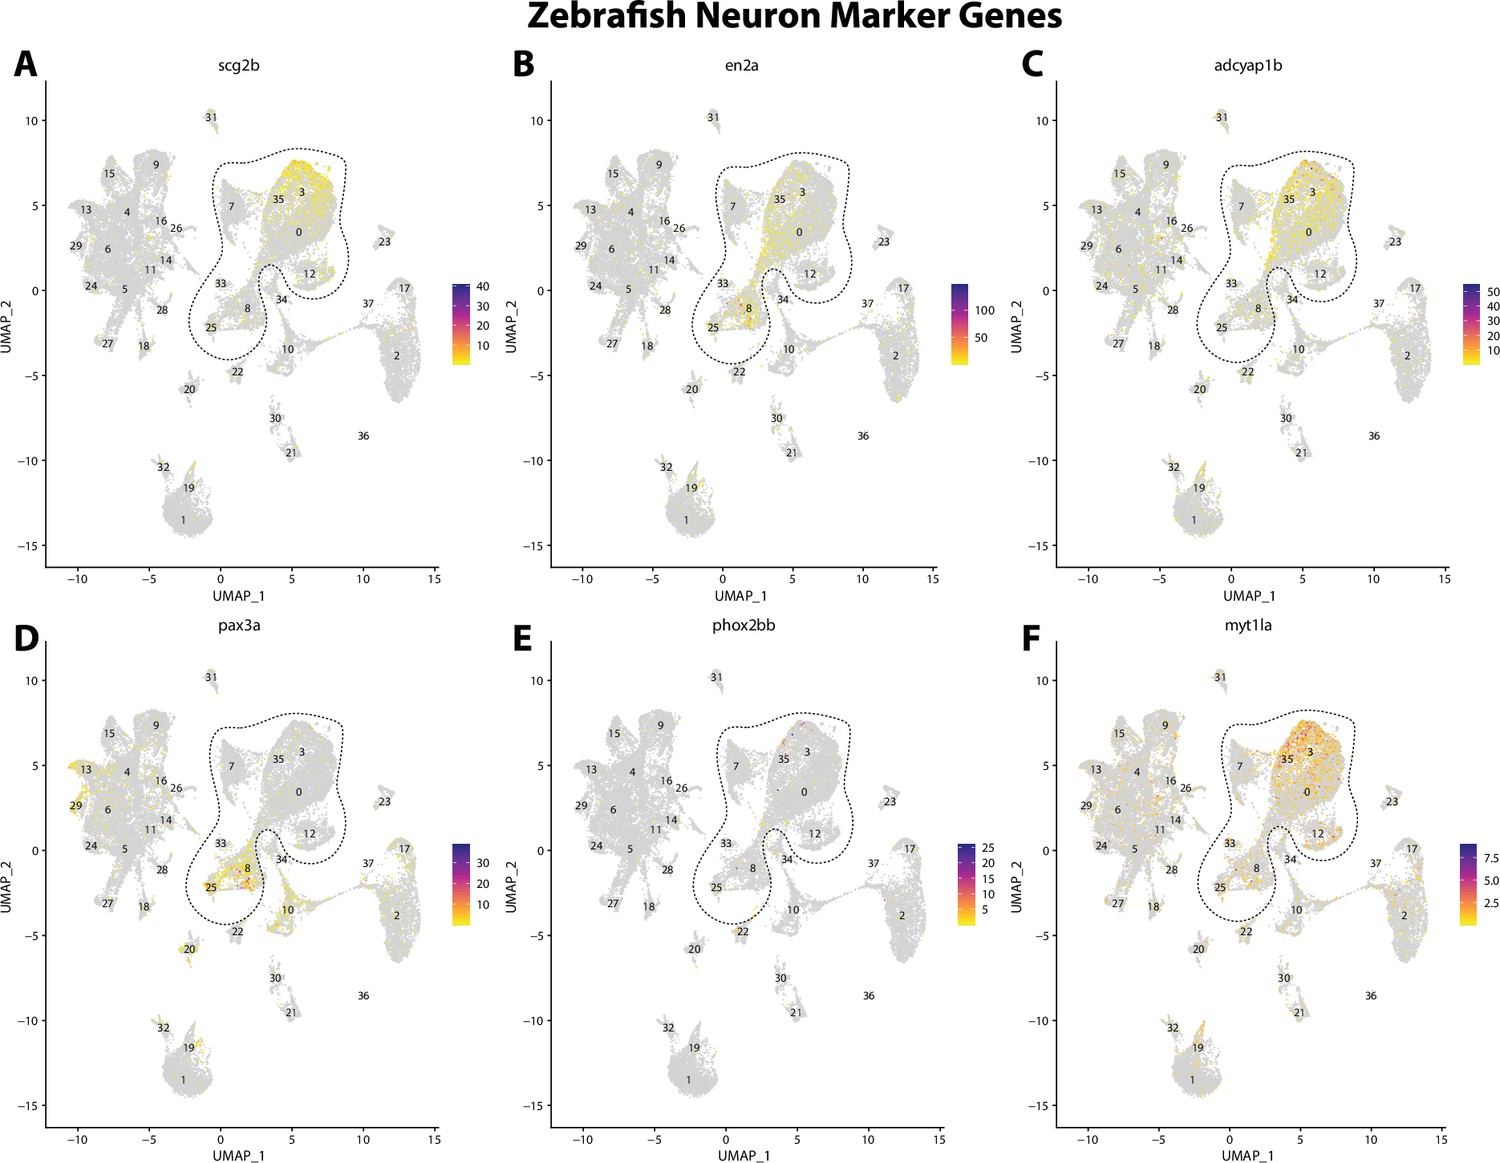
Zebrafish neuronal cell marker genes expression patterns correspond with annotated neuronal cells in the Gulf pipefish atlas.
Feature plots of zebrafish neuronal cell marker genes identified from the Daniocell single-cell RNA sequencing (scRNAseq) database demonstrate Gulf pipefish expression. Annotated neuronal cell clusters in pipefish are distinguished by a dashed outline.
Figure 2—figure supplement 8
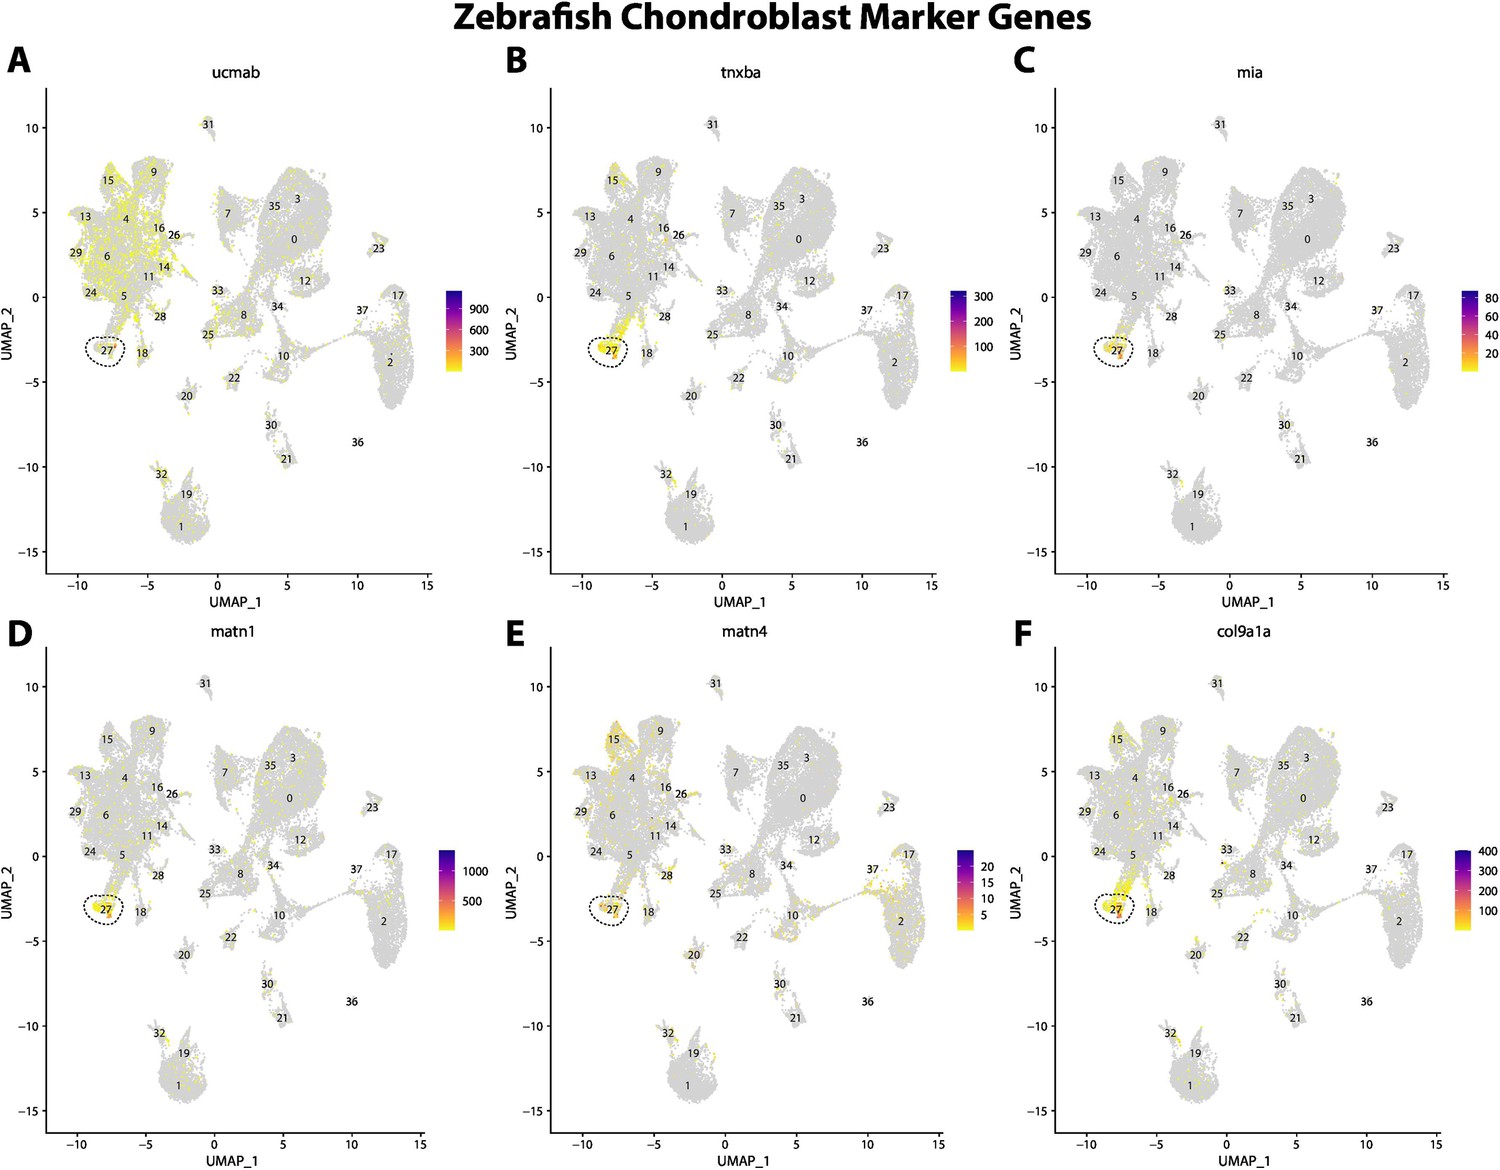
Zebrafish chondroblast cell marker gene expression patterns correspond with annotated chondroblast cells in the Gulf pipefish atlas.
Feature plots of zebrafish chondroblast cell marker genes identified from the Daniocell single-cell RNA sequencing (scRNAseq) database demonstrate Gulf pipefish expression. Annotated chondroblast cell cluster in pipefish is distinguished by a dashed outline.
Figure 2—figure supplement 9
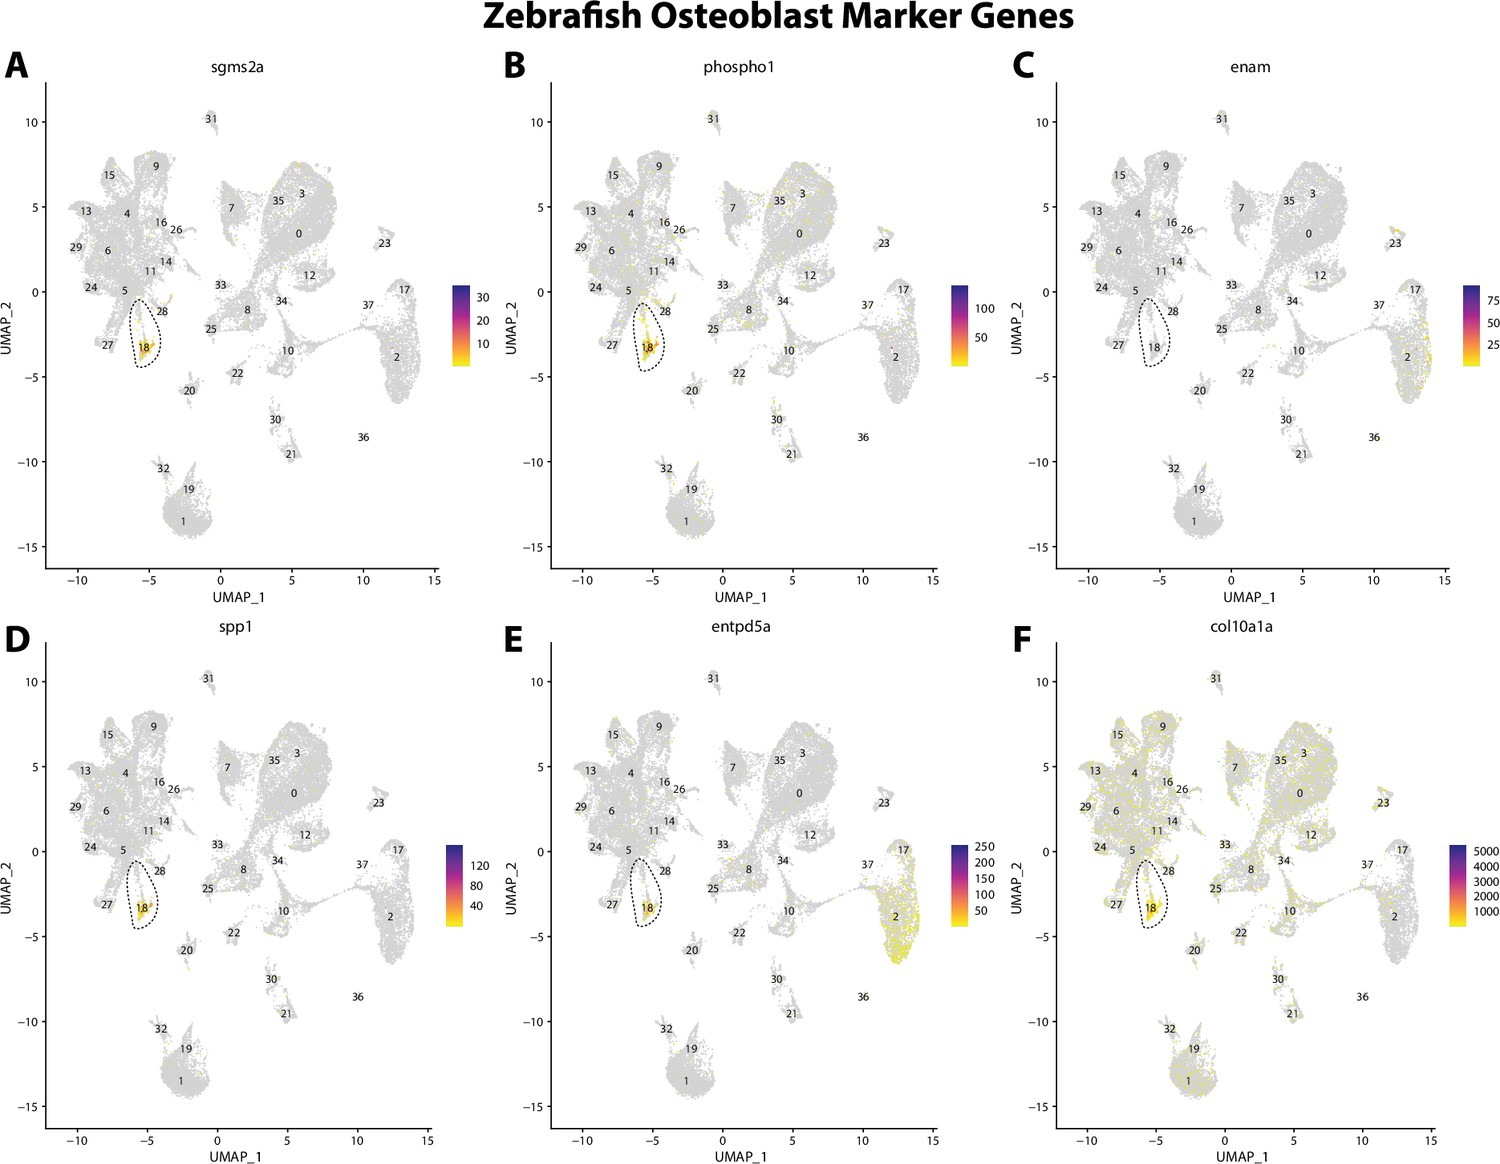
Zebrafish osteoblast cell marker gene expression patterns correspond with annotated osteoblast cells in Gulf pipefish atlas.
Feature plots of zebrafish osteoblast cell marker genes identified from the Daniocell single-cell RNA sequencing (scRNAseq) database demonstrate Gulf pipefish expression. Annotated osteoblast cell cluster in pipefish is distinguished by a dashed outline.
Figure 2—figure supplement 10
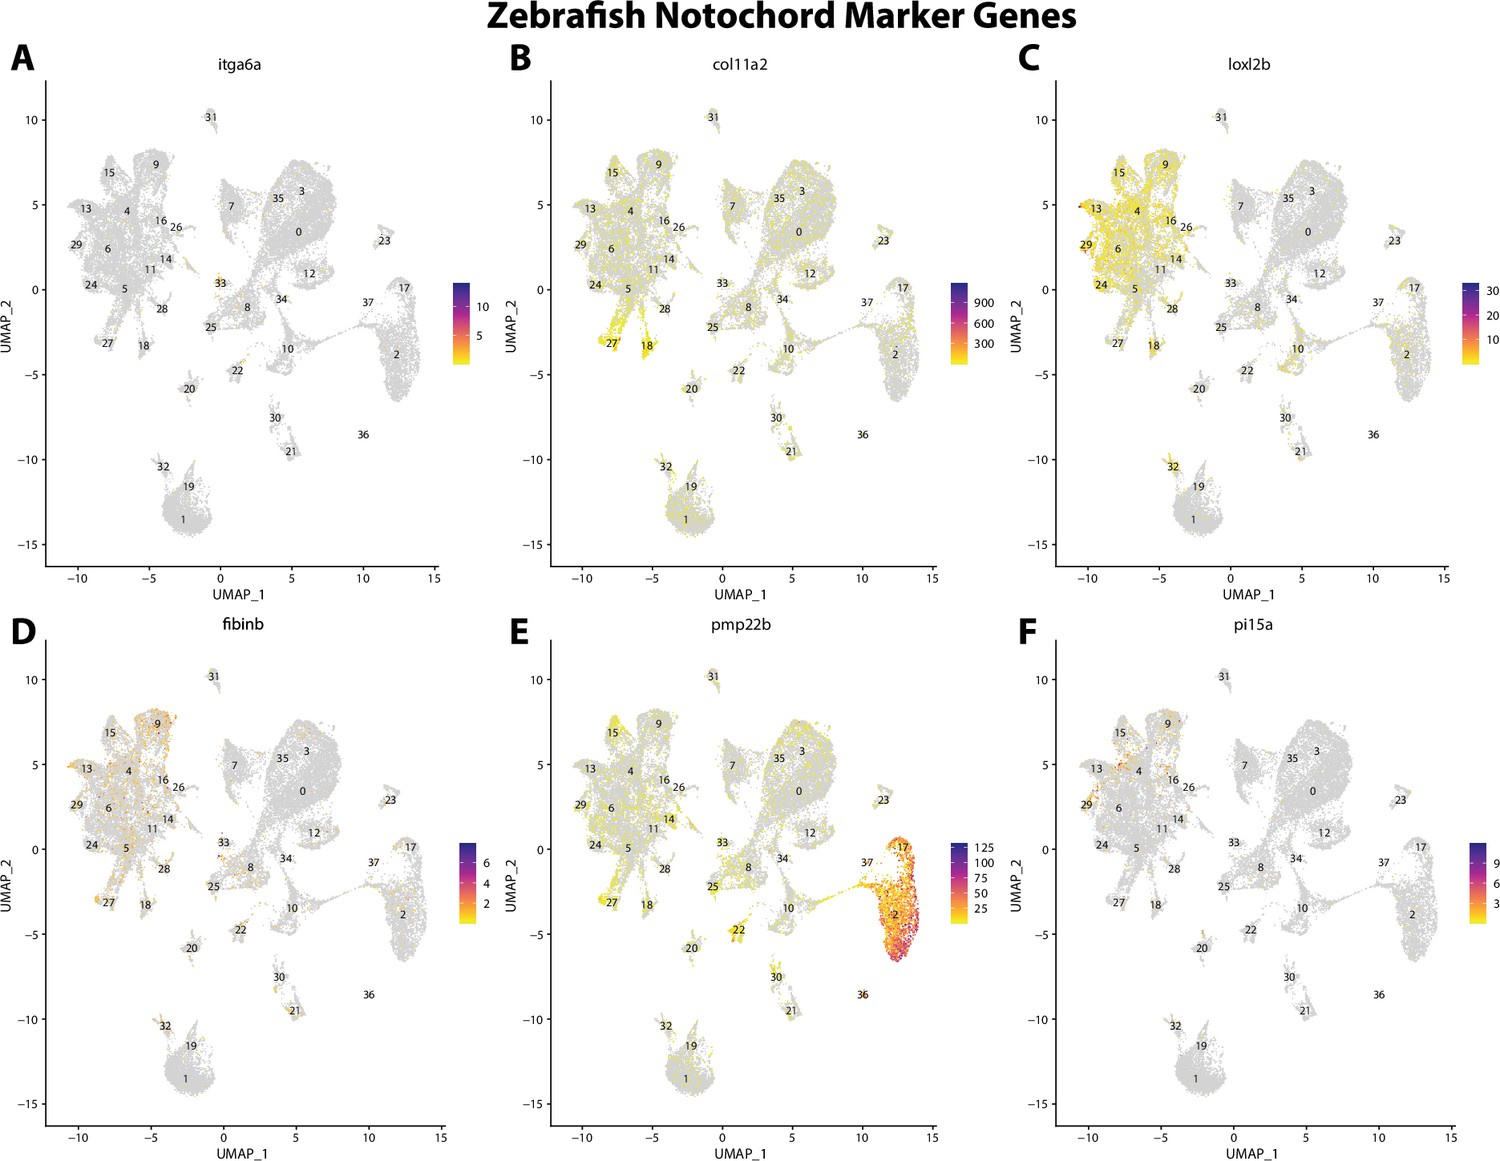
Zebrafish notochord cell marker gene expression patterns correspond with annotated notochord cells in the Gulf pipefish atlas.
Feature plots of zebrafish notochord cell marker genes identified from the Daniocell single-cell RNA sequencing (scRNAseq) database demonstrate Gulf pipefish expression. Annotated notochord cell cluster in pipefish is distinguished by a dashed outline.
Figure 2—figure supplement 11
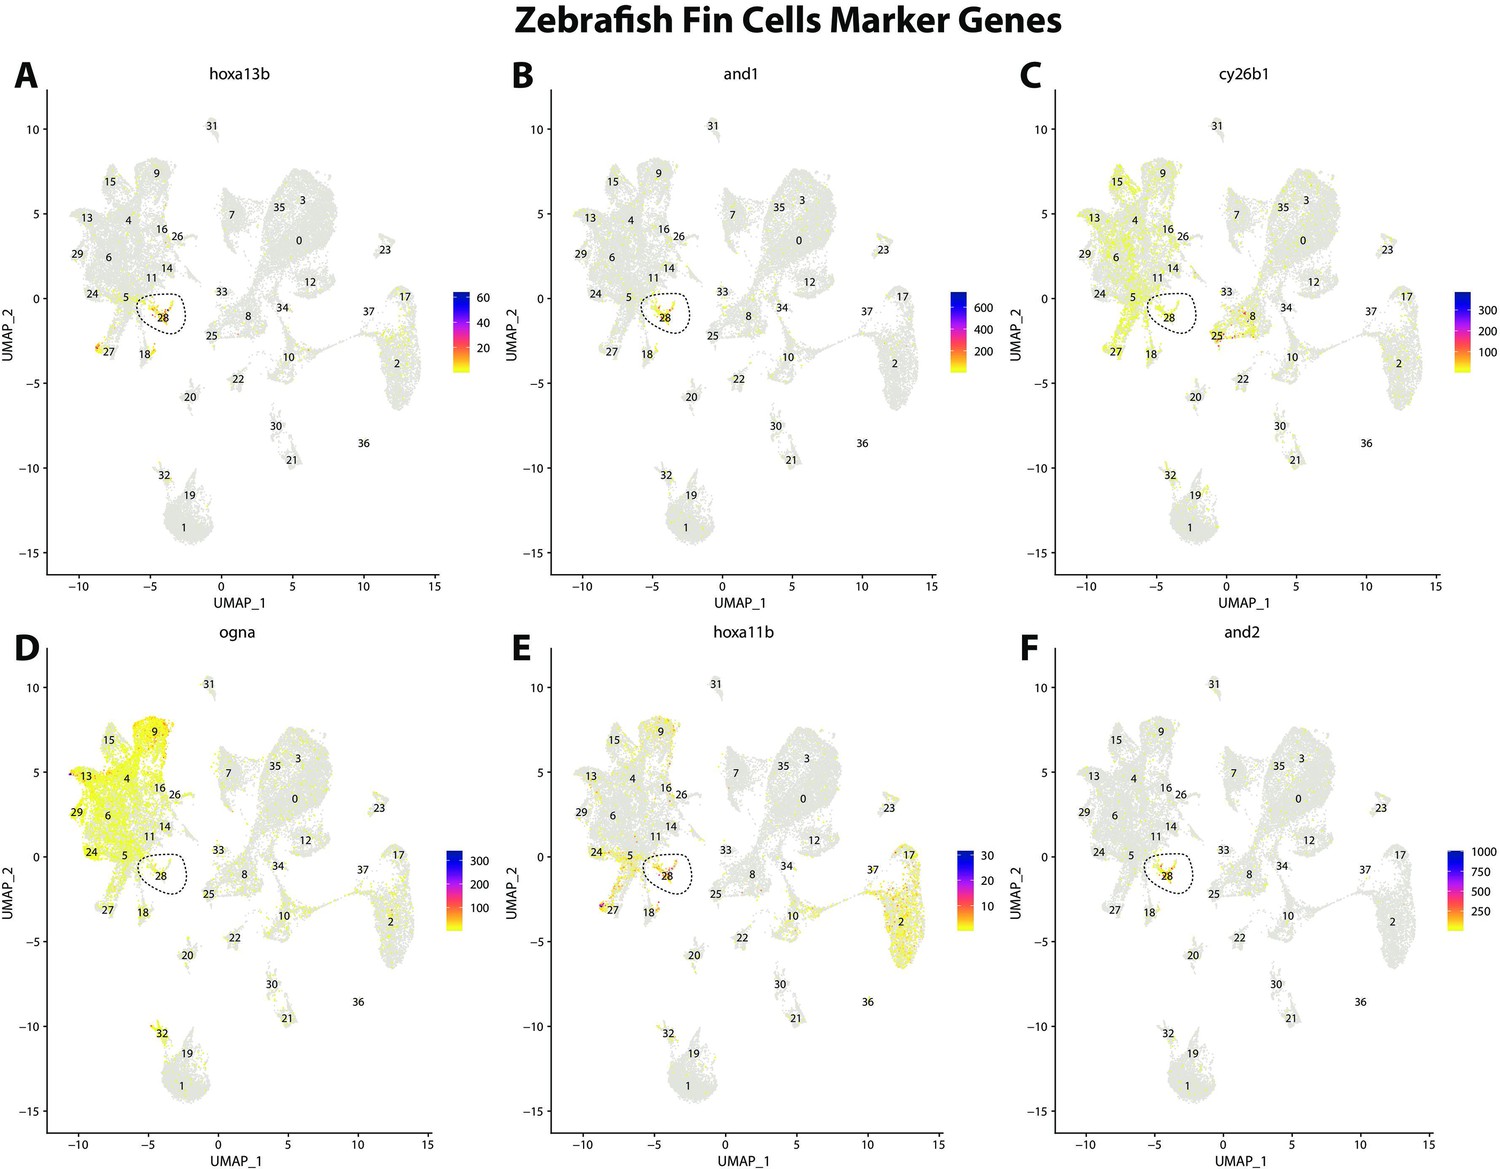
Zebrafish fin cell marker gene expression patterns correspond with annotated fin cells in the Gulf pipefish atlas.
Feature plots of zebrafish fin cell marker genes identified from the Daniocell single-cell RNA sequencing (scRNAseq) database demonstrate Gulf pipefish expression. Annotated fin cell cluster in pipefish is distinguished by a dashed outline.
Figure 2—figure supplement 12
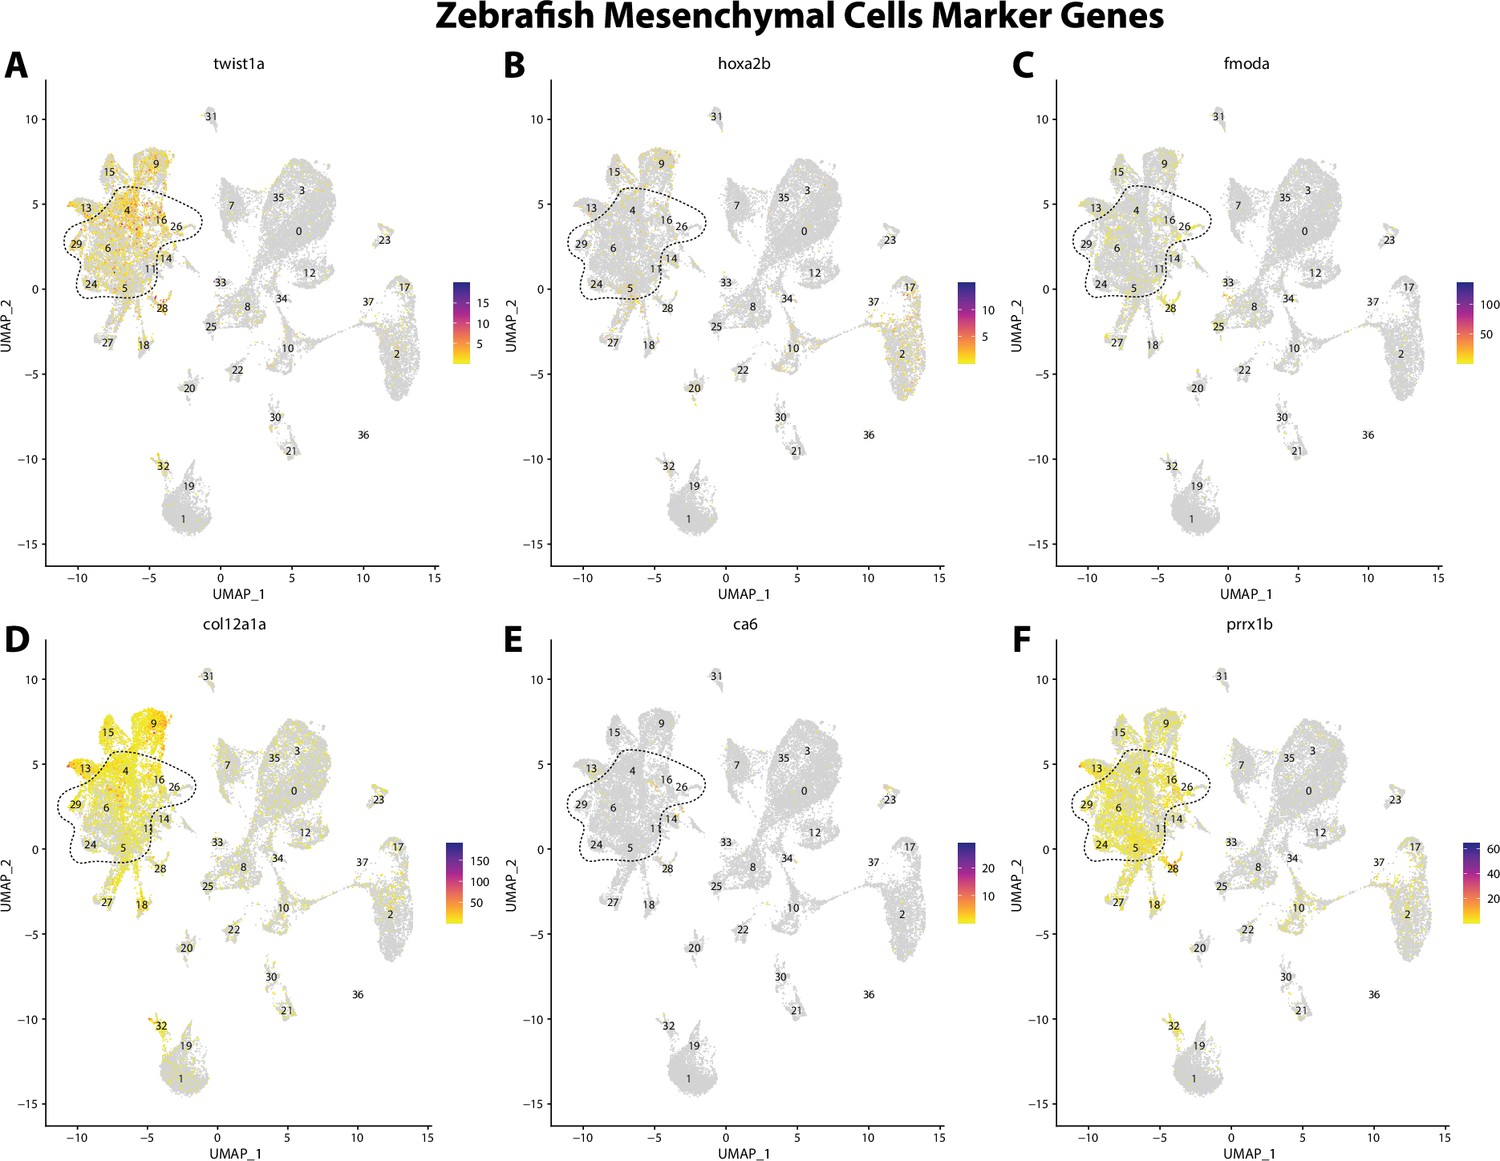
Zebrafish mesenchymal cell marker gene expression patterns correspond with annotated mesenchymal cells in the Gulf pipefish atlas.
Feature plots of zebrafish mesenchymal cell marker genes identified from the Daniocell single-cell RNA sequencing (scRNAseq) database demonstrate Gulf pipefish expression. Annotated mesenchymal cell clusters in pipefish are distinguished by a dashed outline.
Figure 2—figure supplement 13
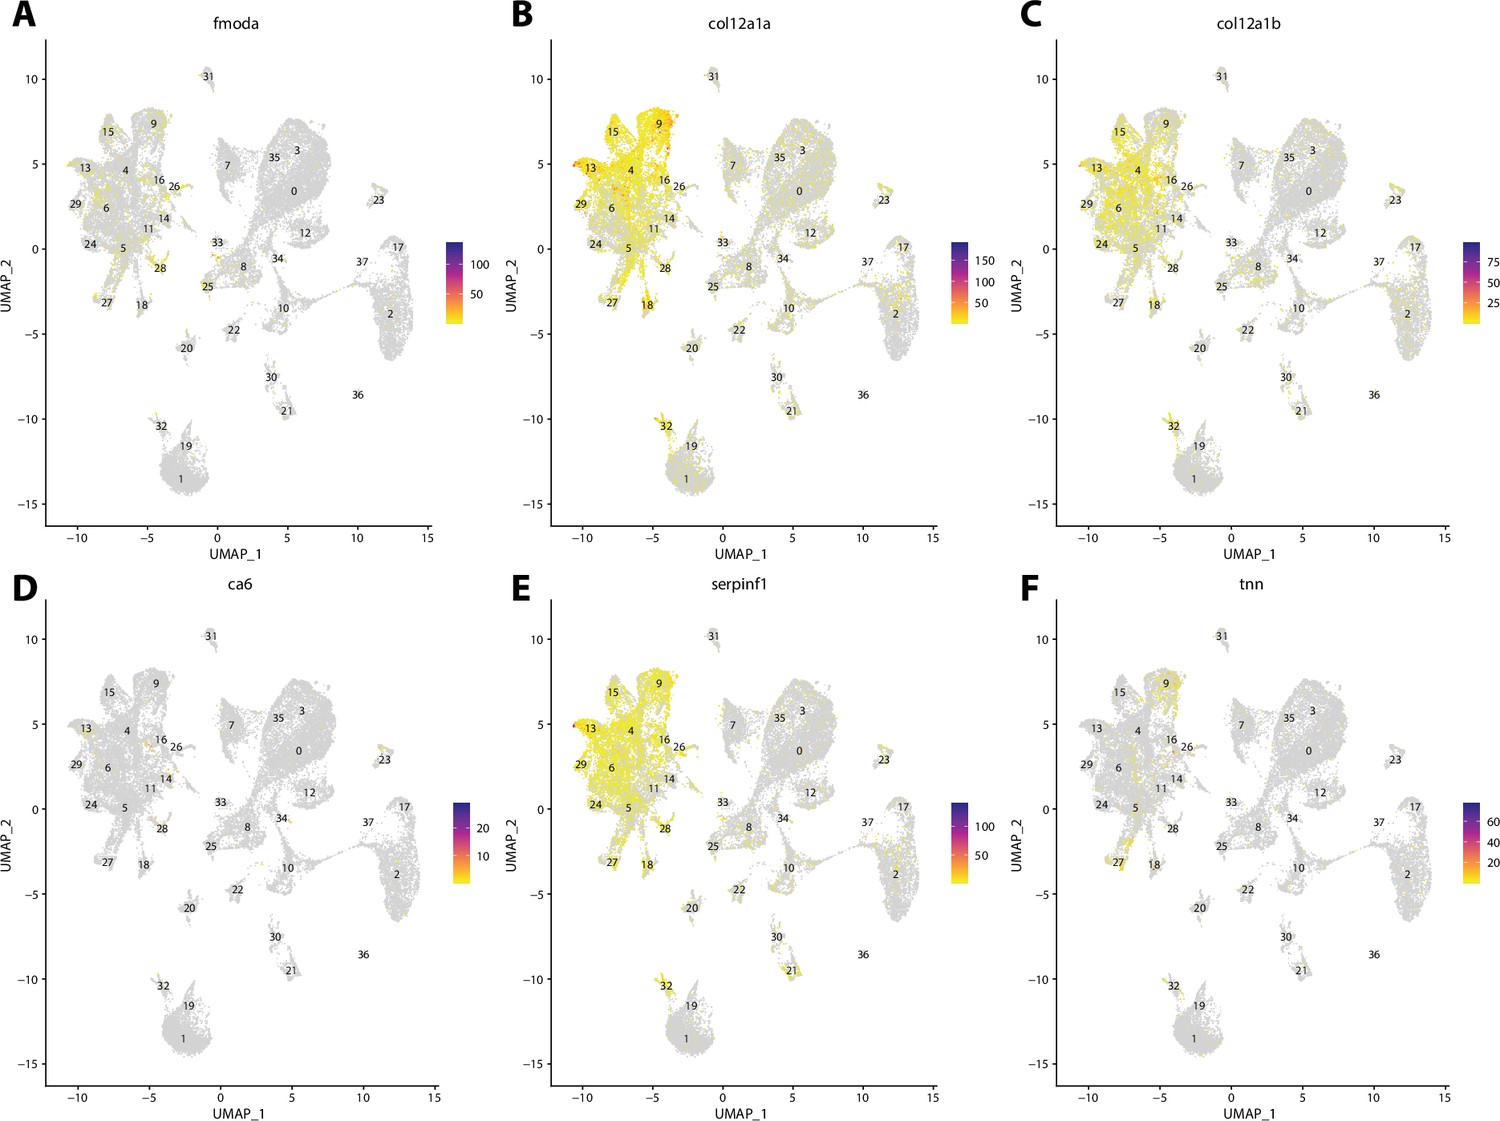
Zebrafish tenocyte cell marker gene expression patterns correspond with annotated tenocyte cells in the Gulf pipefish atlas.
Feature plots of zebrafish tenocyte cell marker genes identified from the Daniocell single-cell RNA sequencing (scRNAseq) database demonstrate Gulf pipefish expression. Annotated tenocyte and ligament cell cluster in pipefish is distinguished by a dashed outline.
Figure 2—figure supplement 14
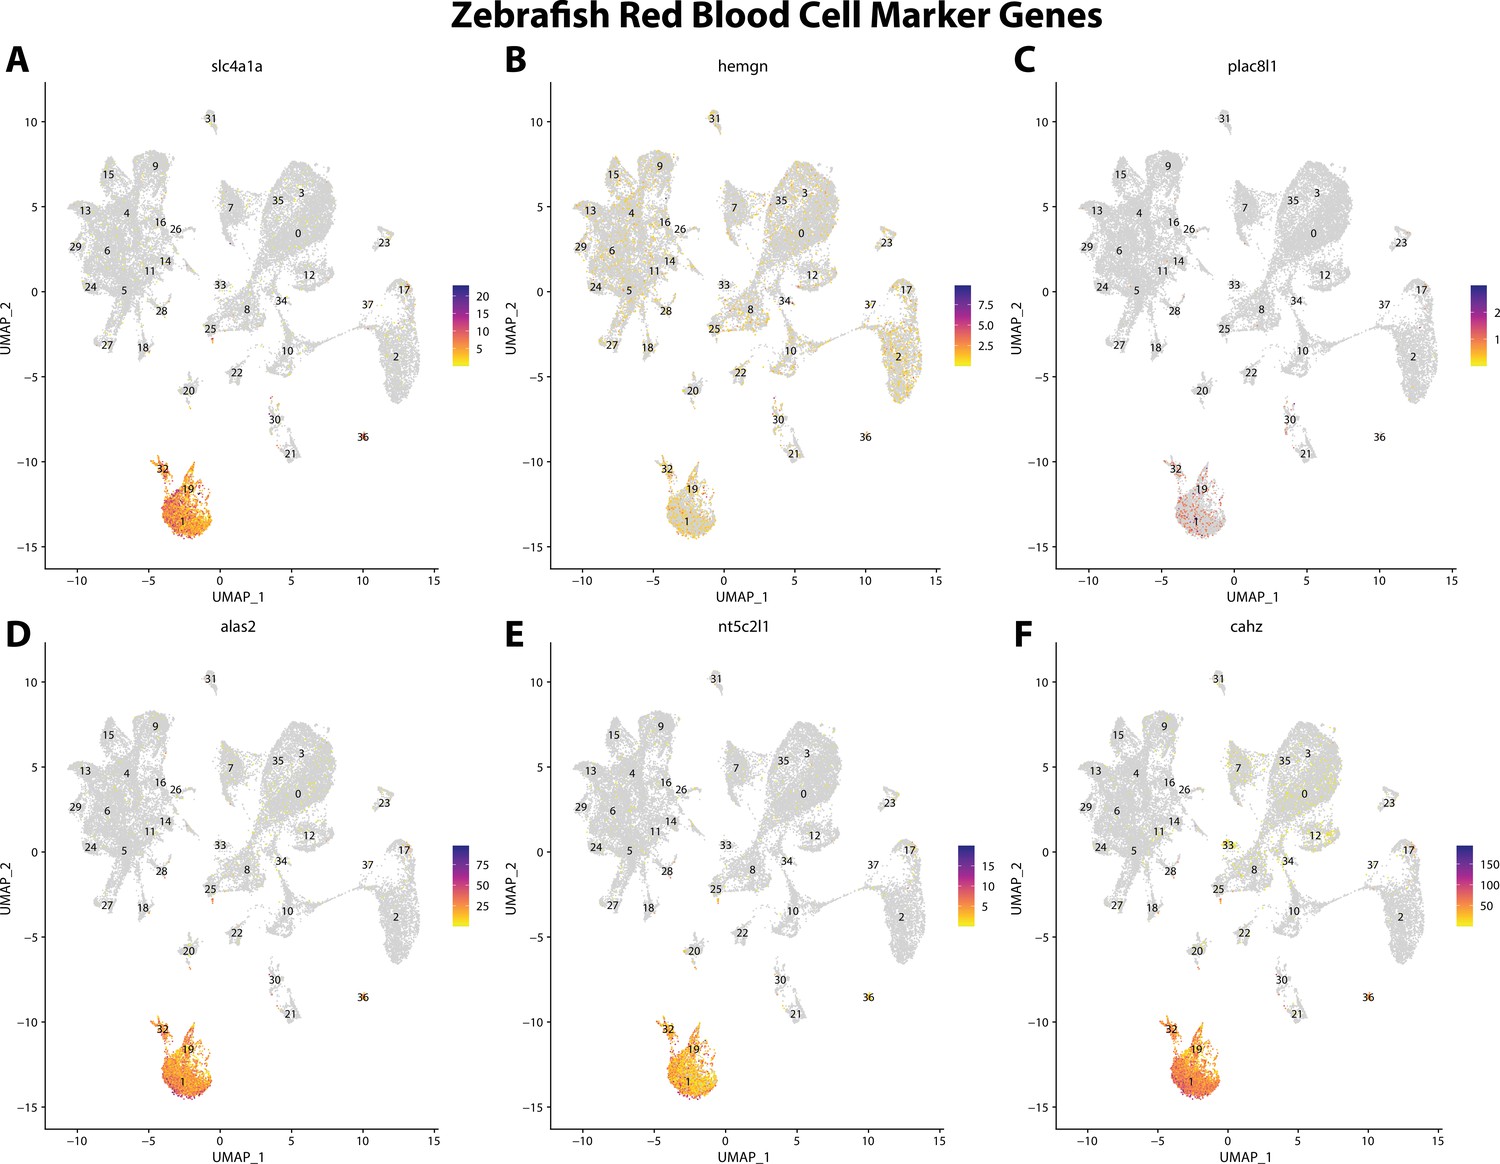
Zebrafish erythrocyte cell marker gene expression patterns correspond with annotated erythrocyte cells in the Gulf pipefish atlas.
Feature plots of zebrafish erythrocyte cell marker genes identified from the Daniocell single-cell RNA sequencing (scRNAseq) database demonstrate Gulf pipefish expression. Annotated erythrocyte cell clusters in pipefish are distinguished by a dashed outline.
Figure 2—figure supplement 15
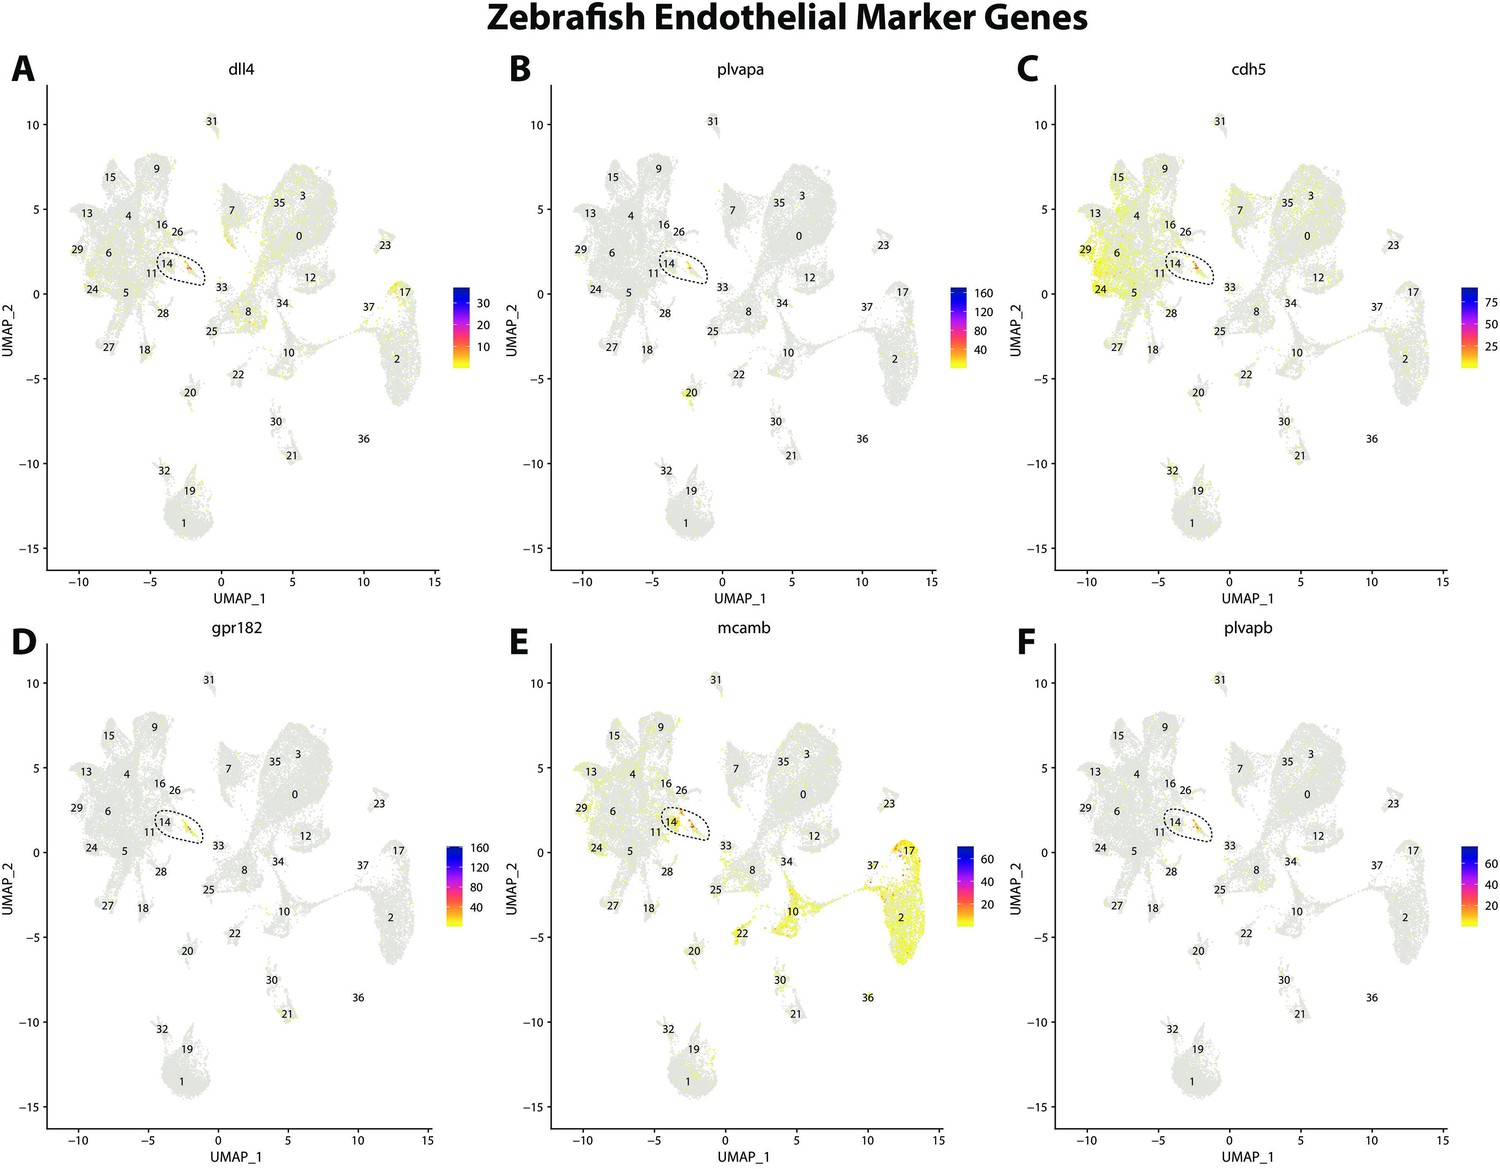
Zebrafish endothelial cell marker gene expression patterns correspond with annotated endothelial cells in the Gulf pipefish atlas.
Feature plots of zebrafish endothelial cell marker genes identified from the Daniocell single-cell RNA sequencing (scRNAseq) database demonstrate Gulf pipefish expression. Annotated endothelial cell cluster in pipefish is distinguished by a dashed outline.
Figure 2—figure supplement 16
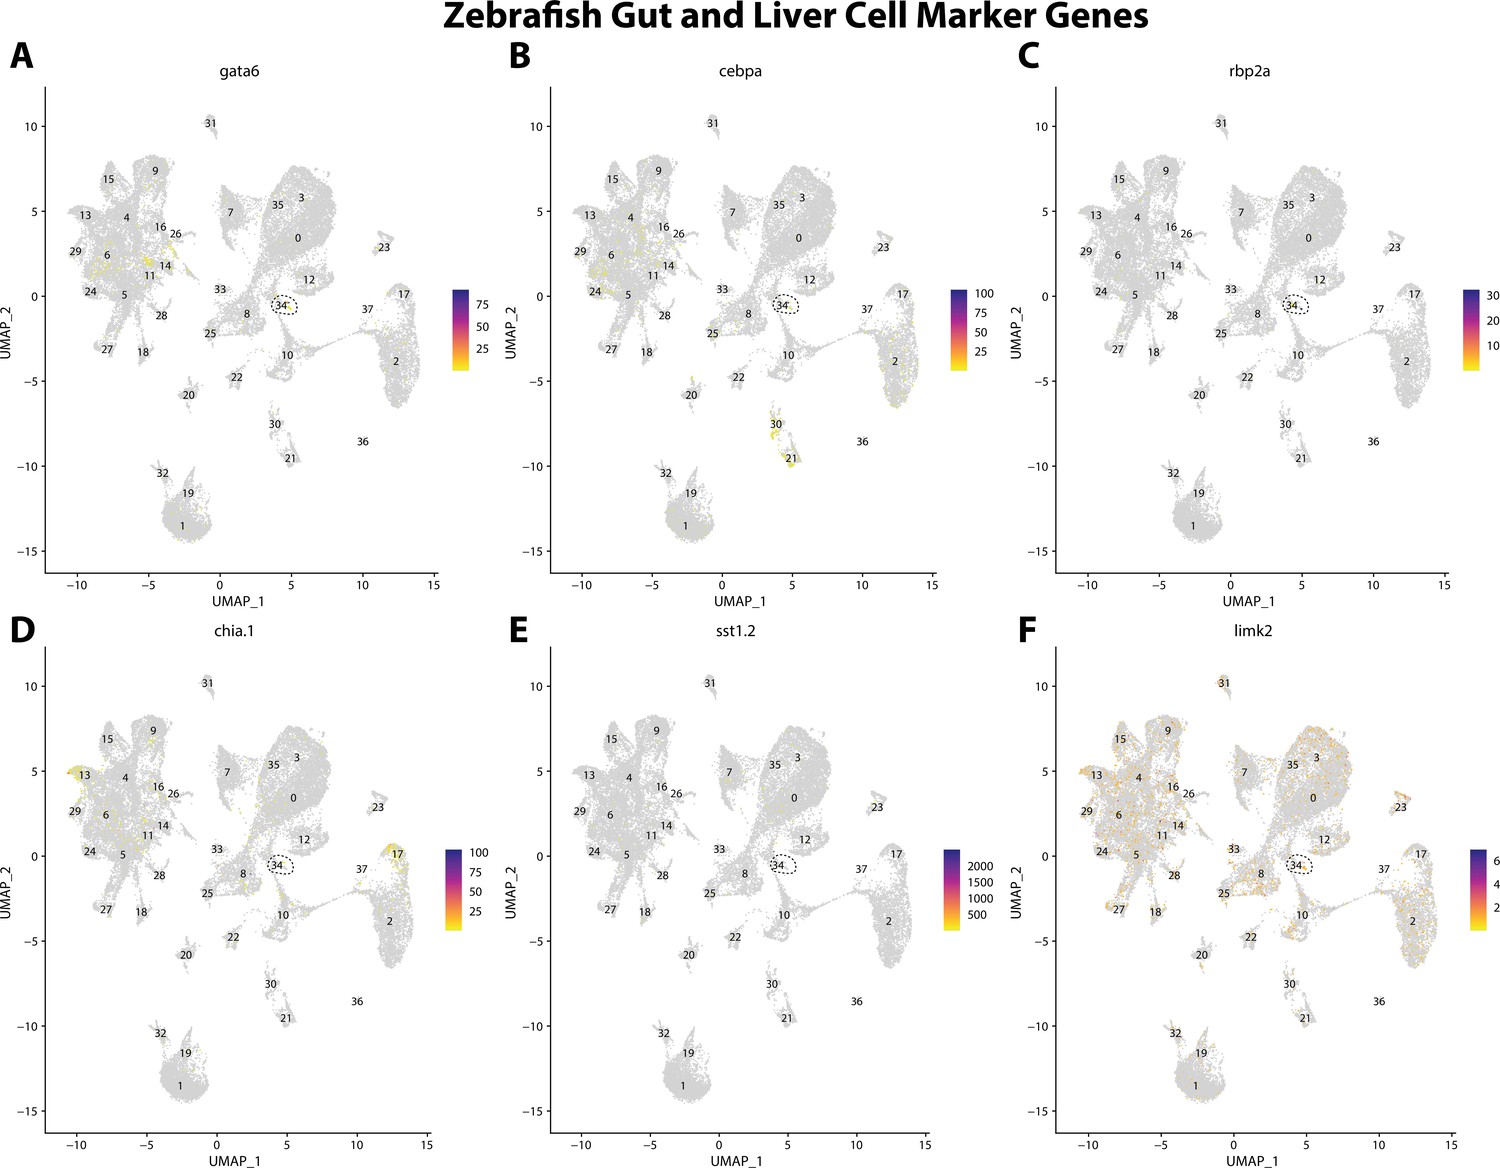
Zebrafish gut and liver cell marker gene expression patterns correspond with annotated gut and liver cells in the Gulf pipefish atlas.
Feature plots of zebrafish gut and liver cell marker genes identified from the Daniocell single-cell RNA sequencing (scRNAseq) database demonstrate Gulf pipefish expression. Annotated gut and liver cell cluster in pipefish is distinguished by a dashed outline.
Figure 2—figure supplement 17
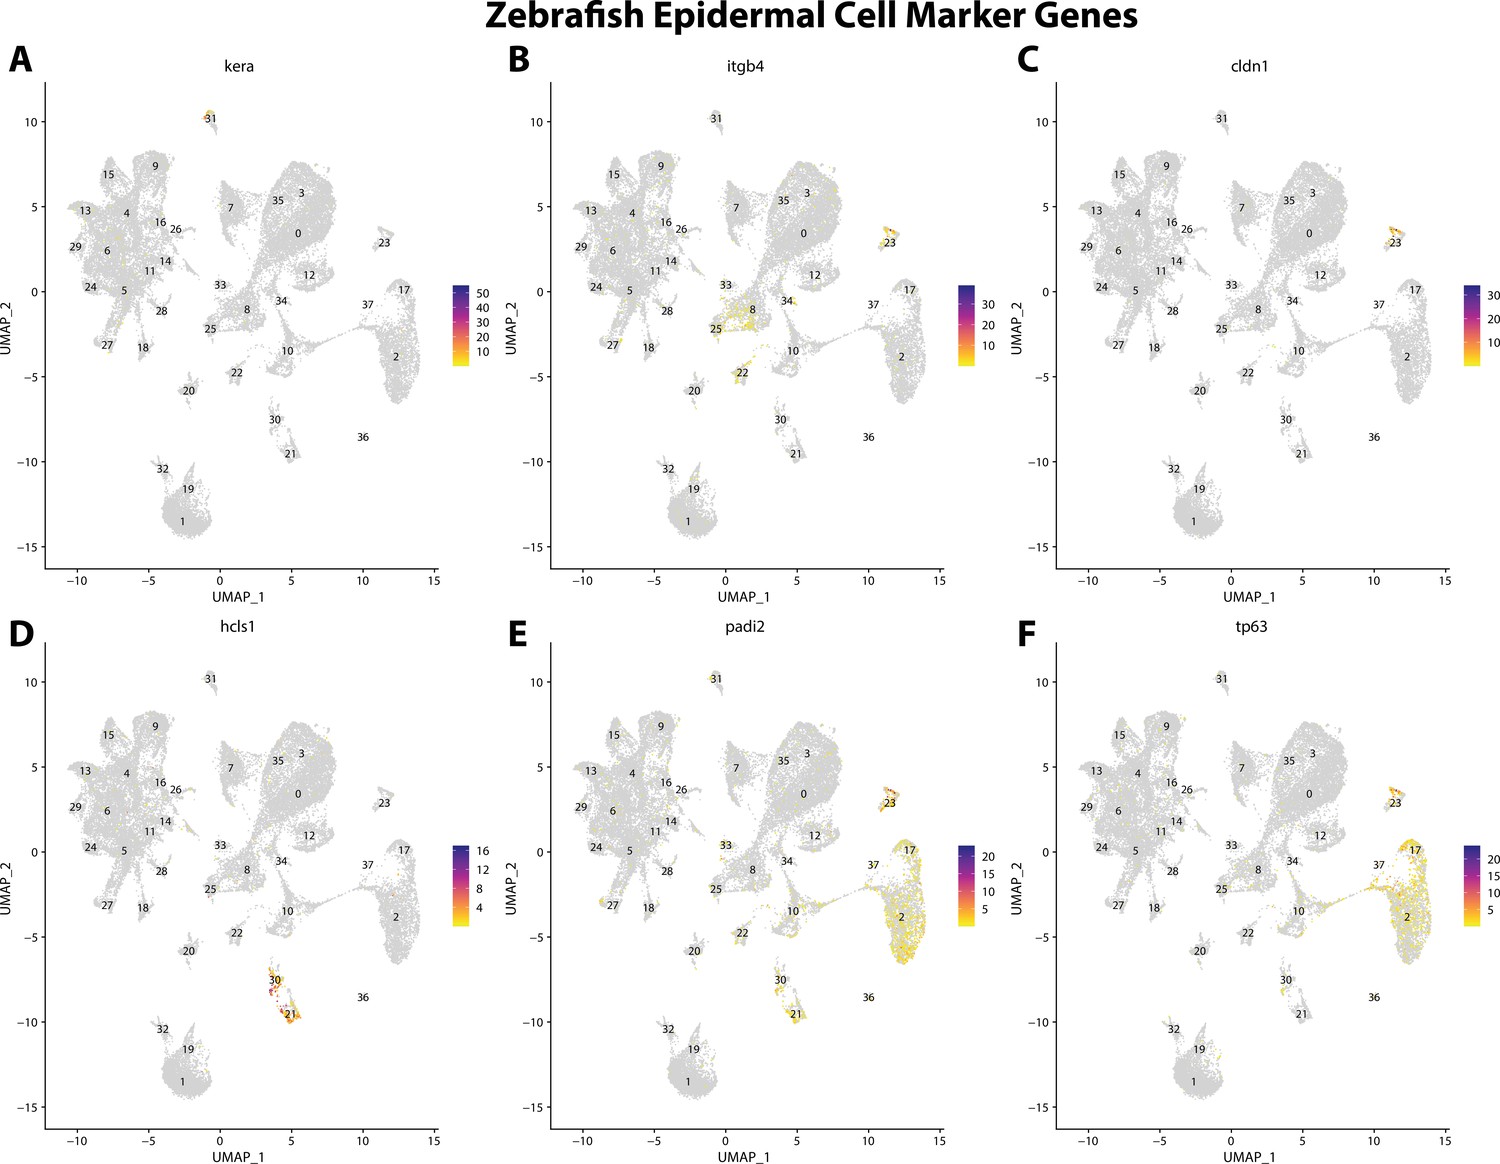
Zebrafish epidermal cell marker gene expression patterns correspond with annotated epidermal cells in the Gulf pipefish atlas.
Feature plots of zebrafish epidermal cell marker genes identified from the Daniocell single-cell RNA sequencing (scRNAseq) database demonstrate Gulf pipefish expression. Annotated epidermal cell cluster in pipefish is distinguished by a dashed outline.
Figure 2—figure supplement 18
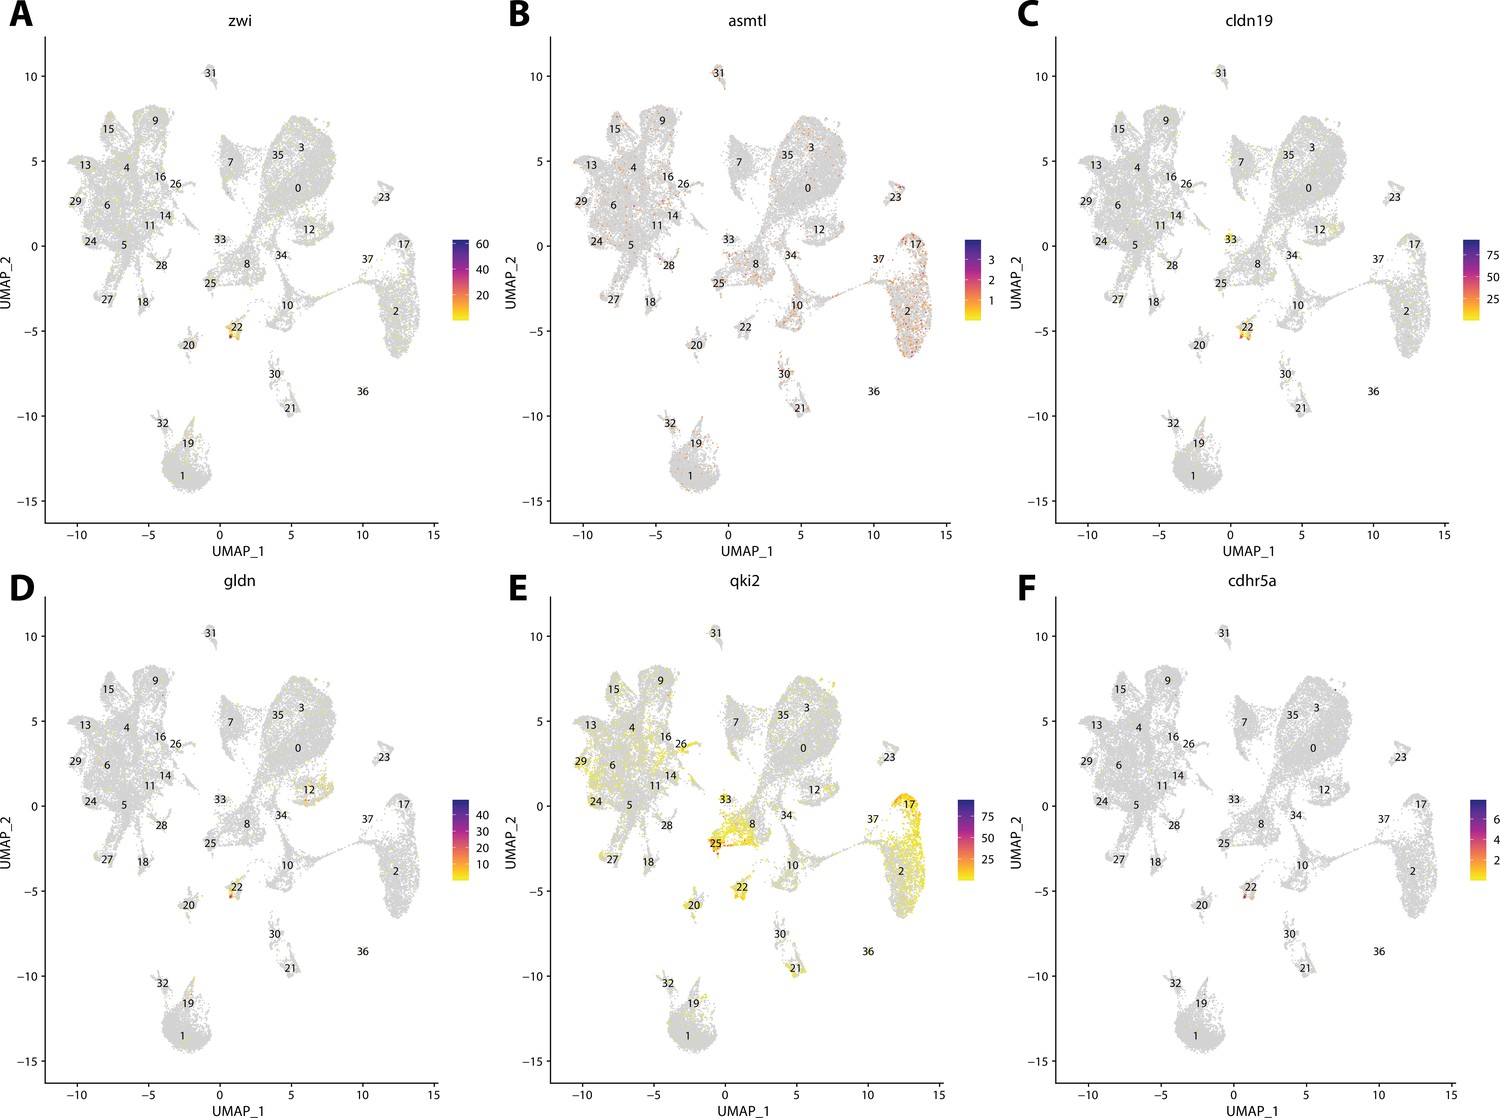
Zebrafish glial cell marker gene expression patterns correspond with annotated glial cells in the Gulf pipefish atlas.
Feature plots of zebrafish glial cell marker genes identified from the Daniocell single-cell RNA sequencing (scRNAseq) database demonstrate Gulf pipefish expression. Annotated glial cell cluster in pipefish is distinguished by a dashed outline.
Figure 2—figure supplement 19
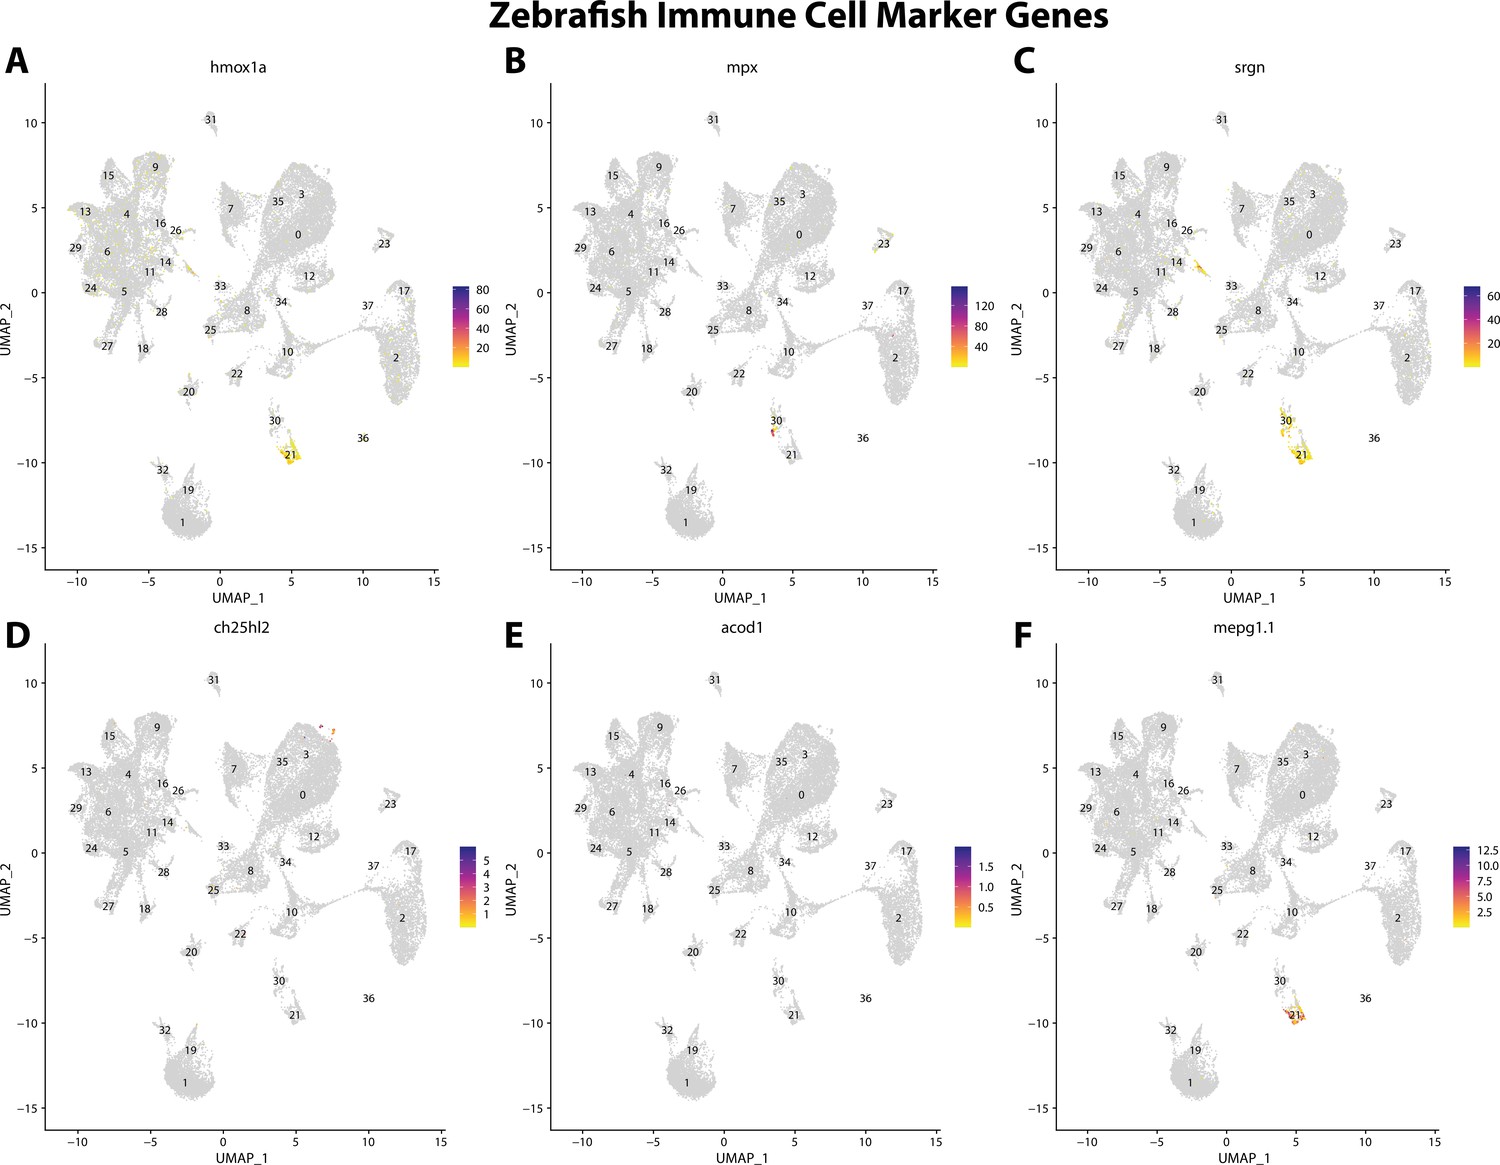
Zebrafish immune cell marker gene expression patterns correspond with annotated immune cells in the Gulf pipefish atlas.
Feature plots of zebrafish immune cell marker genes identified from the Daniocell single-cell RNA sequencing (scRNAseq) database demonstrate Gulf pipefish expression. Annotated immune cell clusters in pipefish are distinguished by a dashed outline.
Figure 2—figure supplement 20
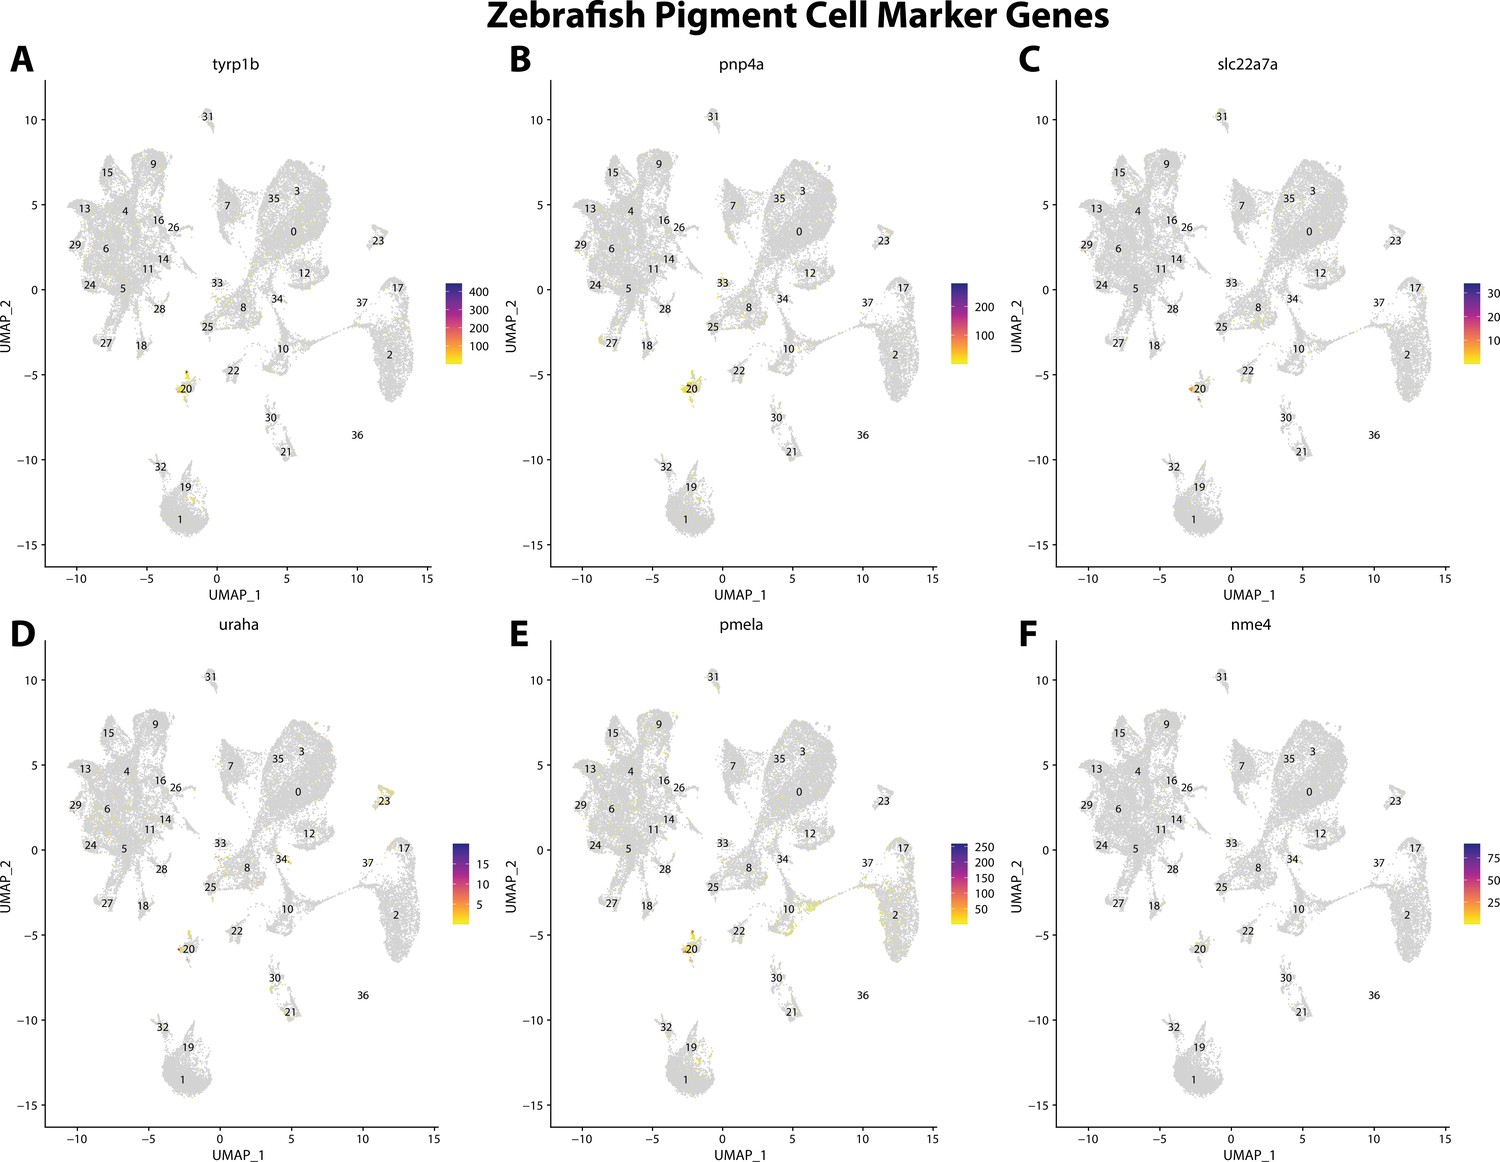
Zebrafish pigment cell marker gene expression patterns correspond with annotated pigment cells in the Gulf pipefish atlas.
Feature plots of zebrafish pigment cell marker genes identified from the Daniocell single-cell RNA sequencing (scRNAseq) database demonstrate Gulf pipefish expression. Annotated pigment cell cluster in pipefish is distinguished by a dashed outline.
Figure 2—figure supplement 21
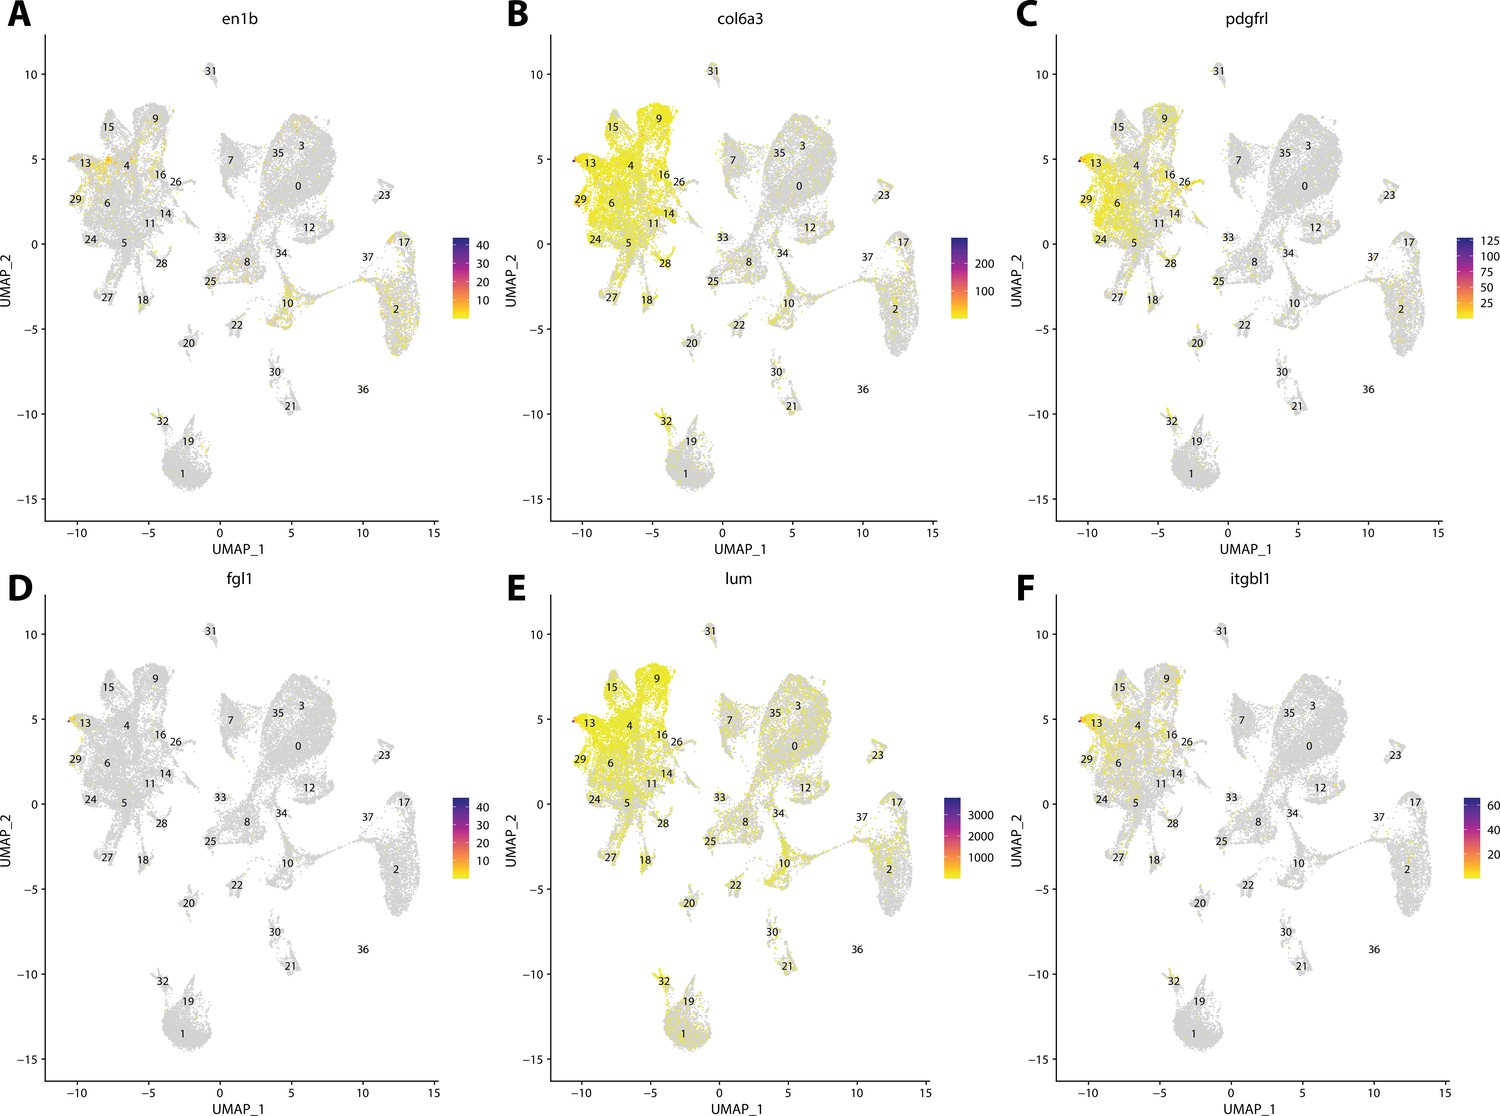
Zebrafish fibroblast cell marker gene expression patterns correspond with annotated fibroblast cells in the Gulf pipefish atlas.
Feature plots of zebrafish fibroblast cell marker genes identified from the Daniocell single-cell RNA sequencing (scRNAseq) database demonstrate Gulf pipefish expression. Annotated fibroblast cell cluster in pipefish is distinguished by a dashed outline.
Figure 2—figure supplement 22
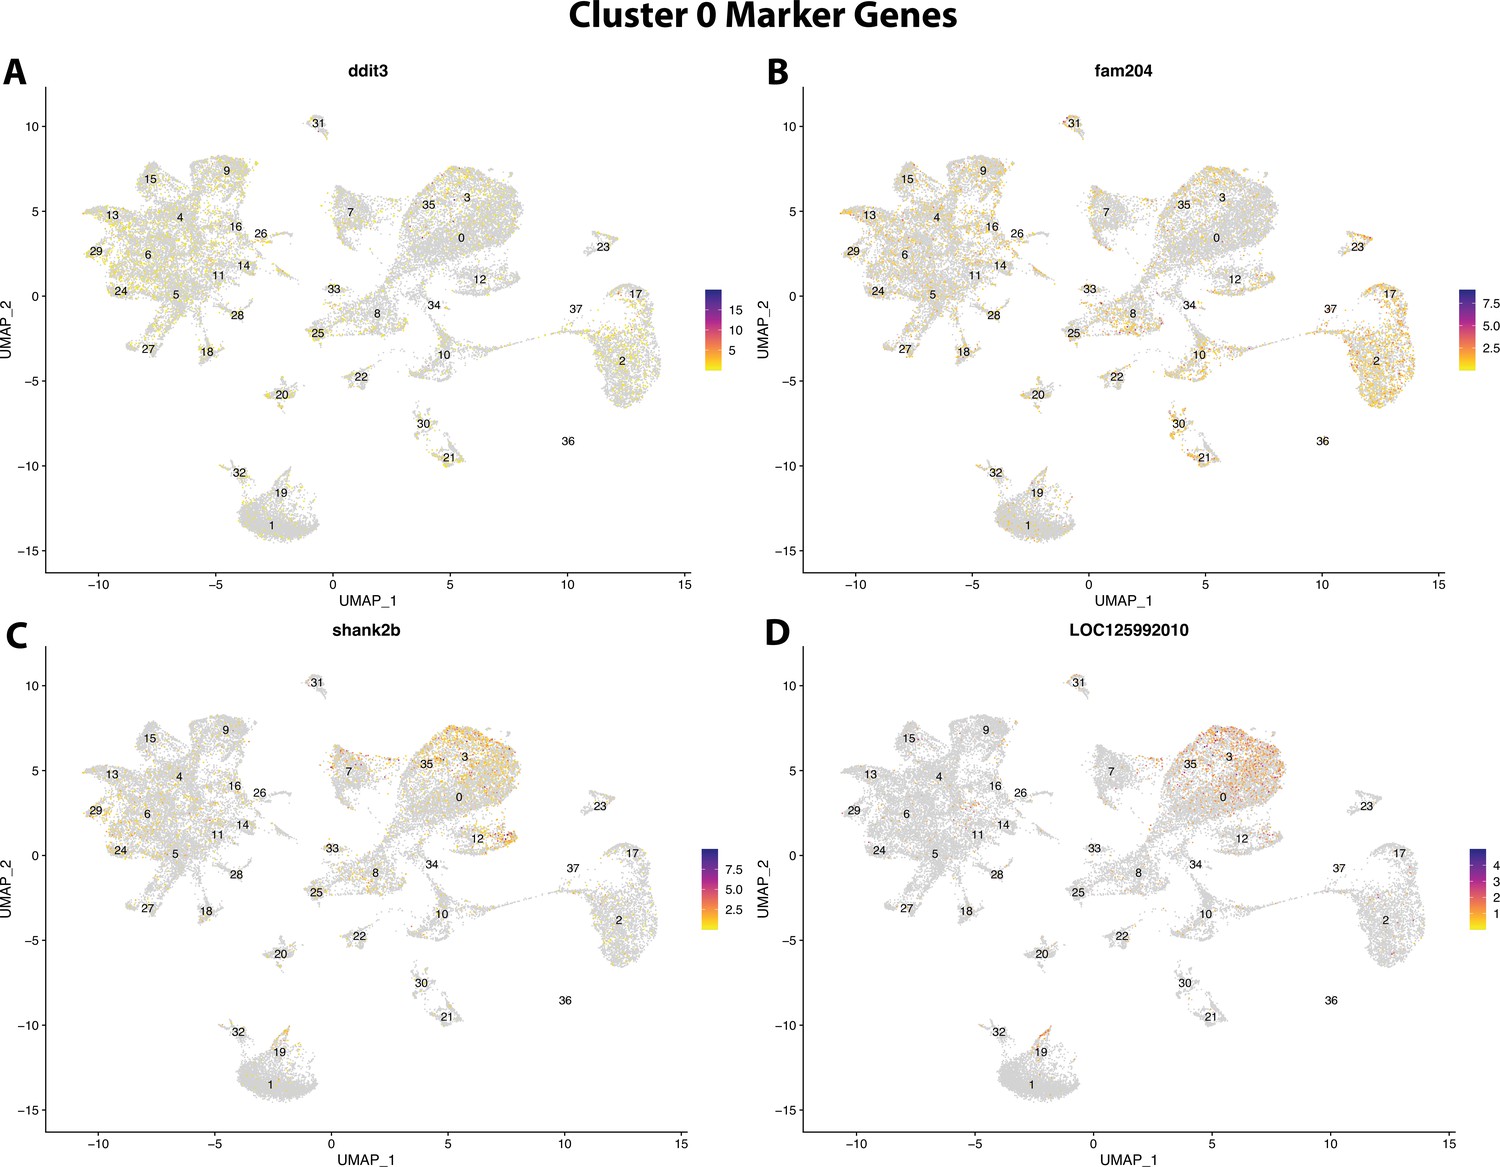
Gulf pipefish cluster 0 markers.
Feature plots of top markers for cluster 0 identified from the marker gene lists.
Figure 2—figure supplement 23
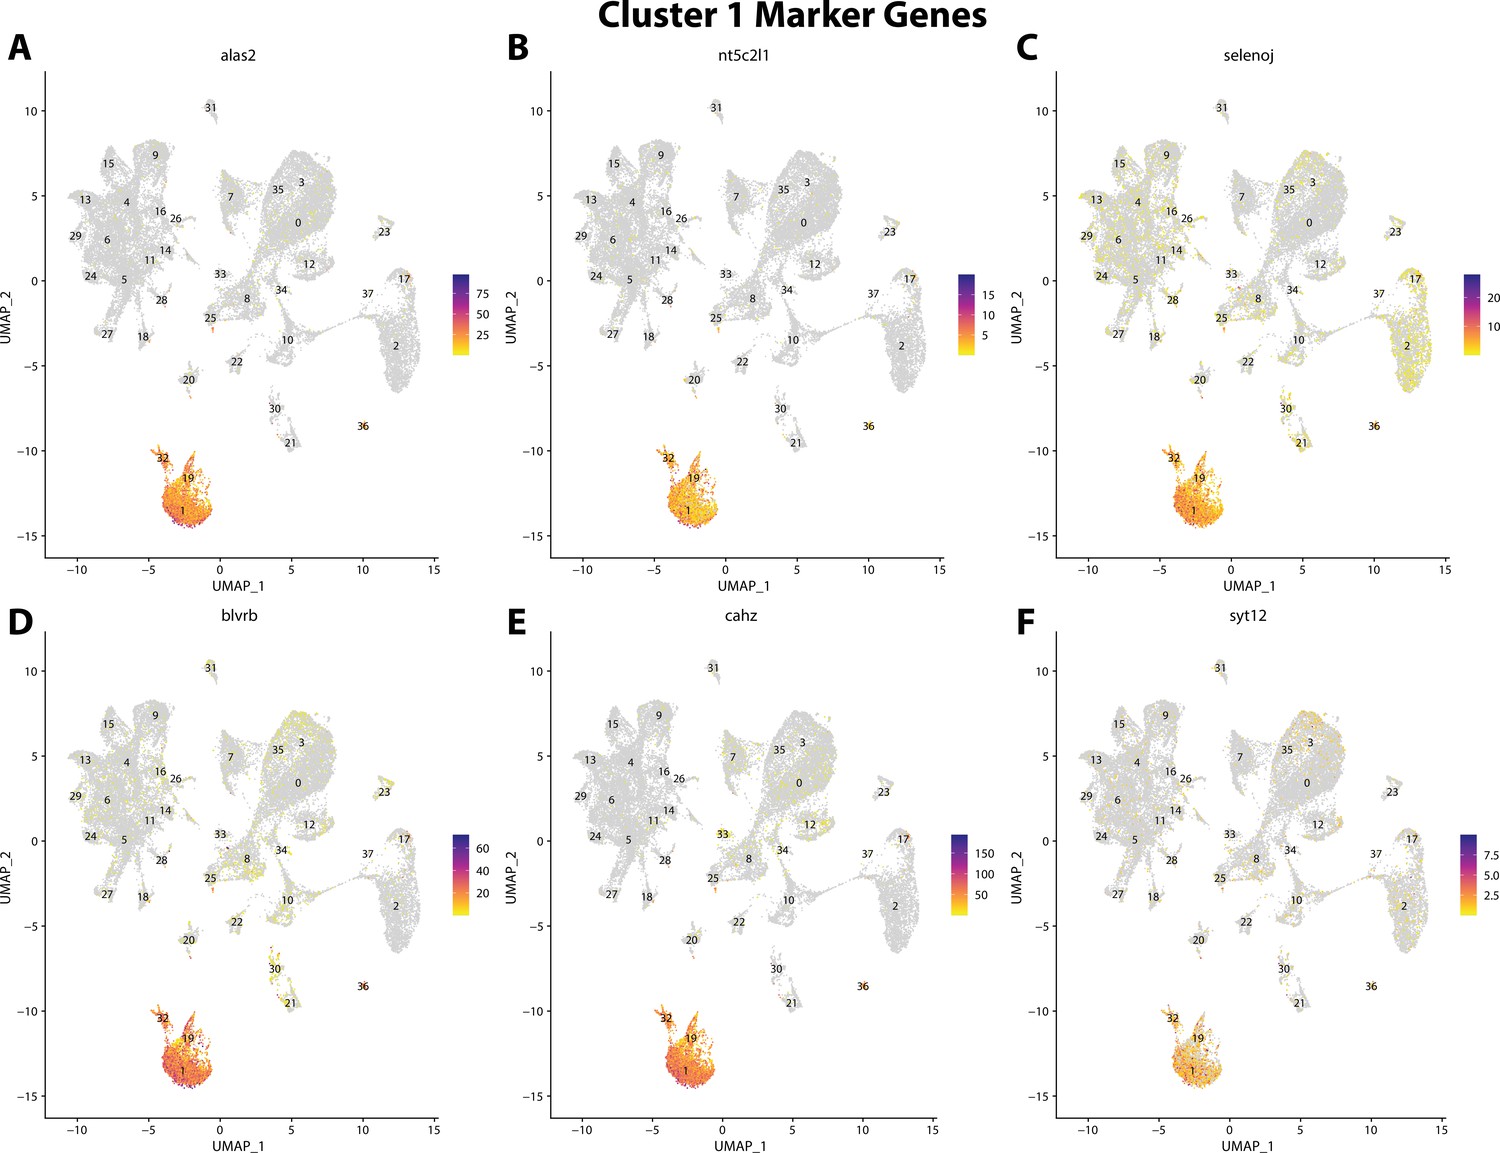
Gulf pipefish cluster 1 markers.
Feature plots of top markers for cluster 1 identified from the marker gene lists.
Figure 2—figure supplement 24
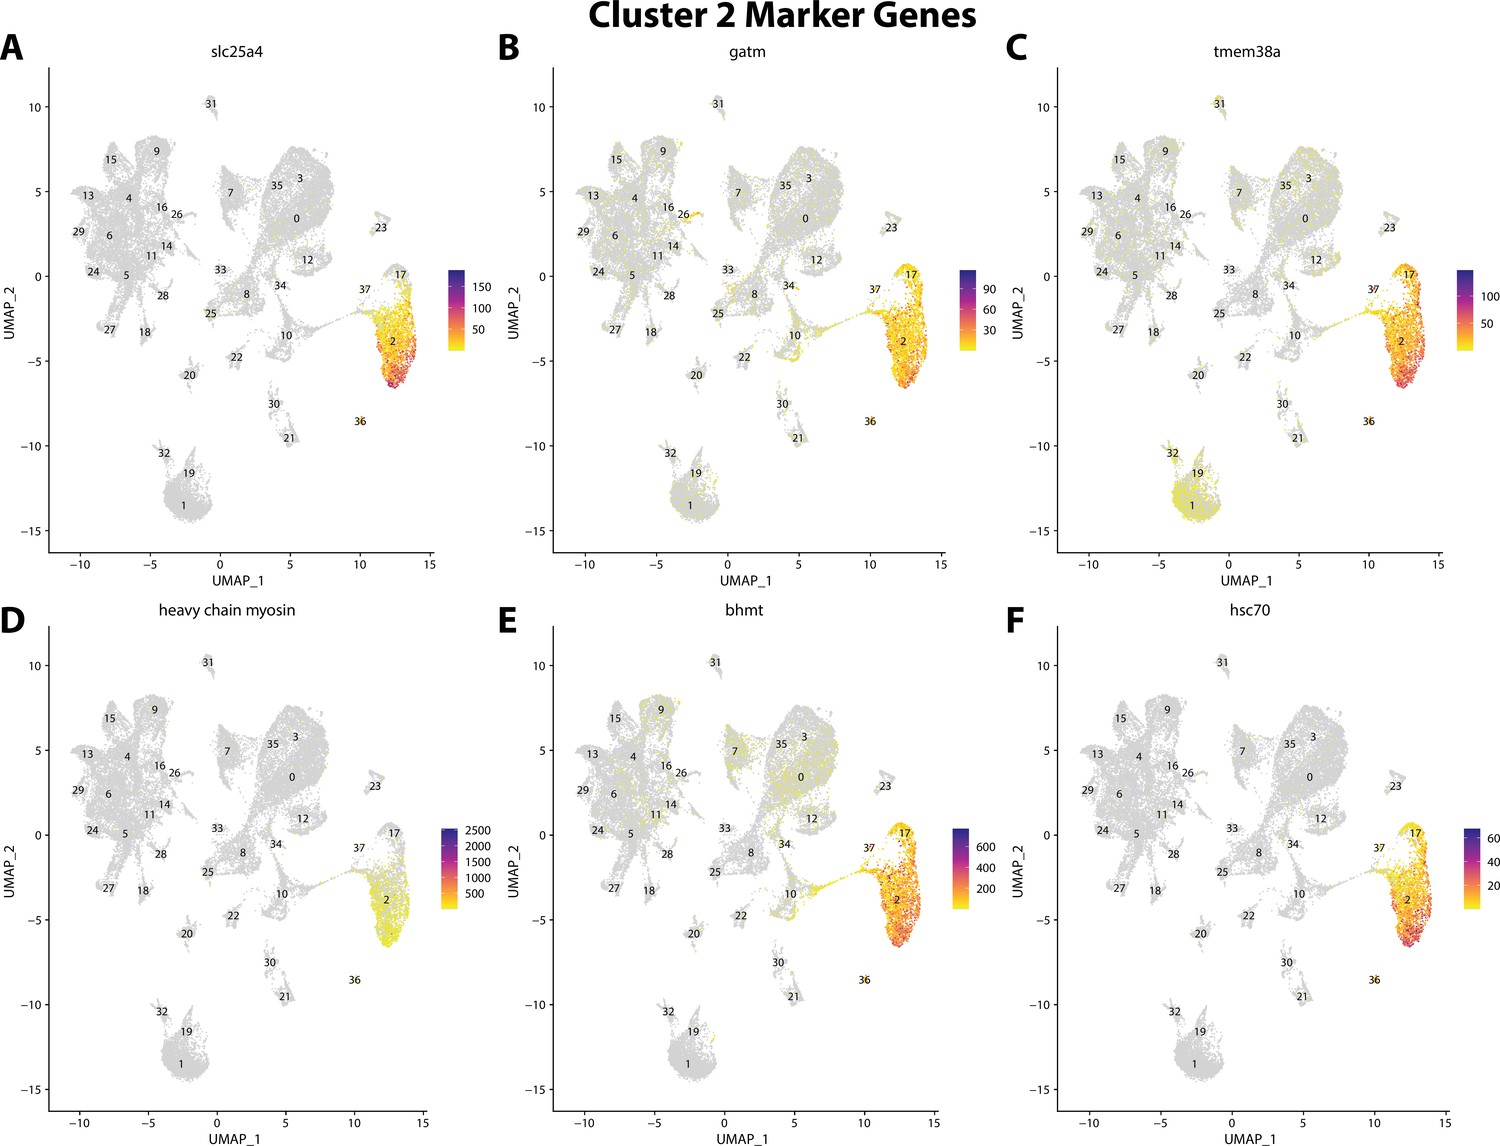
Gulf pipefish cluster 2 markers.
Feature plots of top markers for cluster 2 identified from the marker gene lists.
Figure 2—figure supplement 25
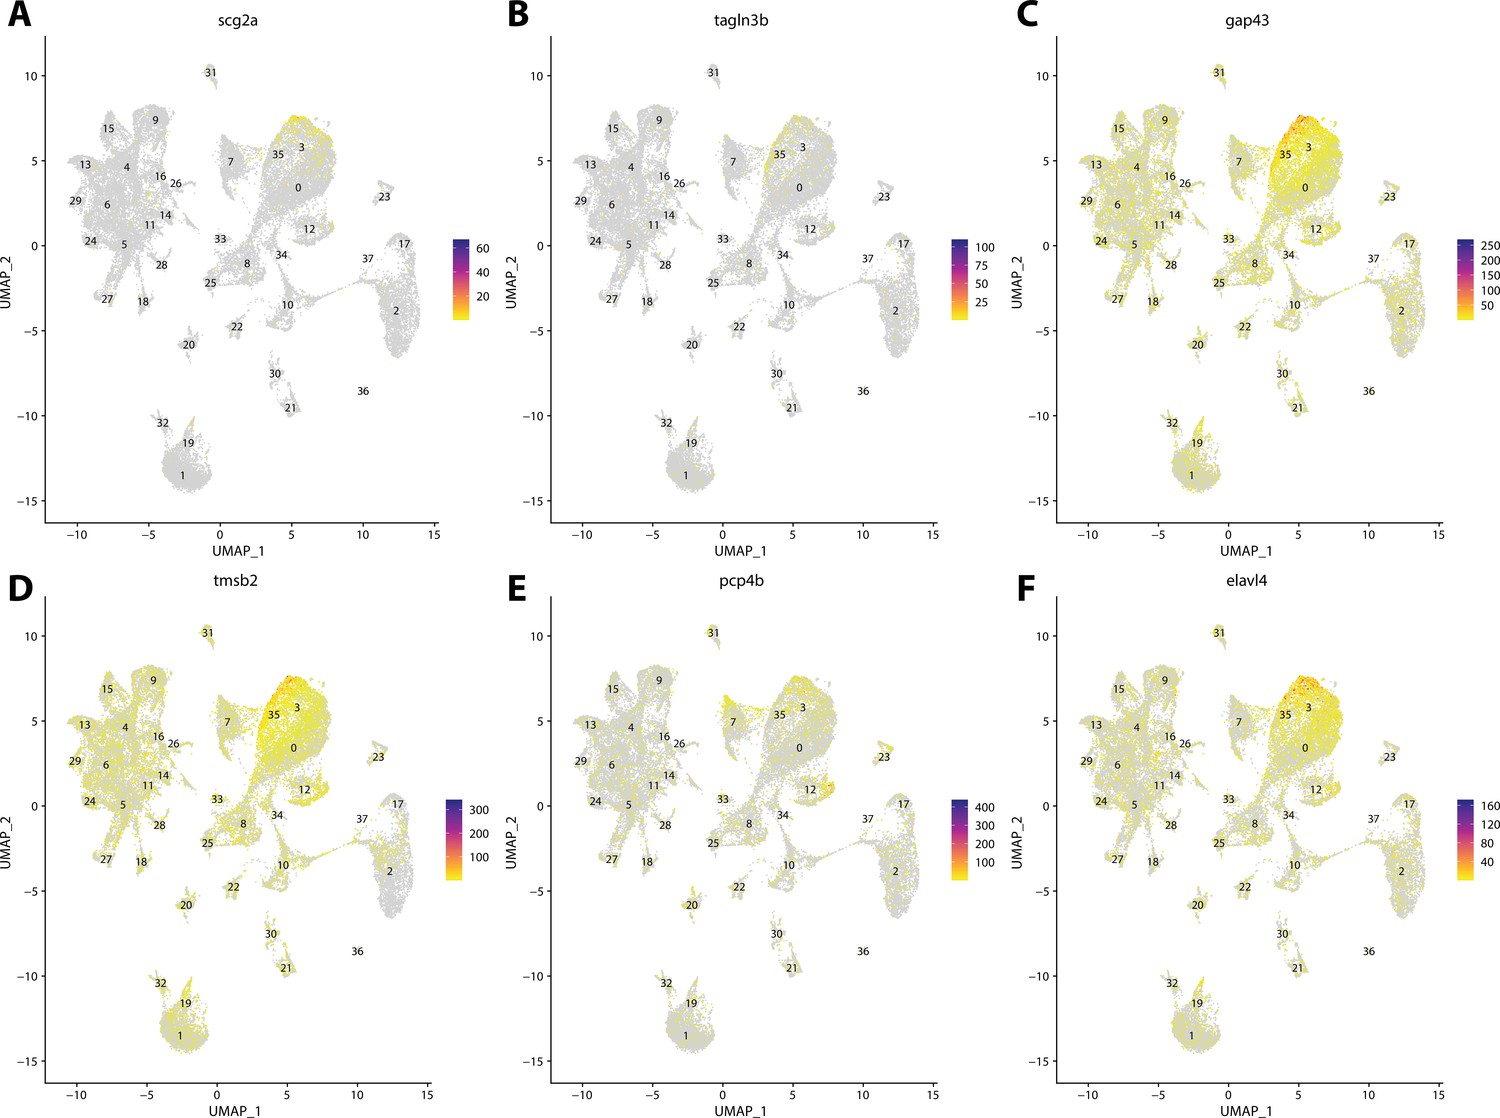
Gulf pipefish cluster 3 markers.
Feature plots of top markers for cluster 3 identified from the marker gene lists.
Figure 2—figure supplement 26
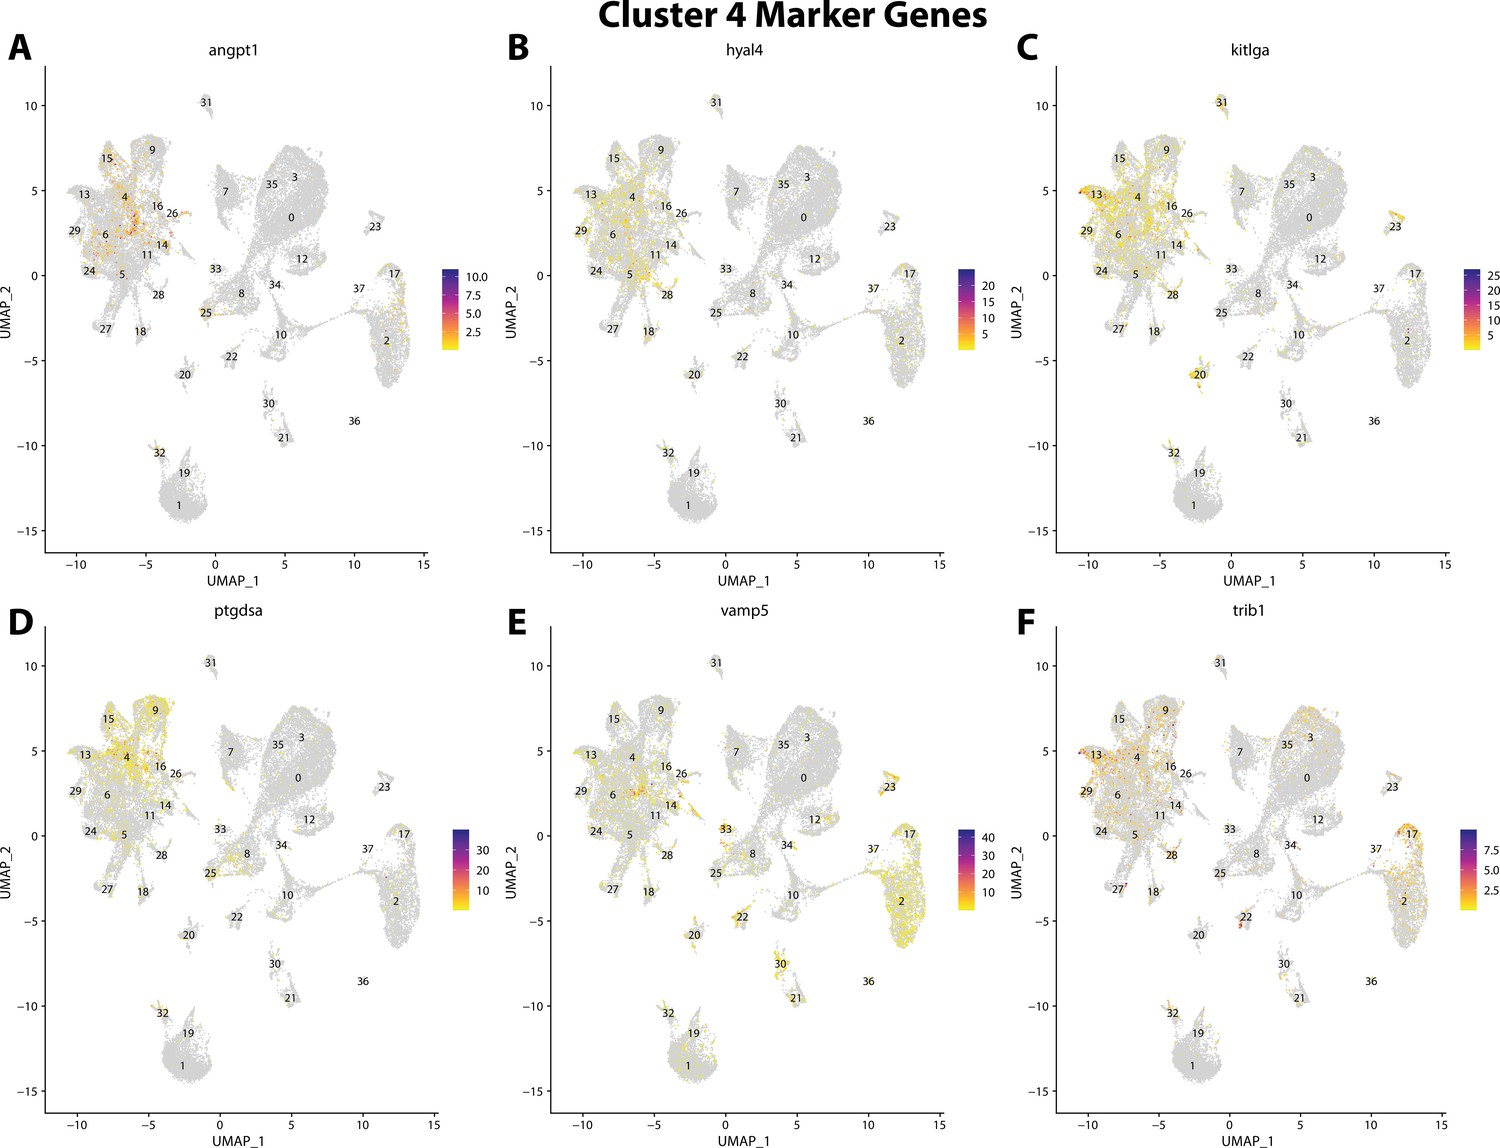
Gulf pipefish cluster 4 markers.
Feature plots of top markers for cluster 4 identified from the marker gene lists.
Figure 2—figure supplement 27
Gulf pipefish cluster 5 markers.
Feature plots of top markers for cluster 5 identified from the marker gene lists.
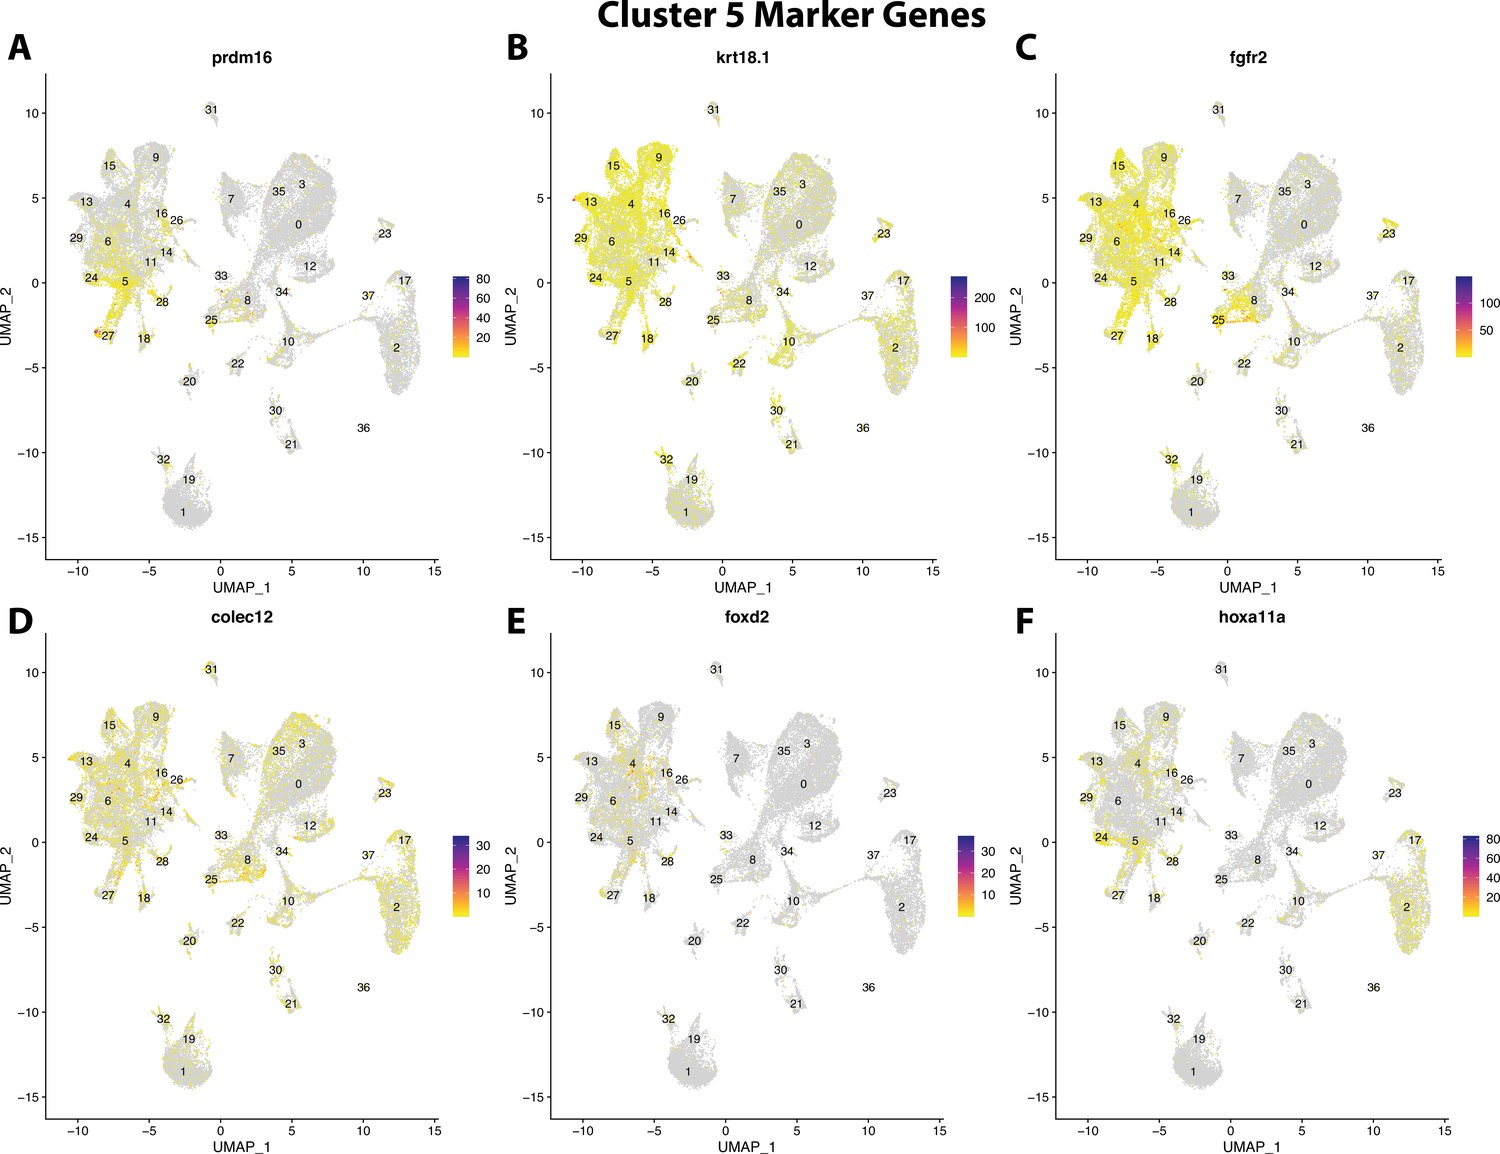
Figure 2—figure supplement 28
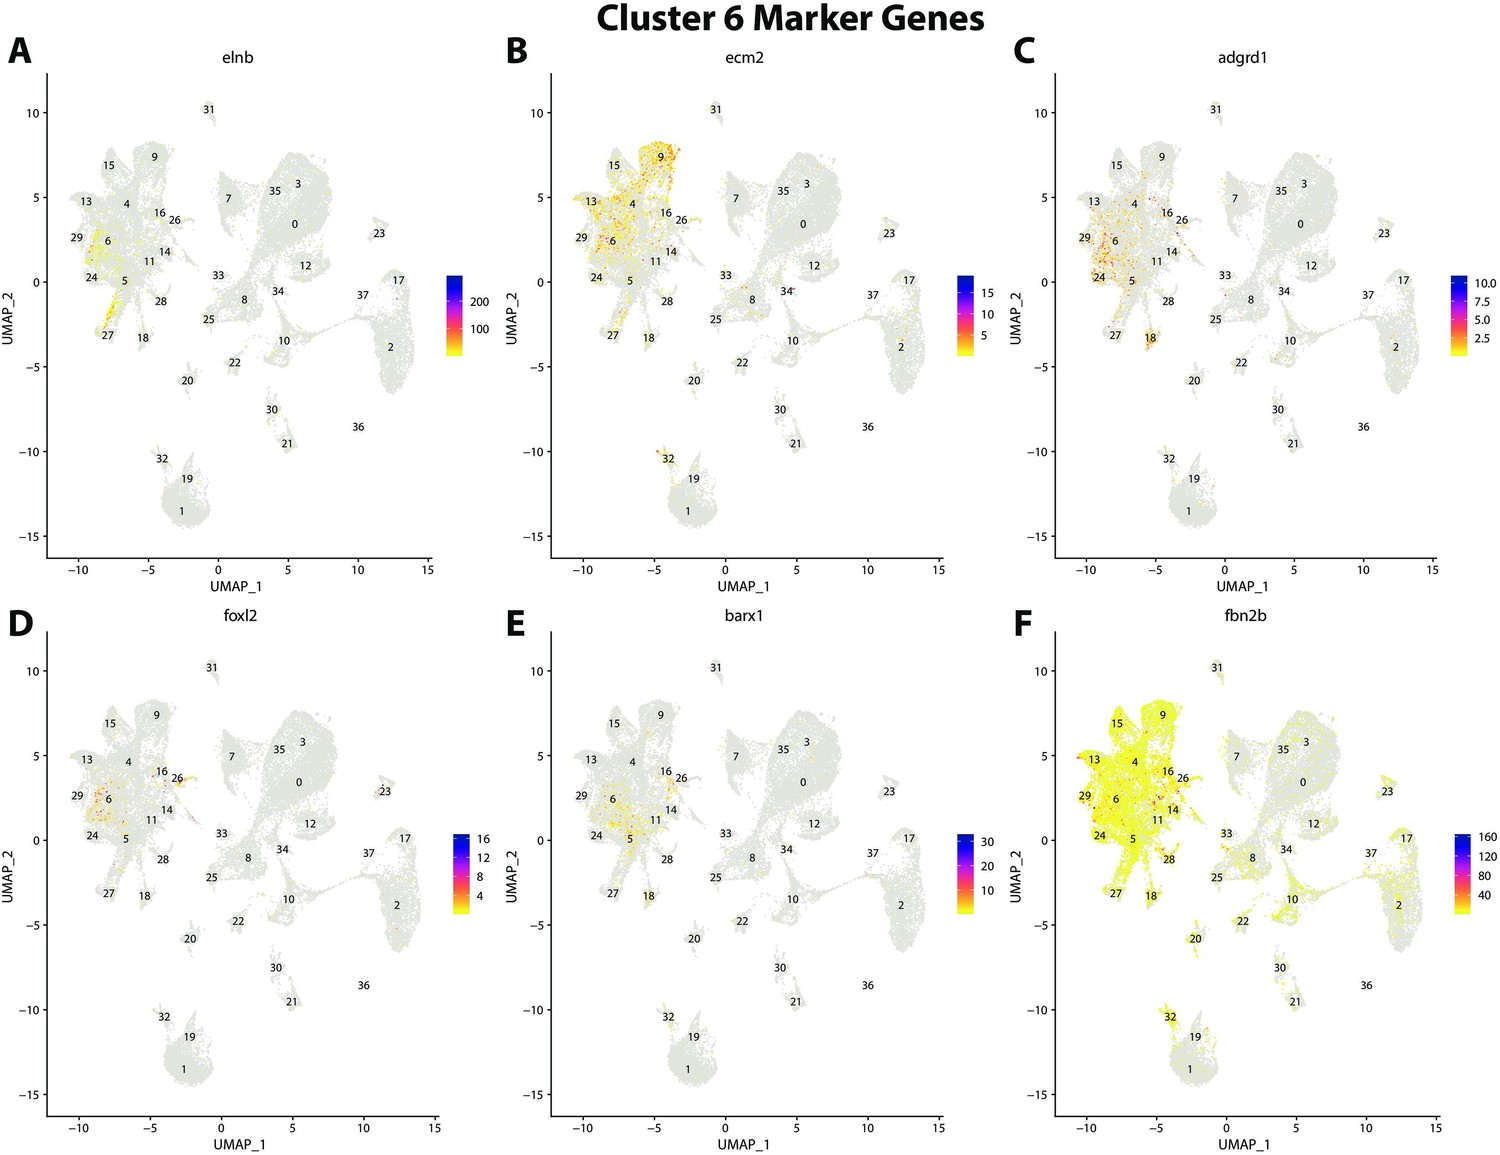
Gulf pipefish cluster 6 markers.
Feature plots of top markers for cluster 6 identified from the marker gene lists.
Figure 2—figure supplement 29
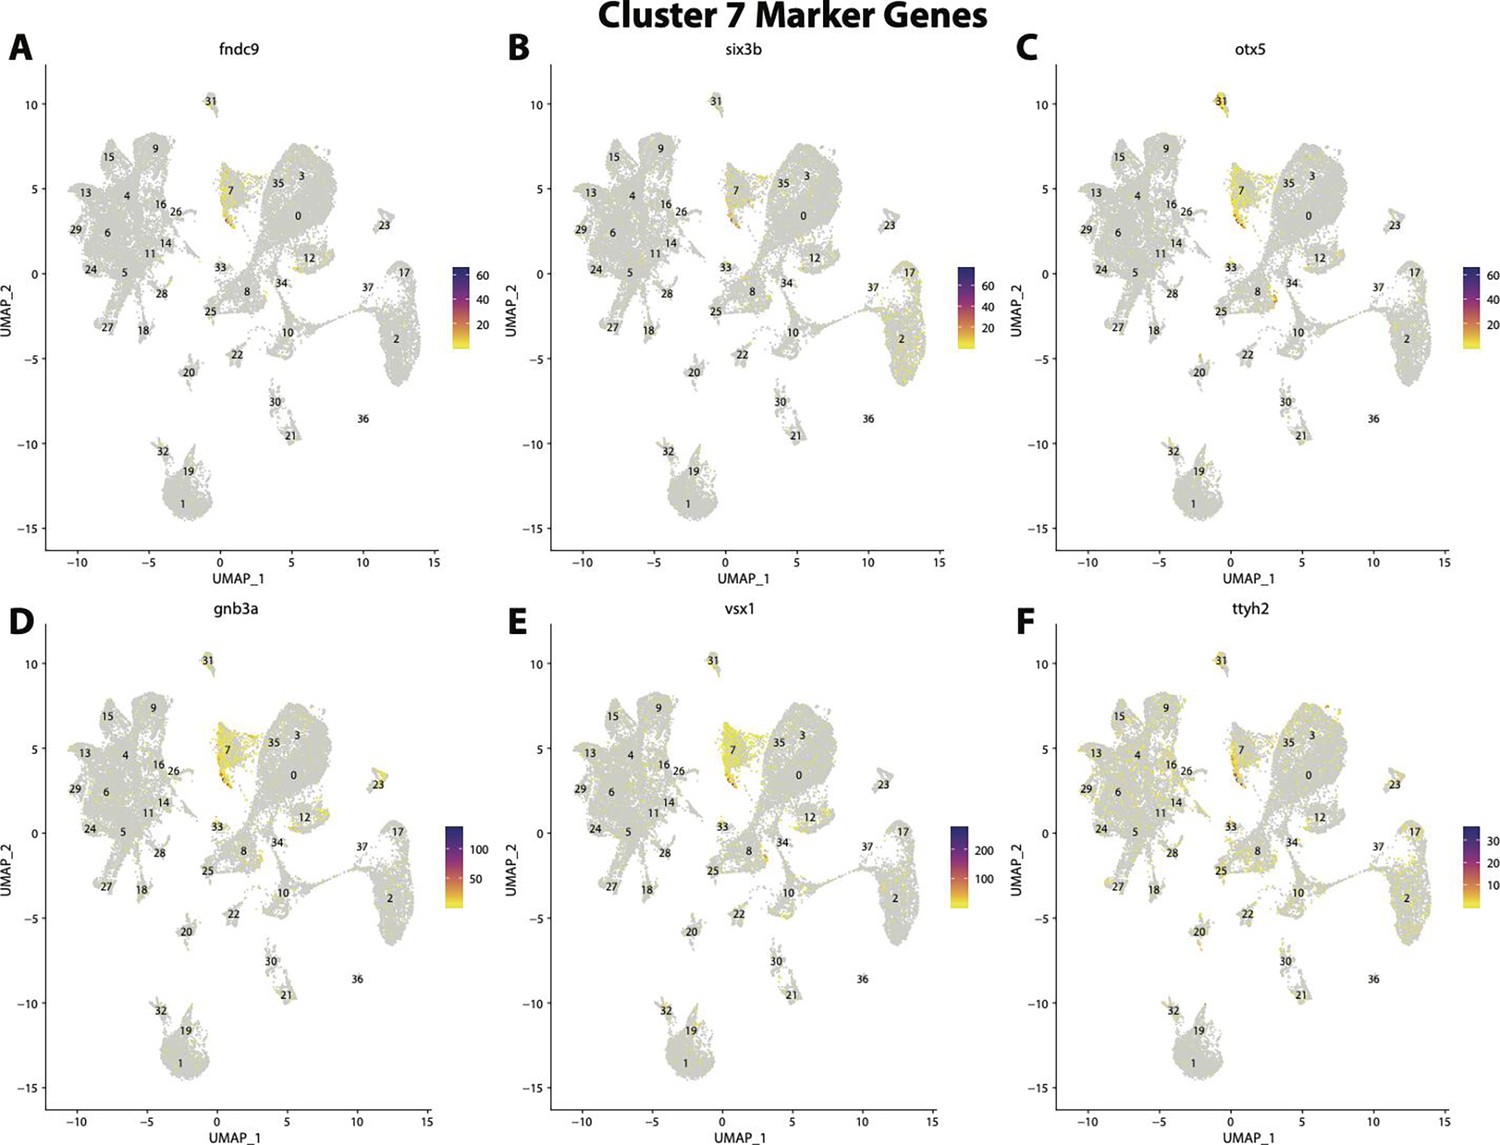
Gulf pipefish cluster 7 markers.
Feature plots of top markers for cluster 7 identified from the marker gene lists.
Figure 2—figure supplement 30
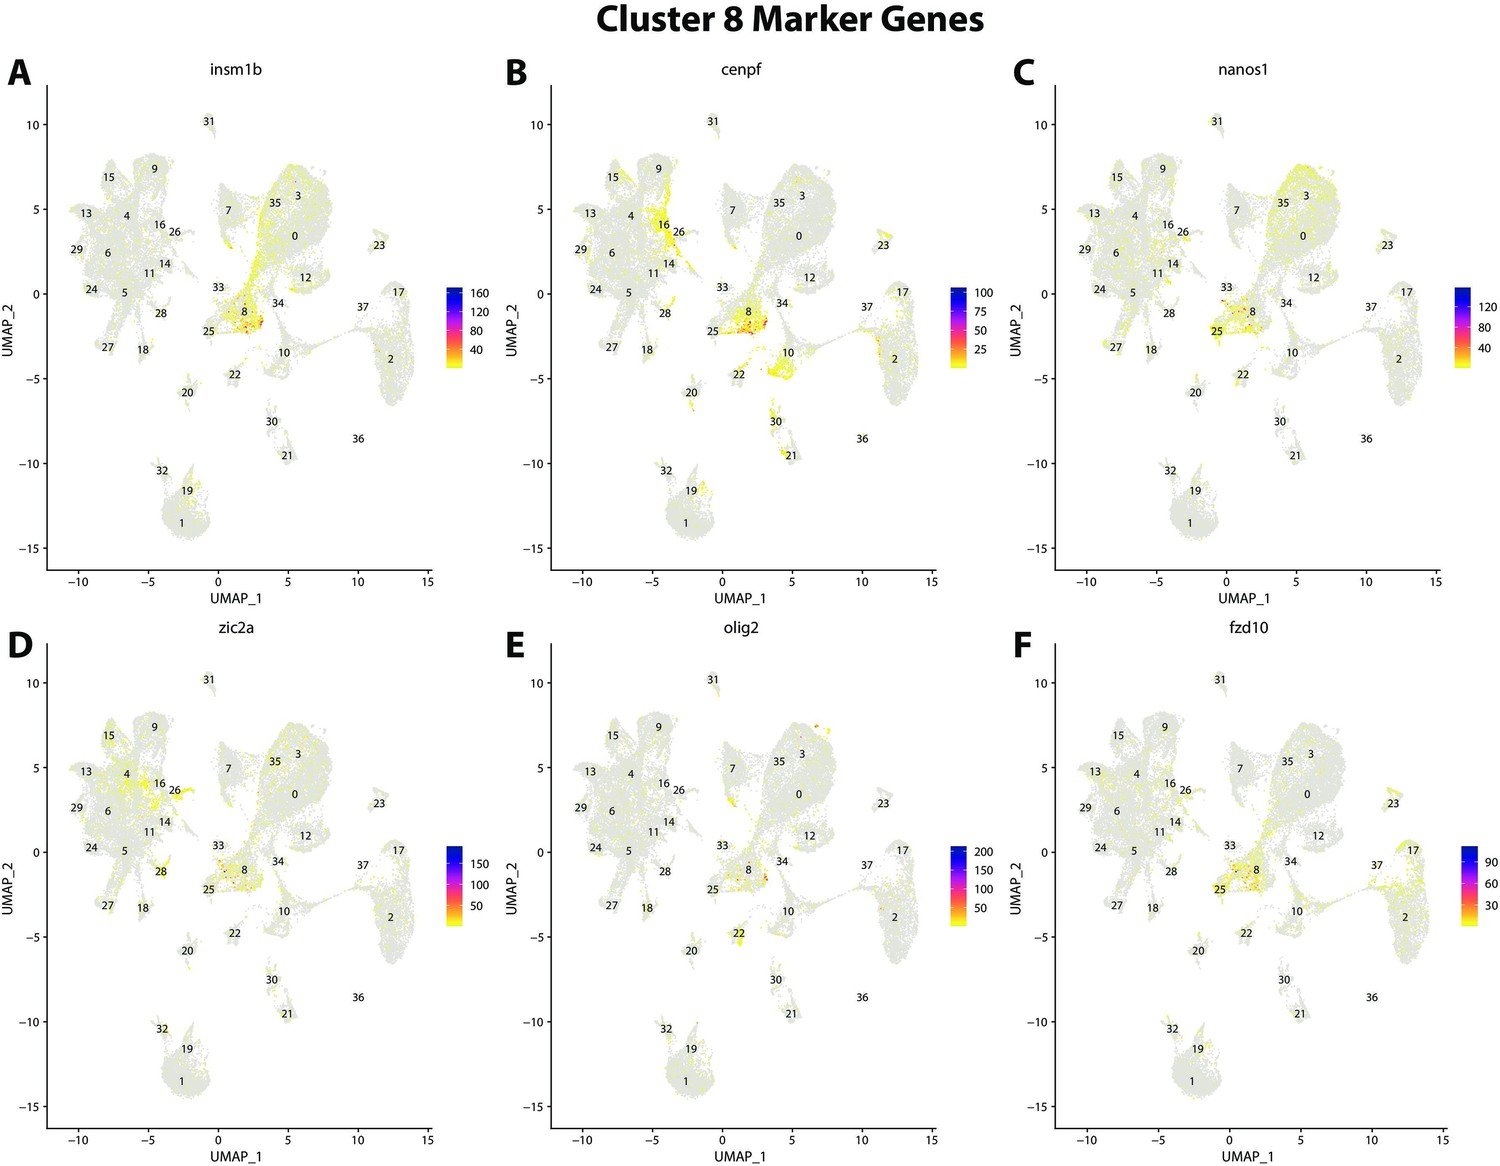
Gulf pipefish cluster 8 markers.
Feature plots of top markers for cluster 8 identified from the marker gene lists.
Figure 2—figure supplement 31
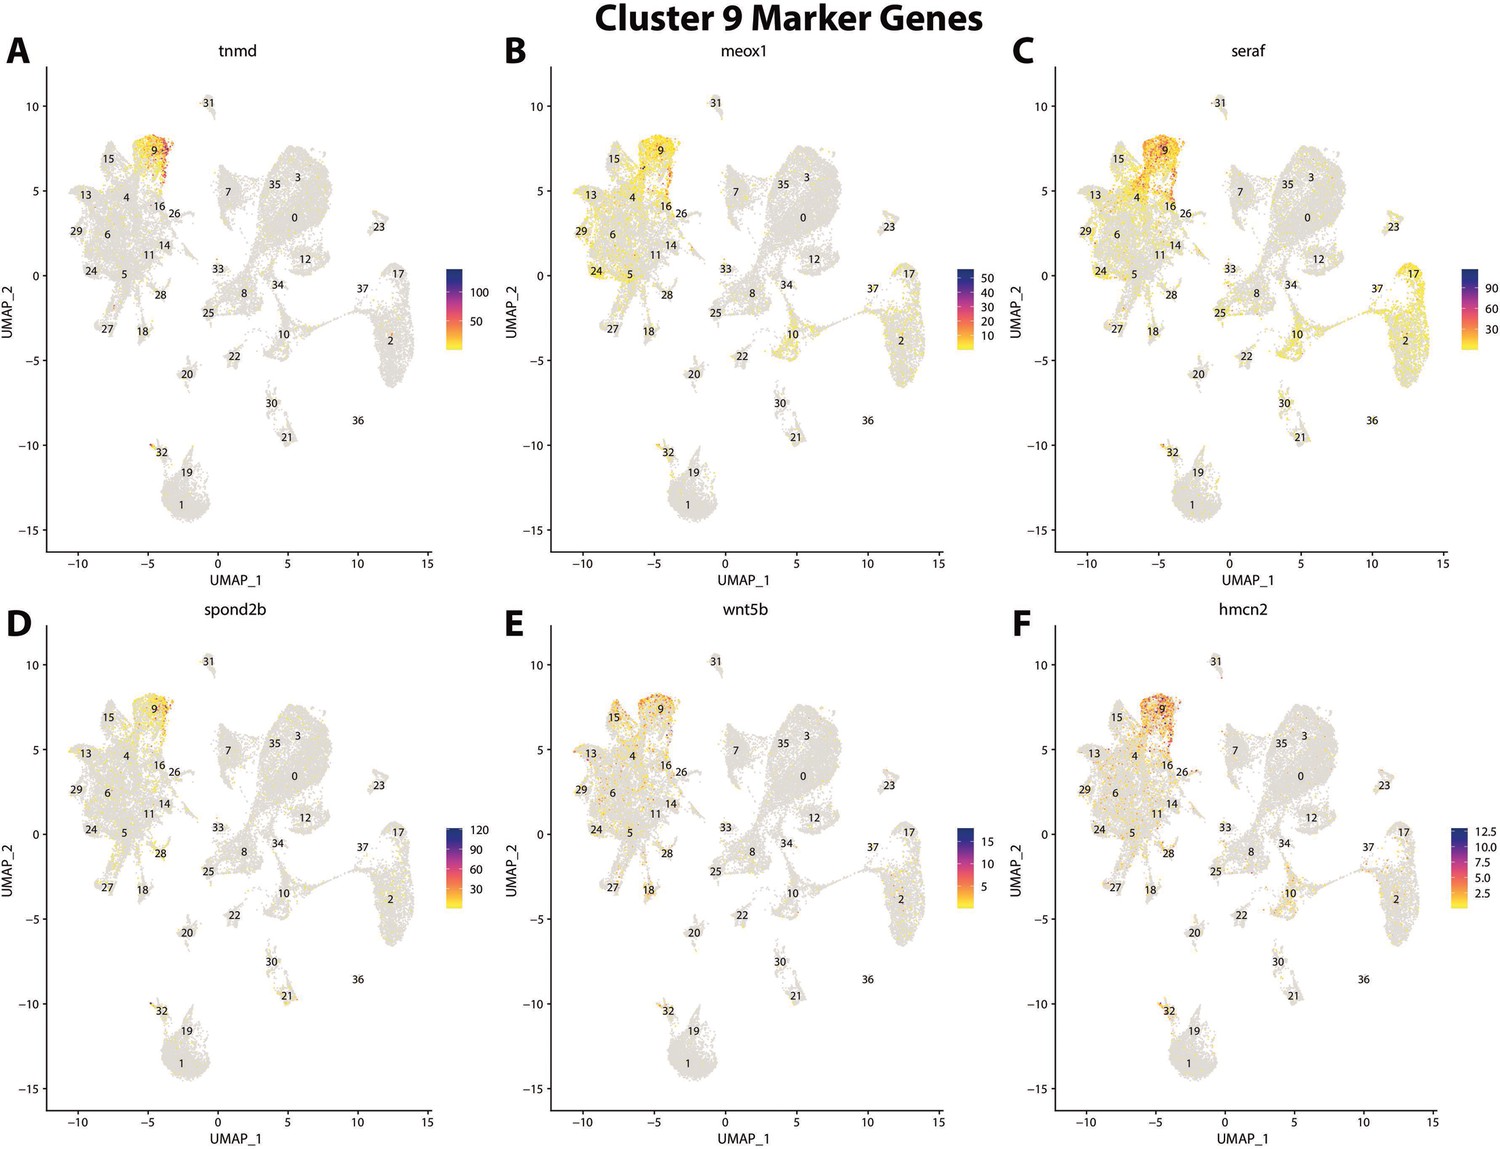
Gulf pipefish cluster 9 markers.
Feature plots of top markers for cluster 9 identified from the marker gene lists.
Figure 2—figure supplement 32

Gulf pipefish cluster 10 markers.
Feature plots of top markers for cluster 10 identified from the marker gene lists.
Figure 2—figure supplement 33

Gulf pipefish cluster 12 markers.
Feature plots of top markers for cluster 12 identified from the marker gene lists.
Figure 2—figure supplement 34
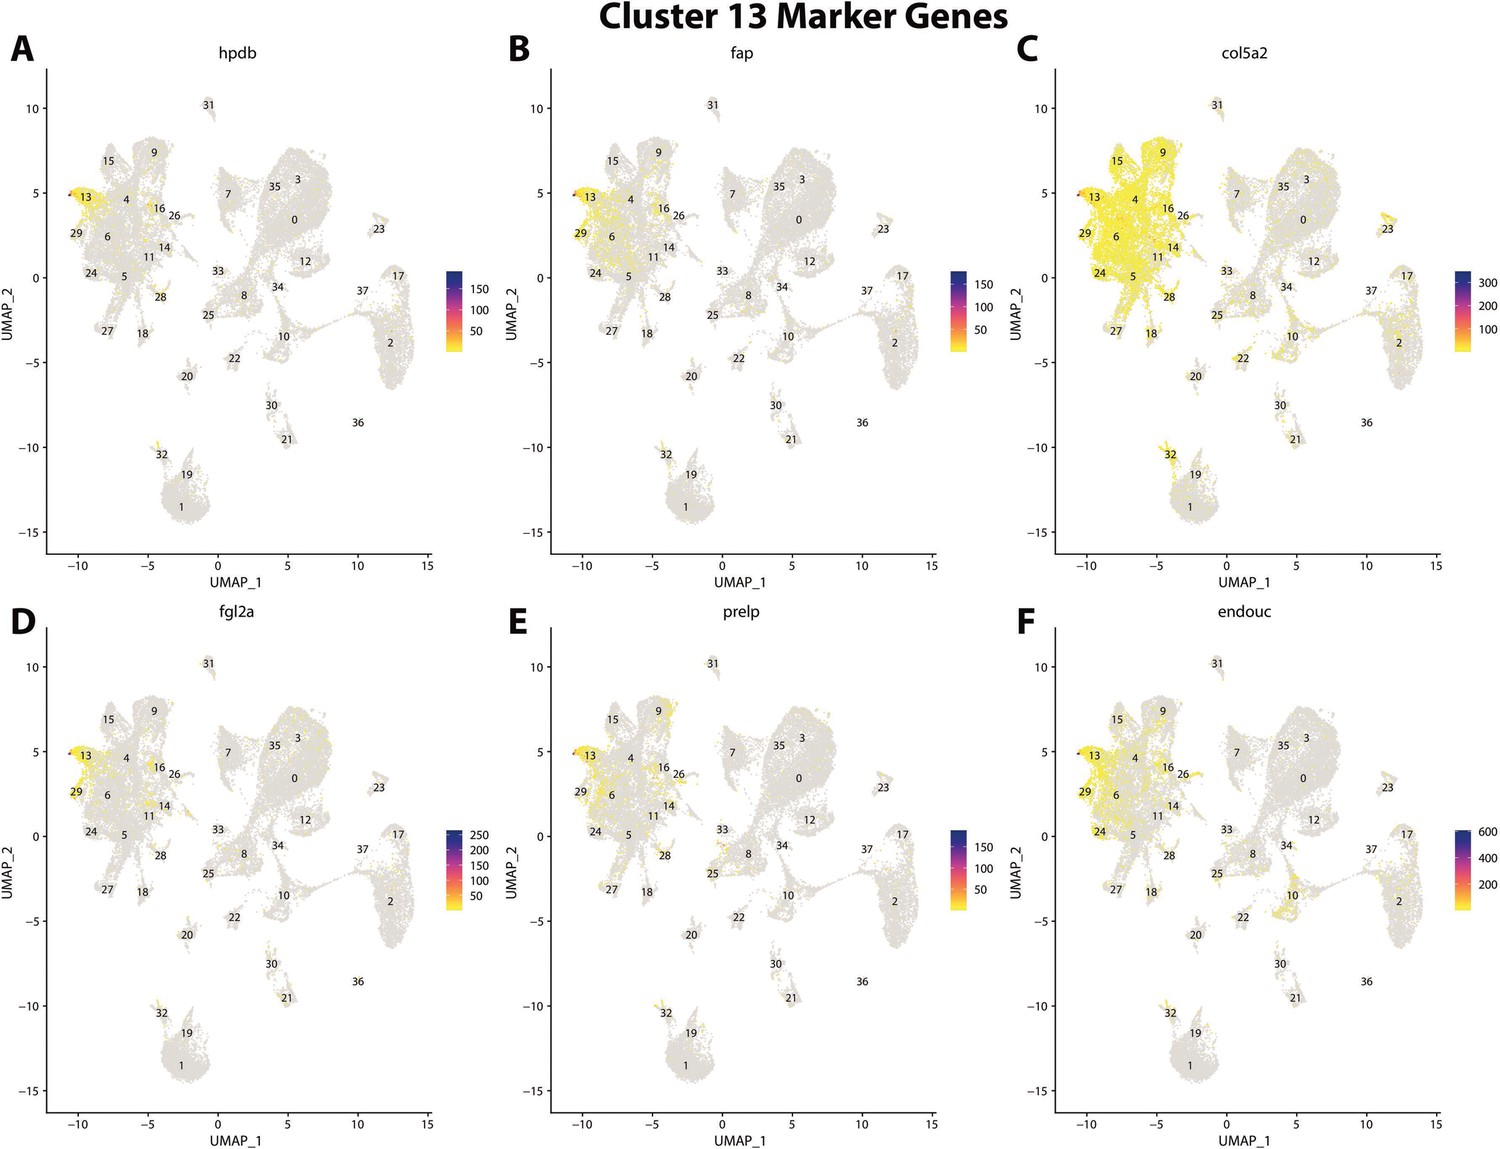
Gulf pipefish cluster 13 markers.
Feature plots of top markers for cluster 13 identified from the marker gene lists.
Figure 2—figure supplement 35
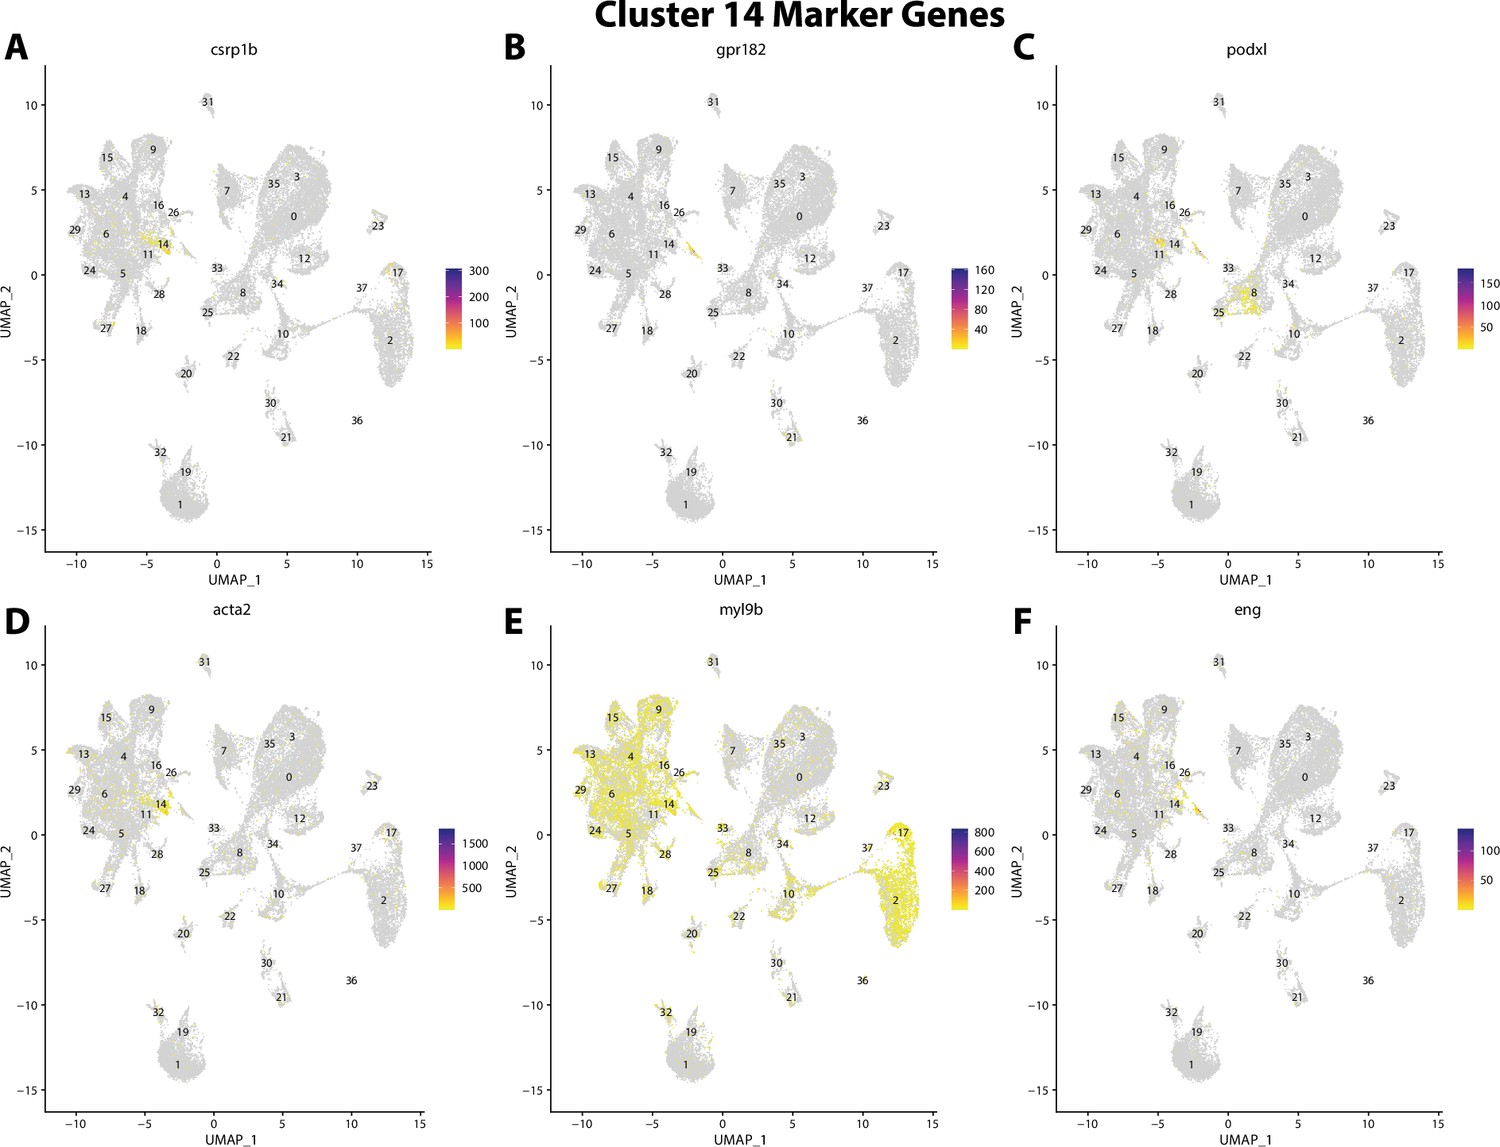
Gulf pipefish cluster 14 markers.
Feature plots of top markers for cluster 14 identified from the marker gene lists.
Figure 2—figure supplement 36
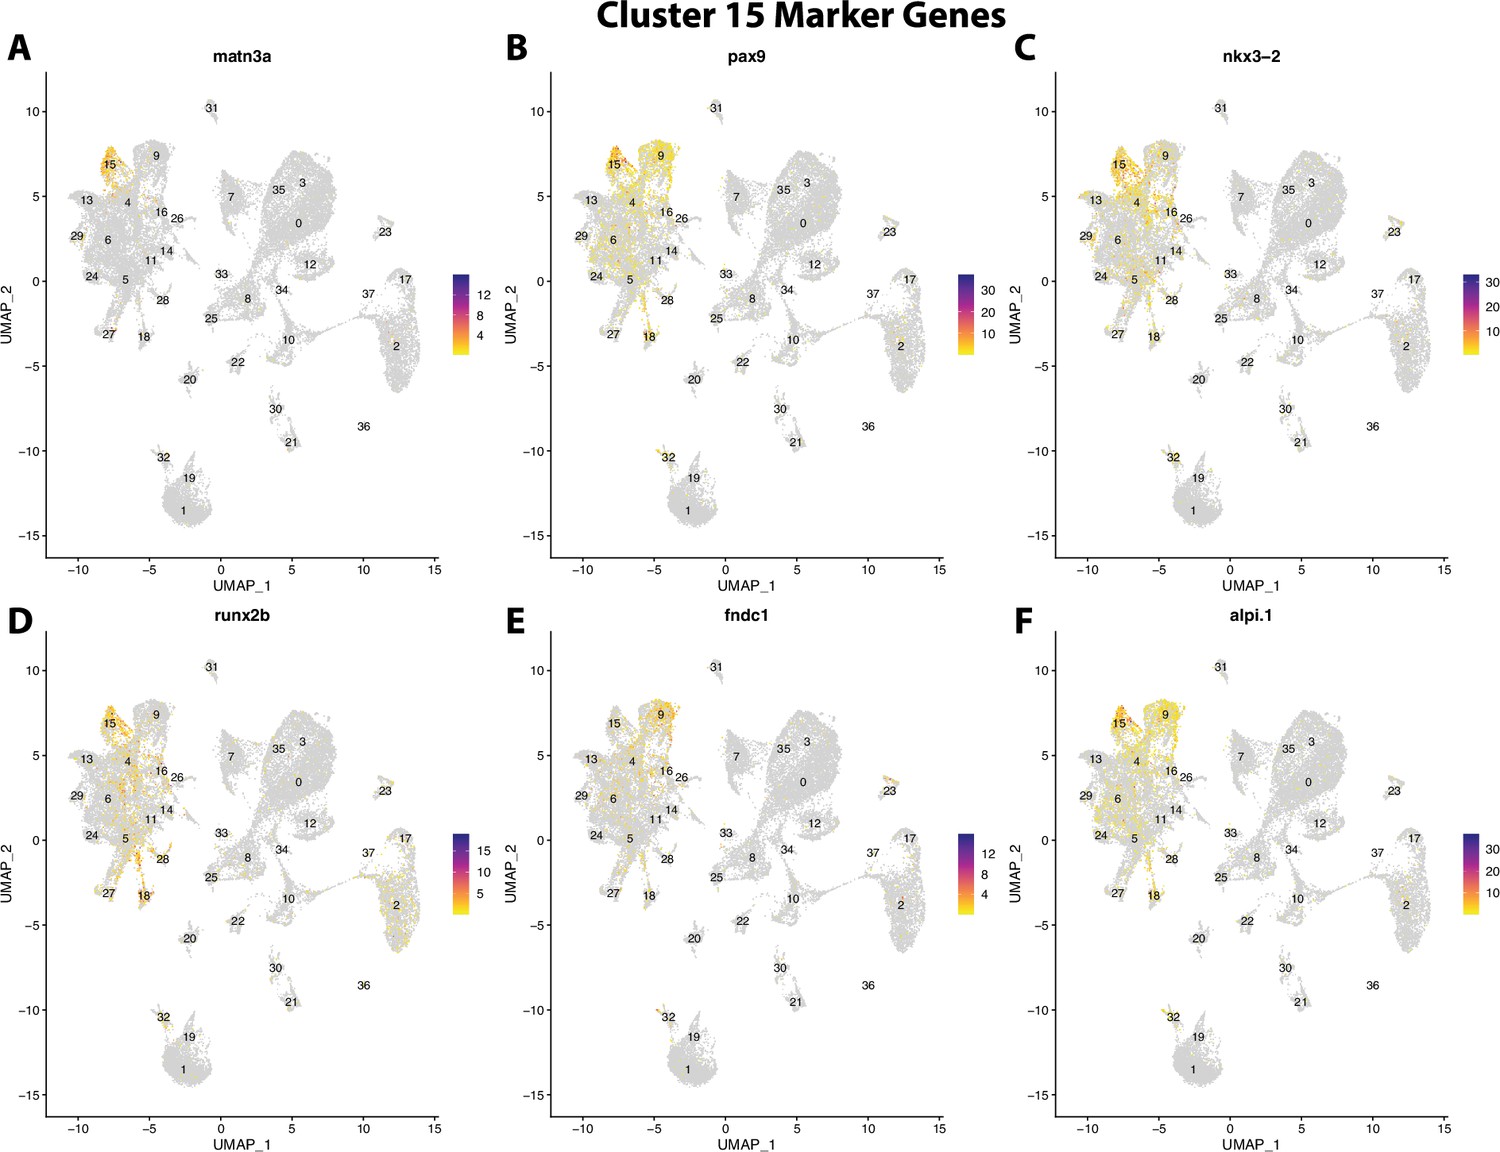
Gulf pipefish cluster 15 markers.
Feature plots of top markers for cluster 15 identified from the marker gene lists.
Figure 2—figure supplement 37
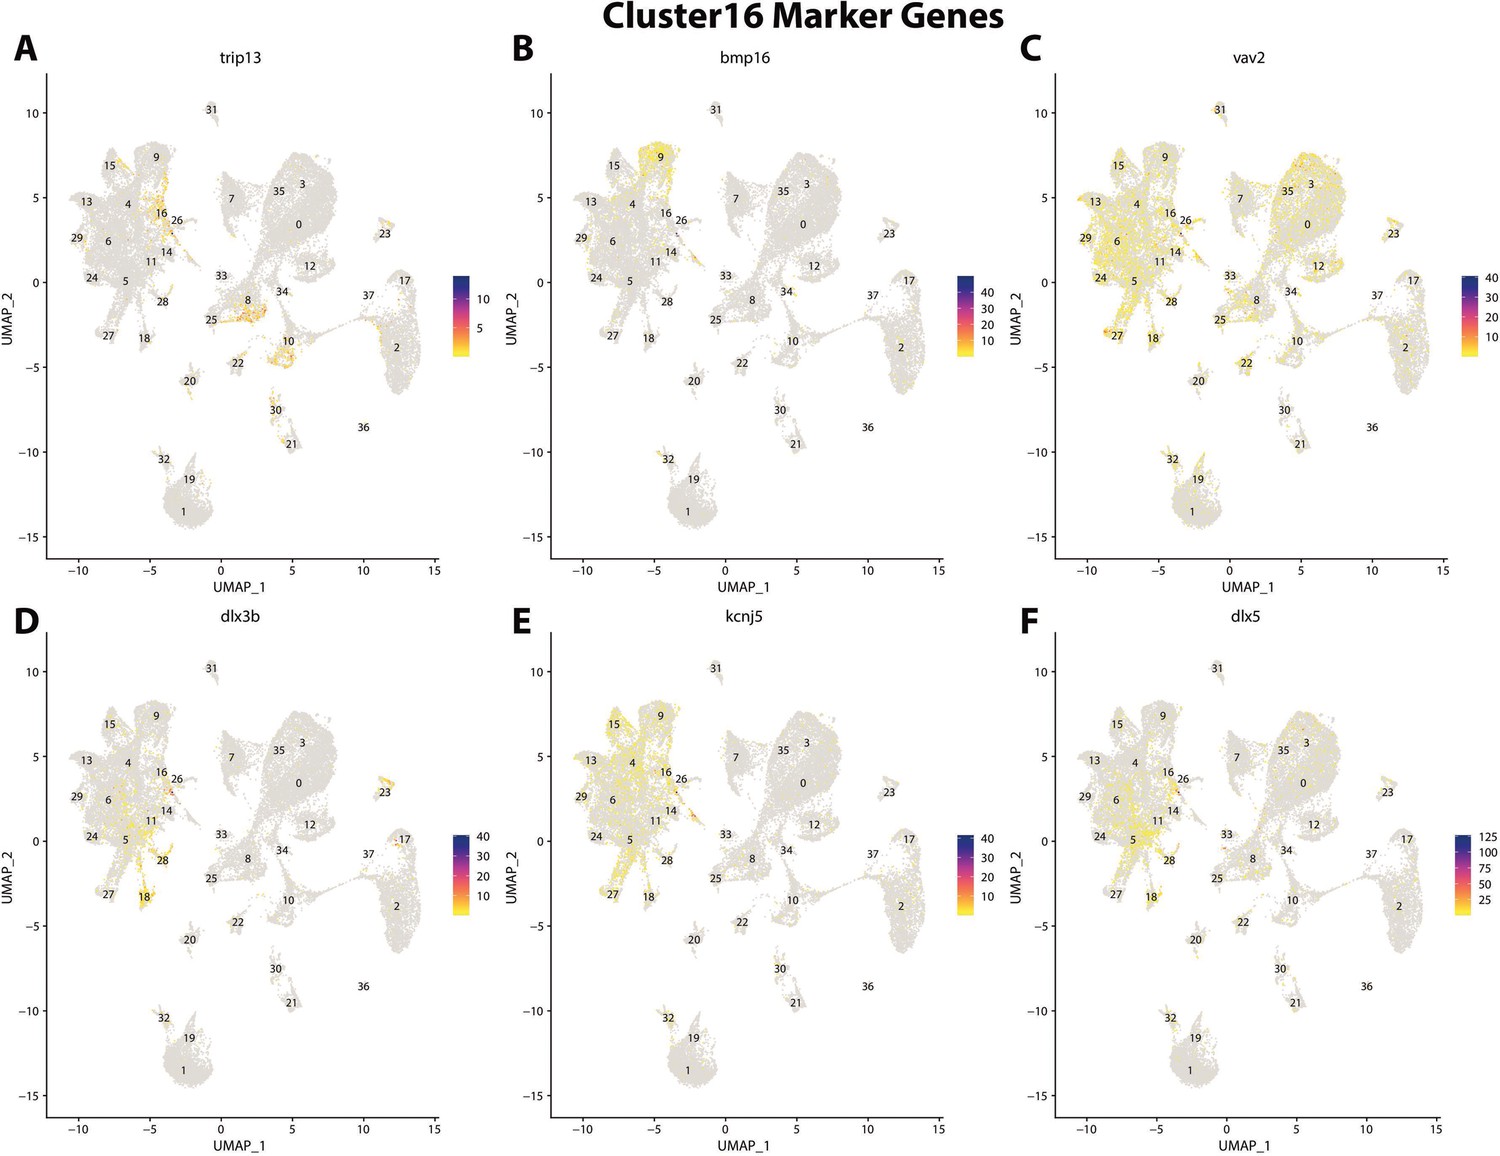
Gulf pipefish cluster 16 markers.
Feature plots of top markers for cluster 16 identified from the marker gene lists.
Figure 2—figure supplement 38
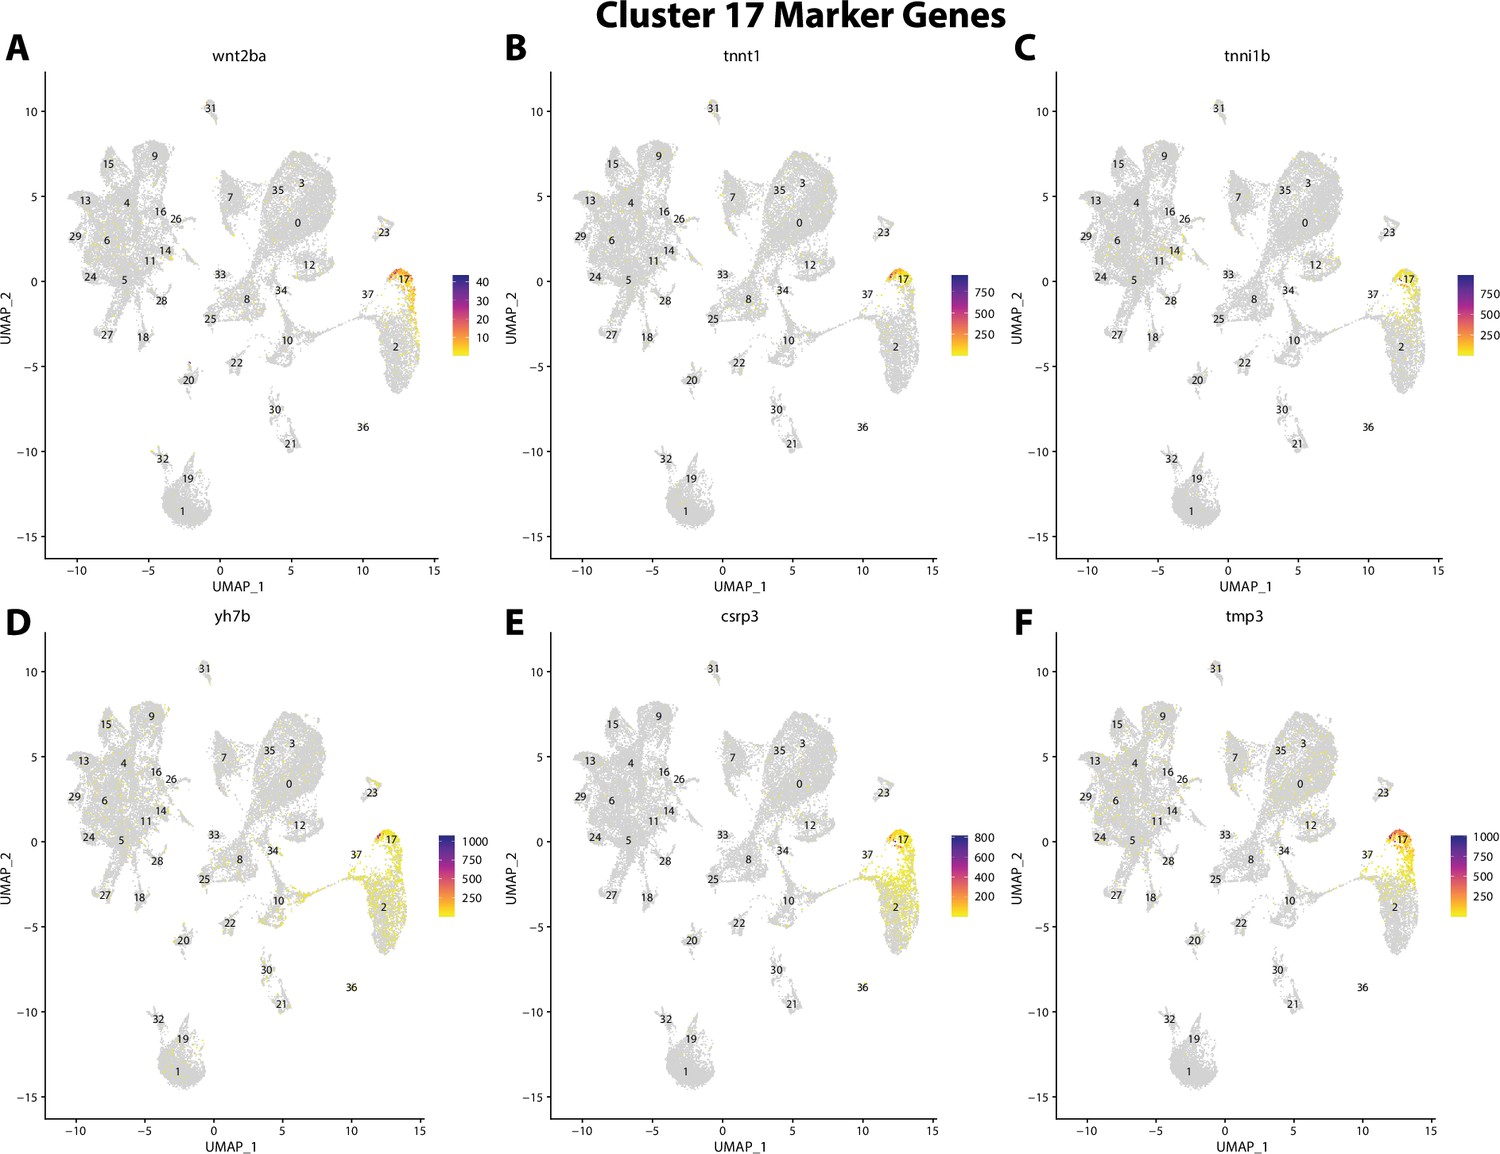
Gulf pipefish cluster 17 markers.
Feature plots of top markers for cluster 17 identified from the marker gene lists.
Figure 2—figure supplement 39
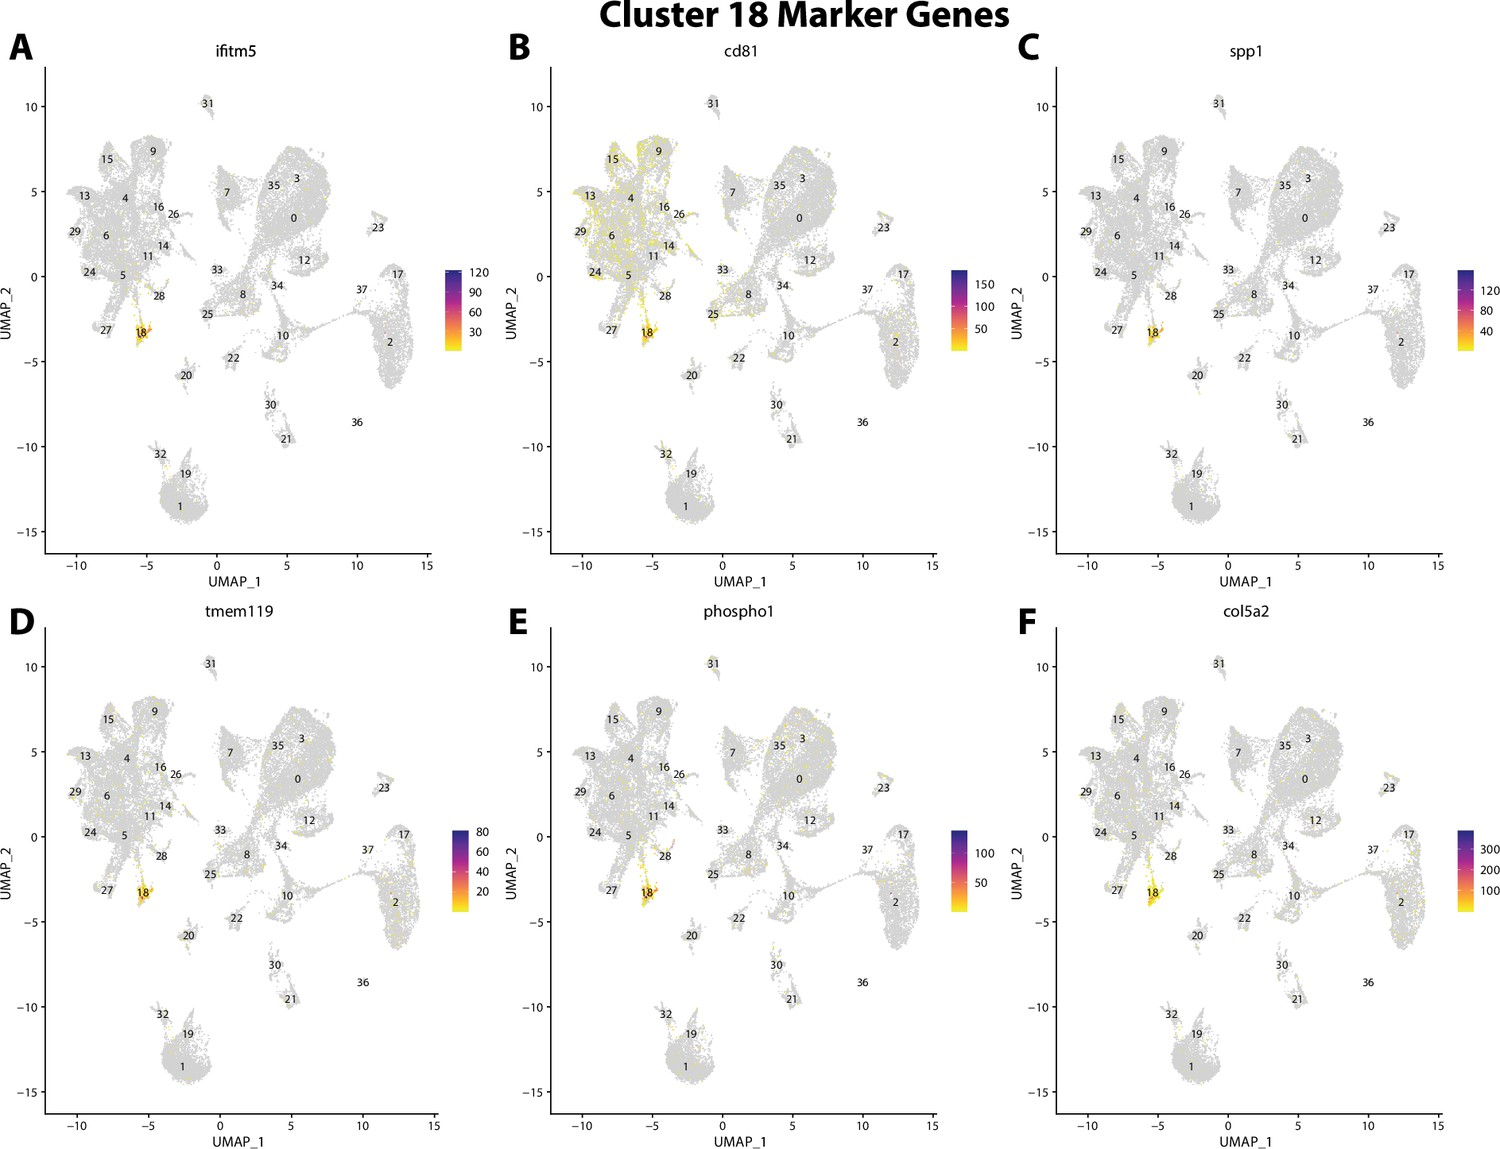
Gulf pipefish cluster 18 markers.
Feature plots of top markers for cluster 18 identified from the marker gene lists.
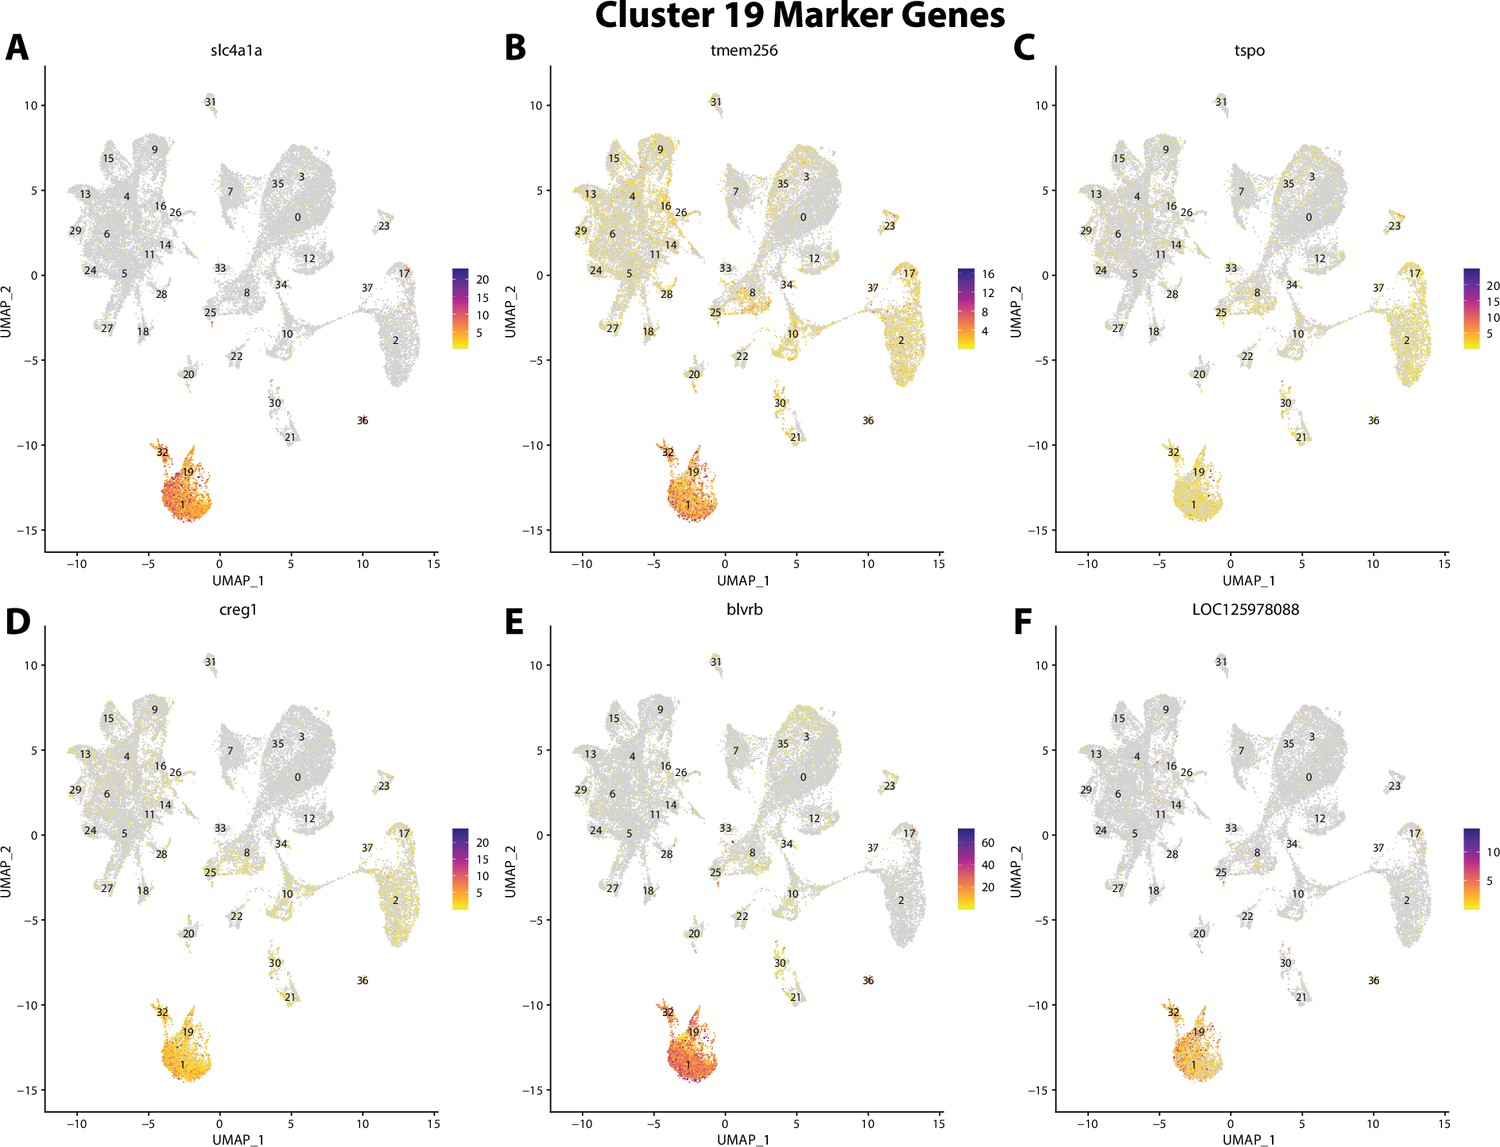
Figure 2—figure supplement 40
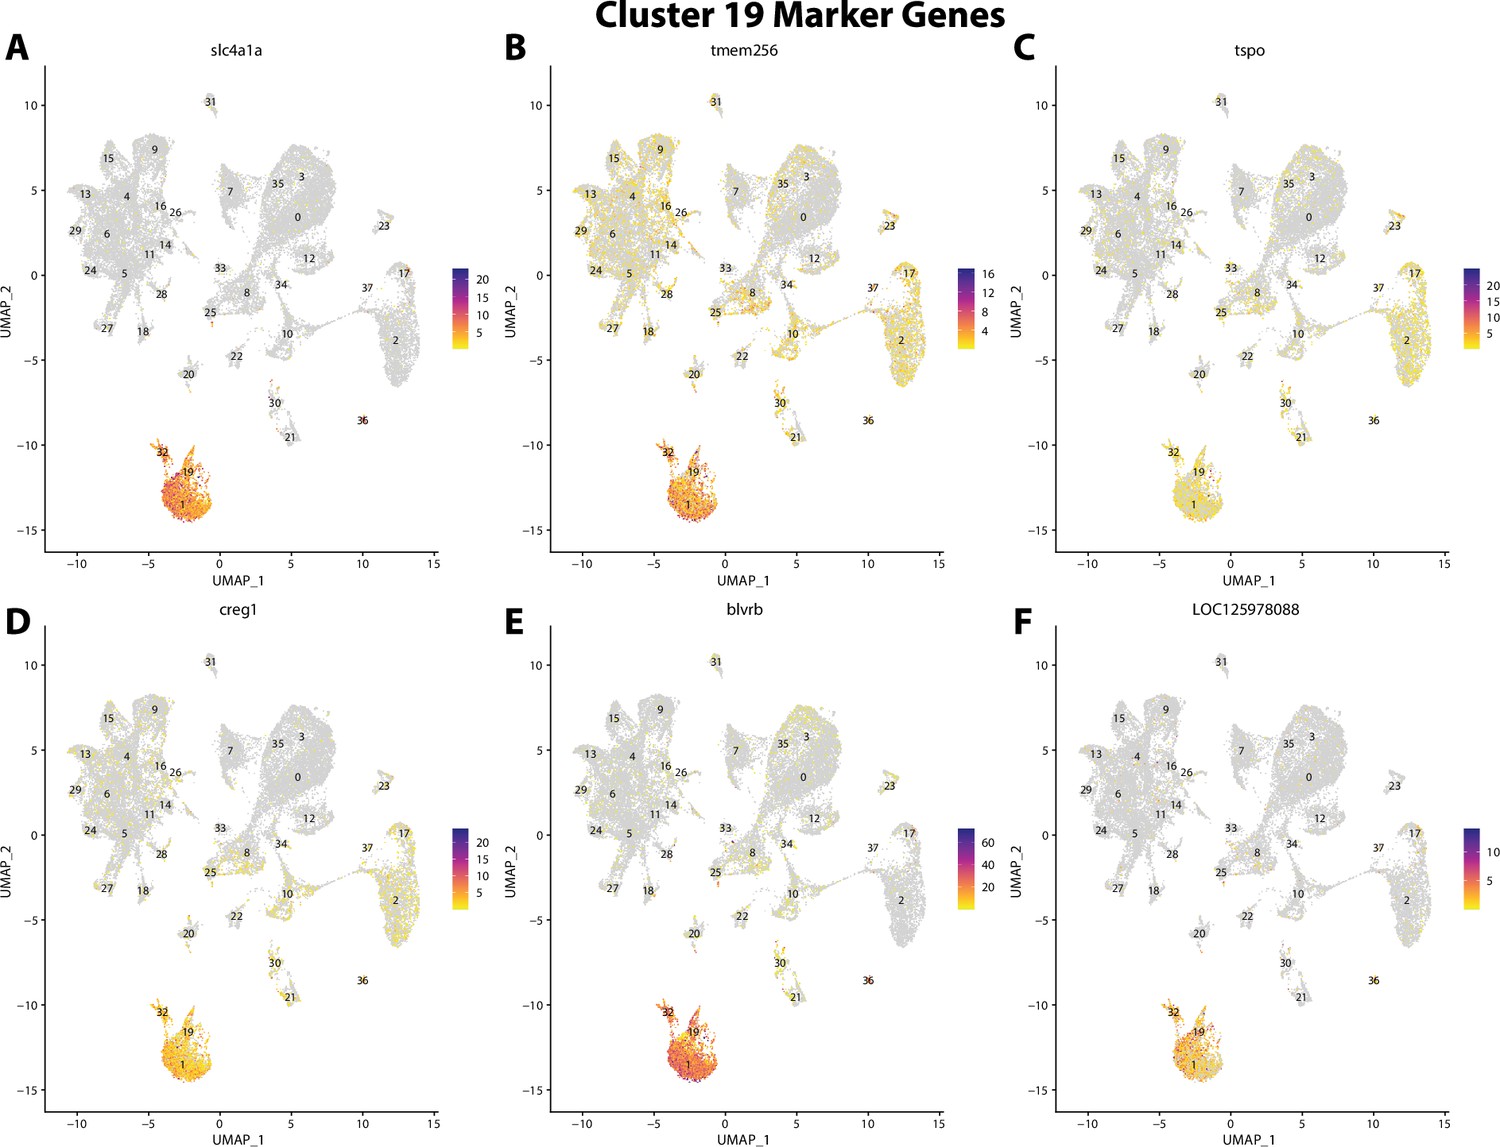
Gulf pipefish cluster 19 markers.
Feature plots of top markers for cluster 19 identified from the marker gene lists.
Figure 2—figure supplement 41
Gulf pipefish cluster 20 markers.
Feature plots of top markers for cluster 20 identified from the marker gene lists.
Figure 2—figure supplement 42

Gulf pipefish cluster 21 markers.
Feature plots of top markers for cluster 21 identified from the marker gene lists.
Figure 2—figure supplement 43
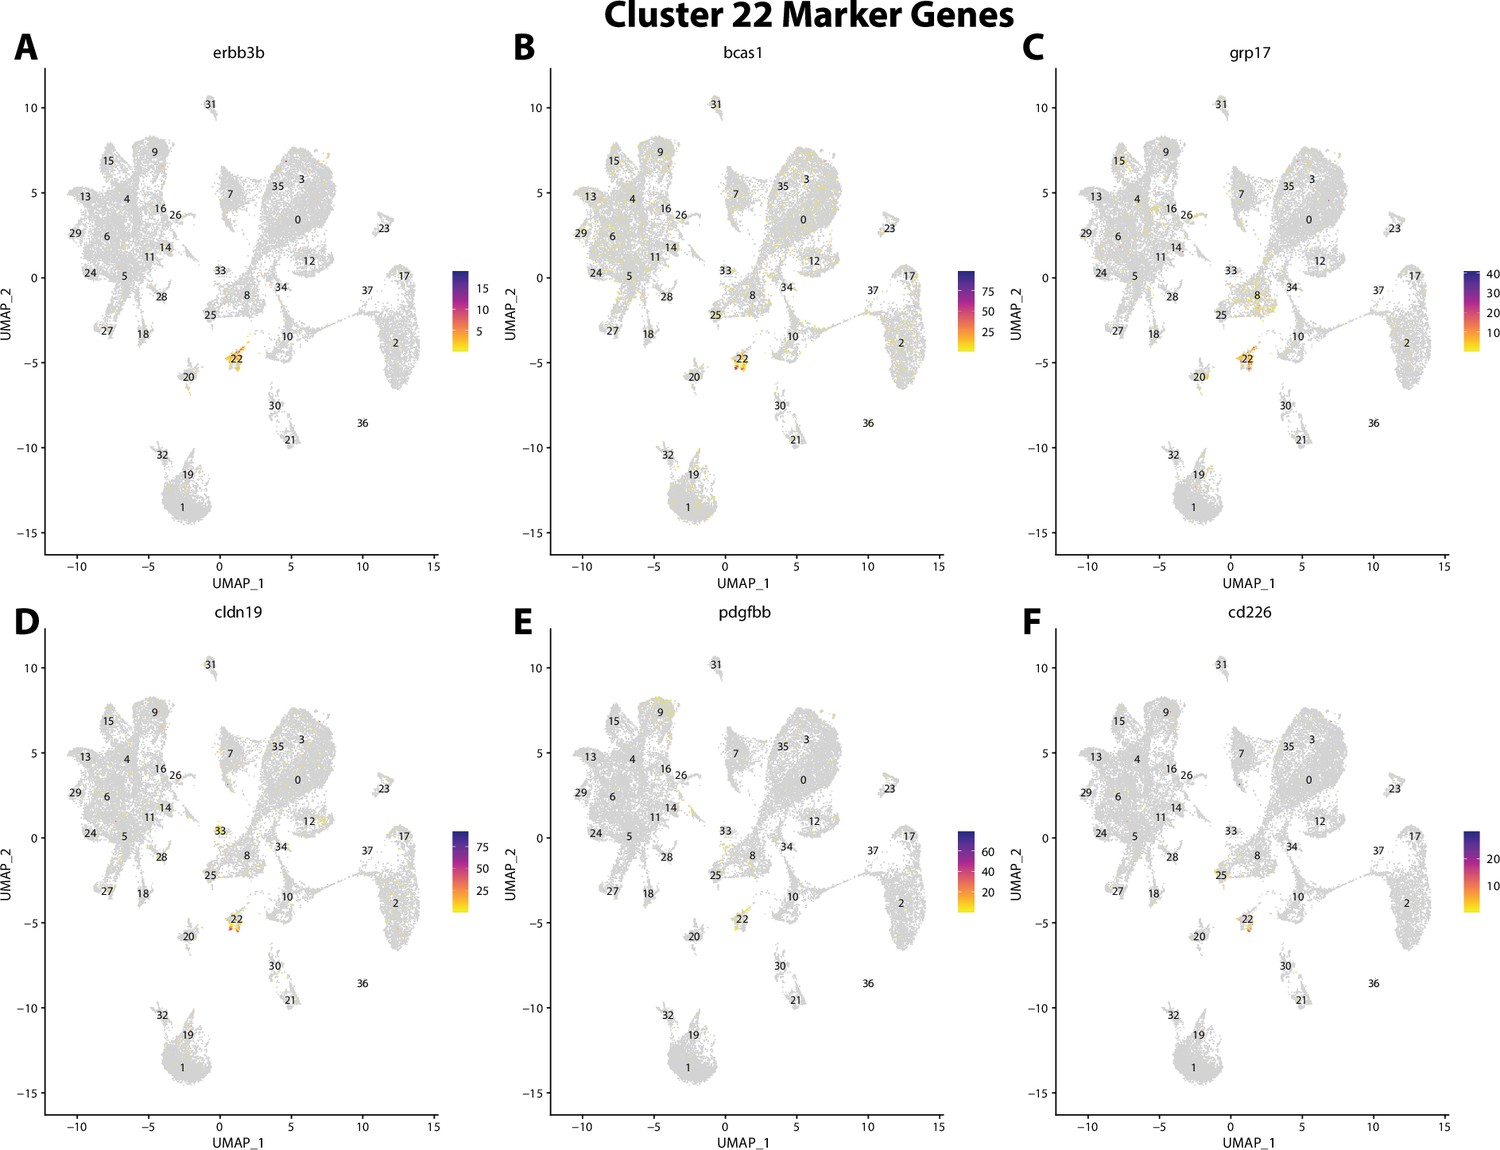
Gulf pipefish cluster 22 markers.
Feature plots of top markers for cluster 22 identified from the marker gene lists.
Figure 2—figure supplement 44
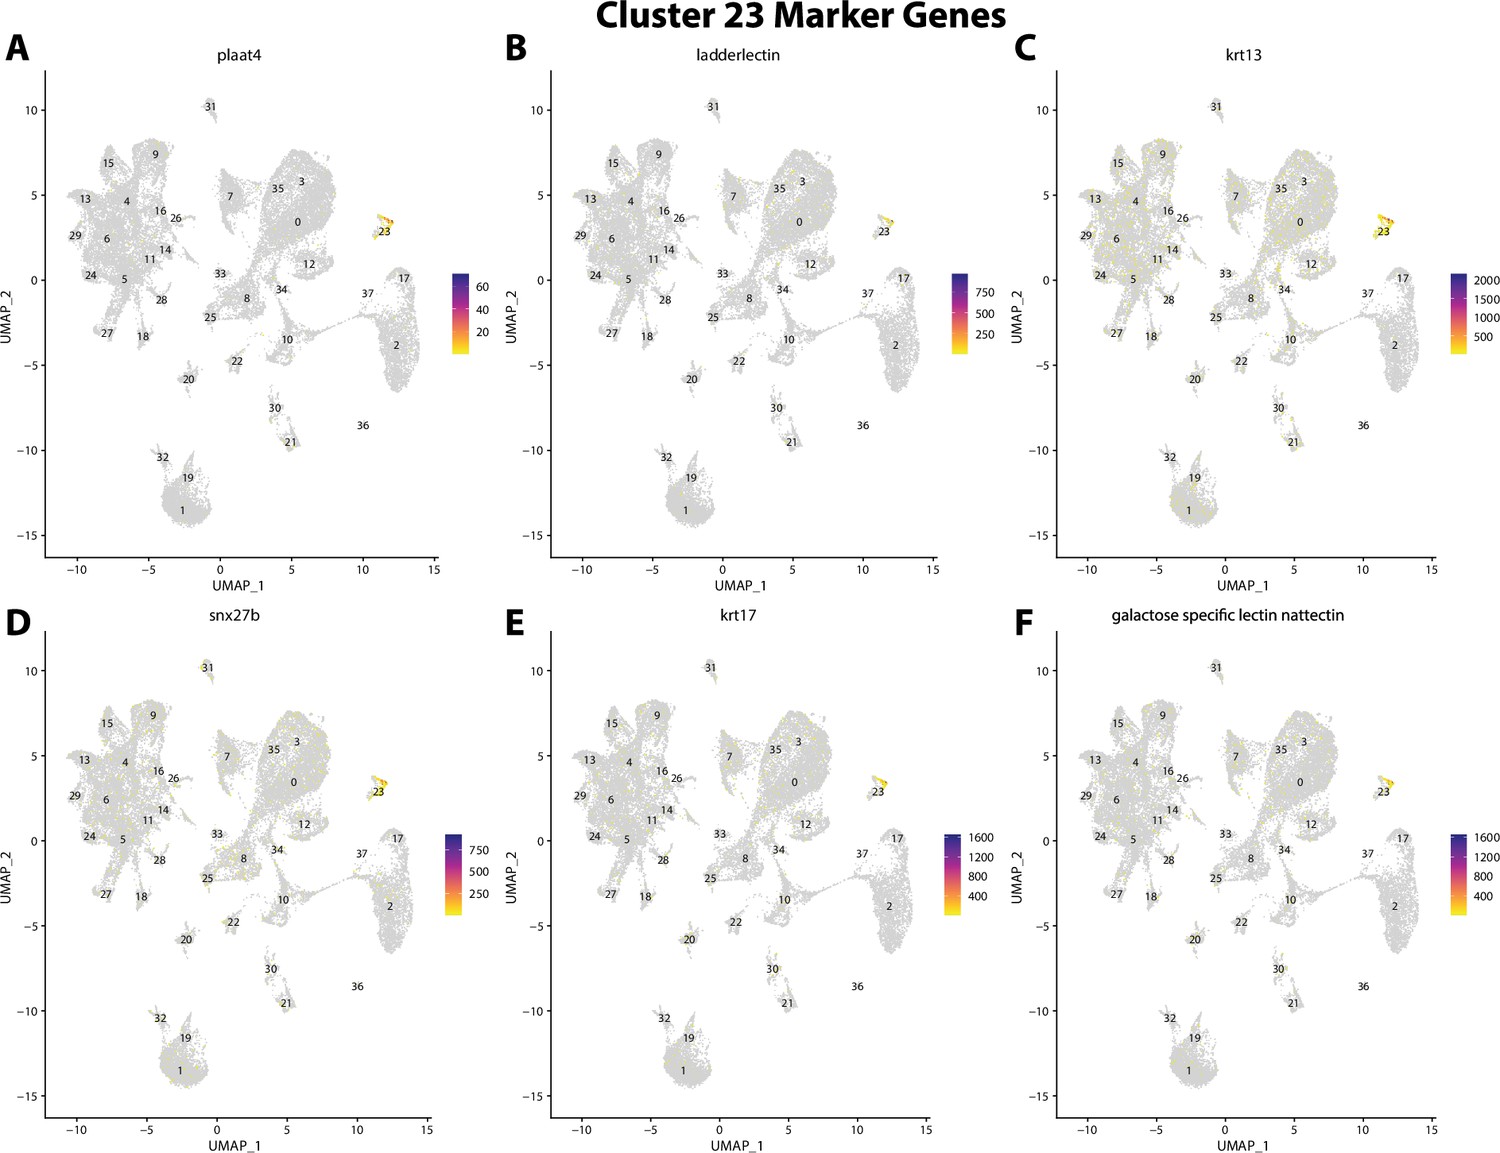
Gulf pipefish cluster 23 markers.
Feature plots of top markers for cluster 23 identified from the marker gene lists.
Figure 2—figure supplement 45
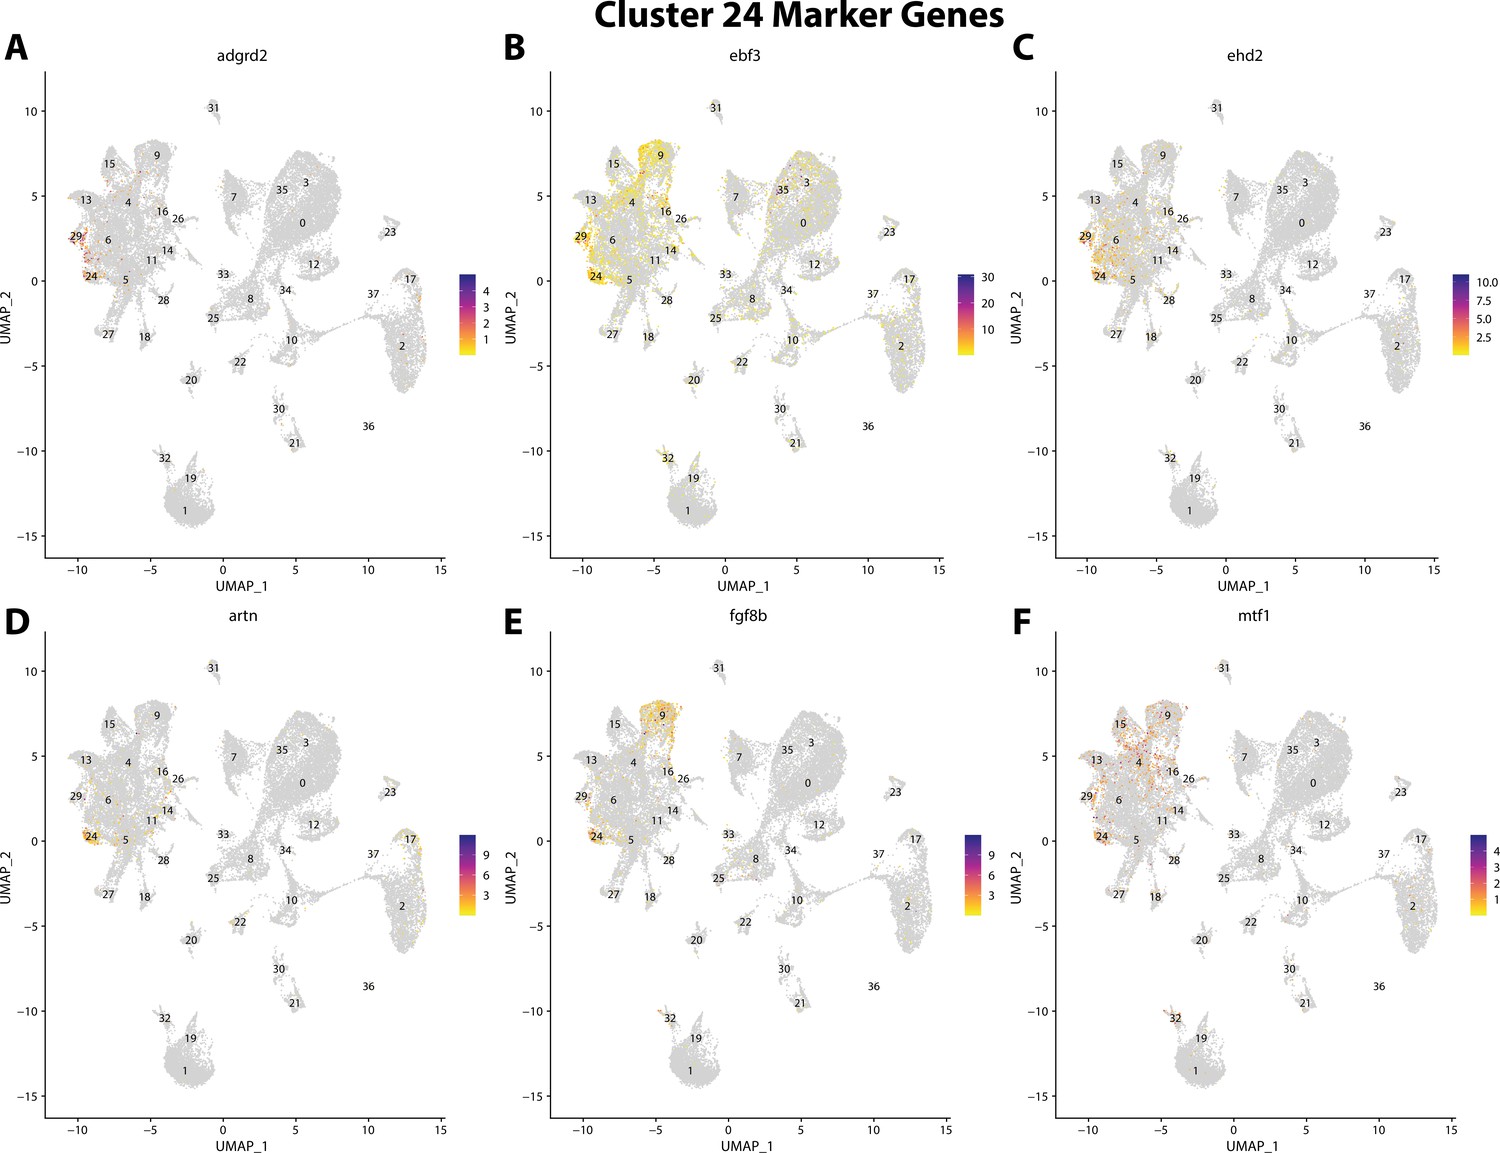
Gulf pipefish cluster 24 markers.
Feature plots of top markers for cluster 24 identified from the marker gene lists.
Figure 2—figure supplement 46
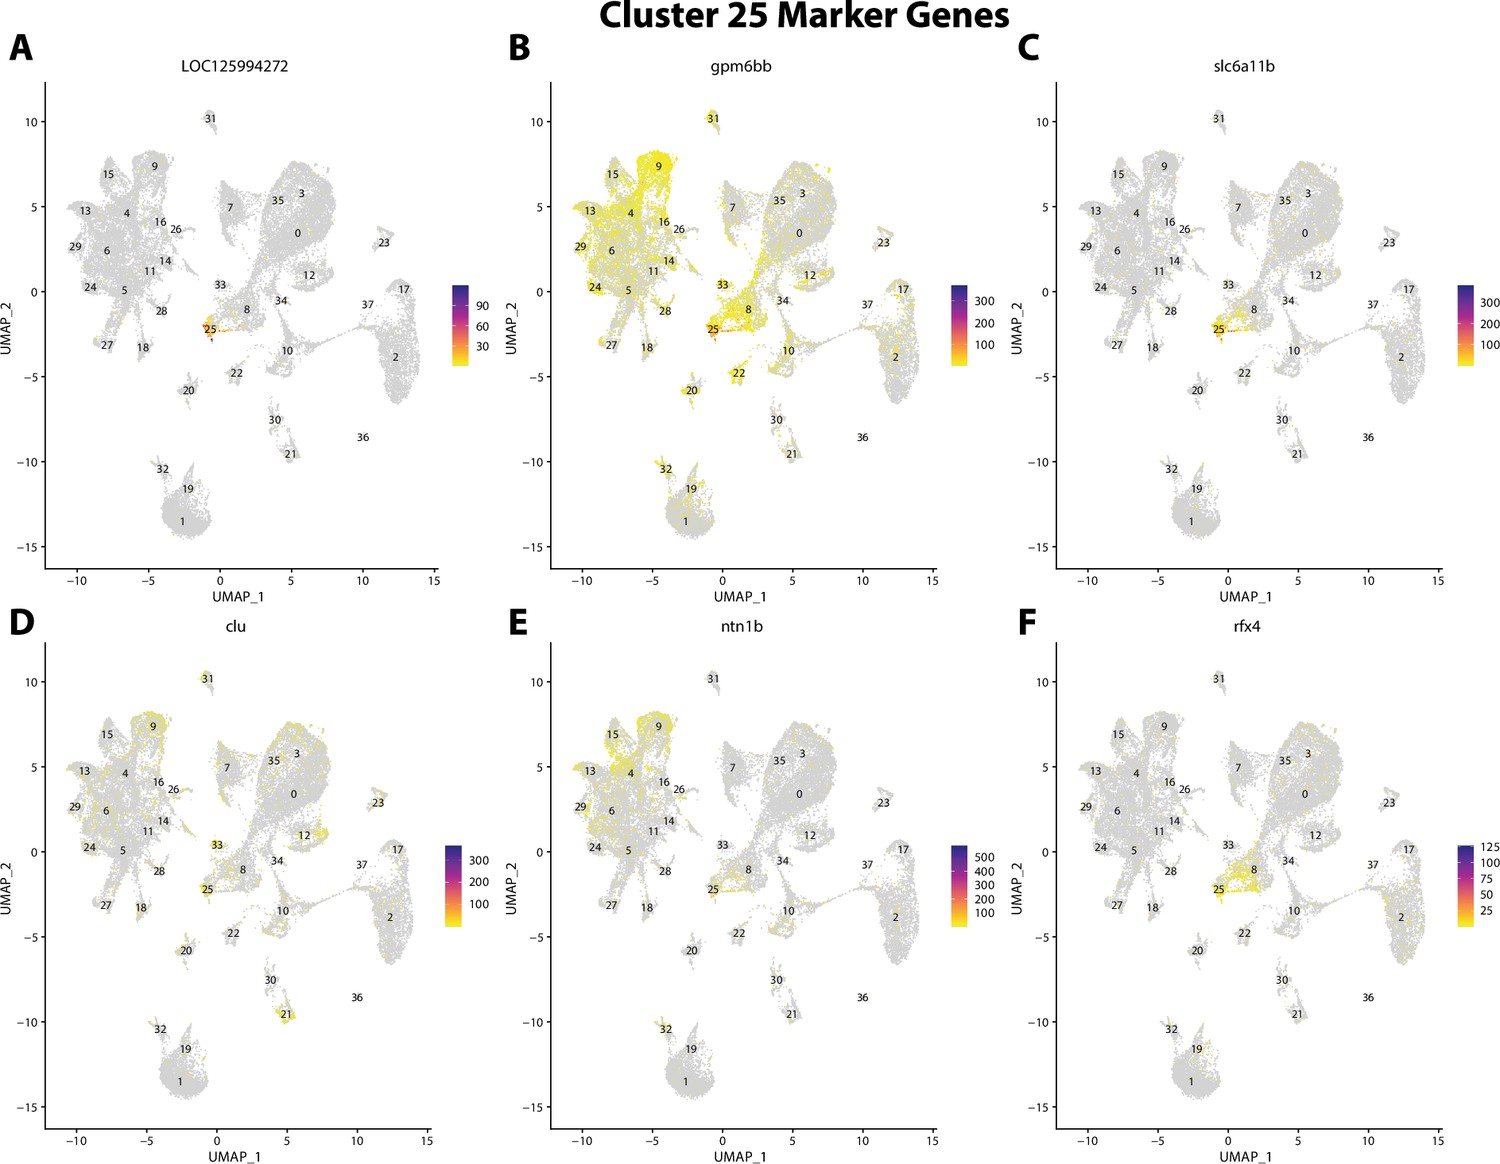
Gulf pipefish cluster 25 markers.
Feature plots of top markers for cluster 25 identified from the marker gene lists.
Figure 2—figure supplement 47
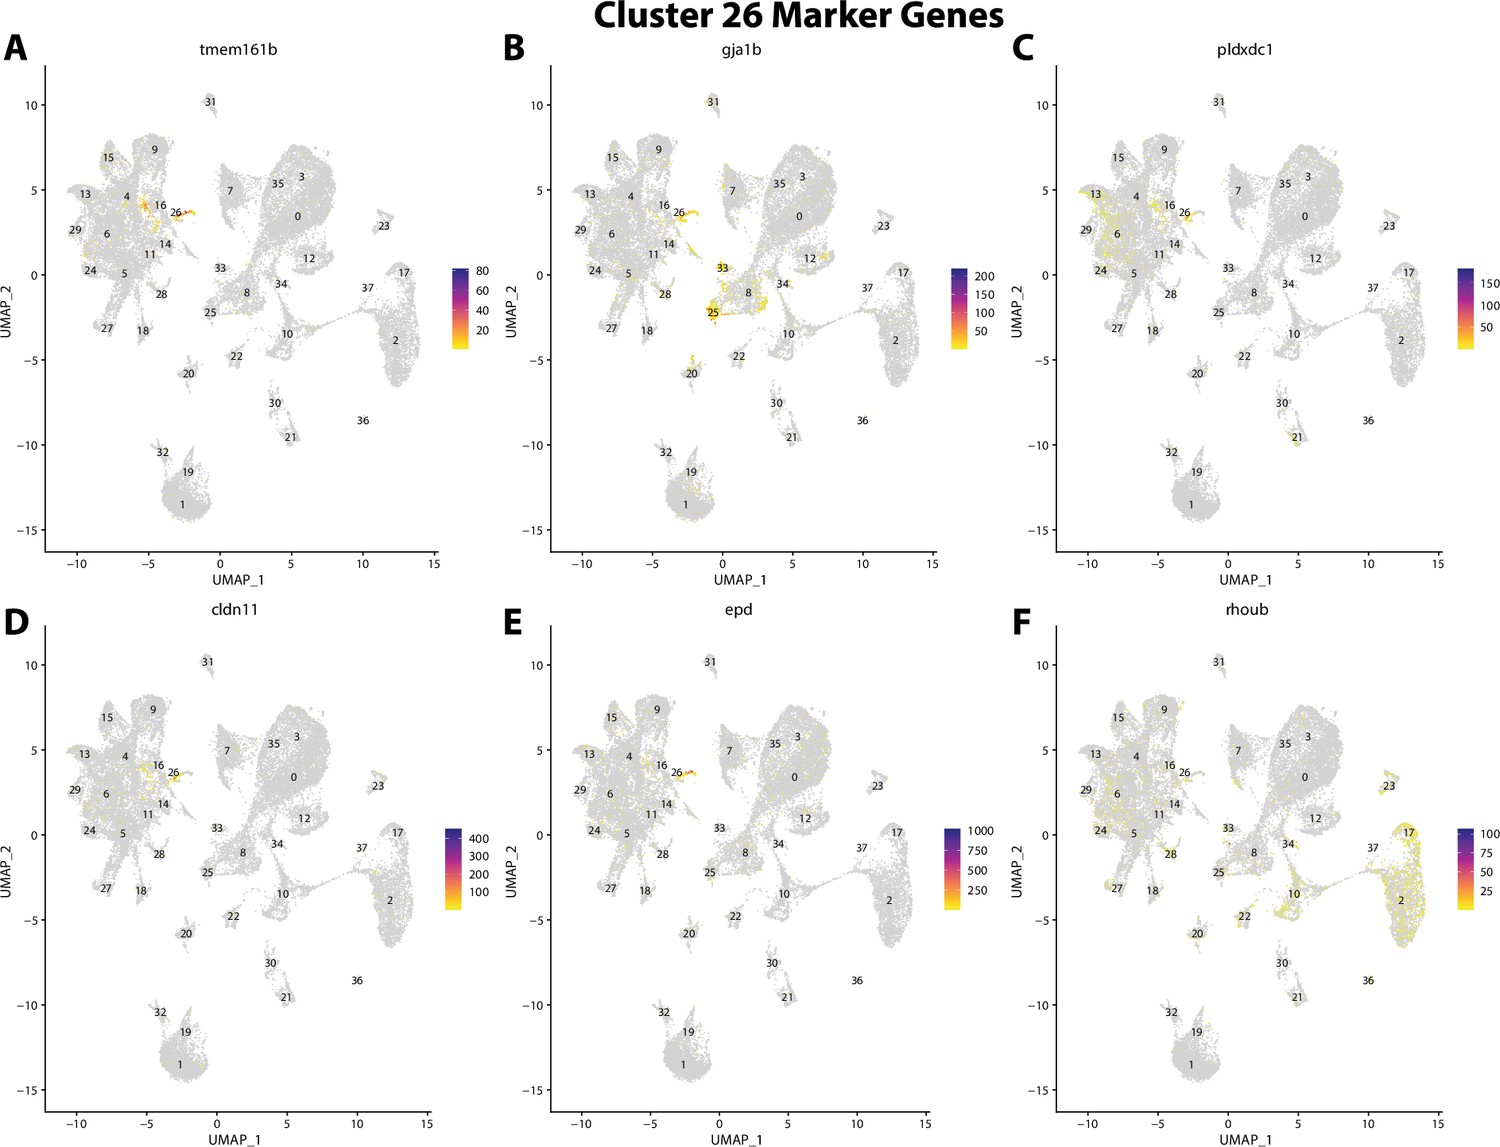
Gulf pipefish cluster 26 markers.
Feature plots of top markers for cluster 26 identified from the marker gene lists.
Figure 2—figure supplement 48
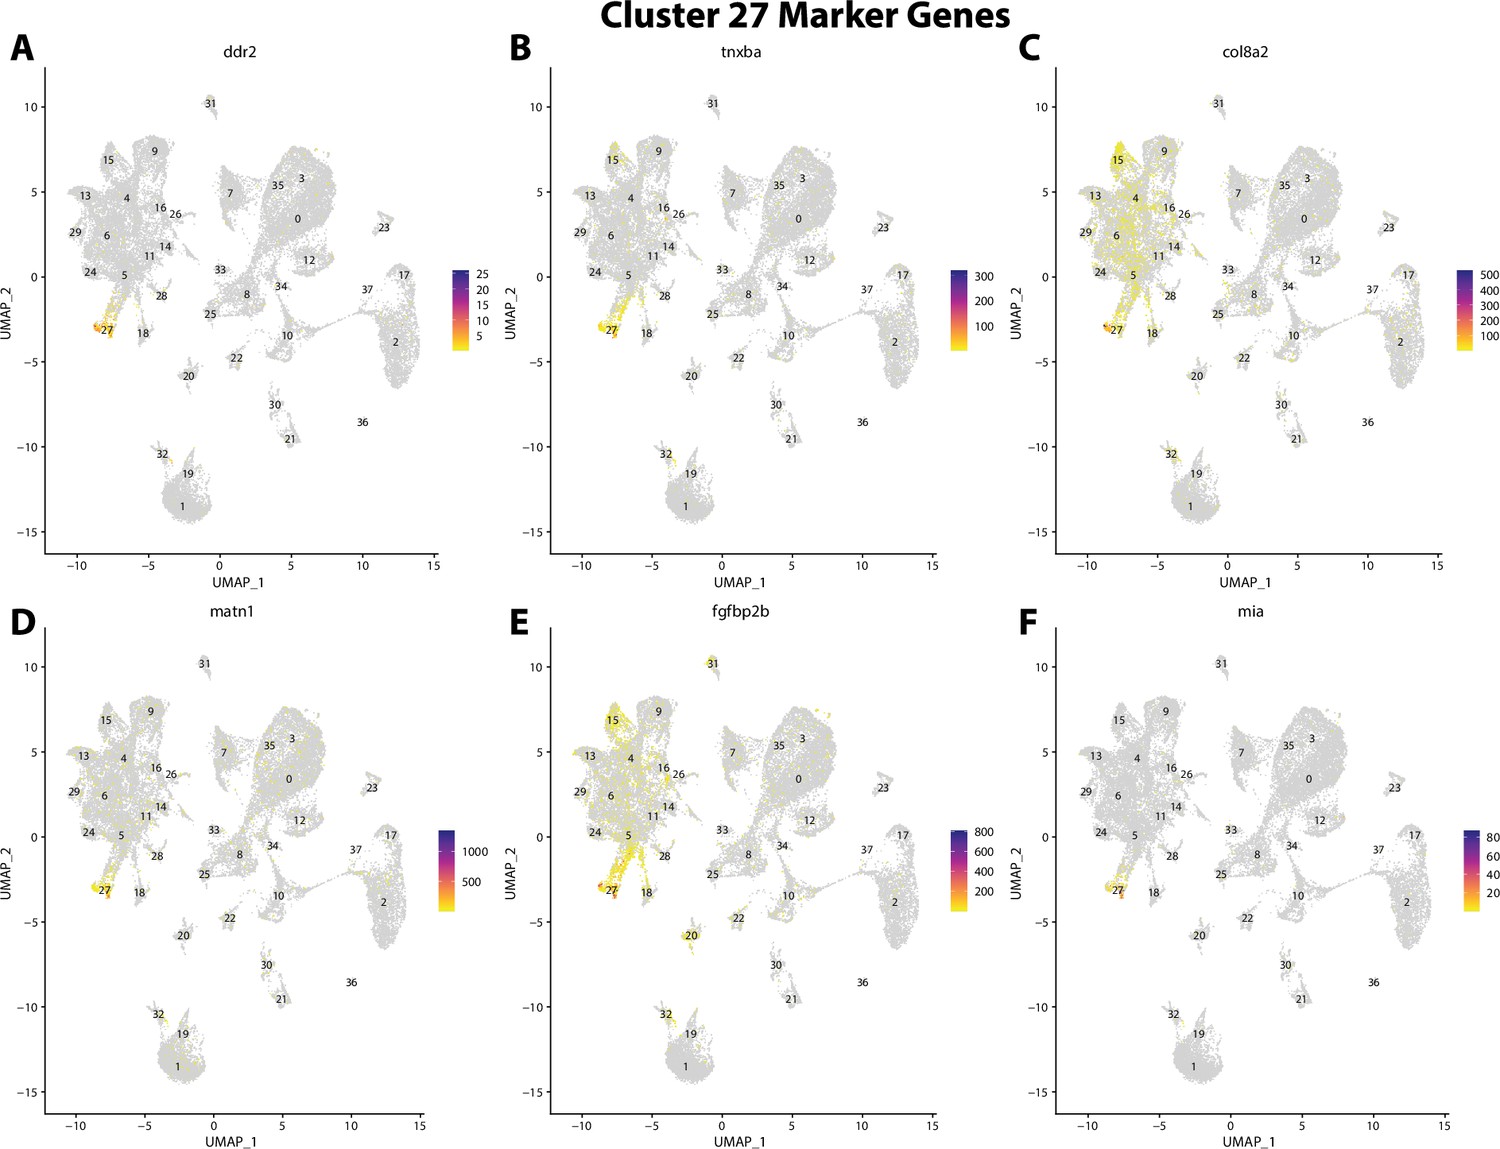
Gulf pipefish cluster 27 markers.
Feature plots of top markers for cluster 27 identified from the marker gene lists.
Figure 2—figure supplement 49
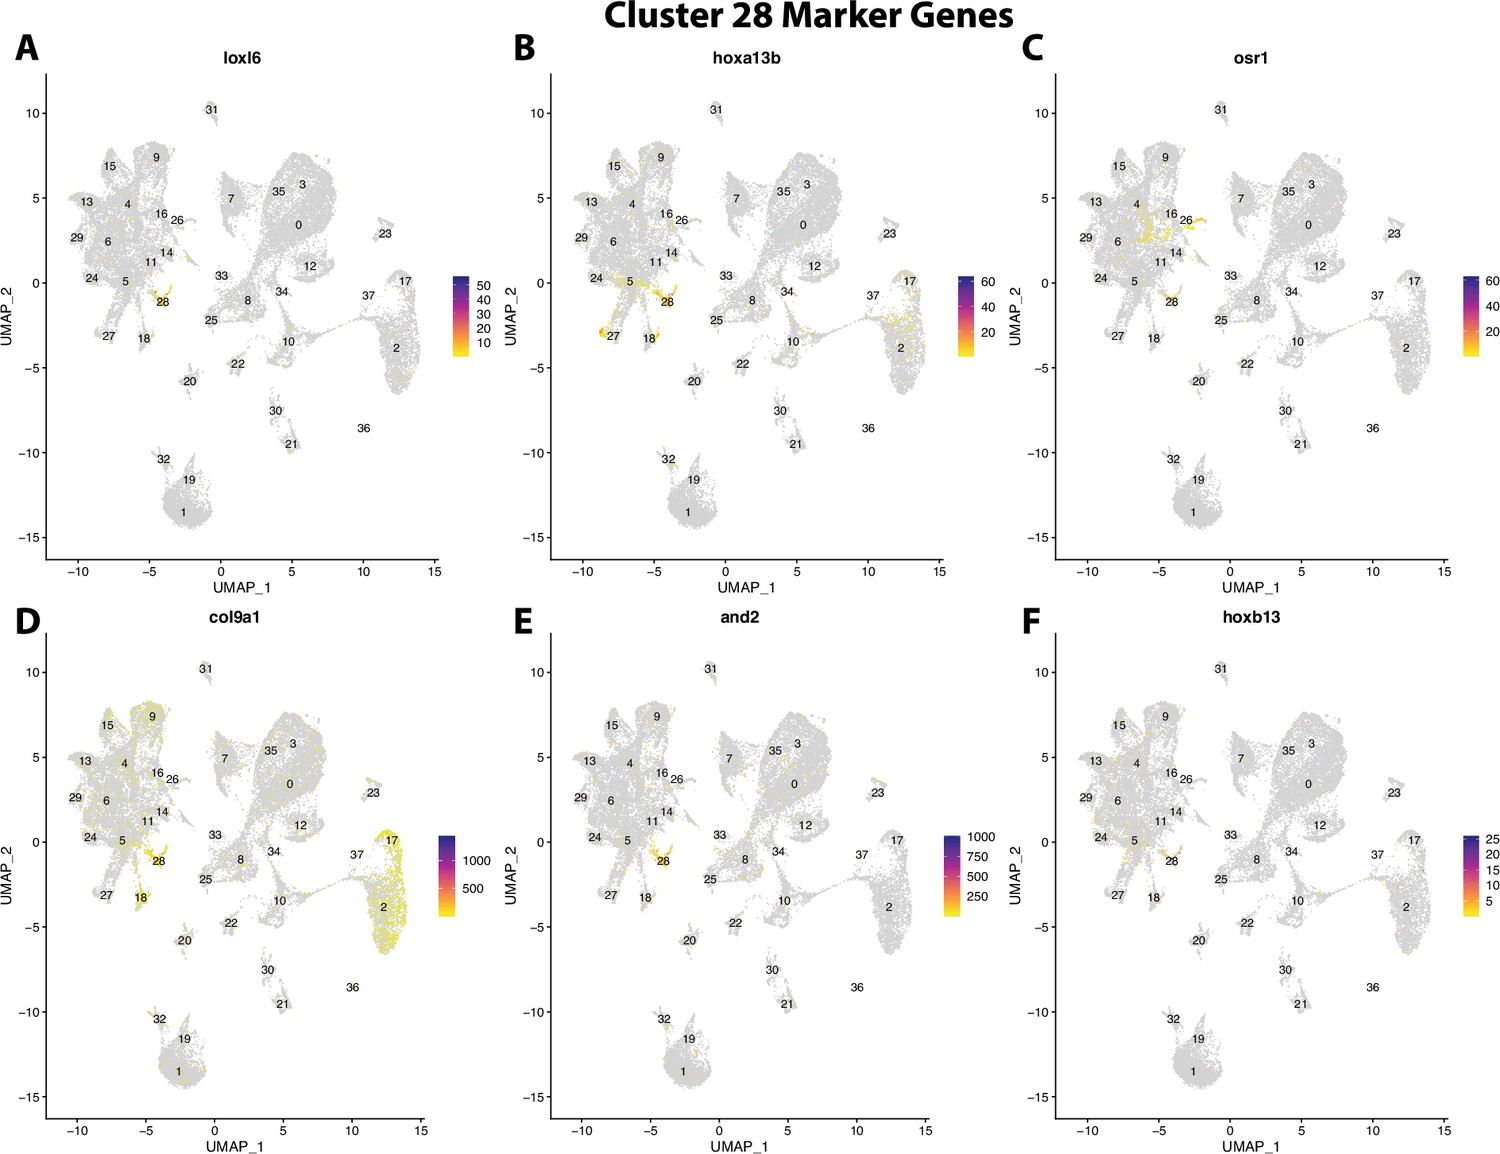
Gulf pipefish cluster 28 markers.
Feature plots of top markers for cluster 28 identified from the marker gene lists.
Figure 2—figure supplement 50
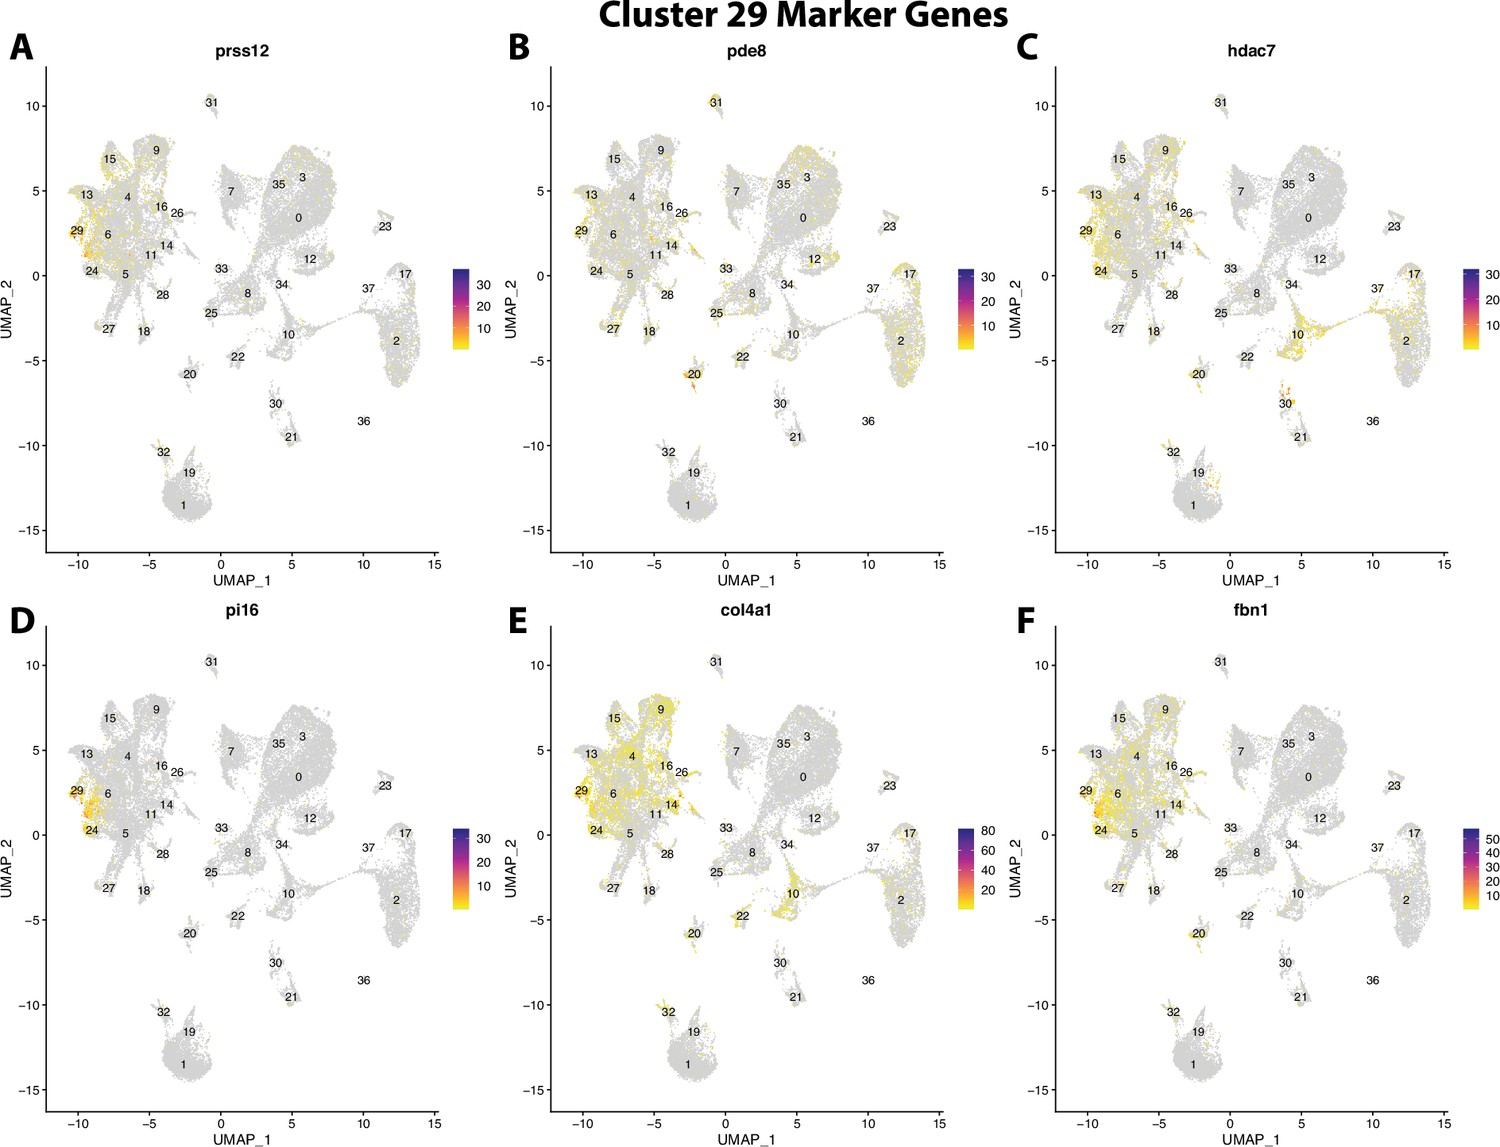
Gulf pipefish cluster 29 markers.
Feature plots of top markers for cluster 29 identified from the marker gene lists.
Figure 2—figure supplement 51
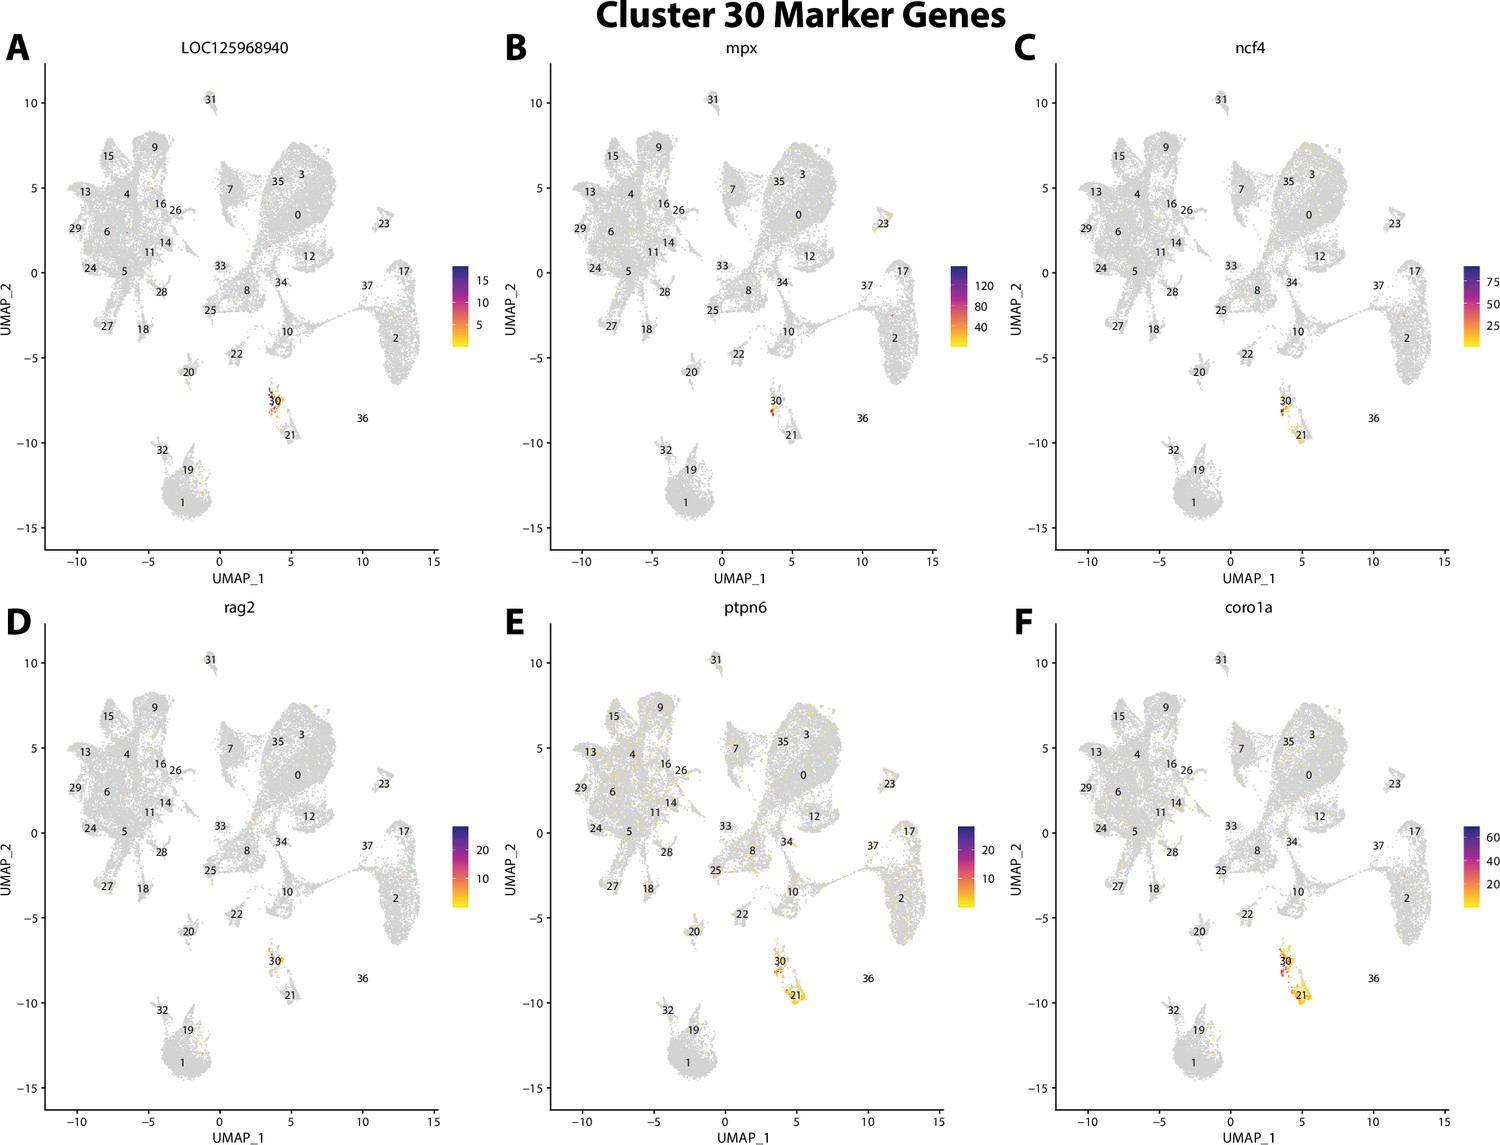
Gulf pipefish cluster 30 markers.
Feature plots of top markers for cluster 30 identified from the marker gene lists.
Figure 2—figure supplement 52
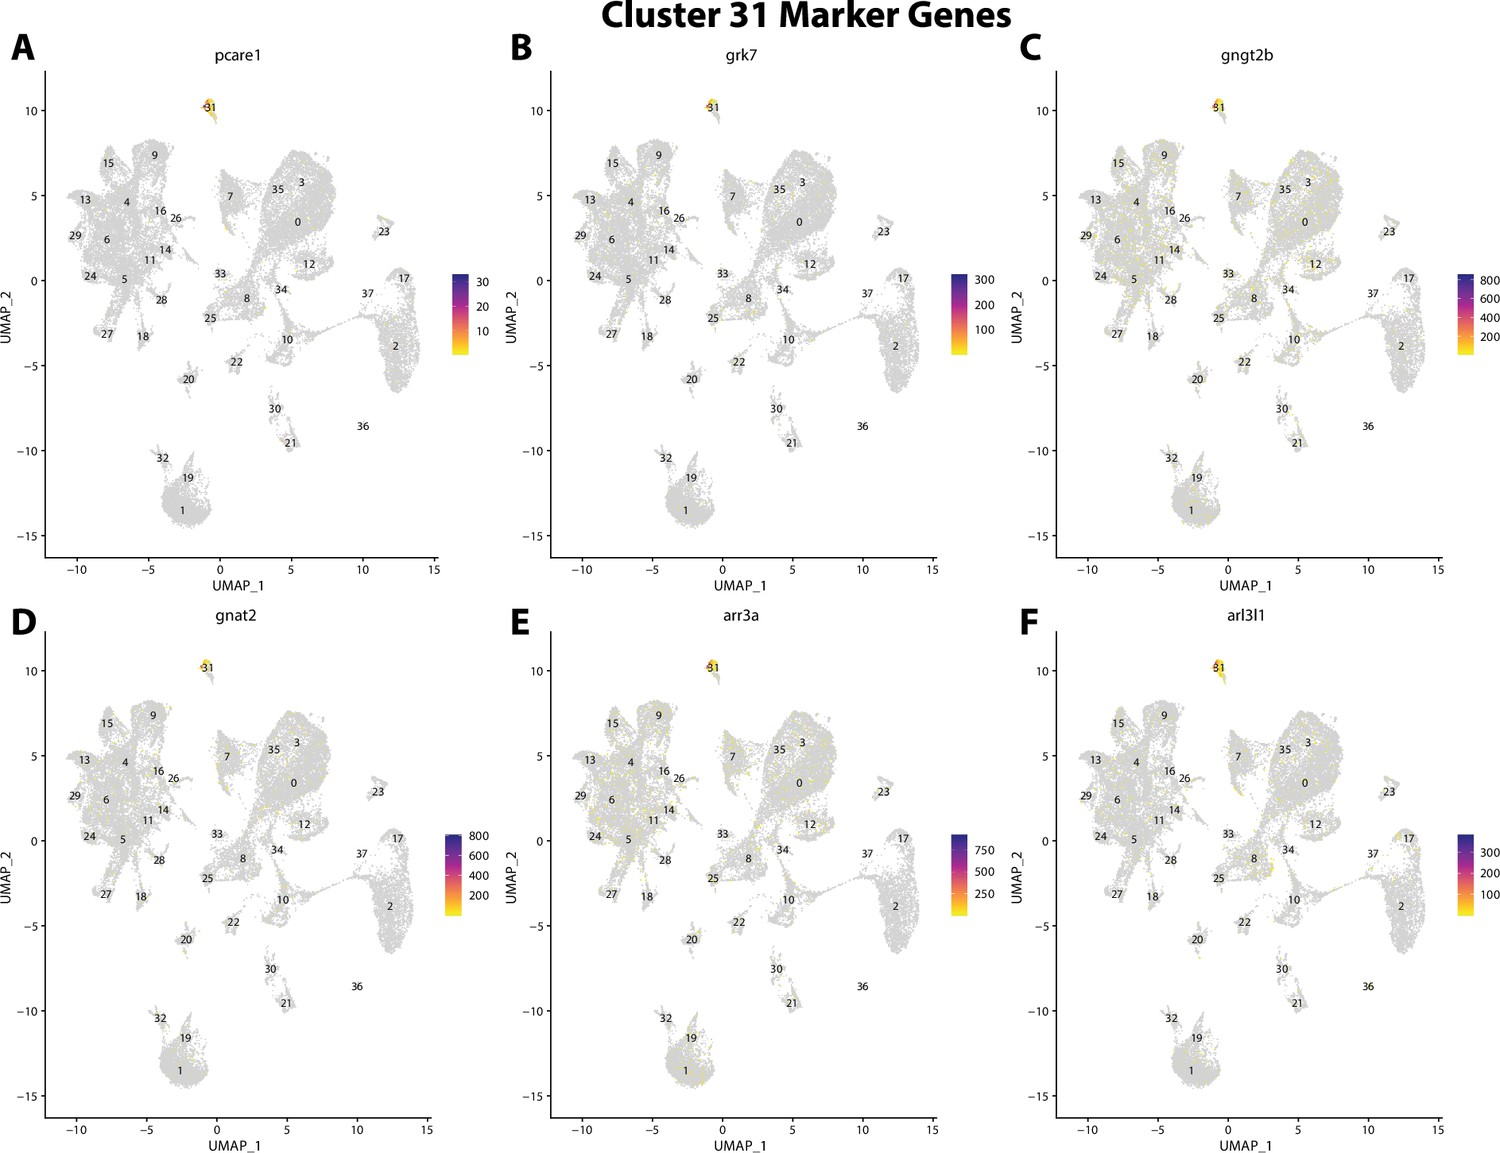
Gulf pipefish cluster 31 markers.
Feature plots of top markers for cluster 31 identified from the marker gene lists.
Figure 2—figure supplement 53
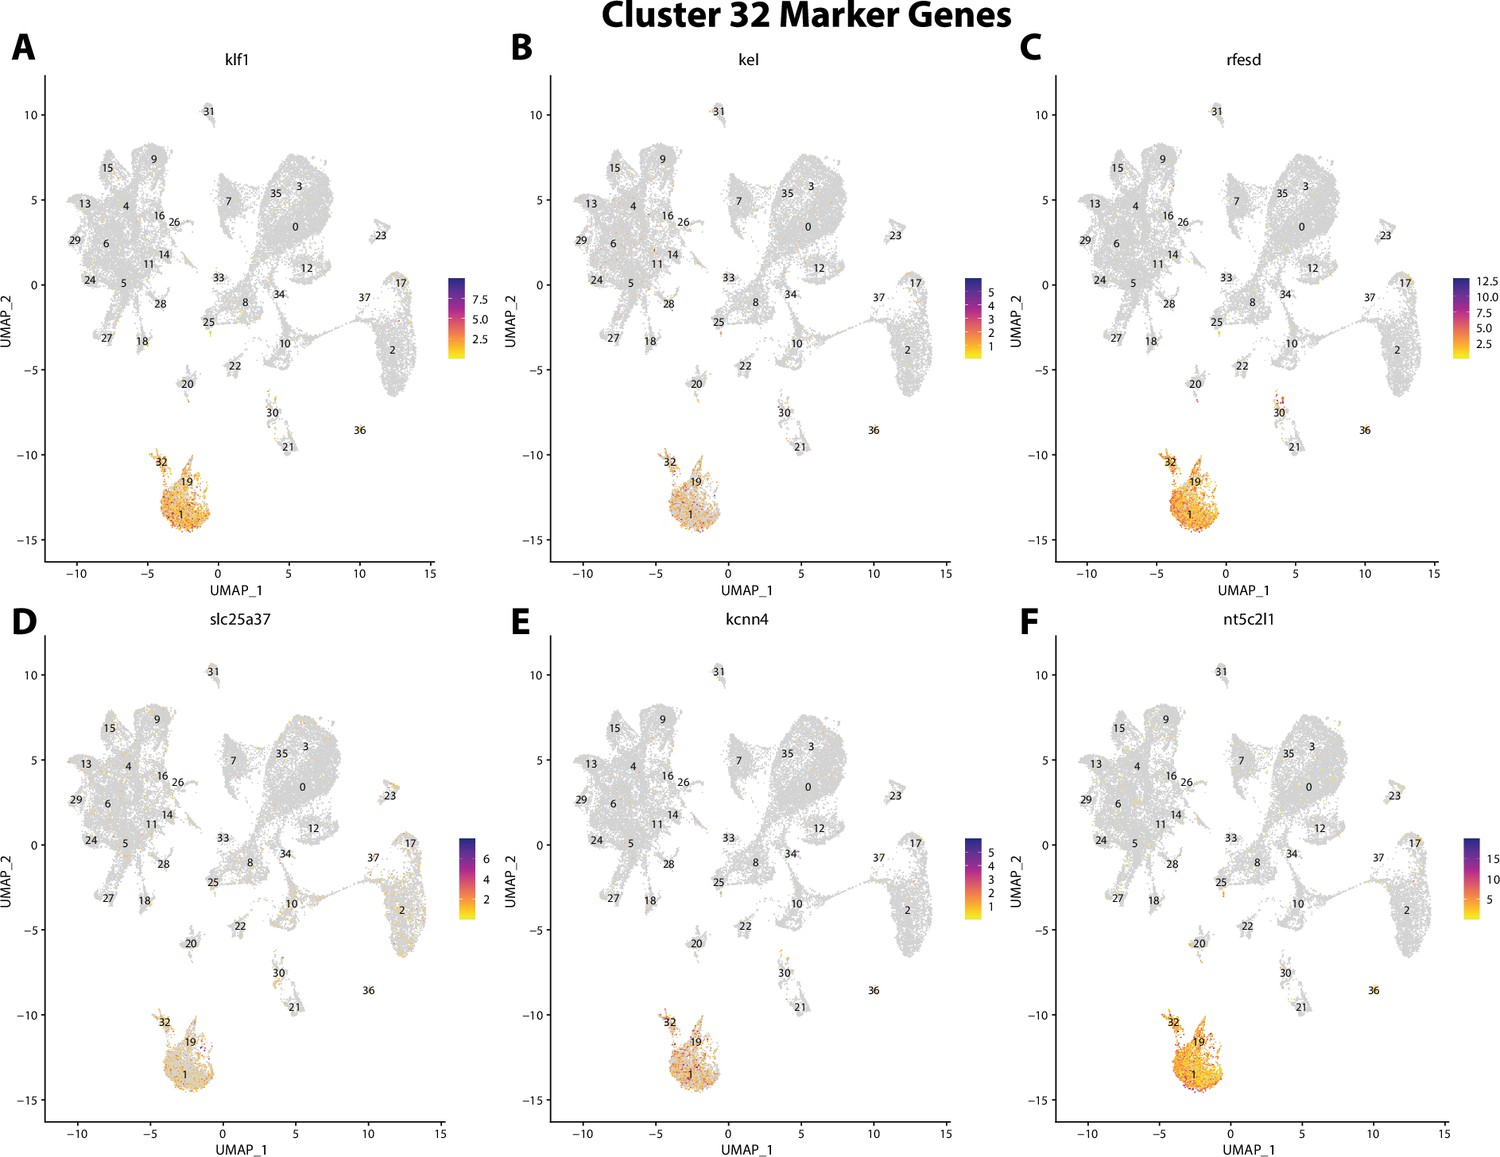
Gulf pipefish cluster 32 markers.
Feature plots of top markers for cluster 32 identified from the marker gene lists.
Figure 2—figure supplement 54
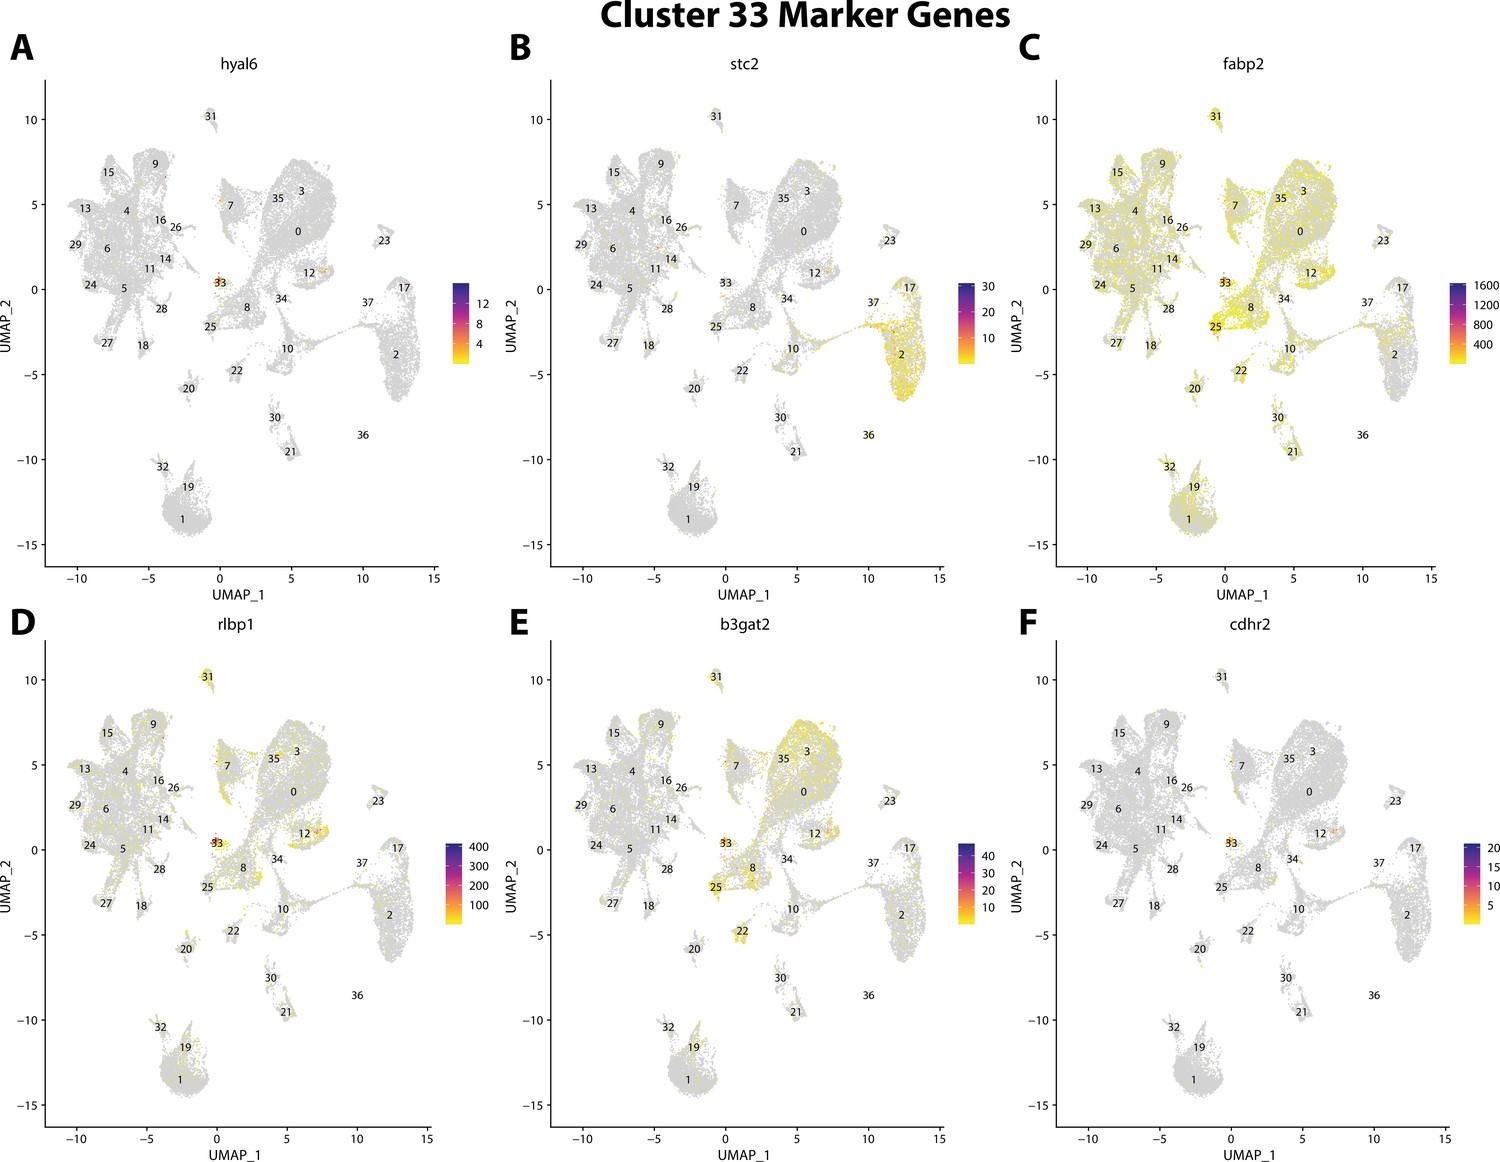
Gulf pipefish cluster 33 markers.
Feature plots of top markers for cluster 33 identified from the marker gene lists.
Figure 2—figure supplement 55
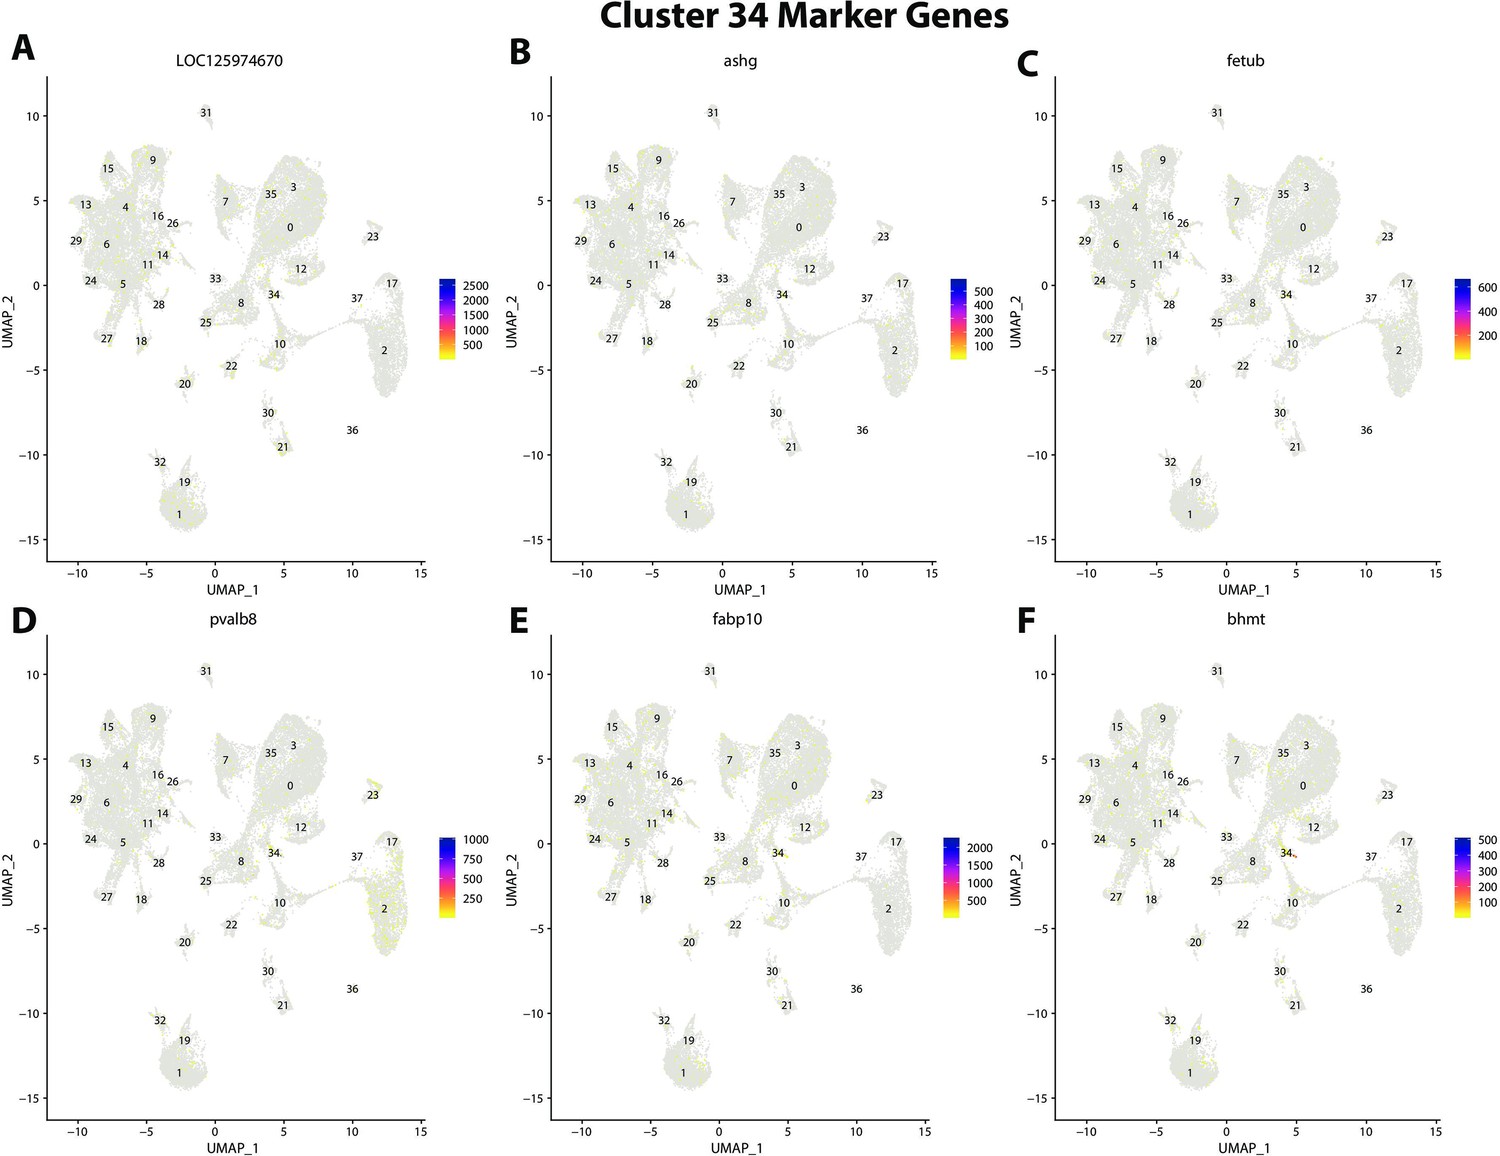
Gulf pipefish cluster 34 markers.
Feature plots of top markers for cluster 34 identified from the marker gene lists.
Figure 2—figure supplement 56
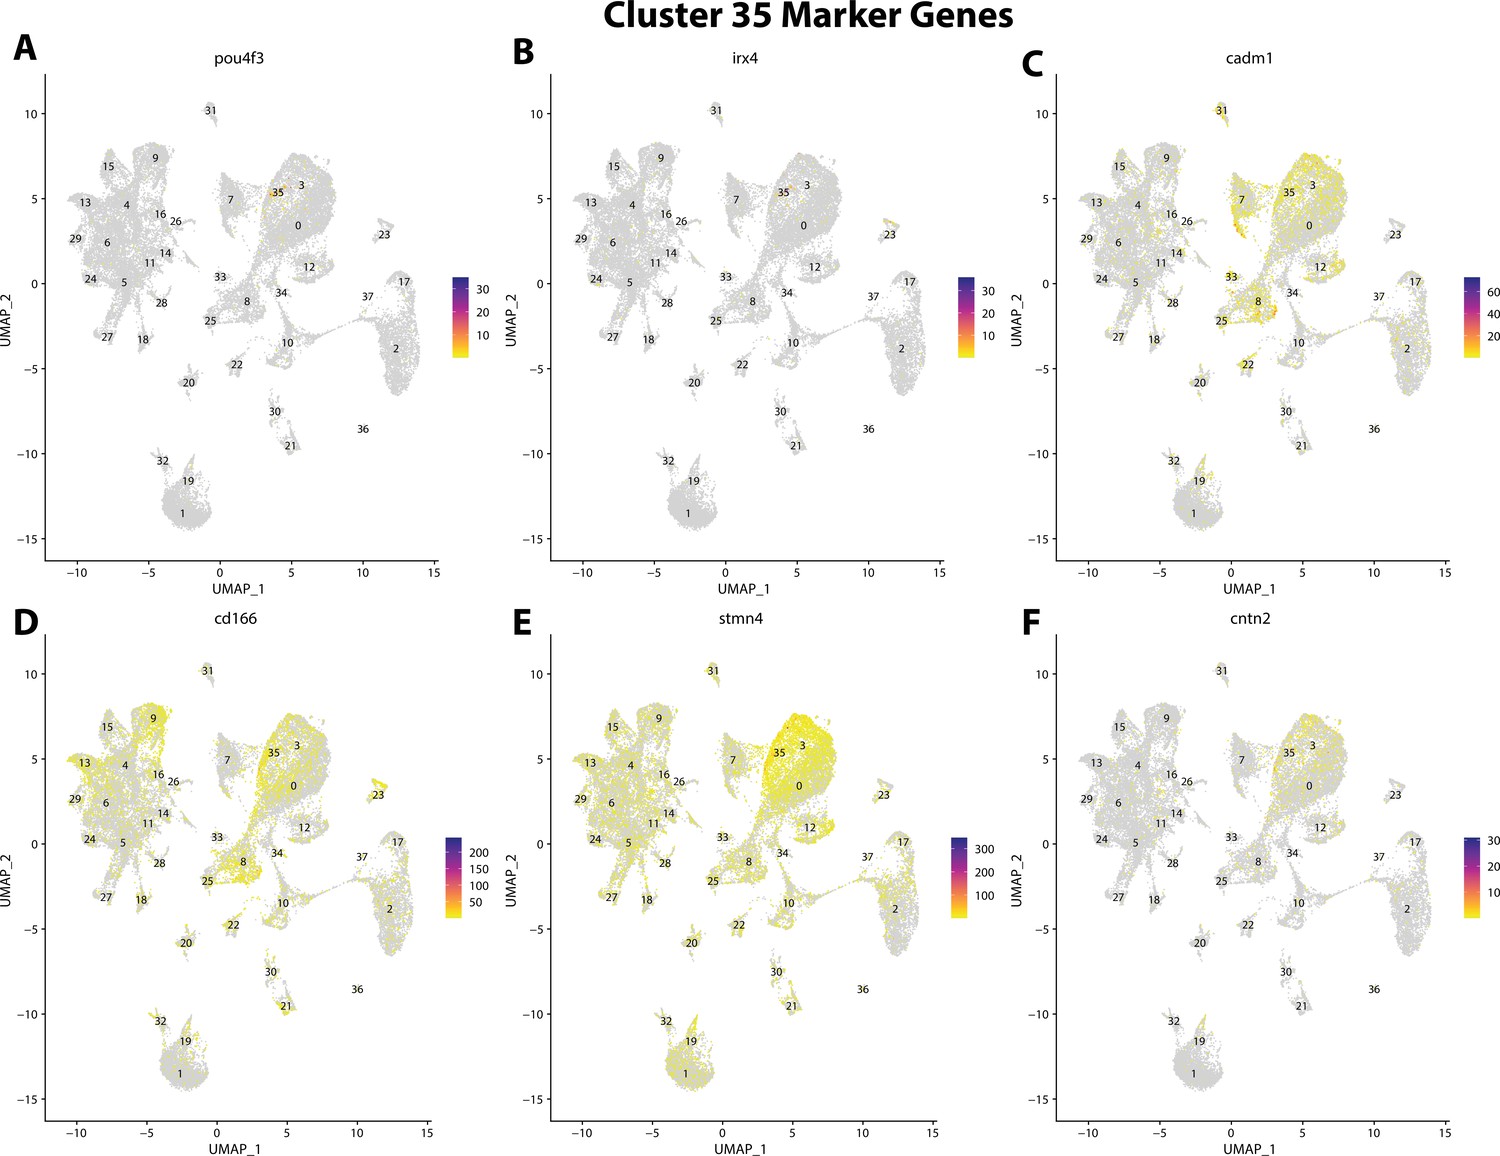
Gulf pipefish cluster 35 markers.
Feature plots of top markers for cluster 35 identified from the marker gene lists.
Figure 2—figure supplement 57
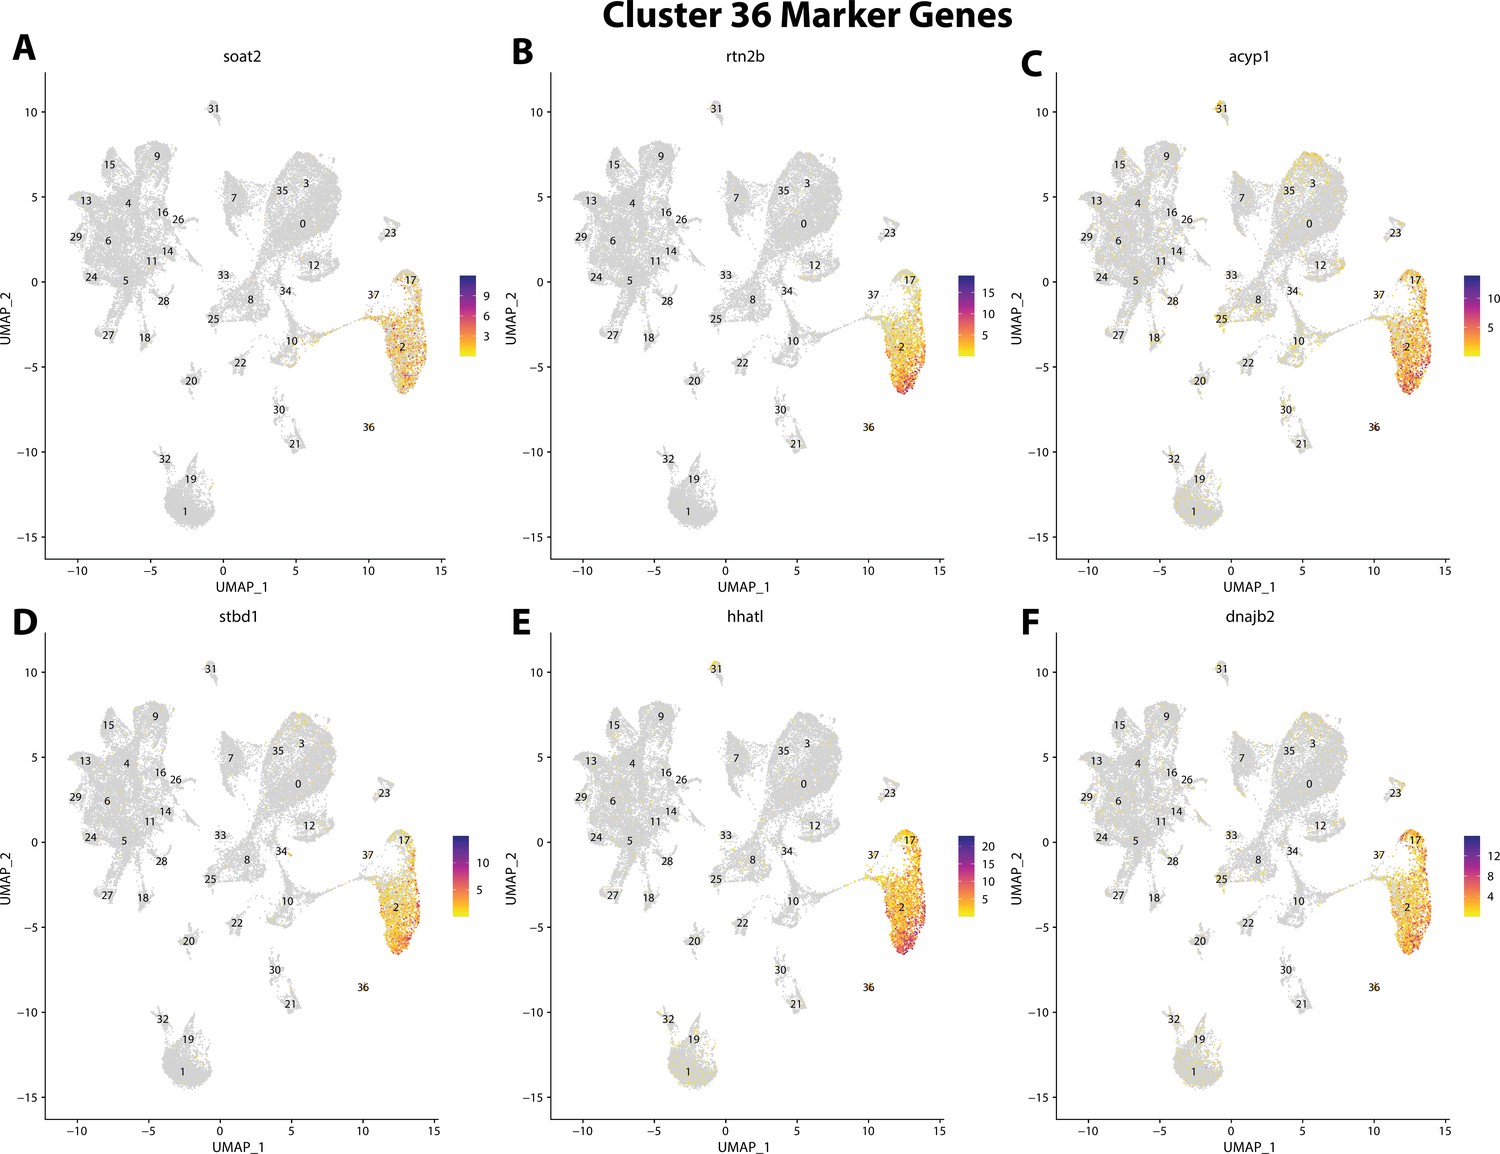
Gulf pipefish cluster 36 markers.
Feature plots of top markers for cluster 36 identified from the marker gene lists.
Figure 2—figure supplement 58
Gulf pipefish cluster 37 markers.
Feature plots of top markers for cluster 37 identified from the marker gene lists.
Figure 2—figure supplement 59
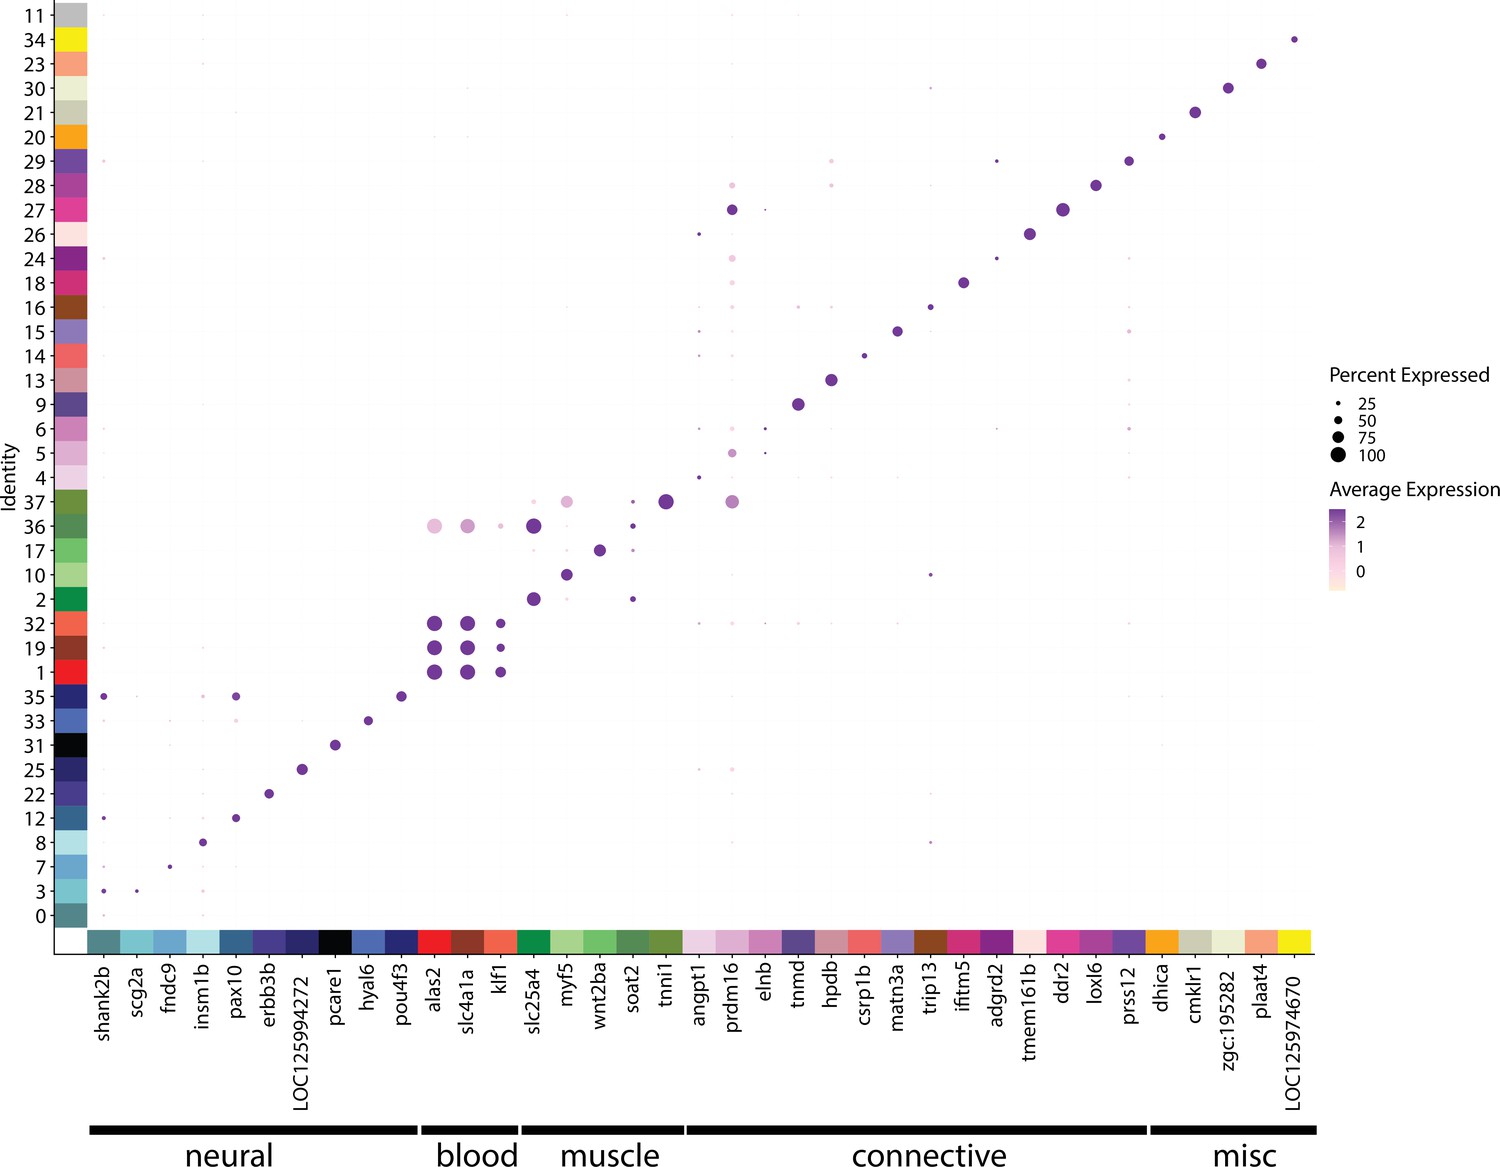
Marker genes define cell identity and are a resource for cell cluster exploration.
This dotplot shows the marker genes on the x-axis, and the cell cluster on the y-axis. The size of each dot indicates the percentage of cells that express the gene in each cluster. The darkness of each dot represents the average expression of the gene.
Figure 2—figure supplement 60
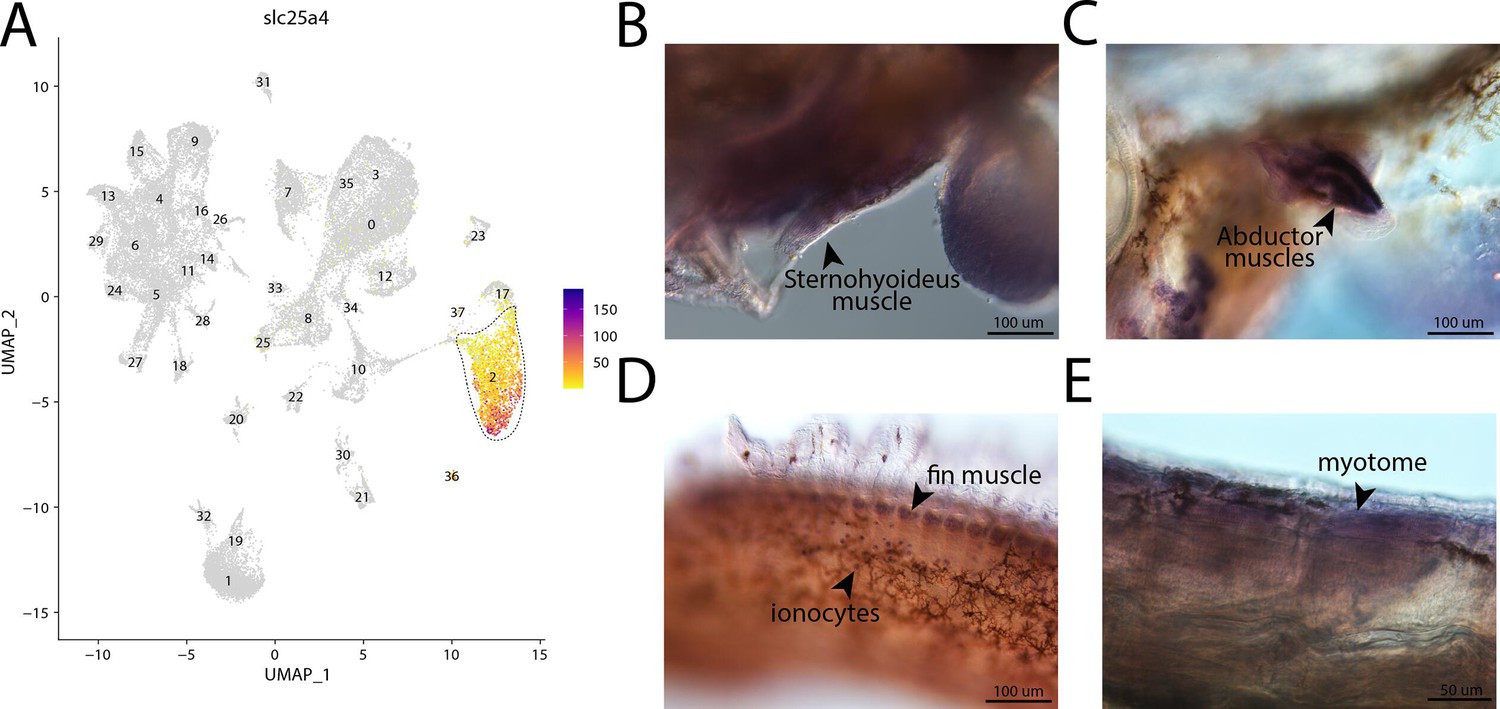
slc25a4, a marker for cluster 2, is expressed in muscle cells in bay pipefish.
Atlas expression is limited to cluster 2 (A). In situ hybridization experiments revealed muscle staining of slc25a4 in bay pipefish (B–D). Wild-caught bay pipefish at the onset of craniofacial elongation were used for the experiment. Embryos were mounted laterally to highlight expression domains.
Figure 2—figure supplement 61
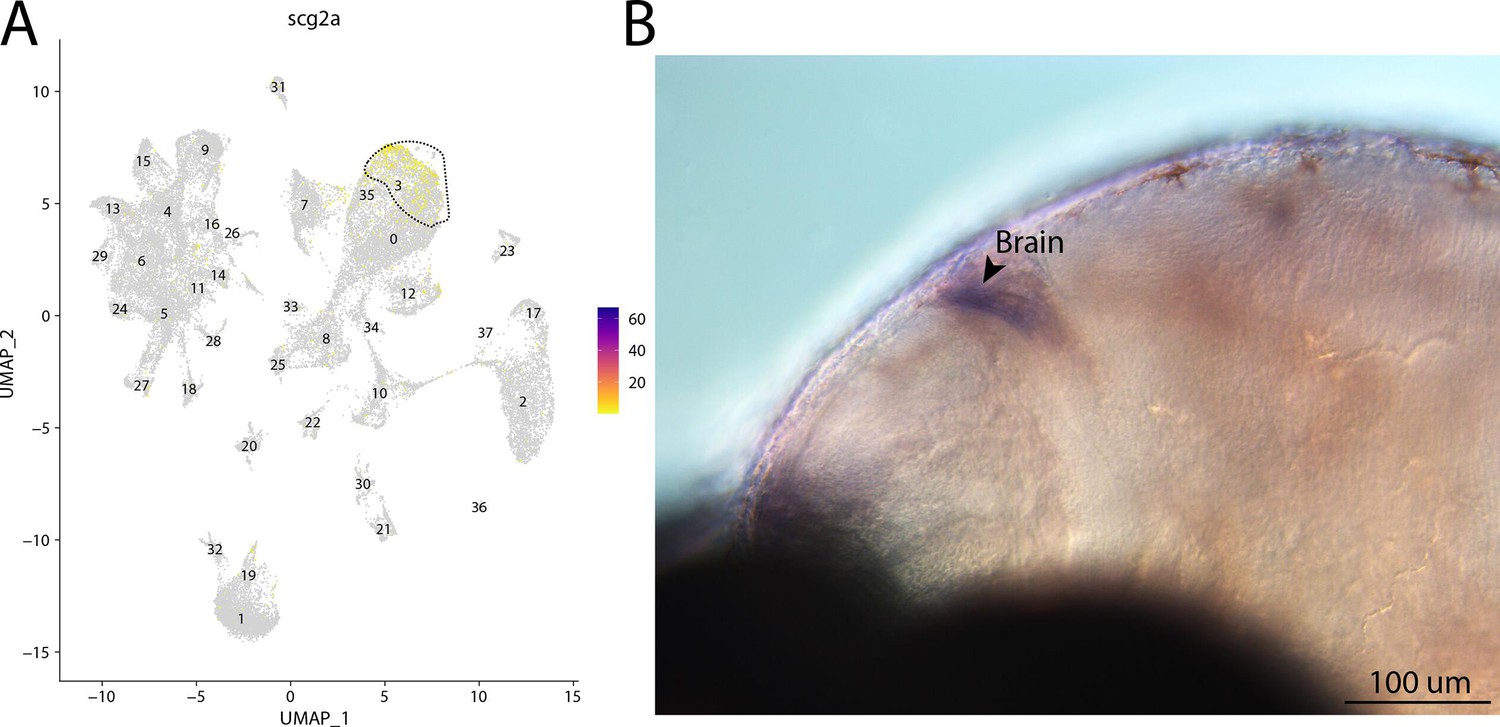
scg2a, a marker for cluster 3, is expressed in the brain of bay pipefish.
Atlas expression is limited to cluster 3 (A). In situ hybridization experiments revealed brain staining of scg2a in bay pipefish (B–D). Wild-caught bay pipefish at the onset of craniofacial elongation were used for the experiment. Embryos were mounted laterally to highlight expression domains.
Figure 2—figure supplement 62
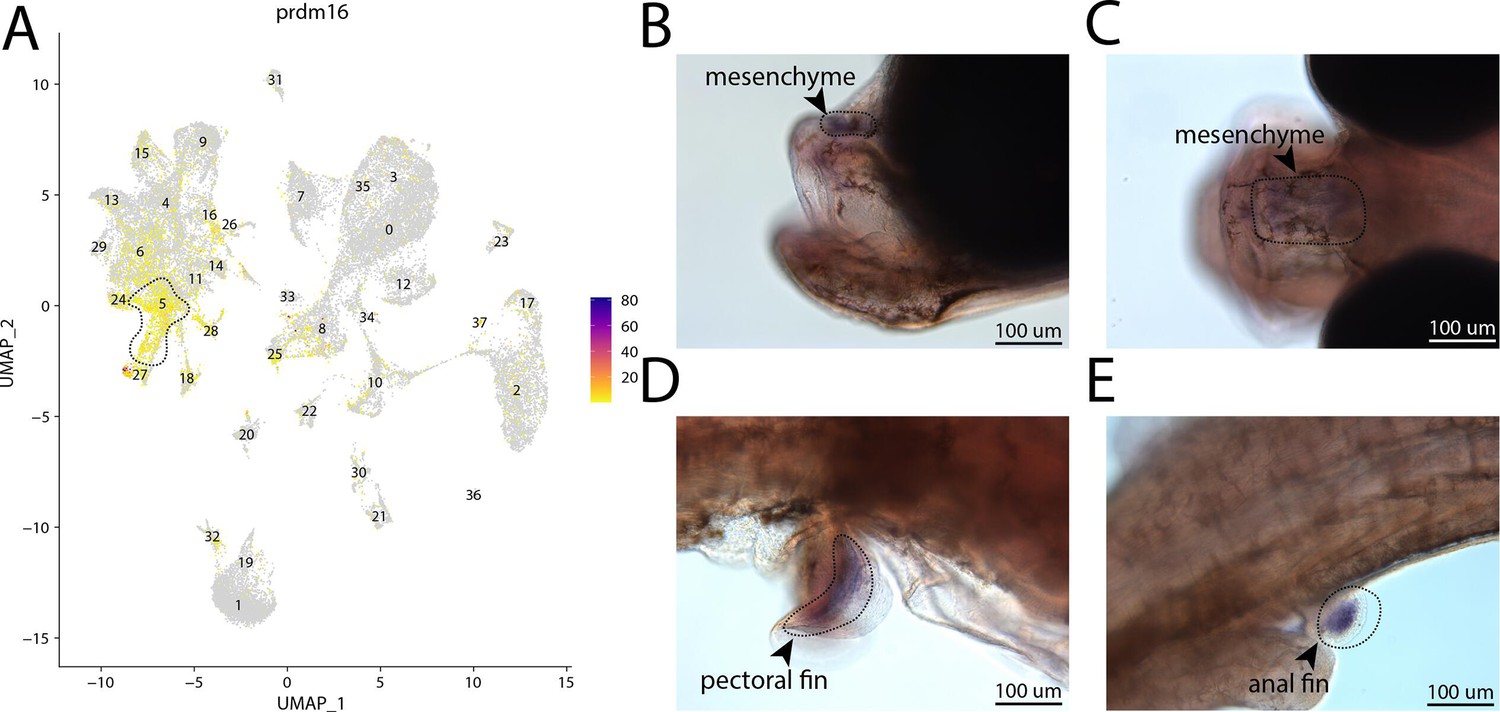
prdm16, a marker for cluster 5, is expressed in the head and fins of bay pipefish.
Strong expression of prdm16 in cluster 5, osteochondrogenic mesenchyme (A). In situ hybridization experiments revealed mesenchymal staining of prdm16 in the fins and face of bay pipefish (B–D). Wild-caught bay pipefish at the onset of craniofacial elongation were used for the experiment. Embryos were mounted laterally (B, D, E) and with a dorsal view (C) to highlight expression domains.
Figure 2—figure supplement 63
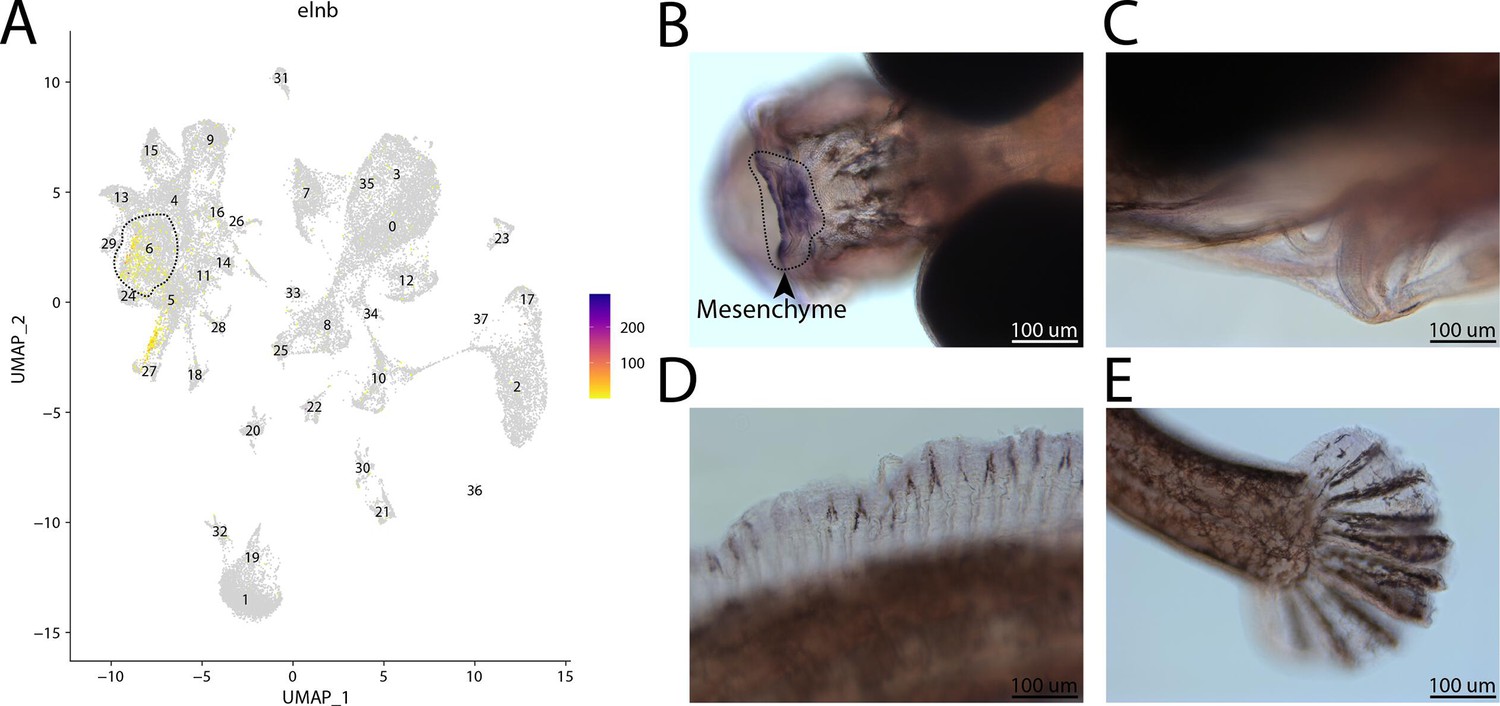
elnb, a marker for cluster 6, is expressed in the head of a bay pipefish.
Strong expression of elnb in cluster 6, osteochondrogenic mesenchyme (A). In situ hybridization experiments revealed mesenchymal staining of elnb in the face of bay pipefish (B–D). Wild-caught bay pipefish at the onset of craniofacial elongation were used for the experiment. Embryos were mounted dorsally to showcase the craniofacial staining (B) and laterally (C–E) to show the lack of staining in the ceratohyal, dorsal fin, and caudal fin.
Figure 2—figure supplement 64
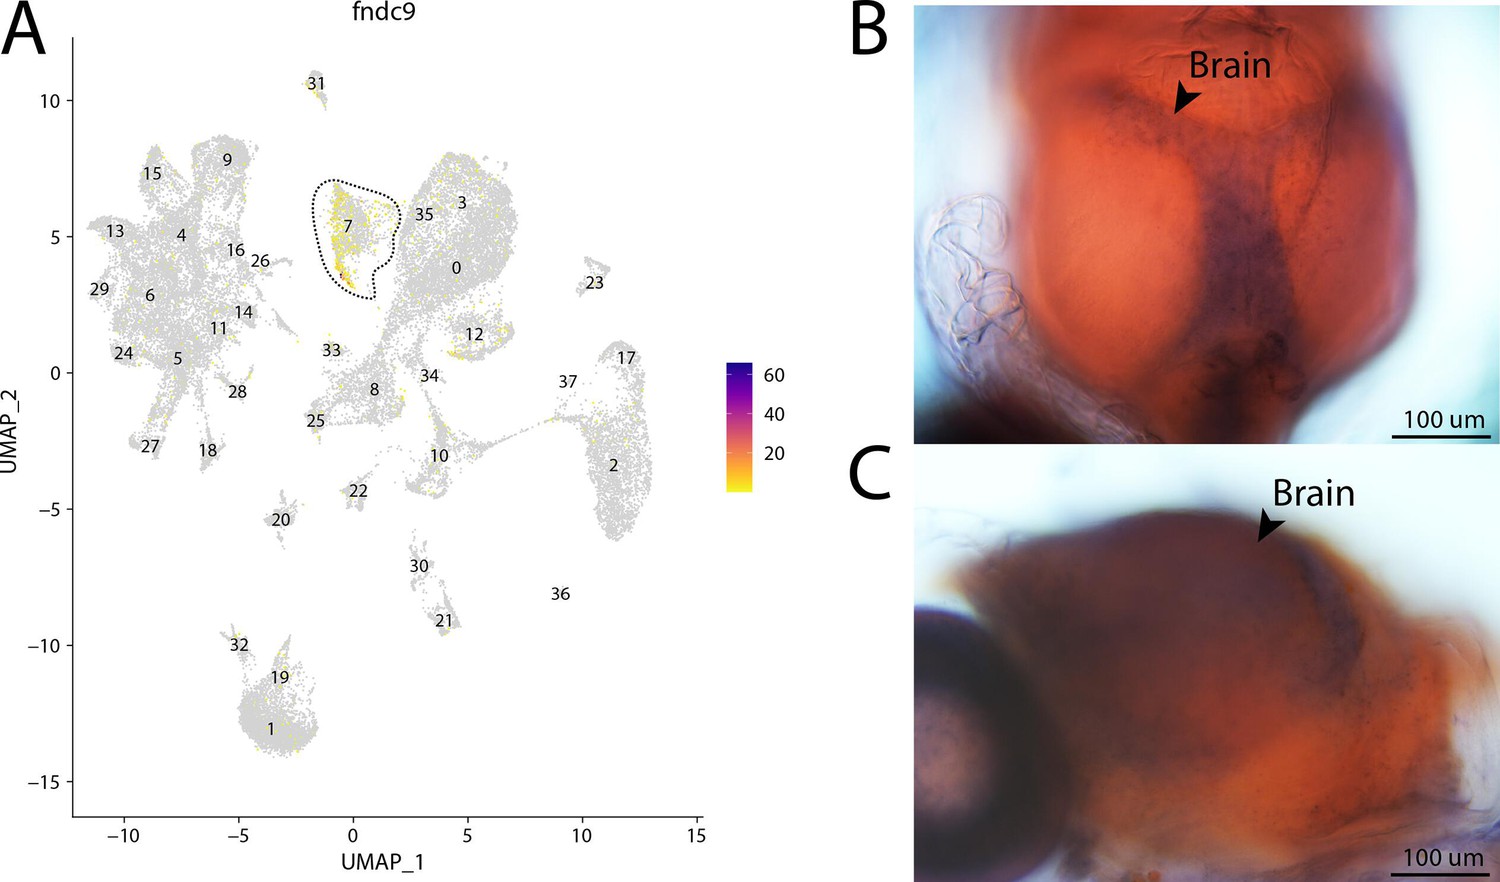
fndc9, a marker for cluster 7, is expressed in the brain of Gulf pipefish.
Expression of fndc9 is limited to cluster 7, brain cells, in the atlas (A). In situ hybridization experiments revealed brain staining of fndc9 in Gulf pipefish (B, C). One day post-spawn Gulf pipefish larvae were used for this experiment. Embryos were mounted to highlight two views of the brain staining, one dorsal (B) and one lateral (C).
Figure 2—figure supplement 65

insm1b, a marker for cluster 8, is expressed in the brain of Gulf pipefish.
Strong expression of insm1b is observed in cluster 8, brain progenitor cells, in the atlas (A). In situ hybridization experiments revealed brain staining of insm1b in Gulf pipefish (B). Five-day post-spawn Gulf pipefish larvae were used for this experiment. Embryos were mounted laterally to highlight the brain staining.
Figure 2—figure supplement 66
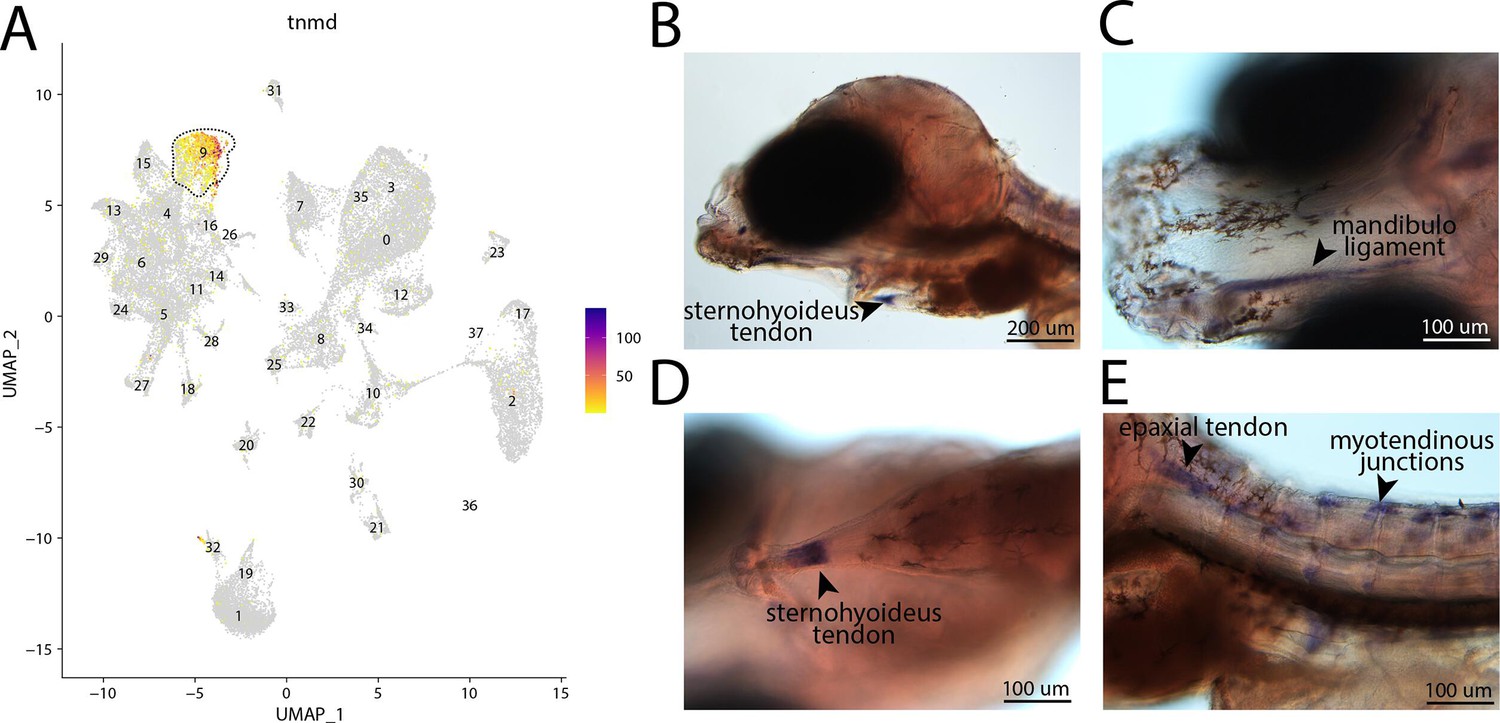
tnmd, a marker for cluster 9, is expressed in tendons and ligaments of bay pipefish.
Strong expression of tnmd is observed in cluster 9, tenocyte and ligament cells, in the atlas (A). In situ hybridization experiments revealed tendon and ligament staining of tnmd in bay pipefish (B–E). Wild-caught embryos from bay pipefish at the onset of craniofacial elongation were used for the experiment. Embryos were mounted laterally (B, E) and ventrally (C, D) to showcase tendon and ligament staining.
Figure 2—figure supplement 67
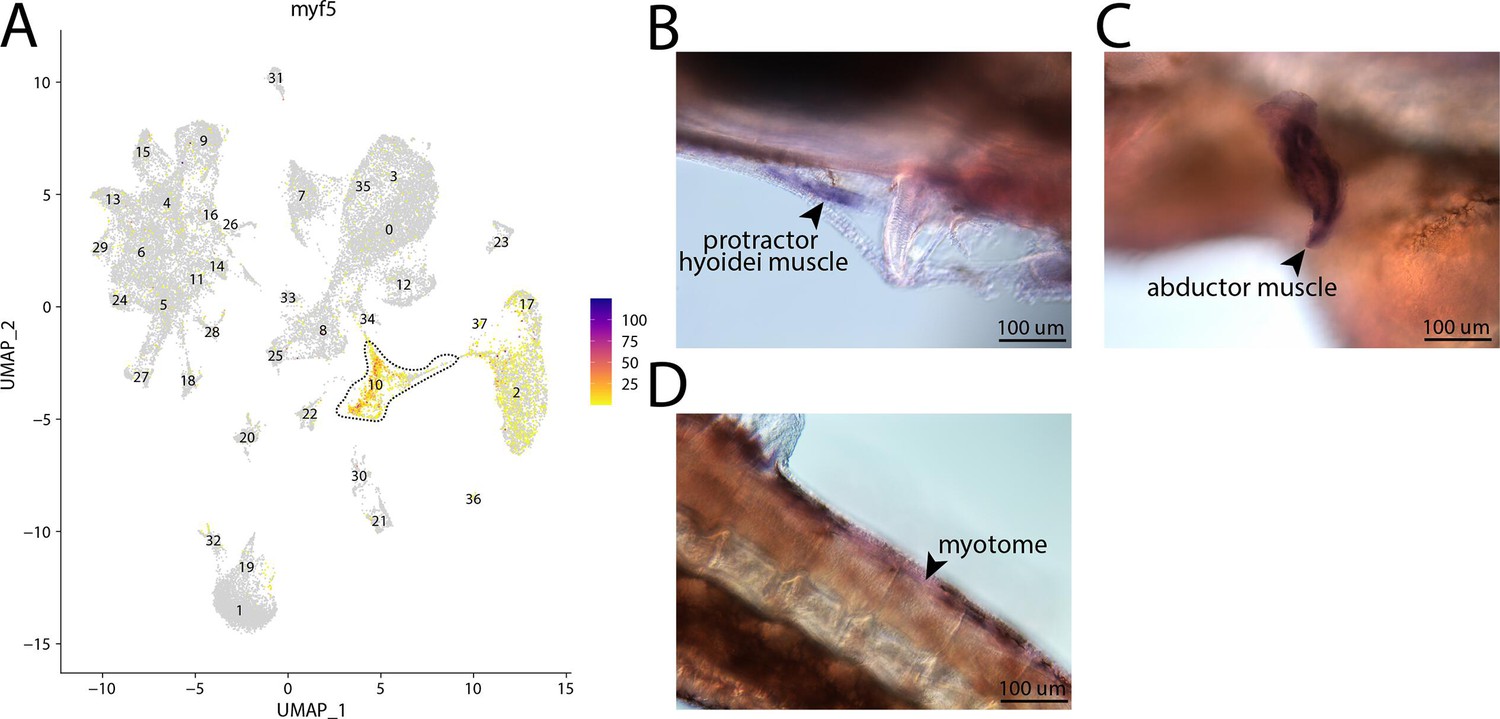
myf5, a marker for cluster 10, is expressed in the muscle of bay pipefish.
Strong expression of myf5 is observed in cluster 10, muscle progenitor cells, in the atlas (A). In situ hybridization experiments revealed muscle staining of myf5 in bay pipefish (B–D). Wild-caught embryos from bay pipefish at the onset of craniofacial elongation were used for the experiment. Embryos were mounted laterally to highlight muscle staining.
Figure 2—figure supplement 68
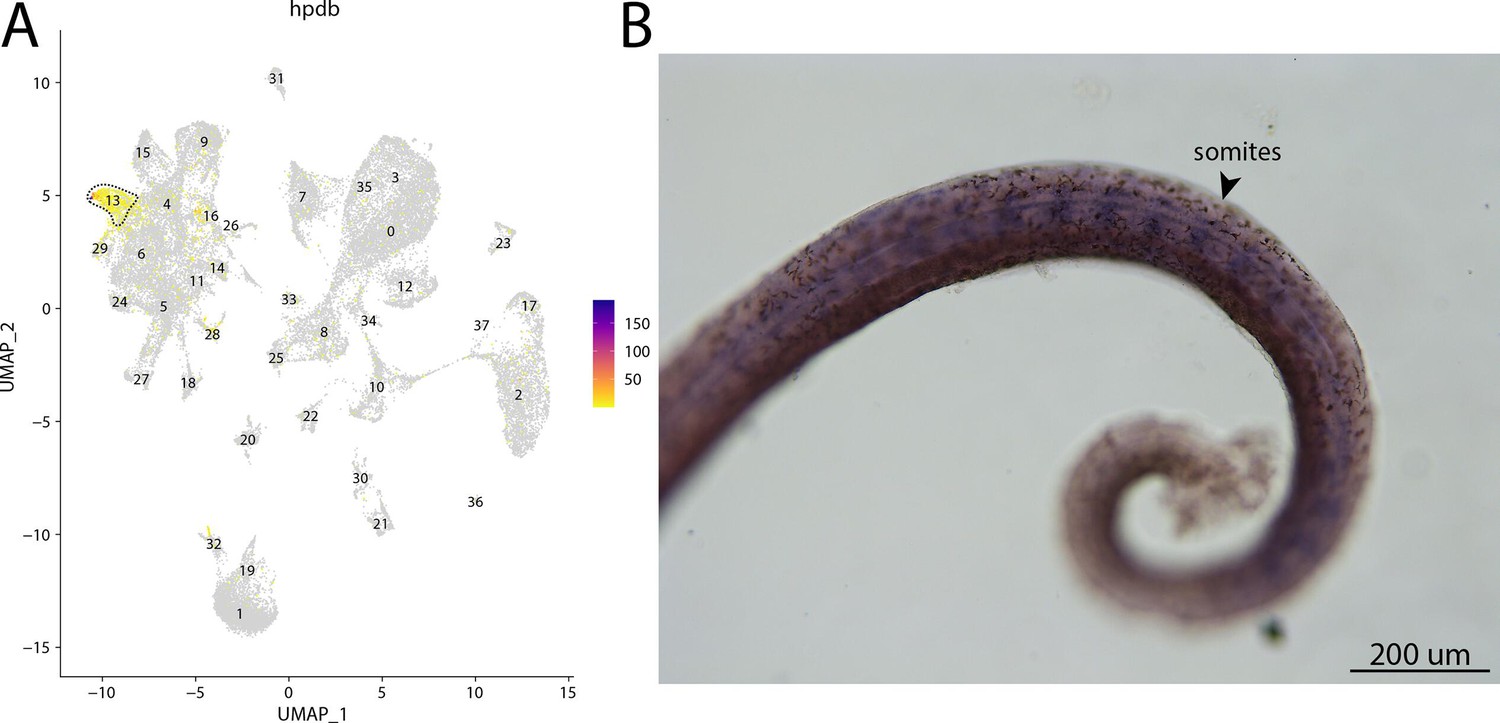
hpdb, a marker for cluster 13, is expressed in somites of bay pipefish.
Strong expression of hpbd is observed in cluster 13, fibroblasts, in the atlas (A). In situ hybridization experiments revealed somite staining of hpbd in bay pipefish (B). Wild-caught embryos from bay pipefish at the mid-somitogenesis stage were used for the experiment. Embryos were mounted laterally to highlight muscle staining.
Figure 2—figure supplement 69
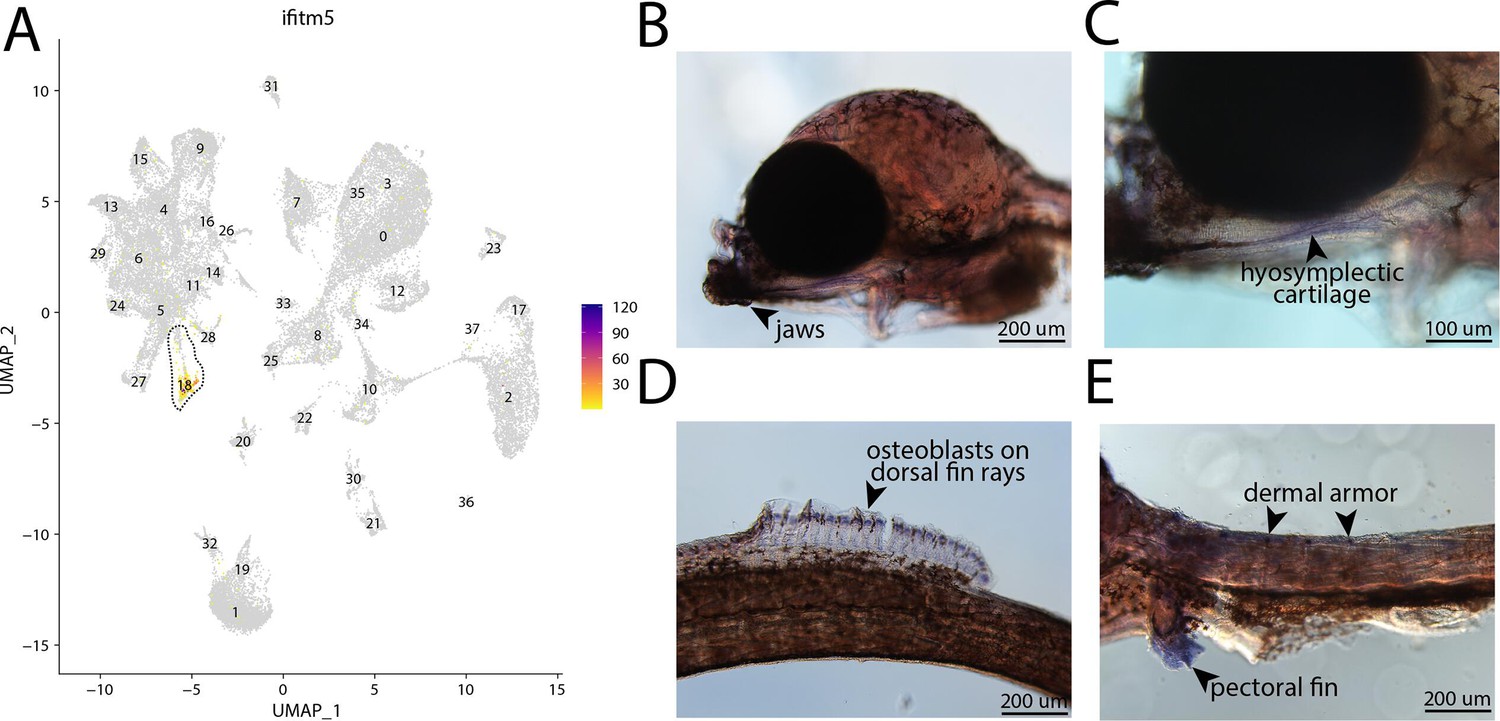
ifitm5, a marker for cluster 18, is expressed in bay pipefish osteoblasts.
Specific expression of ifitm5 is observed in cluster 18, osteoblasts, in the atlas (A). In situ hybridization experiments revealed bone staining of ifitm5 in bay pipefish (B–E). Wild-caught embryos from bay pipefish at the onset of craniofacial elongation were used for the experiment. Embryos were mounted laterally to highlight muscle staining.
Figure 2—figure supplement 70
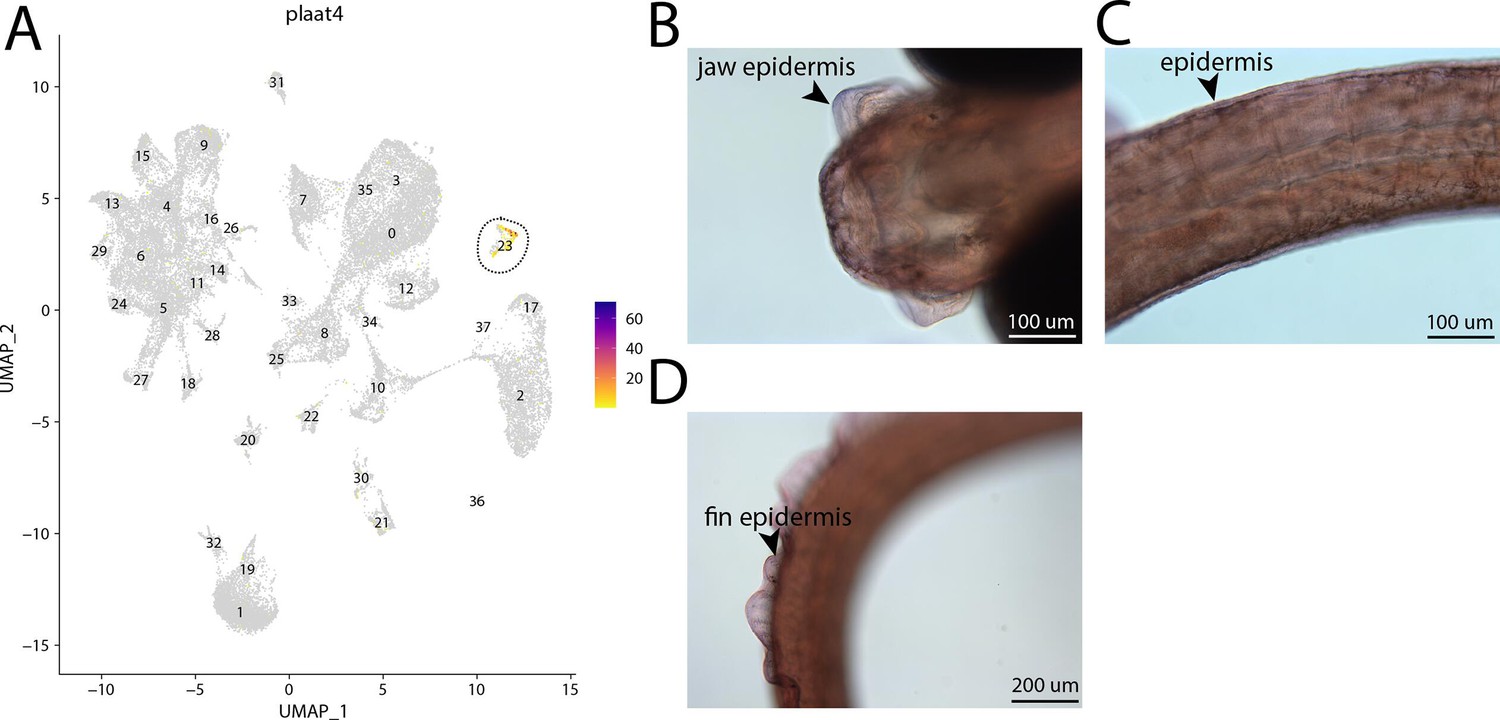
plaat4, a marker for cluster 23, is weakly expressed in bay pipefish epidermal cells.
Specific expression of plaat4 is observed in cluster 23, epidermal cells, in the atlas (A). In situ hybridization experiments revealed epidermal staining of plaat4 in bay pipefish (B–D). Wild caught embryos from bay pipefish at the onset of craniofacial elongation were used for the experiment. Embryos were mounted ventrally (B) and laterally (C, D) to highlight epidermal staining.
Figure 2—figure supplement 71
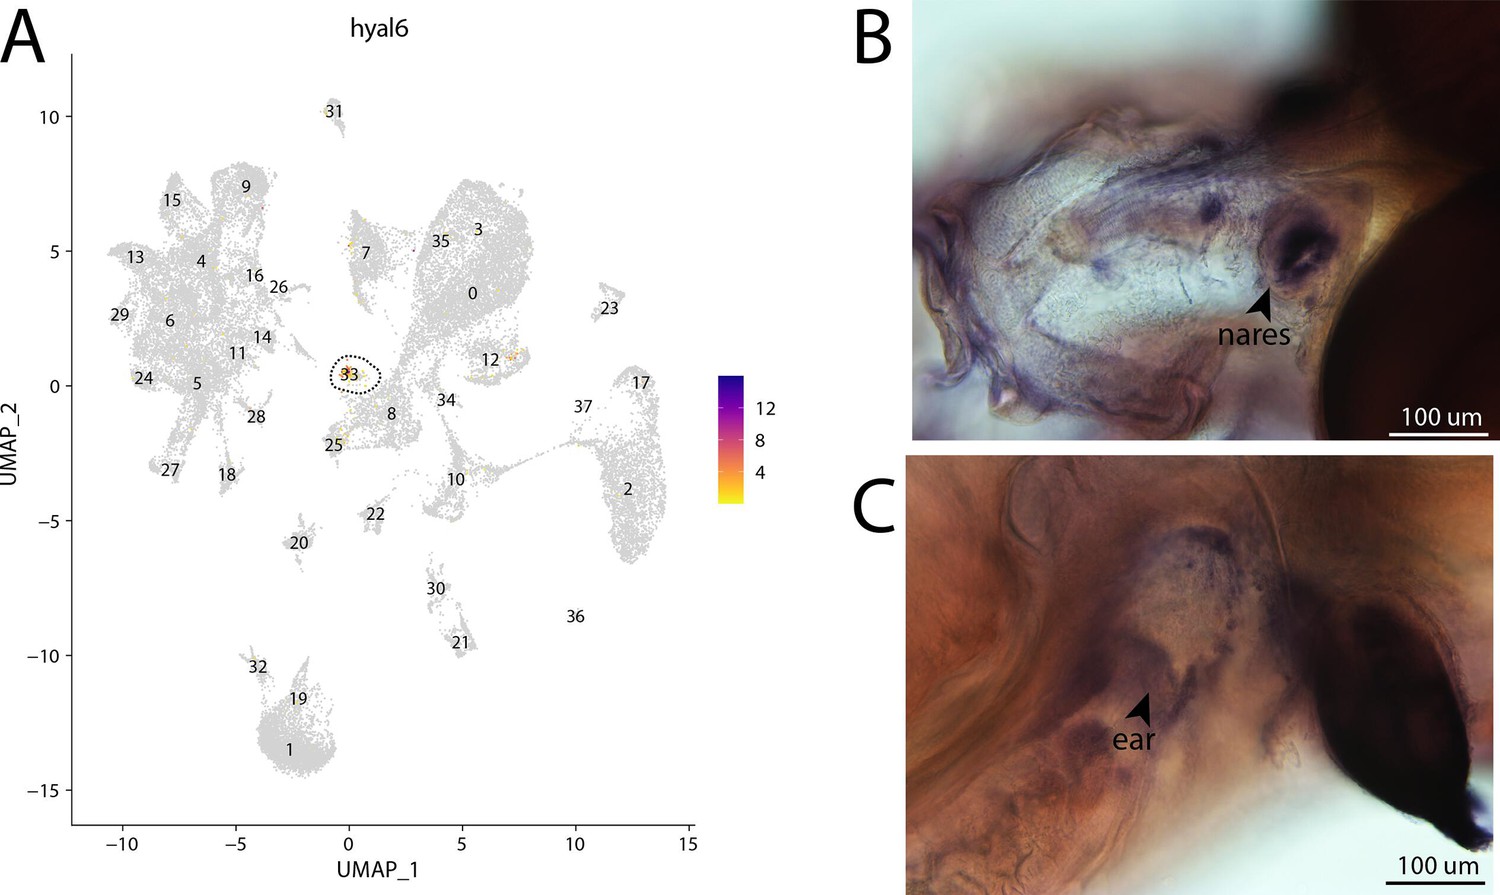
hyal6, a marker for cluster 33, is strongly expressed in bay pipefish hair cells.
Specific expression of hyal6 is observed in cluster 33, hair cells, in the atlas (A). In situ hybridization experiments revealed staining of hyal6 in bay pipefish nares and ears (B, C). Wild-caught embryos from bay pipefish from 1 d post spawn larvae were used for the experiment. Embryos were mounted dorsally (B) and laterally (C) to highlight staining in nares and ears, respectively.
Figure 2—figure supplement 72
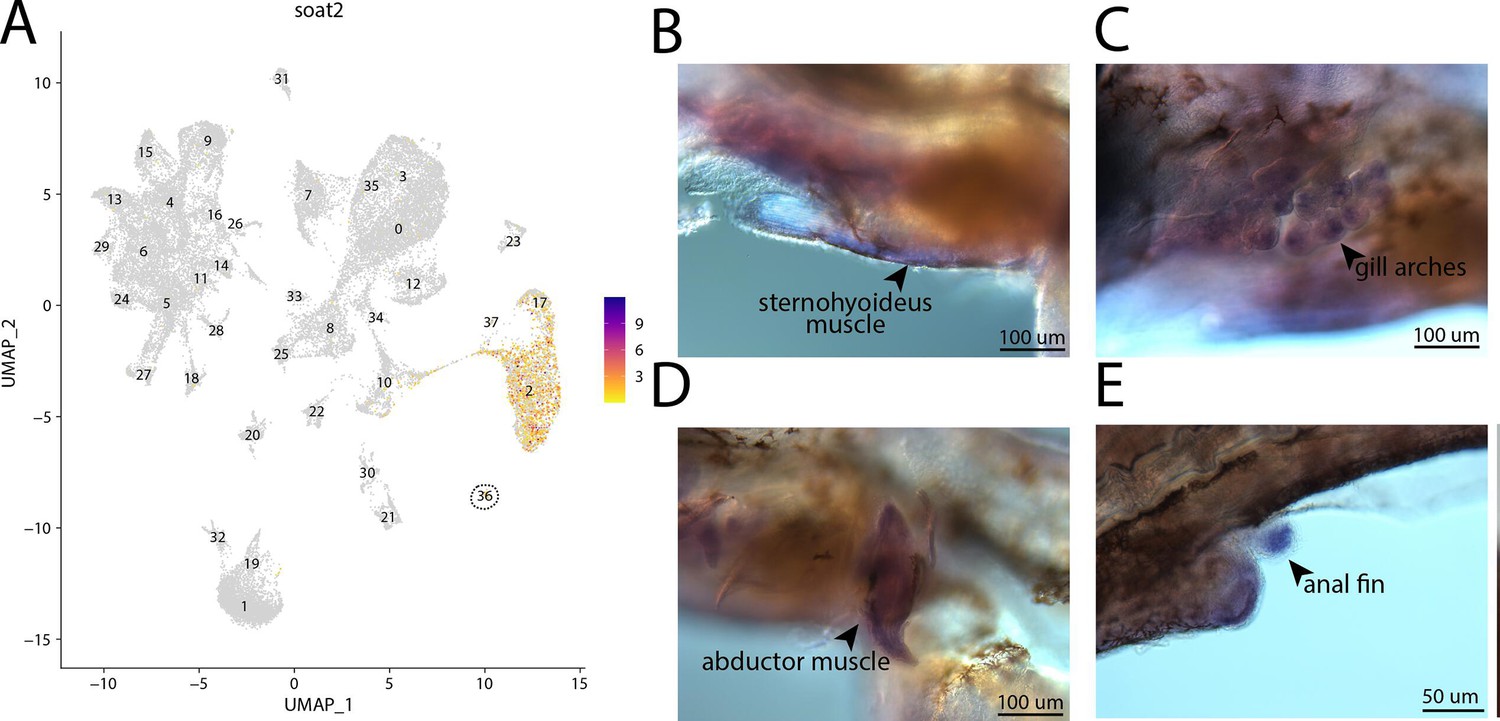
soat2, a marker for cluster 36, is strongly expressed in bay pipefish muscle cells.
Expression of soat2 is observed in cluster 36, muscle cells, in the atlas (A). In situ hybridization experiments revealed staining of soat2 in bay pipefish muscle and fins (B–E). Wild-caught embryos from bay pipefish at the onset of craniofacial elongation were used for the experiment. Embryos were mounted laterally to highlight staining in muscle and fin.
Figure 2—figure supplement 73
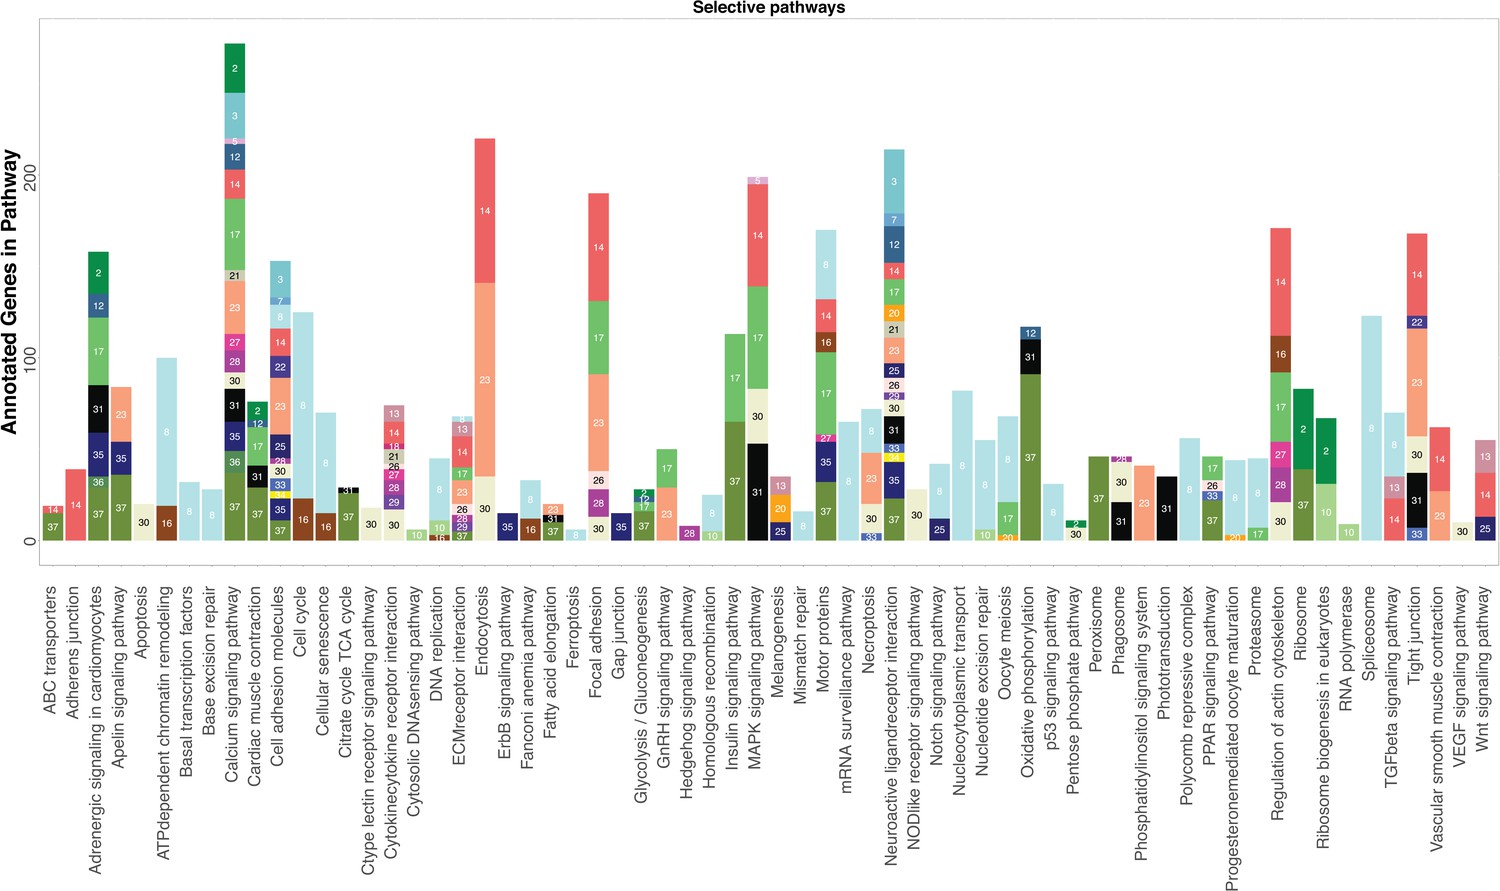
KEGG analysis reveals pathways significantly enriched in cell clusters.
KEGG pathways are listed on the x-axis. For each cluster, the number of genes that belong to the specific KEGG pathway is represented by the height of each bar. Cell clusters are labeled by both color and their designated number. For clarity, only cell clusters with more than three annotated genes in each pathway are shown and certain pathways involving infection and metabolism are removed.
Figure 2—figure supplement 74
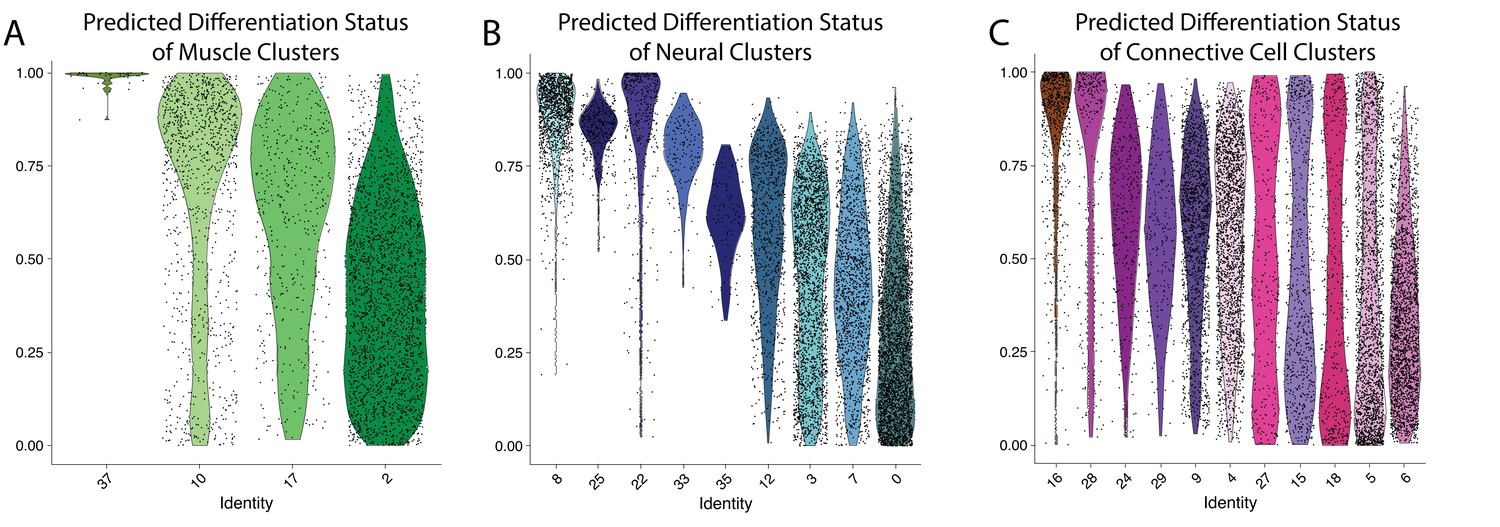
Clusters 8,10, and 16 are composed of largely undifferentiated cells.
Differentiation state of cell clusters was measured using CytoTRACE, where an output of 1 indicates an undifferentiated cell and a value of 0 suggests a cell is fully differentiated. Cells are plotted on a violin plot with individual cell predictions shown as dots. Panels show results from muscle (A), neural (B), and connective (C) clusters.
Figure 3 with 2 supplements
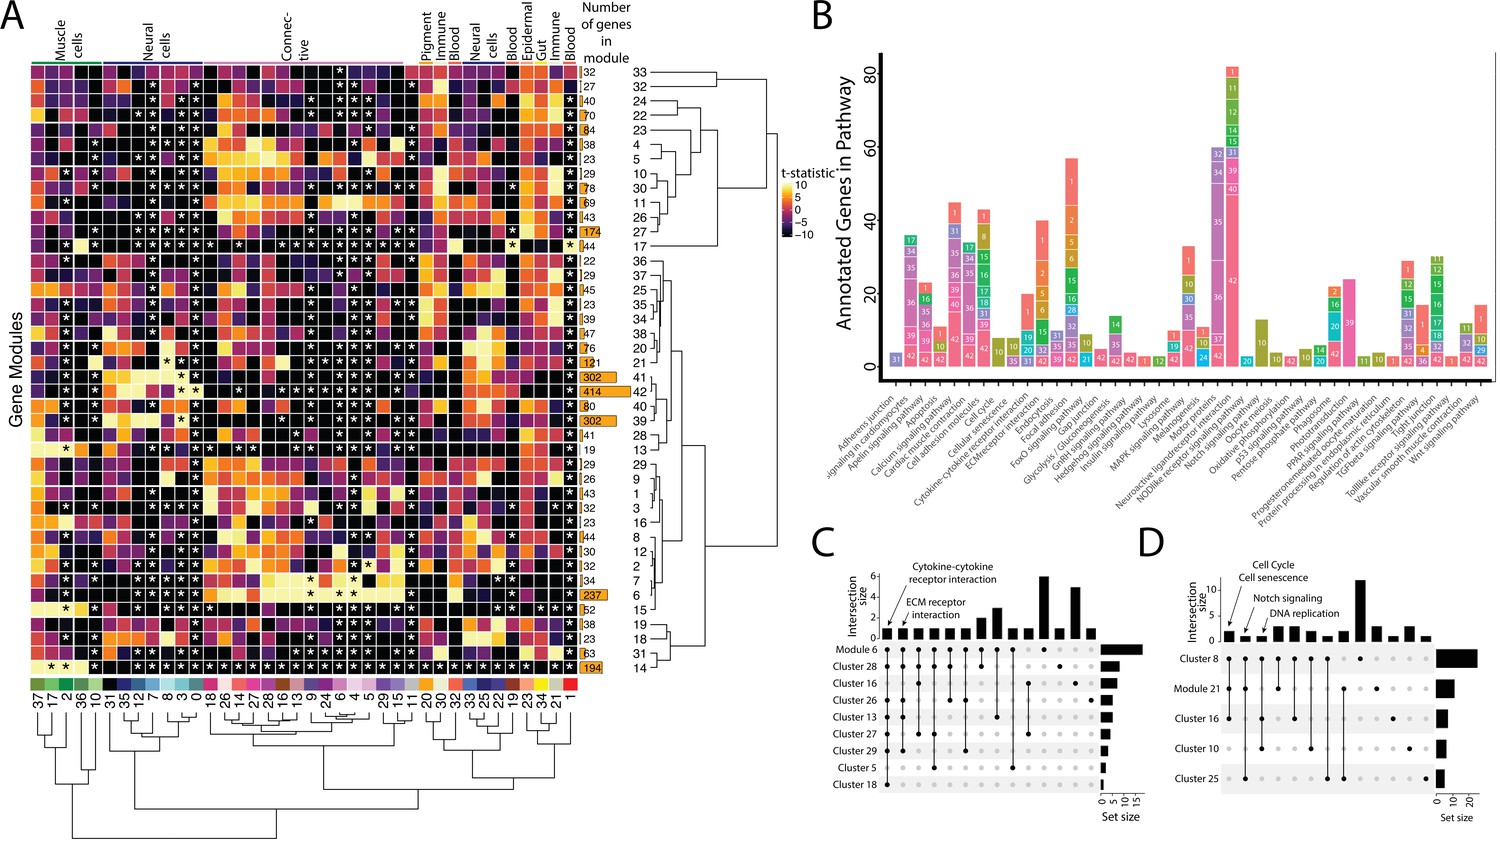
Weighted Gene Network Analysis (WGCNA) identifies gene modules that define and unite cell clusters.
(A) The strength of association between the gene modules and cell clusters is shown in panel A with dendrogram clustering illustrating the distance between modules and cell clusters. Gene modules are represented by rows and cell clusters by columns. The modules and clusters are clustered using the Pearson distance method. The number of genes in each gene module are shown in the right-hand bar plots. Cell clusters are colored based on their identity. The asterisks indicate the module-cluster relationships that have a p-value less than 0.05 from a two-sided permutation test after correction for multiple tests (false discovery rate, FDR). The heatmap is colored by t-statistics in a range of –10 to 10, with highly positive values in yellow and highly negative values in black. (B) The identified gene modules possess genes from KEGG pathways. The bars are labeled with the gene module and the size of each bar corresponds to the number of genes from the KEGG pathway in the module. Since WGCNA modules do not have p-values, only KEGG pathways with more than two genes included in the gene module are shown on the plot. (C) Identified gene modules contain similar KEGG pathways as the cell clusters that correlated with them. These relationships are shown in Upset plots where each row is a cell cluster or gene module, each column represents KEGG pathways shared by the modules and clusters (shared condition is shown filled in black dots connected by lines), the interaction size is the number of pathways in common between the set of modules and clusters, and the set size is the number of pathways that are enriched in each cluster and module. Panel C1 highlights that 'cytokine-cytokine receptor interaction' and 'ECM receptor interaction' are present in module 6 as well as 6 and 4 connective cell clusters, respectively. Panel C2 shows that 'cell cycle' and ’senescence' are present in module 21 as well as clusters 8 and 16, 'Notch signaling' genes are present in clusters 8 and 25 as well as module 21, and 'DNA replication' is present in clusters 8, 10, and 16.
Figure 3—figure supplement 1
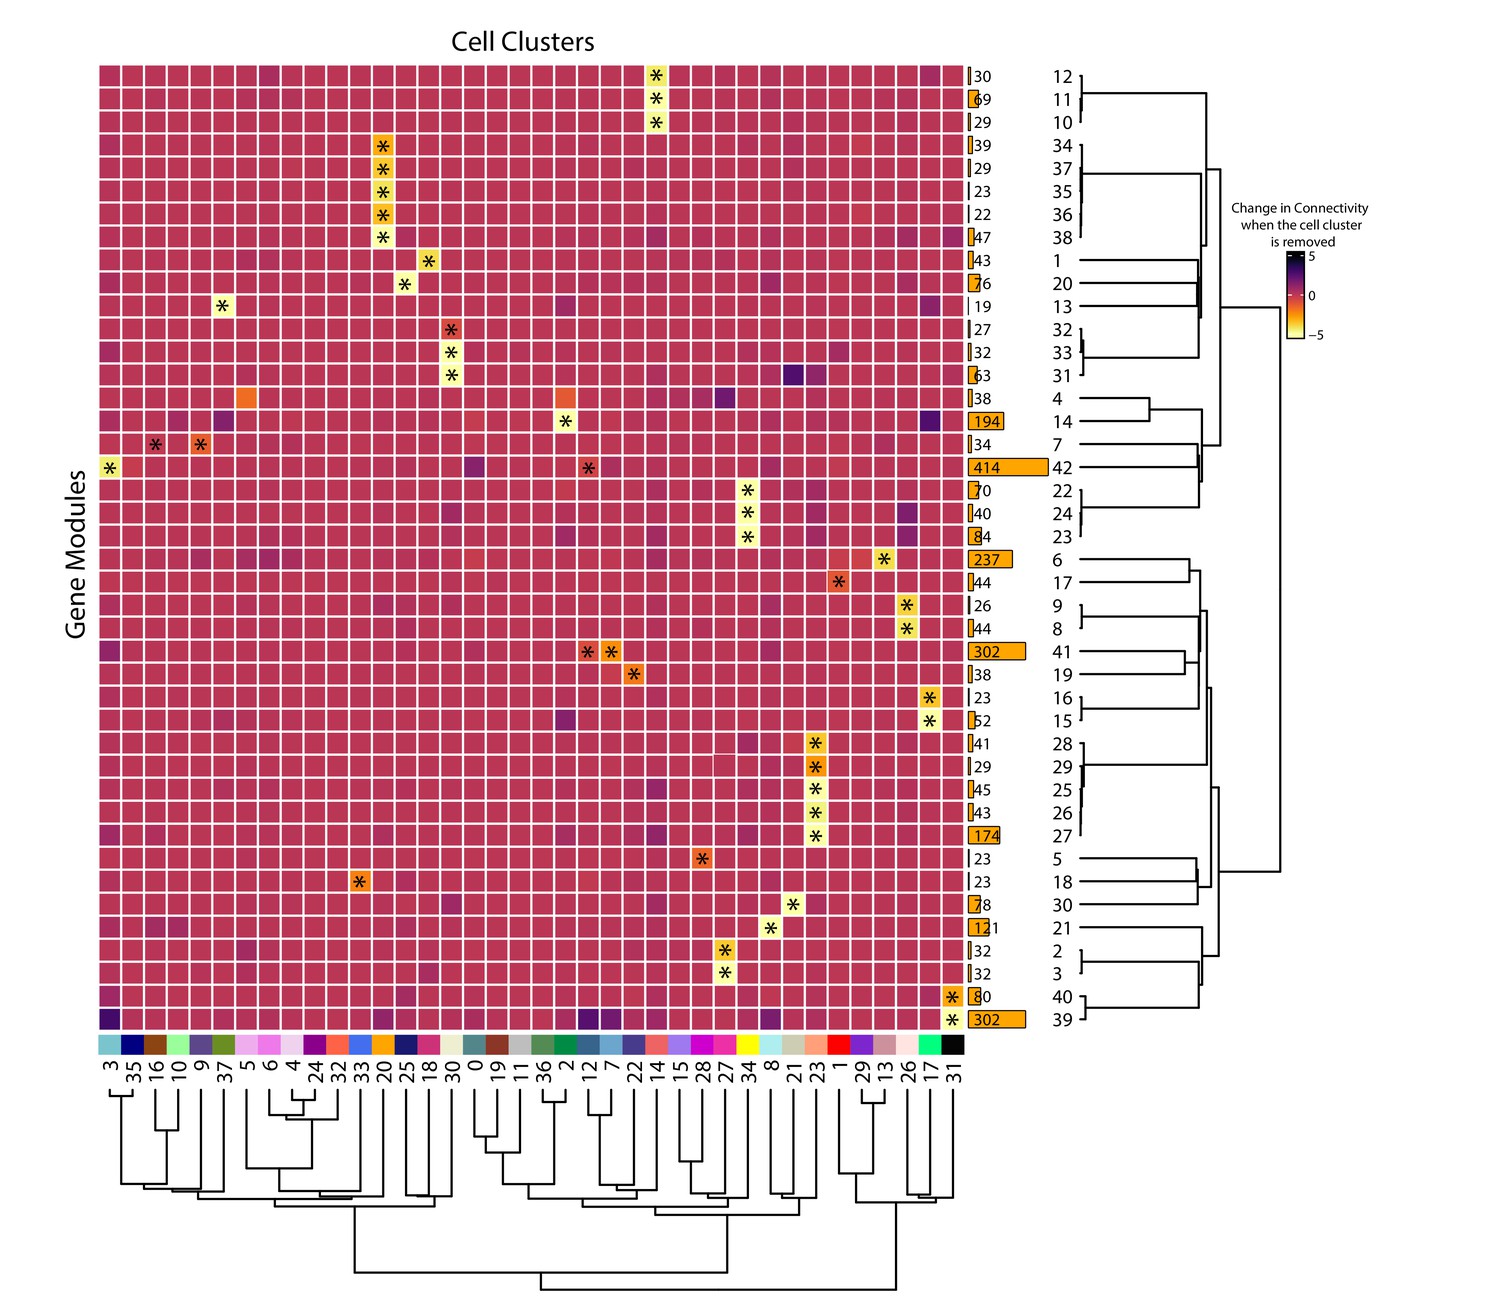
Cell clusters drive gene module connectivity.
The heatmap shows the change in gene network connectivity when individual cell clusters are removed. Cell clusters are in the columns and gene modules are in rows. The coloration scale is based on the change in connectivity when a cell cluster is removed, with yellow indicating a large change in connectivity. The modules and clusters are clustered using the Pearson distance method. Asterisks indicate cluster-module pairs that are significant using a one-way permutation test and false discovery rate (FDR) correction. The size of the gene modules are shown to the right.
Figure 3—figure supplement 2
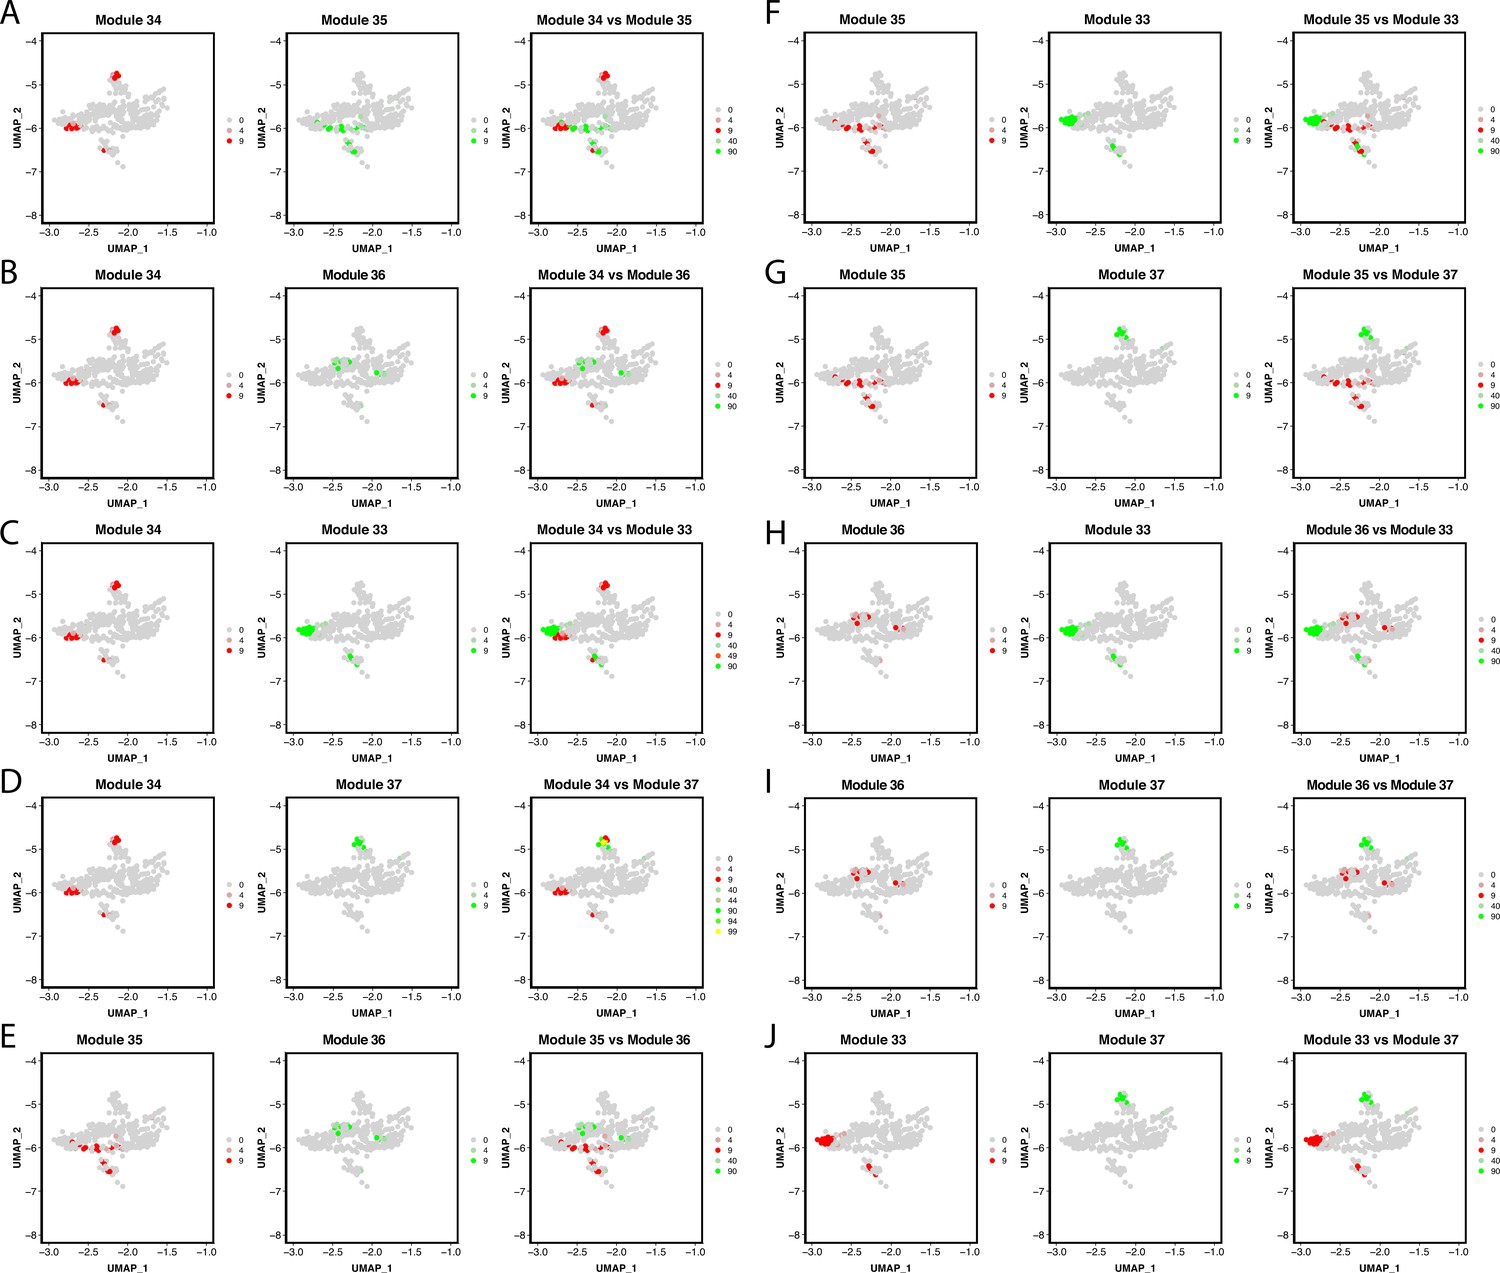
Gene module expression comparison with the Pigment Cluster reveals potential elusive cell types within the cluster.
Genes within the network are combined into one feature and then plotted on a feature plot. In this case, UMAP dimensions one and two are the x and y-axis accordingly, dots represent each pigment cell, and the color of the dots represents the expression of the module. Cells that express gene modules are either colored red or green (when modules are plotted on separate plots). When plotted on the same plot, cells that express both gene modules are yellow. A through J show each gene module comparison.
Figure 4 with 4 supplements
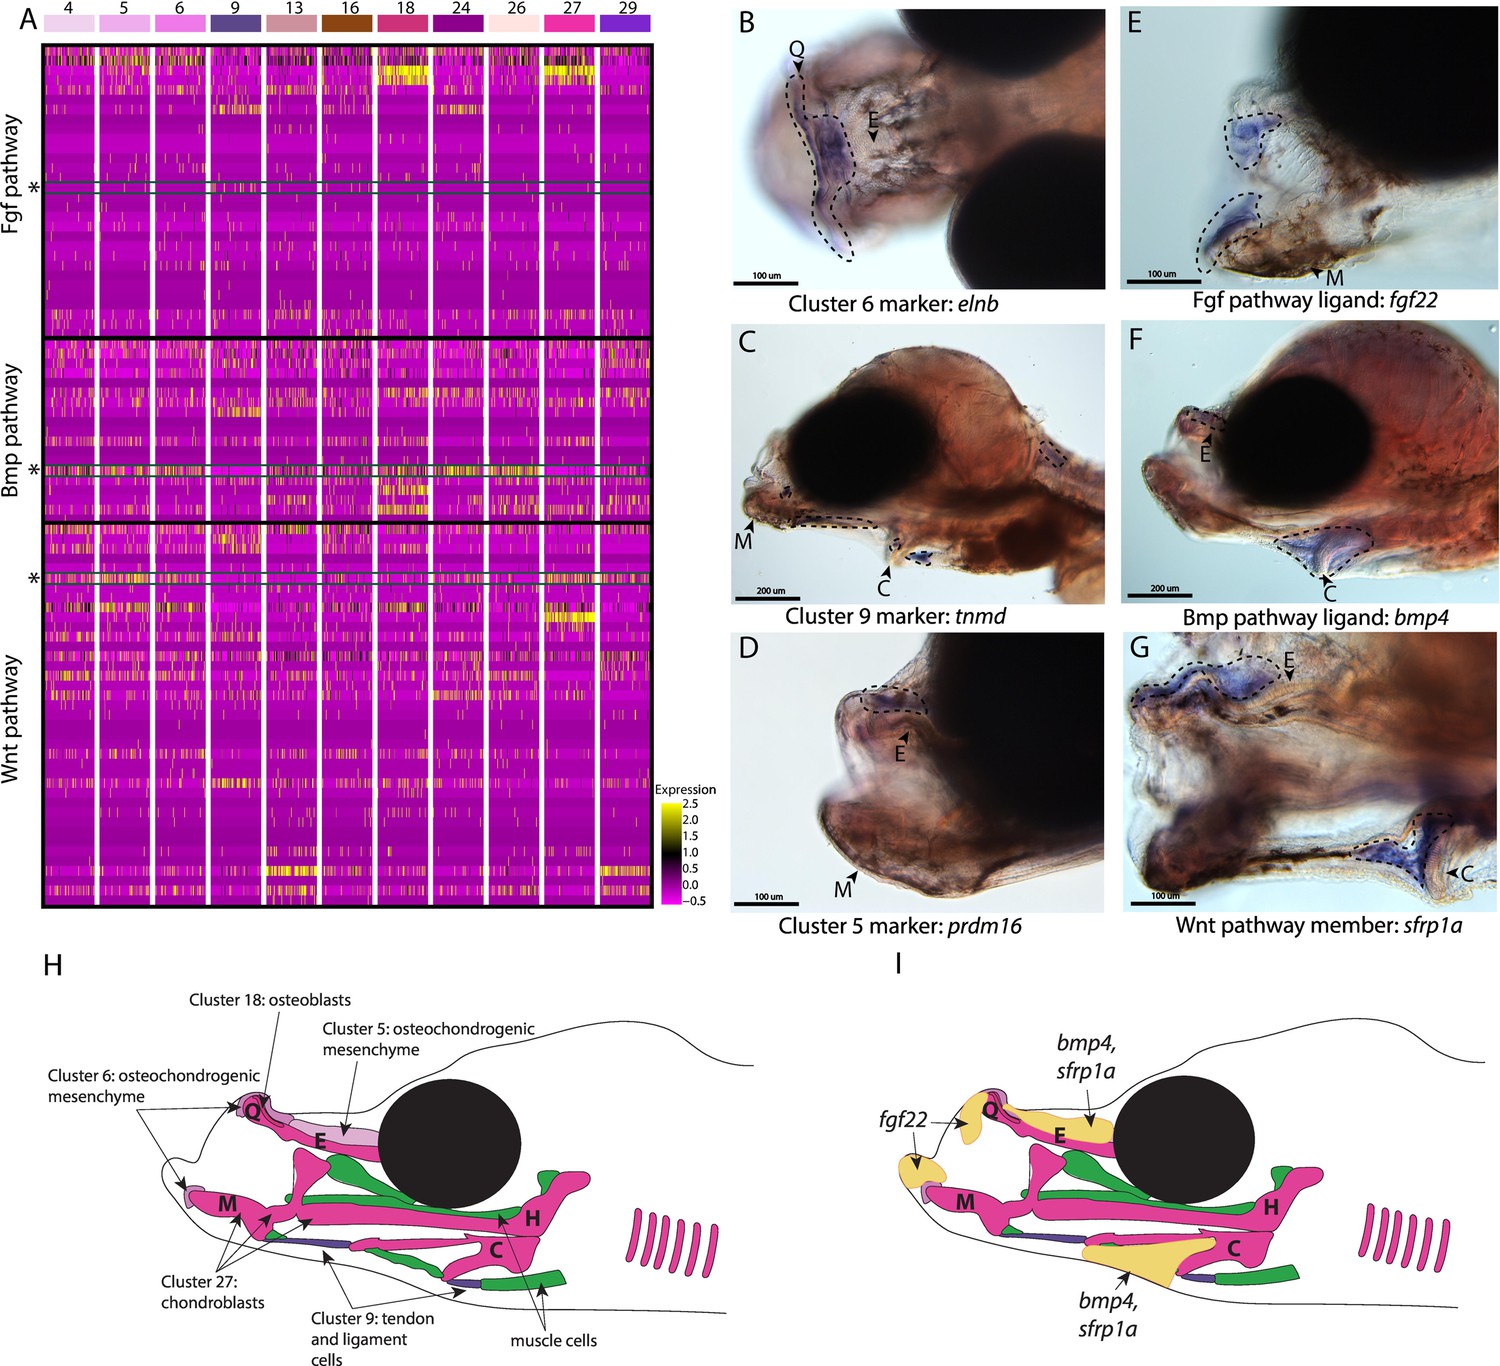
Conserved cell types and gene pathways build unique faces of syngnathids.
Three main conserved signaling pathways are enriched in connective cell types, MAPK signaling (including Fgf signaling), TGF-beta signaling (including Bmp signaling), and Wnt signaling. Receptors and ligands expression patterns are shown in A heatmap from all cell types with cells present in the head. This heatmap features 100 cells downsampled from each cluster and illustrates that many genes from these families are expressed in these cells. Yellow lines indicate high expression of a gene, while hot pink lines indicate no expression. The pathways are boxed in black. Rows representing fgf22, bmp4, and sfrp1a expression are marked with an asterisk and green box for each respective section of signaling (Fgf, Bmp, and Wnt). Panels B, C, and D are in situ hybridizations of three marker genes, elnb, tnmd, and prdm16. The genes prdm16 and elnb mark osteochondrogenic mesenchyme and tnmd marks tendons and ligaments. Panels E, F, and G, show expression patterns of three pathway representatives fgf22, bmp4, and sfrp1a. All three genes are expressed in the face: fgf22 at the tip of the mandible and bmp4 and sfrp1a above the ethmoid and near the ceratohyal. Staining is circled with dashed lines. The Meckel’s cartilage (M), (mes)Ethmoid cartilage (E), Quadrate (Q), and Ceratohyal (C) are labeled. Panel C is a dorsal view. Panels B, C, E, F, G, H, I are in lateral view. In situ experiments of fgf22 were completed using 10dpf Gulf pipefish. In situ experiments of bmp4, sfrp1a, tnmd, elnb, and prdm16 were completed using wild-caught bay pipefish at the onset of craniofacial elongation. Panels H and I are summary illustrations of our findings, H shows where cells from various clusters were present in the developing head, and I illustrates where bmp4, sfrp1a, and fgf22 were expressed. Panel H is colored according to cell type.
Figure 4—figure supplement 1
Conserved fin prdm16 expression domains in stickleback and pipefish, but fishes have an expression in different regions of the head.
The gene prdm16 expression was probed using in situ hybridization. Embryos used in this assay were similarly staged (9dpf in threespine stickleback and mid-craniofacial elongation in bay pipefish). Stickleback (A–C) expressed prdm16 in the lower jaw, brain, gill arches, and fins. Bay pipefish also have fin staining (F), but craniofacial expression is limited to the mesenchyme above the ethmoid region.
Figure 4—figure supplement 2
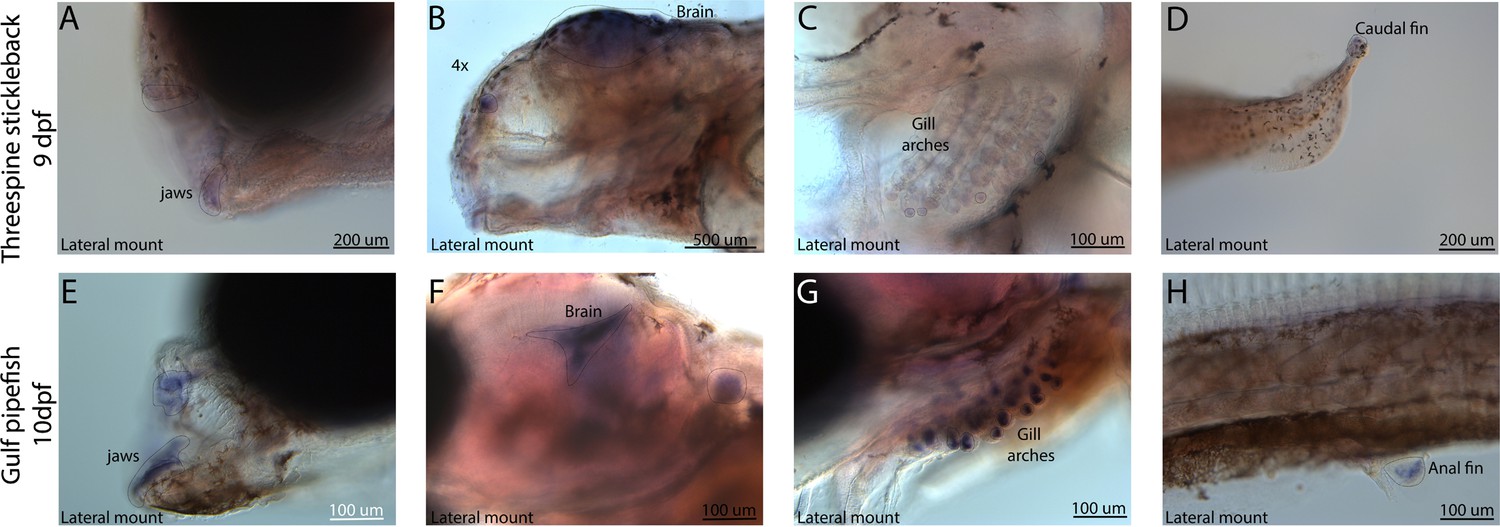
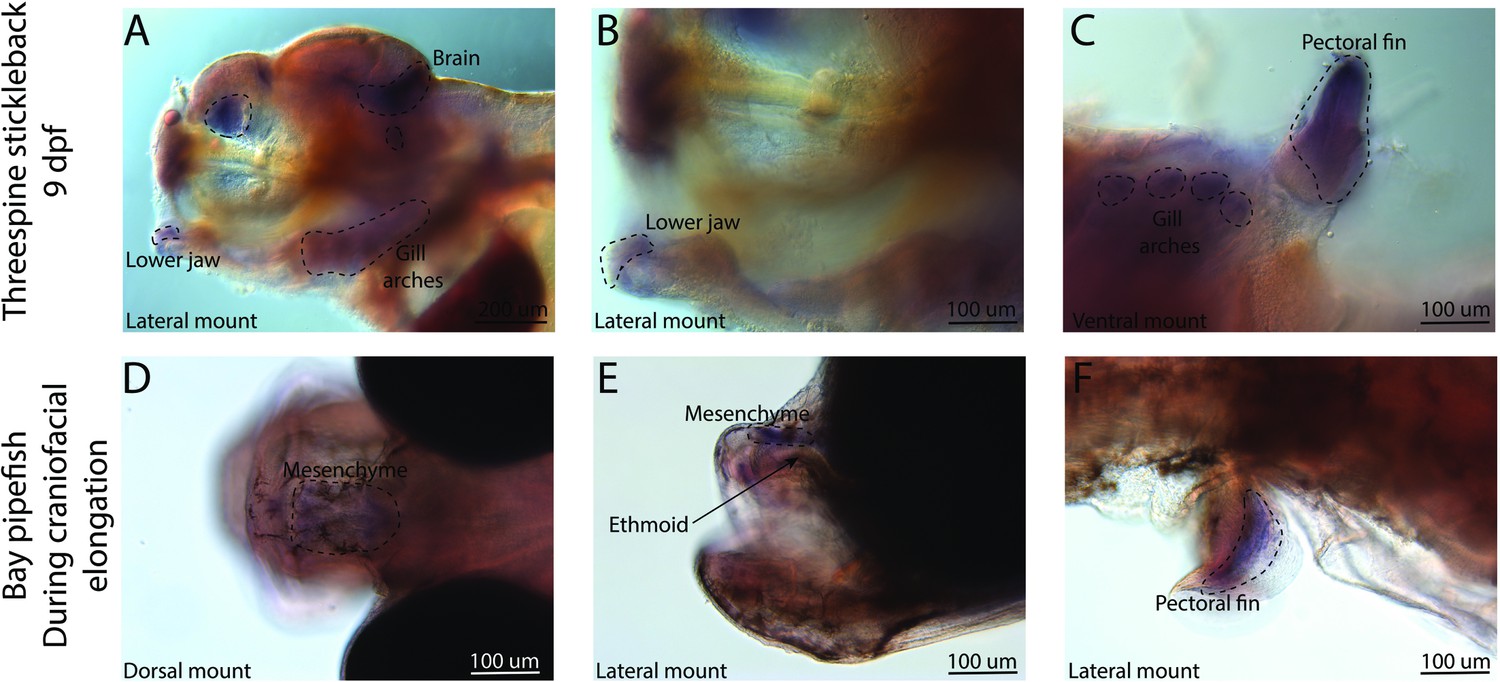
Conserved expression domains of fgf22 in pipefish and stickleback fish.
Expression of fgf22 was probed using in situ hybridization. Embryos used in this assay were similarly staged (9dpf threespine stickleback and 10dpf Gulf pipefish). Staining in the jaws (A, E), brain (B, F), gill arches (C, G), and fins (D, H) suggest similar fgf22 expression domains in both species.
Figure 4—figure supplement 3
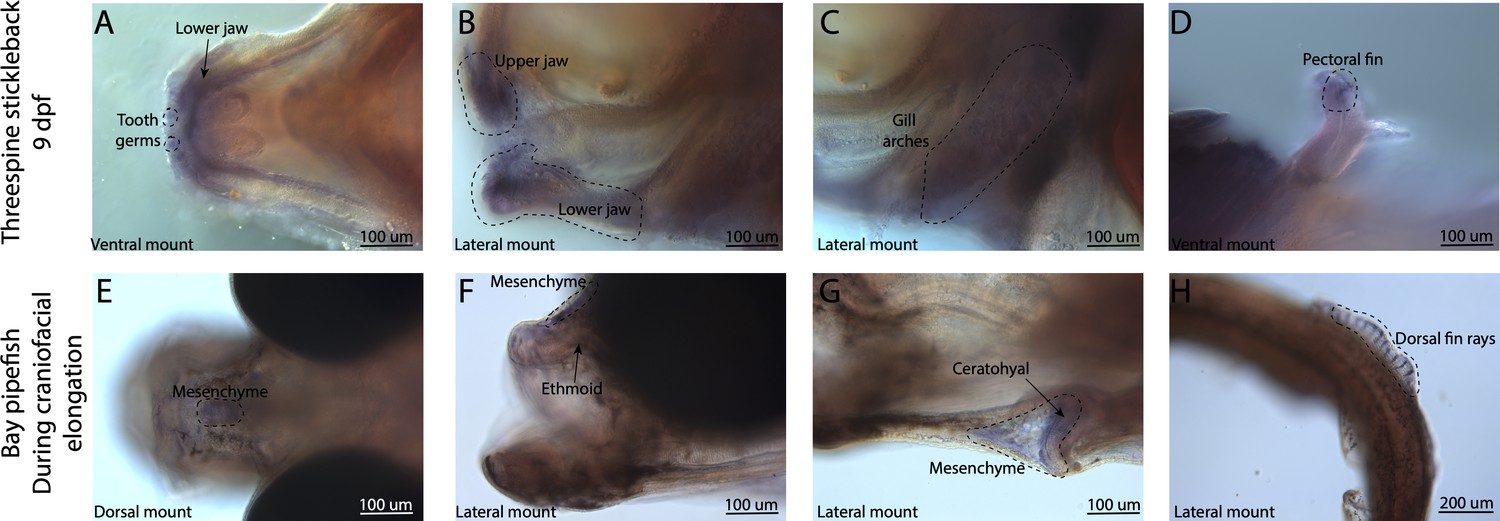
Broad bmp4 craniofacial expression in stickleback, but bmp4 is restricted to ethmoid and ceratohyal regions in pipefish.
Expression of bmp4 was probed using in situ hybridization. Embryos used in this assay were similarly staged (9dpf threespine stickleback and mid-craniofacial elongation staged bay pipefish). Stickleback has bmp4 staining in tooth germs (A), the jaws (A, B), and gill arches (C). However, bmp4 expression is restricted in bay pipefish to mesenchyme above the ethmoid and ceratohyal.
Figure 4—figure supplement 4

sfrp1a has conserved fin expression in pipefish and stickleback, but craniofacial expression differs between the species.
Expression of sfrp1a was probed using in situ hybridization. Embryos used in this assay were similarly staged (9dpf threespine stickleback and mid-craniofacial elongation staged bay pipefish). Both species had sfrp1a staining in the fins (D, H). However, sticklebacks have broad craniofacial expression in lower jaws, A, B, and gill arches, (C) while expression is limited to mesenchyme above the ethmoid (E), the jaw joint (F), and around the ceratohyal (G) in bay pipefish.
Figure 5 with 1 supplement
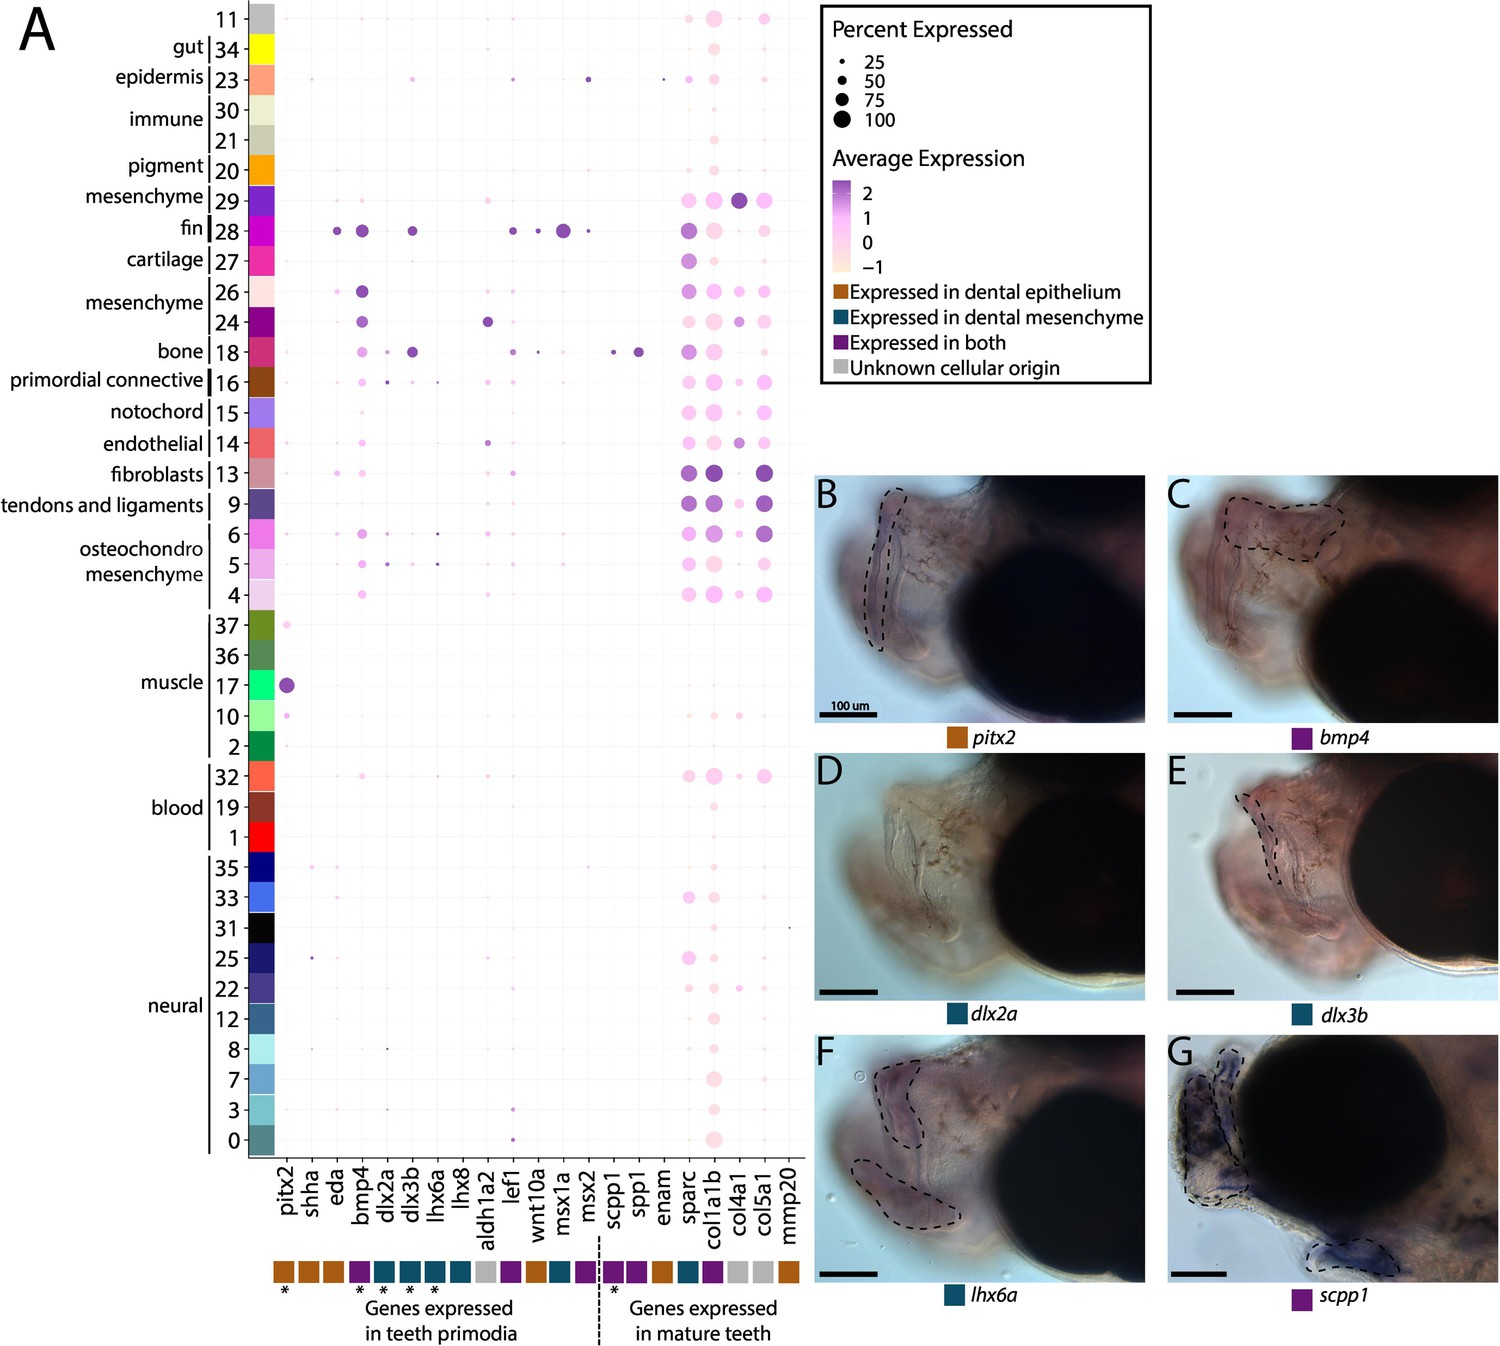
Pipefish do not possess identifiable tooth primordium cells, but continue to express tooth development genes in other contexts.
Panel A presents a dot-plot of genes classified by the tissue layer in which they are reported to be expressed during tooth development in other vertebrates (Tucker and Sharpe, 2004; Gibert et al., 2019; Kawasaki, 2009). The x-axis contains the assayed genes, with asterisks under the genes that were also examined with in situ hybridizations. The y-axis contains all the cell clusters. The size of the dot is representative of the percentage of cells from the cluster that express the gene. The color of the dots is an average expression of the gene in the cluster (darker purples represent higher expression). Panel B includes in situ hybridizations of selected tooth primordia markers (bmp4, pitx2, lhx6a, dlx2a, and dlx3b) and mature tooth markers (scpp1). In situ experiments of bmp4, pitx2, lhx6a, dlx2a, and dlx3b were completed with wild-caught bay pipefish that had begun craniofacial elongation. In situ experiments of scpp1 were completed using 9dpf Gulf pipefish. The scale bars for all images represent 100 µm.
Figure 5—figure supplement 1
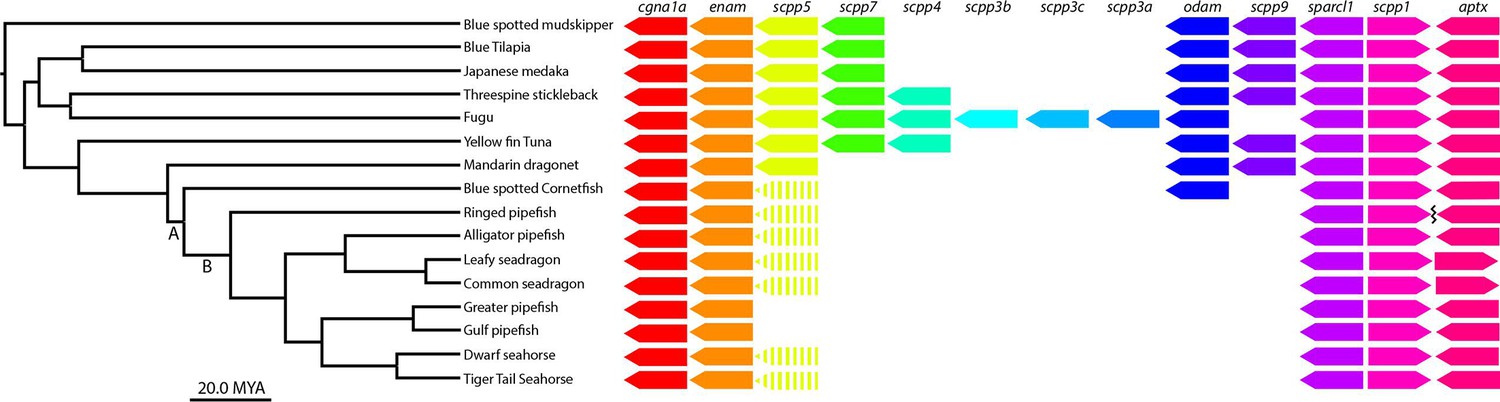
scpp gene cluster analysis identifies most scpp losses are not unique to syngnathids.
(A) Denotes the Syngnathoidei lineage which contains syngnathids and blue spotted cornetfish (among other fish) to highlight that this clade contains various tooth alterations. Syngnathids lack teeth completely and cornetfish have small teeth limited to the lower jaw. (B) Denotes solely the syngnathid clade, which completely lacks teeth. The phylogenetic tree was time-calibrated using Hughes et al., 2018 and Stiller et al., 2022. Gene presence is indicated by arrows, dashed arrows denote psuedogenes, and the squiggle shows a gap.
Figure 6
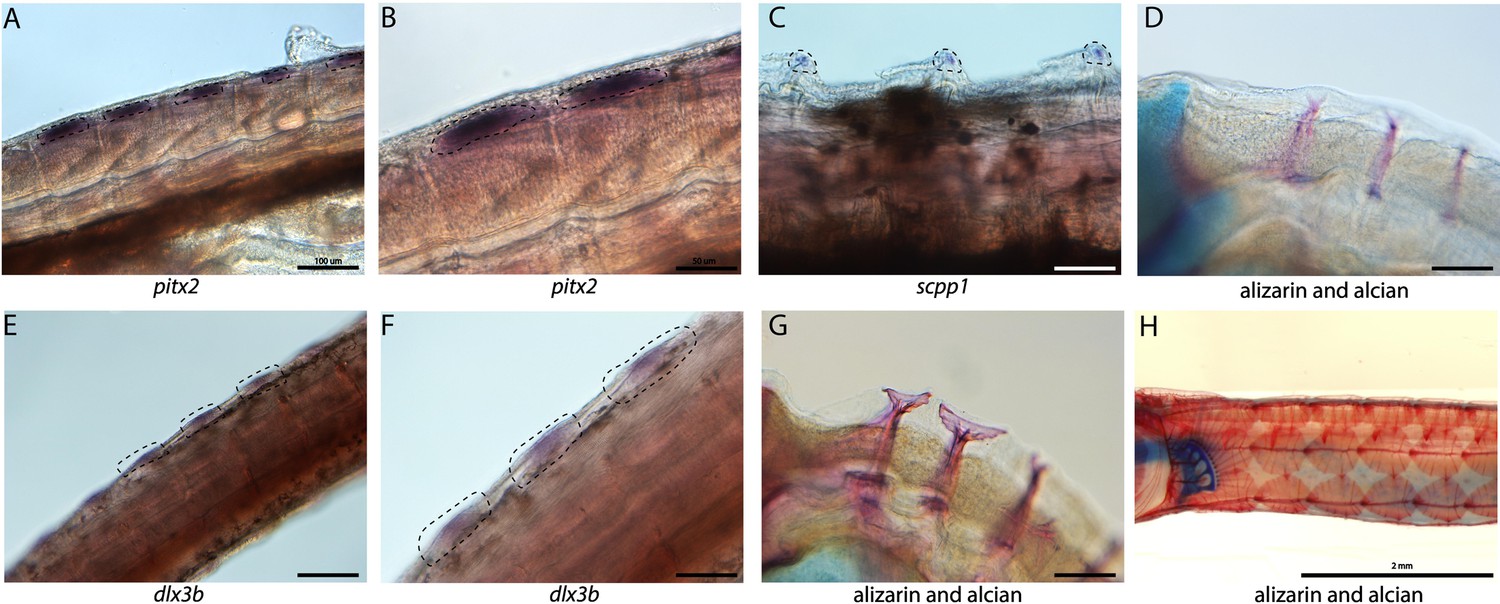
Tooth and bone development genes expressed during exoskeleton development.
We discovered pitx2 (A, B) and dlx3b (F, E) expression during the possible emergence of exoskeletal primordium in wild-caught bay pipefish. The embryos used for these in situ experiments were in the same stage as those from Figure 5, at the beginning of craniofacial elongation. A, E have 100 µm scale bars, B, F have 50 µm scale bars. We further found scpp1 is expressed at the mineralization front of the exoskeleton in 12dpf Gulf pipefish (C) and has a 50 µm scale bar. Alizarin and alcian-stained pipefish are shown in panels D (12dpf Gulf pipefish), G (1dpf Gulf pipefish), and H (adult Gulf pipefish) to illustrate how the exoskeleton forms. D, G have 100 µm scale bars.
Figure 7 with 1 supplement
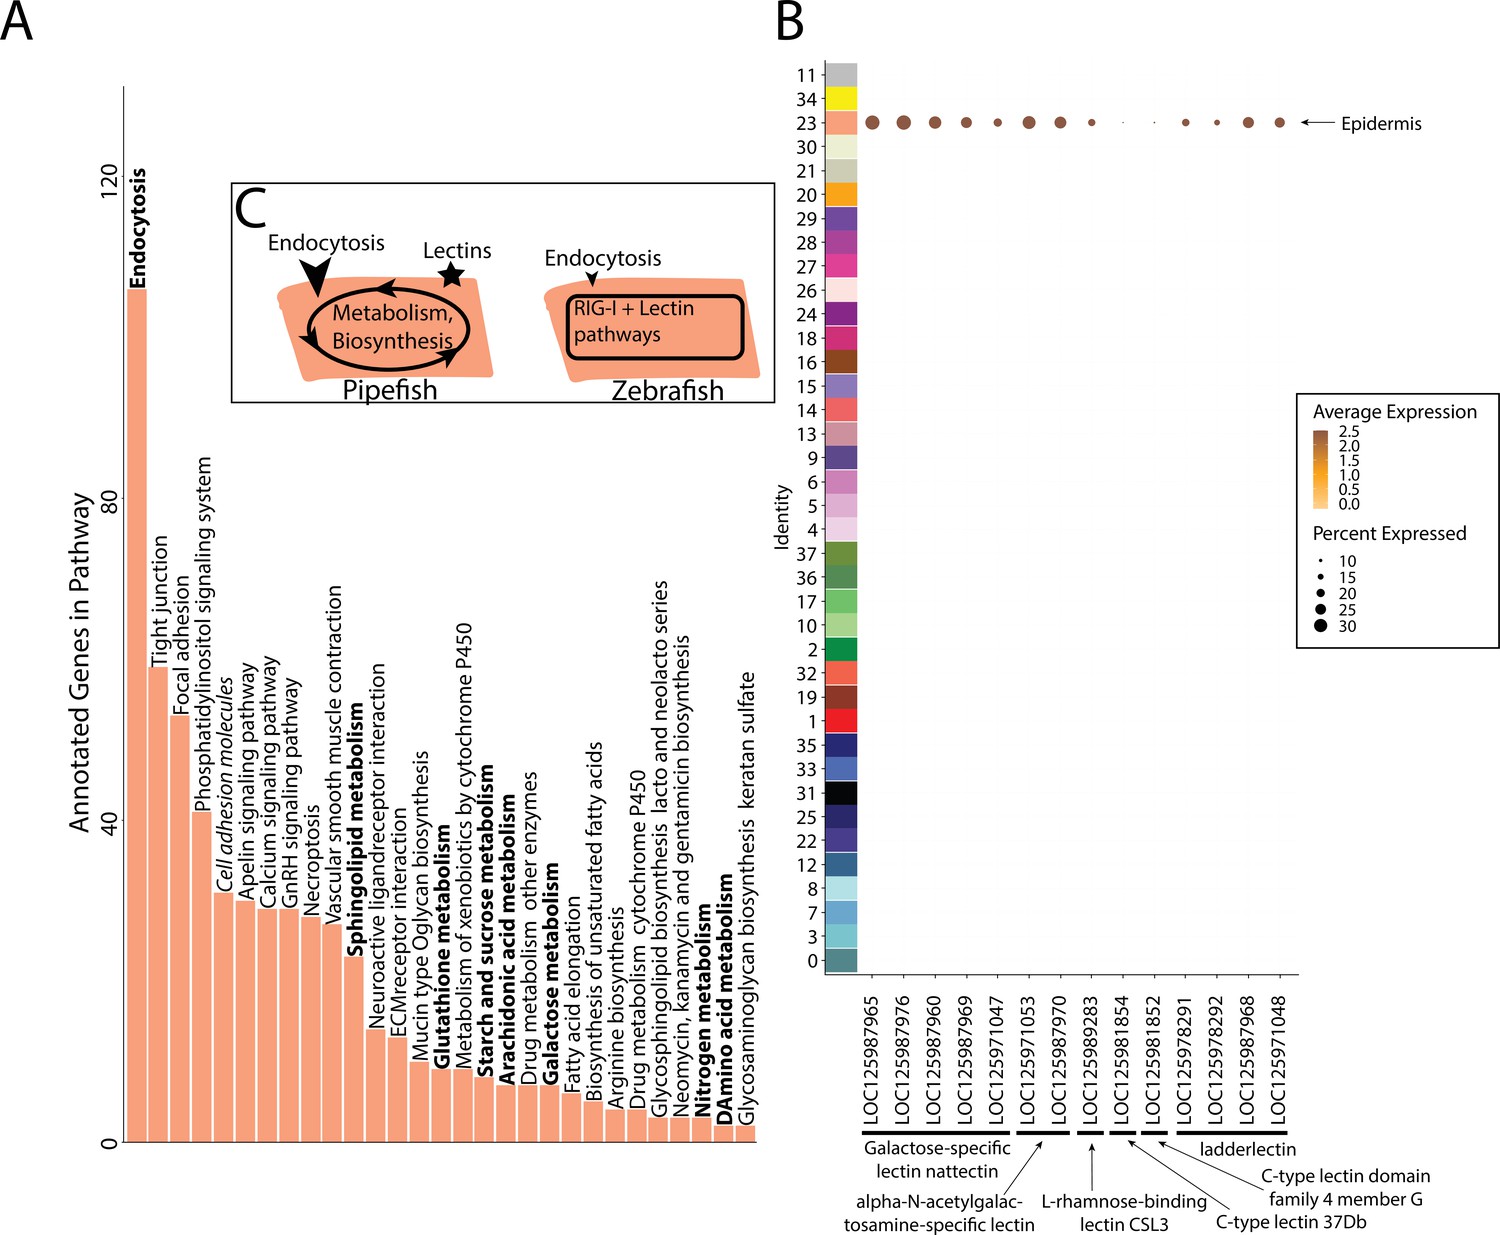
Gene expression signatures suggest embryonic interactions within the brood pouch environment.
Epidermal cells (A), with pathways that suggest increased endocytosis and metabolism pathways are in bold text. Pathways, upregulated in 3dpf zebrafish epidermal cells are in italics. Pipefish epidermal cells also express 15 lectin genes not found in other cell types (B). We suggest an epidermal cell model (C), in which we predict pipefish have an enrichment of nutrient processing genes and lectins in comparison with zebrafish cells.
Figure 7—figure supplement 1

3dpf Zebrafish do not express lectin genes in epidermal cells.
This dotplot shows the marker genes on the x-axis and y-axis, organized by cell type. The size of the dot represents the percentage of cells that express the gene in each cluster. The darkness of the dot represents the average expression of the genes.
Tables
Appendix 1—key resources table
| Reagent type (species) or resource | Designation | Source or reference | Identifiers | Additional information |
|---|---|---|---|---|
| Biological sample (Syngnathus scovelli) | S. scovelli embryos | Dr. Emily Rose, Alyssa’s Seahorse Saavy, and Gulf Specimens Marine Lab | Florida Fish and Wildlife Collection permit SAL -21–0182-E (Dr. Rose) | |
| Biological sample (Syngnathus leptorhynchus) | S. leptorhynchus embryos | Oregon Coast | Oregon Department of Fisheries and Wildlife Collection permit 26987 | |
| Chemical compound | collagenase I | Sigma | C0130-200mg | 100 mg/ml |
| Commercial assay or kit | DNA Clean and Concentrator | Zymo | D4013 | |
| Commercial assay or kit | RNA Clean and Concentrator | Zymo | R1013 | |
| Commercial assay or kit | Zymoclean gel DNA recovery | Zymo | D4001 | |
| Commercial assay or kit | Next GEM Single-Cell Gene Expression 3' v3.1 (Dual Index) | 10 X Genomics | PN-1000121 | |
| Commercial assay or kit | SMRTbell Express Template Prep Kit 2.0 | PacBio | 100-938-900 | |
| Commercial assay or kit | Barcoded Adapter Kit 8B-OVERHANG | PacBio | 101-628-500 | |
| Other | 10 uM cell strainer | Thomas Scientific | 1181X52 | Cell strainers were used to filter dissociated cells. |
| Software, algorithm | R | R | RRID:SCR_001905 | v4.0.2 |
| Software, algorithm | minimap | Li, 2018 | v2.9 | |
| Software, algorithm | cDNA cupcake | Tseng, 2021 | ||
| Software, algorithm | SQANTI3 | Tardaguila et al., 2018 | ||
| Software, algorithm | TAMA | Kuo et al., 2017 | ||
| Software, algorithm | Cell Ranger | 10 X Genomics | RRID:SCR_017344 | v3.0.2 |
| Software, algorithm | Seurat | Butler et al., 2018; Hafemeister and Satija, 2019 | v4.1.0 | |
| Software, algorithm | WGCNA | Langfelder and Horvath, 2008 | v1.72–1 | |
| Software, algorithm | SoupX | Young and Behjati, 2020 | v1.5.2 | |
| Software, algorithm | scrublet | Wolock et al., 2019 | v0.2.3 | |
| Software, algorithm | SCTransform | Hafemeister and Satija, 2019 | v0.3.3 | |
| Software, algorithm | CytoTRACE | Gulati et al., 2020 | v0.3.3 | |
| Software, algorithm | Cytoscape | RRID:SCR_003032 | v3.10.0 | |
| Software, algorithm | mVISTA | Frazer et al., 2004; Mayor et al., 2000 | ||
| Software, algorithm | Photoshop | Adobe | RRID:SCR_014199 | v23.4.2 |
Additional files
-
Supplementary file 1
Quality metrics for the single-cell libraries.
- https://cdn.elifesciences.org/articles/97764/elife-97764-supp1-v1.csv
-
Supplementary file 2
The number of cells in each cell cluster and cluster identities.
- https://cdn.elifesciences.org/articles/97764/elife-97764-supp2-v1.csv
-
Supplementary file 3
Marker genes identified using Seurat FindAllMarkers for each cluster.
- https://cdn.elifesciences.org/articles/97764/elife-97764-supp3-v1.csv
-
Supplementary file 4
Marker genes identified using the DotPlot method.
- https://cdn.elifesciences.org/articles/97764/elife-97764-supp4-v1.csv
-
Supplementary file 5
Additional information on the marker gene identified for every cluster.
- https://cdn.elifesciences.org/articles/97764/elife-97764-supp5-v1.xlsx
-
Supplementary file 6
A list of the in situ hybridization probes used in this study, the conditions used to prepare the probes, and the staging/sample information for the embryos.
- https://cdn.elifesciences.org/articles/97764/elife-97764-supp6-v1.xlsx
-
Supplementary file 7
Alignments of in situ hybridization probes with the unpublished Syngnathus leptorhynchus genome.
- https://cdn.elifesciences.org/articles/97764/elife-97764-supp7-v1.zip
-
Supplementary file 8
Genetic networks were initially labeled with colors, we converted these labels to numeric annotations for simplicity using this conversion table.
The table also contains the number of genes in each network.
- https://cdn.elifesciences.org/articles/97764/elife-97764-supp8-v1.csv
-
Supplementary file 9
All the genetic networks, the genes inside of them, and additional information for the genetic networks highlighted in this paper.
- https://cdn.elifesciences.org/articles/97764/elife-97764-supp9-v1.xlsx
-
Supplementary file 10
The t-statistics derived for each module-cell cluster pair.
The cell clusters are in the rows and the gene modules are in the columns.
- https://cdn.elifesciences.org/articles/97764/elife-97764-supp10-v1.csv
-
Supplementary file 11
p-values for the t-statistics of the strength of association between gene modules and cell clusters.
p-values are corrected for multiple testing hypotheses using fdr. The cell clusters are in the rows and the gene modules are in the columns.
- https://cdn.elifesciences.org/articles/97764/elife-97764-supp11-v1.csv
-
Supplementary file 12
The change in connectivity for gene modules when individual cell clusters are removed.
The cell clusters are in the columns and the gene networks are in the rows.
- https://cdn.elifesciences.org/articles/97764/elife-97764-supp12-v1.csv
-
Supplementary file 13
p-values for the change in connectivity are found in this csv.
The cell clusters are in the columns and the gene networks are in rows.
- https://cdn.elifesciences.org/articles/97764/elife-97764-supp13-v1.csv
-
MDAR checklist
- https://cdn.elifesciences.org/articles/97764/elife-97764-mdarchecklist1-v1.docx
Download links
A two-part list of links to download the article, or parts of the article, in various formats.
Downloads (link to download the article as PDF)
Open citations (links to open the citations from this article in various online reference manager services)
Cite this article (links to download the citations from this article in formats compatible with various reference manager tools)
Single-cell sequencing provides clues about the developmental genetic basis of evolutionary adaptations in syngnathid fishes
eLife 13:RP97764.
https://doi.org/10.7554/eLife.97764.3


