Marcks and Marcks-like 1 proteins promote spinal cord development and regeneration in Xenopus
- School of Biological and Chemical Sciences, University of Galway, Ireland
- Research Ireland Center for Medical Devices (CÚRAM), University of Galway, Ireland
Figures
Figure 1 with 6 supplements
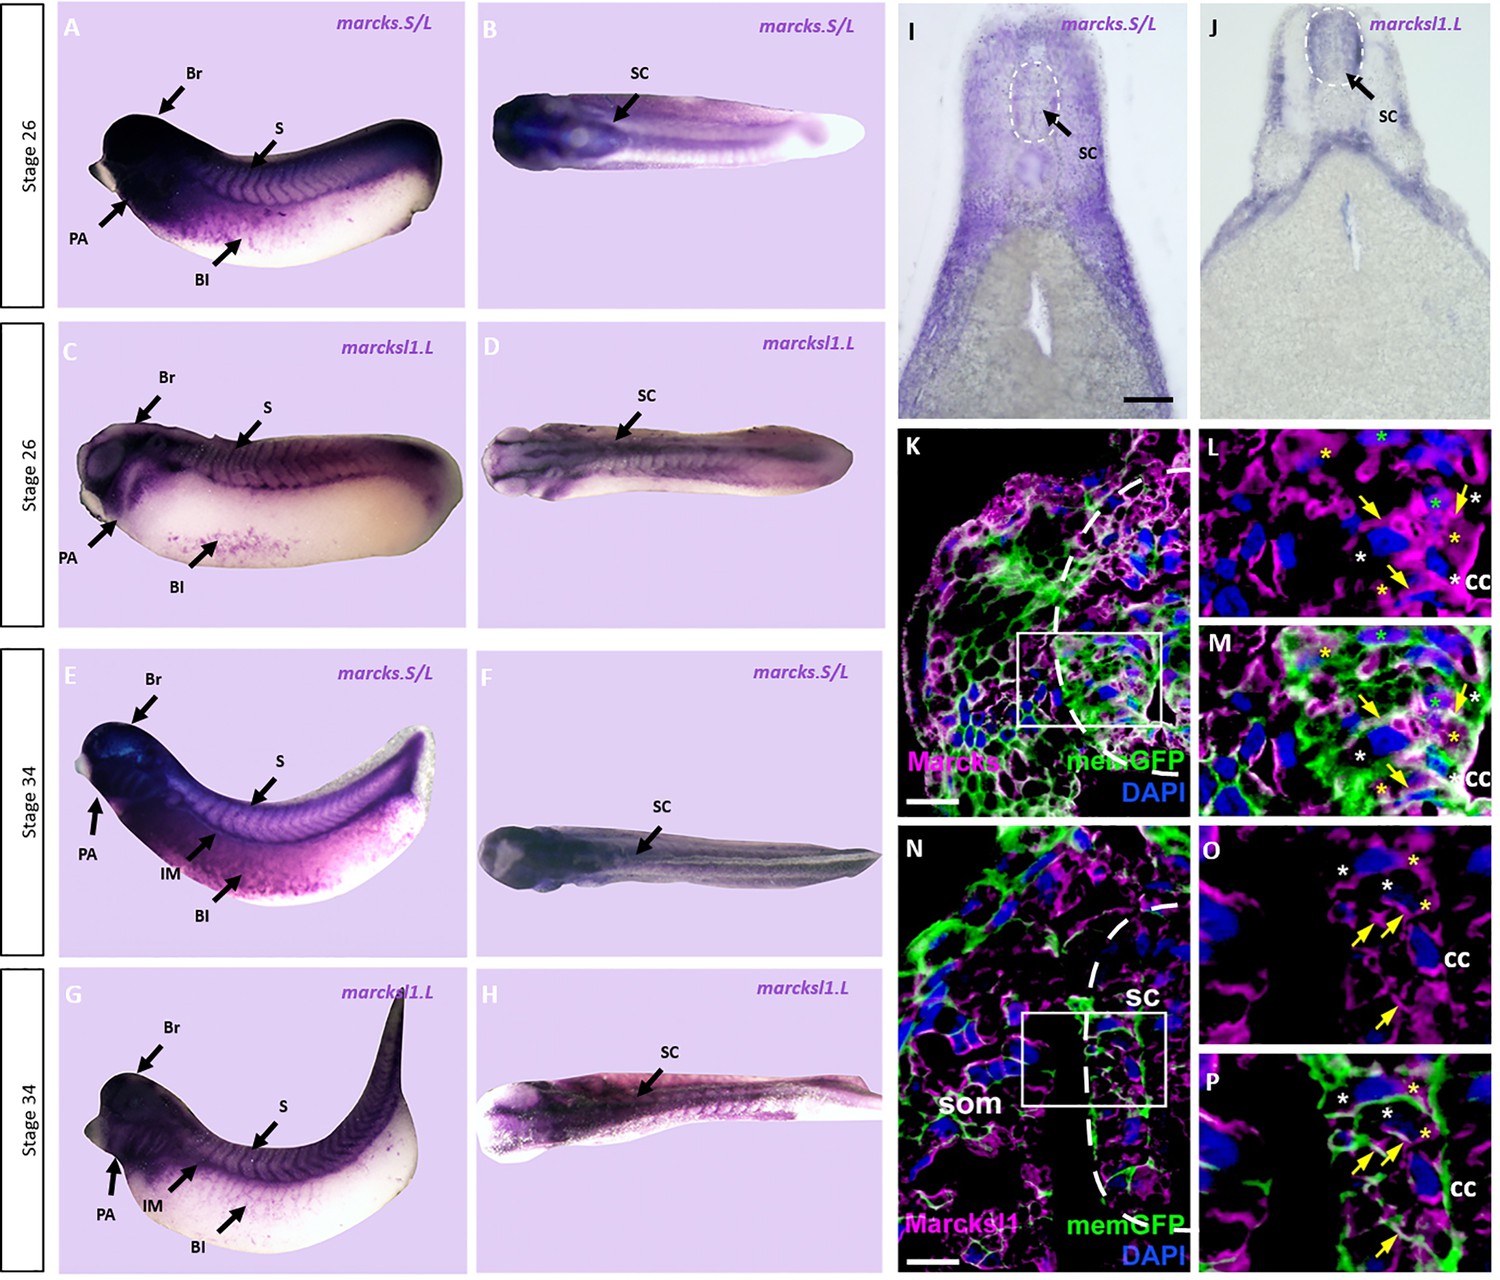
Expression of Marcks and Marcksl1 in the Xenopus spinal cord.
Expression of marcks.S (A, B, E, F) and marcksl1.L (C, D, G, H) as revealed by whole-mount in situ hybridization in stage 26 (A–D) and 34 (E–H) Xenopus embryos in lateral (A, C, E, G) and dorsal (B, D, F, H) views (anterior is to the left). Expression in the spinal cord (SC), brain (Br), somites (S), intermediate mesoderm (IM), blood islands (Bl), and pharyngeal arches (PA) is indicated. Transverse sections showing expression of marcks.S (I) and marcksl1.L (J) in the spinal cord at stage 34. Immunostaining for Marcks (K–M) and Marcksl1 (N–P) protein in confocal images of transverse sections through stage 26 embryos after memGFP mRNA injection. White boxed areas in (K) and (N) are shown at a higher magnification in (L, M) and (O, P), respectively. Yellow asterisks indicate the expression of Marcks in the cytoplasm; green asterisks indicate expression in nuclei; white asterisks show the absence of expression in the cytoplasm; yellow arrows show expression in the membrane. Spinal cord outlined with hatched line in (I, J, K, N). Abbreviations: cc, central canal; sc, spinal cord; som, somites. Scale bar in I = 50 µm for (I, J). Scale bar in K and N = 20 µm.
Figure 1—figure supplement 1
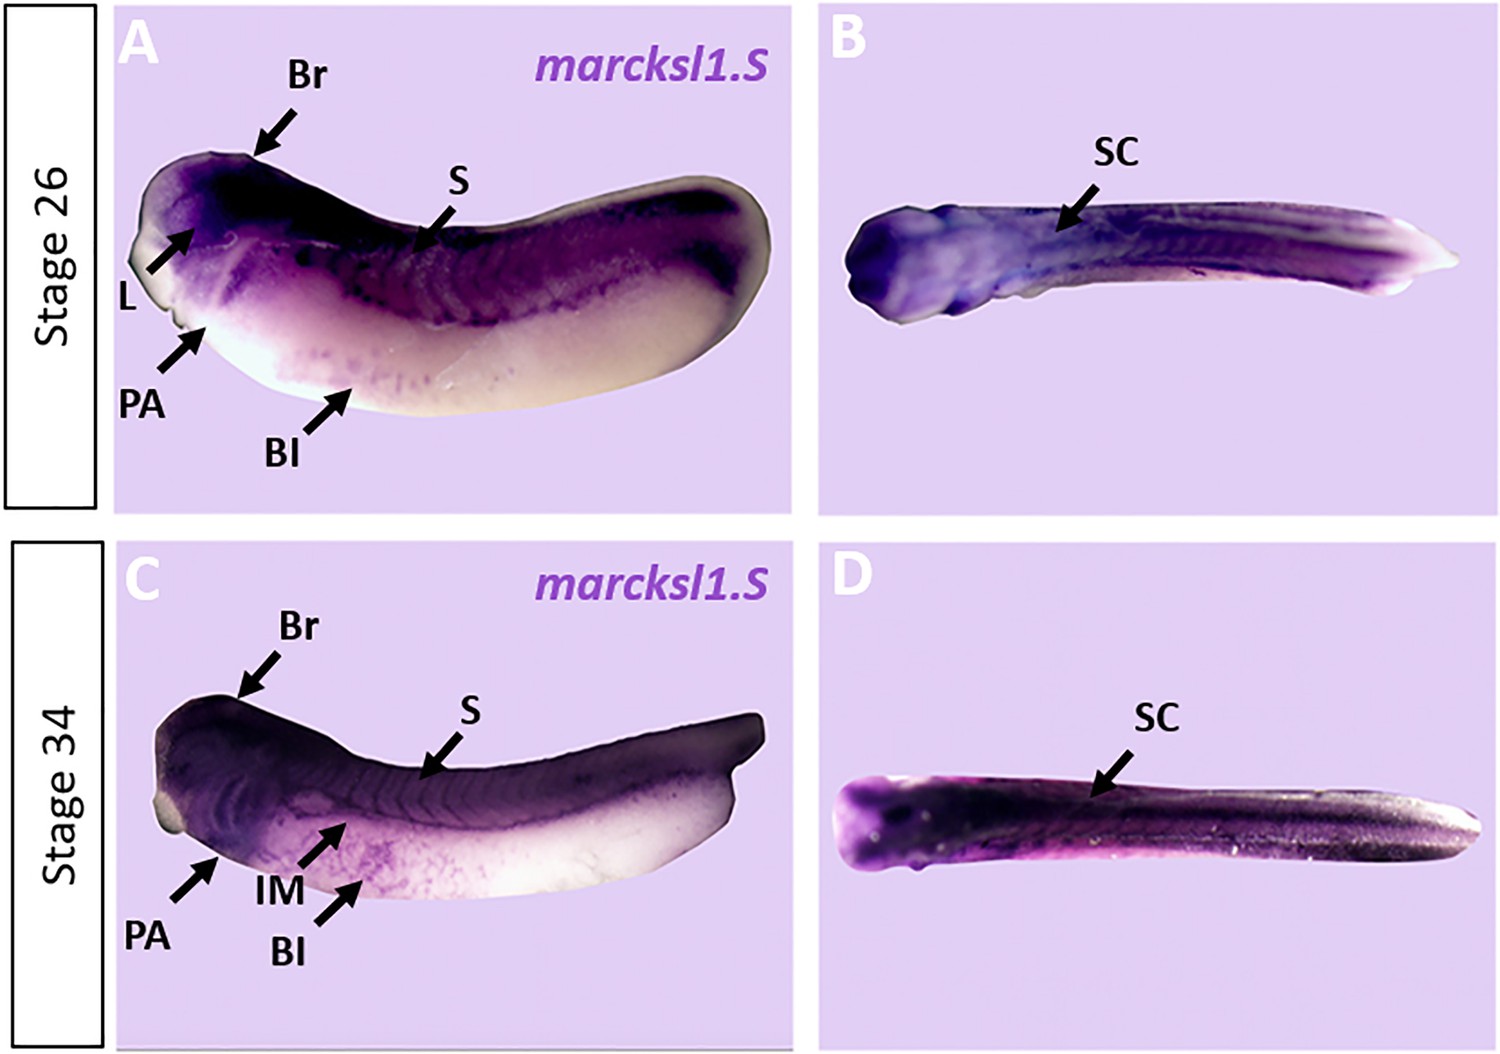
Expression of marcksl1.S in Xenopus.
Expression of marcksl1.S as revealed by whole-mount in situ hybridization in stage 26 (A, B) and 34 (C, D) Xenopus embryos in lateral (A,C) and dorsal (B, D) views (anterior is to the left). Expression in the brain (Br), spinal cord (SC), lens (L), somites (S), intermediate mesoderm (IM), blood islands (BI), and pharyngeal arches (PA) is indicated.
Figure 1—figure supplement 2
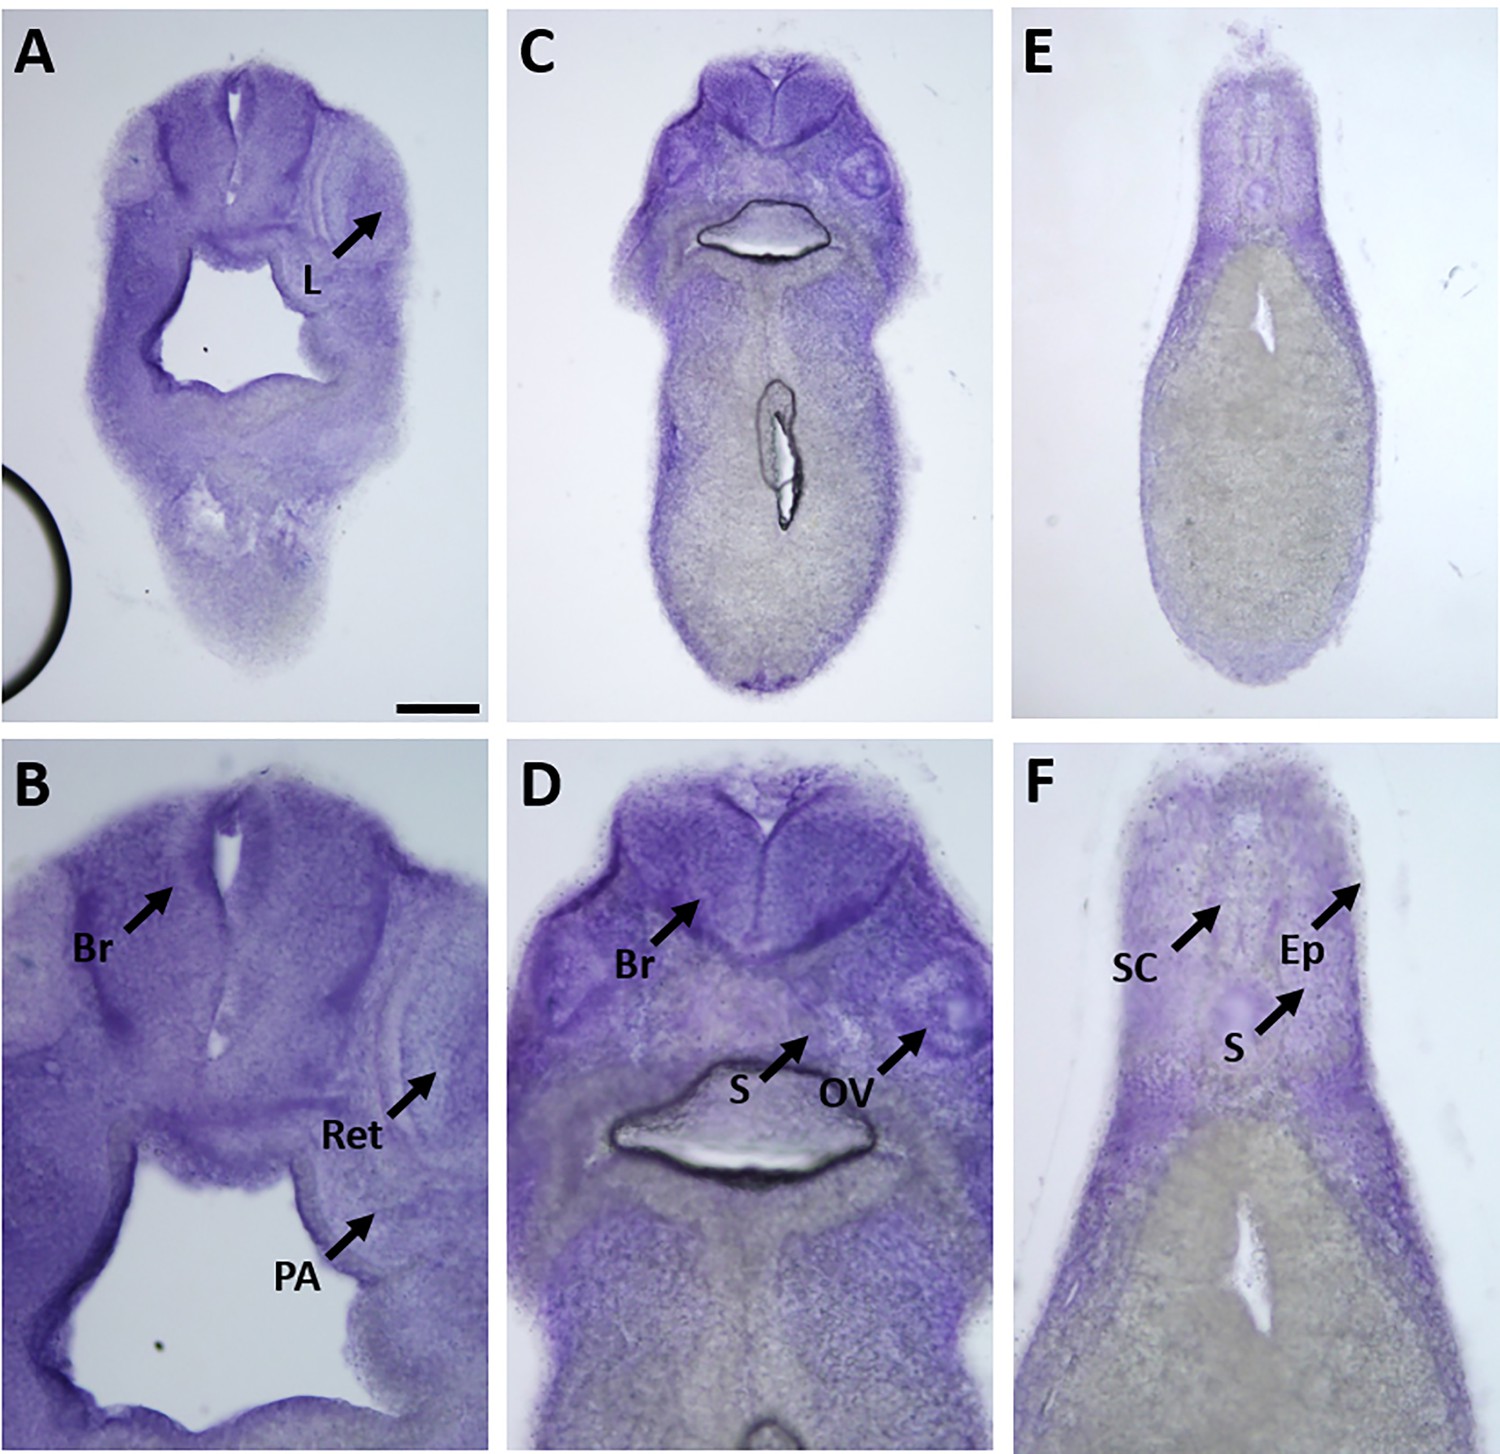
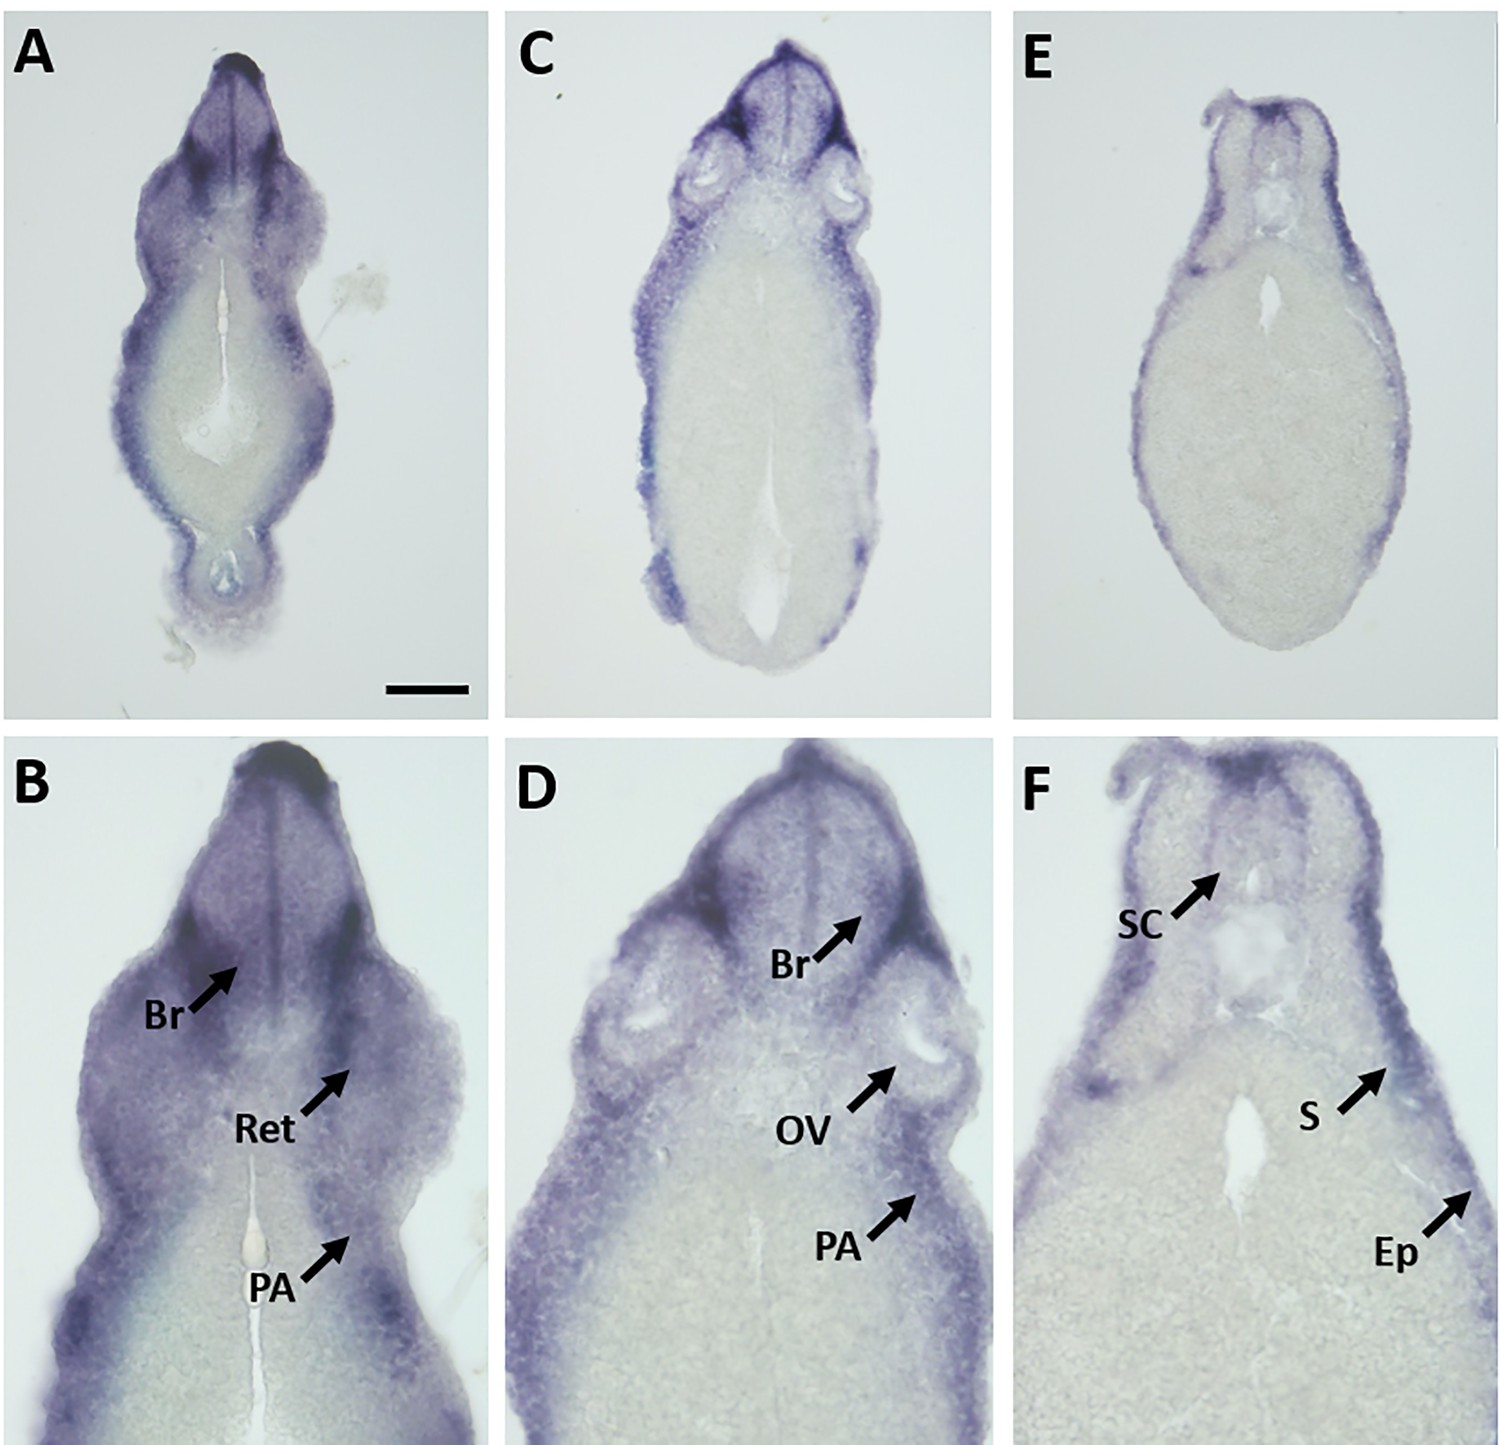
Expression of marcks.S mRNA revealed by transverse vibratome sections of Xenopus stage 34 embryos after whole-mount in situ hybridization.
Embryos are sectioned at level of posterior forebrain (A, B), postotic hindbrain (C, D), and spinal cord (E, F). Higher magnification details of (A, C, E) are shown in (B, D, F), respectively. marcks.S expression is evident in the brain (Br), retinas (Ret), lens (L), spinal cord (SC), PA, otic vesicle (OV), epidermis (Ep), and somites (S). Scale bar in A = 100 µm for (A, C, E) and 50 µm for (B, D, F).
Figure 1—figure supplement 3
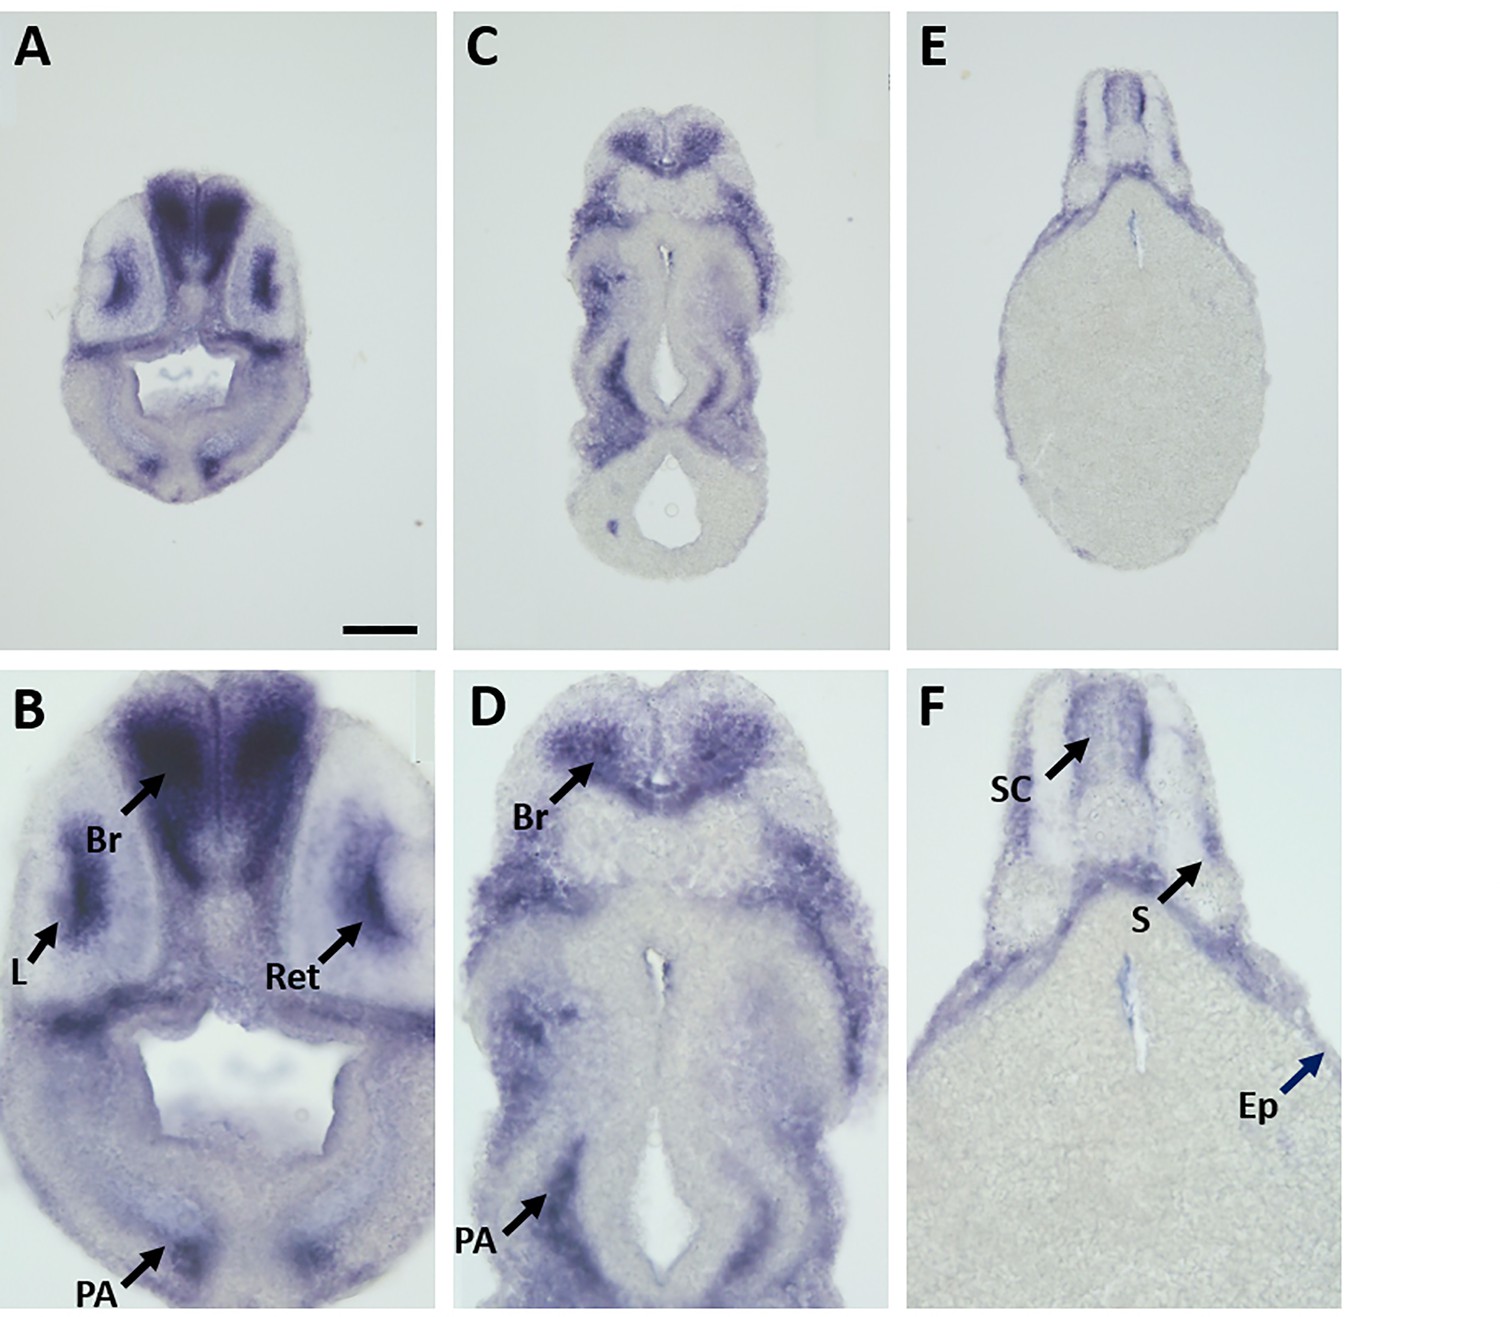
Expression of marcksl1.L mRNA as revealed by transverse vibratome sections of Xenopus stage 34 embryos after whole-mount in situ hybridization.
Embryos are sectioned at level of posterior forebrain (A, B), postotic hindbrain (C, D), and spinal cord (E, F). Higher magnification details of (A, C, E) are shown in (B, D, F), respectively. marcksl1.L expression is evident in the brain (Br), retinas (Ret), lens (L), spinal cord (SC), PA, epidermis (Ep), and somites (S). (E, F) show same section as Figure 1J. Scale bar in A = 100 µm for (A, C, E) and 50 µm for (B, D, F).
Figure 1—figure supplement 4
Expression of marcksl1.S mRNA as revealed by transverse vibratome sections of Xenopus stage 34 embryos after whole-mount in situ hybridization.
Embryos are sectioned at level of posterior forebrain (A, B), otic hindbrain (C, D), and spinal cord (E, F). Higher magnification details of (A, C) are shown in (B, D). marcksl1.L expression is evident in the brain (Br), retinas (Ret), spinal cord (SC), pharyngeal arches (PA), epidermis (Ep), and somites (S). OV, otic vesicle. Scale bar in A = 100 µm for (A, C) and 50 µm for (B, D).
Figure 1—figure supplement 5
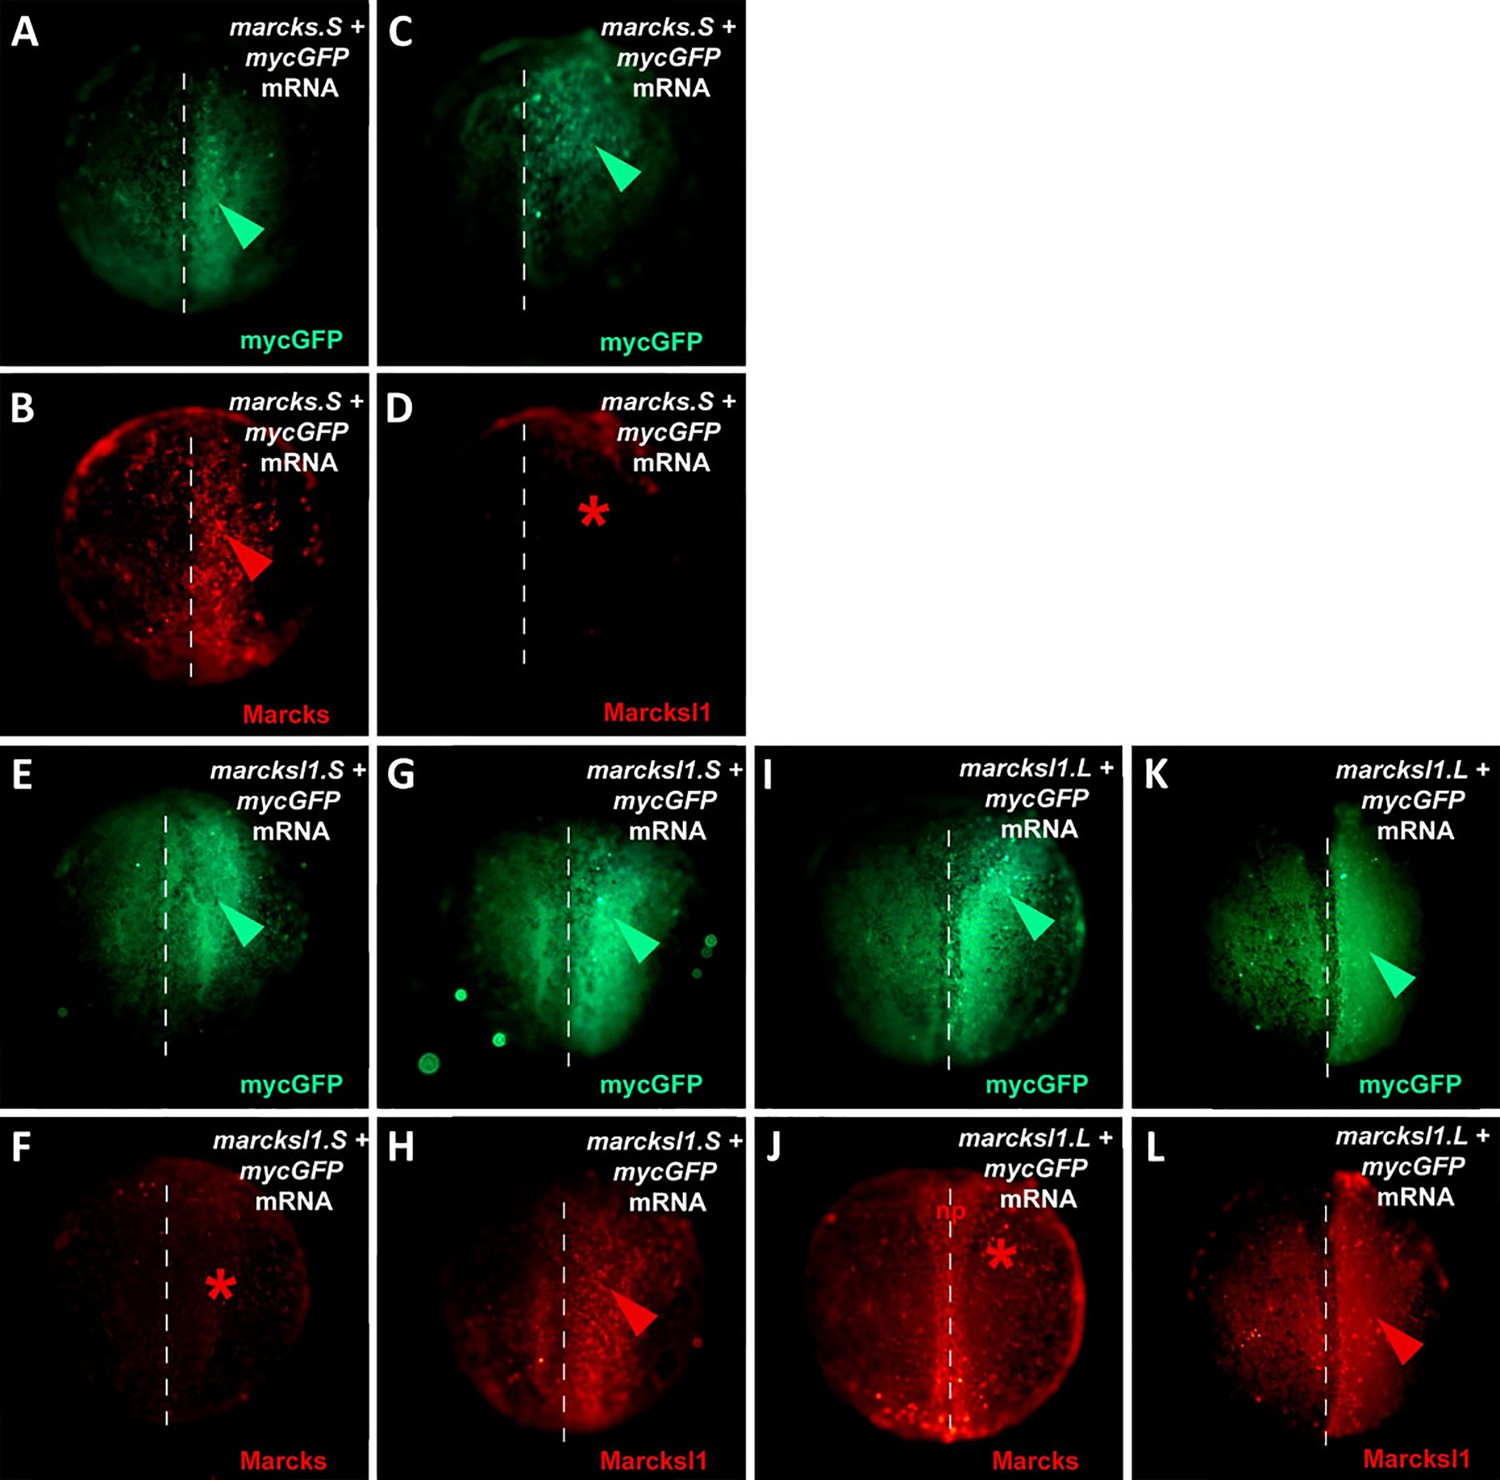
Specificity of Marcks and Marcksl1 antibodies.
One blastomere of 2-cell stage embryos was co-injected with 125 pg of mycGFP mRNA and 500 pg of either marcksS mRNA (A–D), marcksl1.S mRNA (E–H), or marcksl1.L mRNA (I–L) followed by immunostaining at neural plate stages (stages 13–16) with anti-Myc (A, C, E, G, I, K) and either anti-Marcks (B, F, J) or anti-Marcksl1 (D, H, L) antibodies. The injected side is shown on the right, with the injected area indicated by mycGFP immunostaining (green arrowheads). Anti-Marcks antibodies recognize Marcks (B, red arrowhead) but not Marcksl1 (F, I, red asterisks) proteins, while anti-Marcksl1 antibodies recognize Marcksl1 (H, L, red arrowheads) but not Marcks (D, red asterisk) proteins translated from the injected mRNAs indicating that antibodies do not cross-react. Marcks antibodies also detected native Marcks1 protein in the neural plate (np) in embryos at late neural plate stages (J).
Figure 1—figure supplement 6
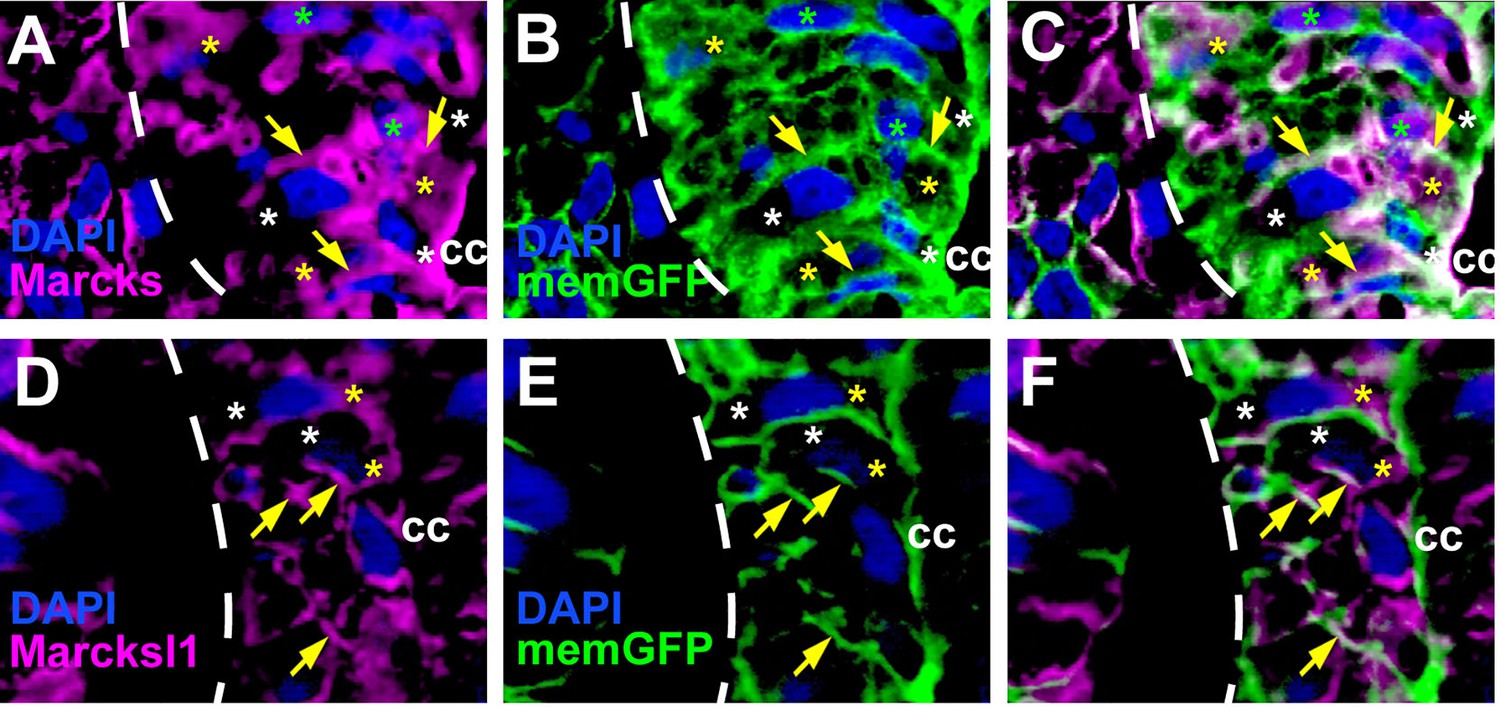
Distribution of Marcks and Marcksl1 proteins in the Xenopus spinal cord.
Immunostaining for Marcks (A–C) and Marcksl1 (D–F) protein in confocal images of transverse sections through stage 26 embryos after memGFP mRNA injection (same sections as shown in Figure 1K–P). For clarity, the distribution of Marcks protein (A) and memGFP (B) are shown here in separate channels as well as in a merged image (C) for the spinal regions depicted in Figure 1L, M. For clarity, the distribution of Marcksl1 protein (D) and memGFP (E) are shown here in separate channels as well as in a merged image (F) for the spinal regions depicted in Figure 1O, P. Yellow asterisks indicate the expression of Marcks in the cytoplasm; green asterisks indicate expression in nuclei; white asterisks show the absence of expression in the cytoplasm; yellow arrows show expression in the membrane. Spinal cord outlined with hatched line. Abbreviation: cc, central canal.
Figure 2 with 7 supplements
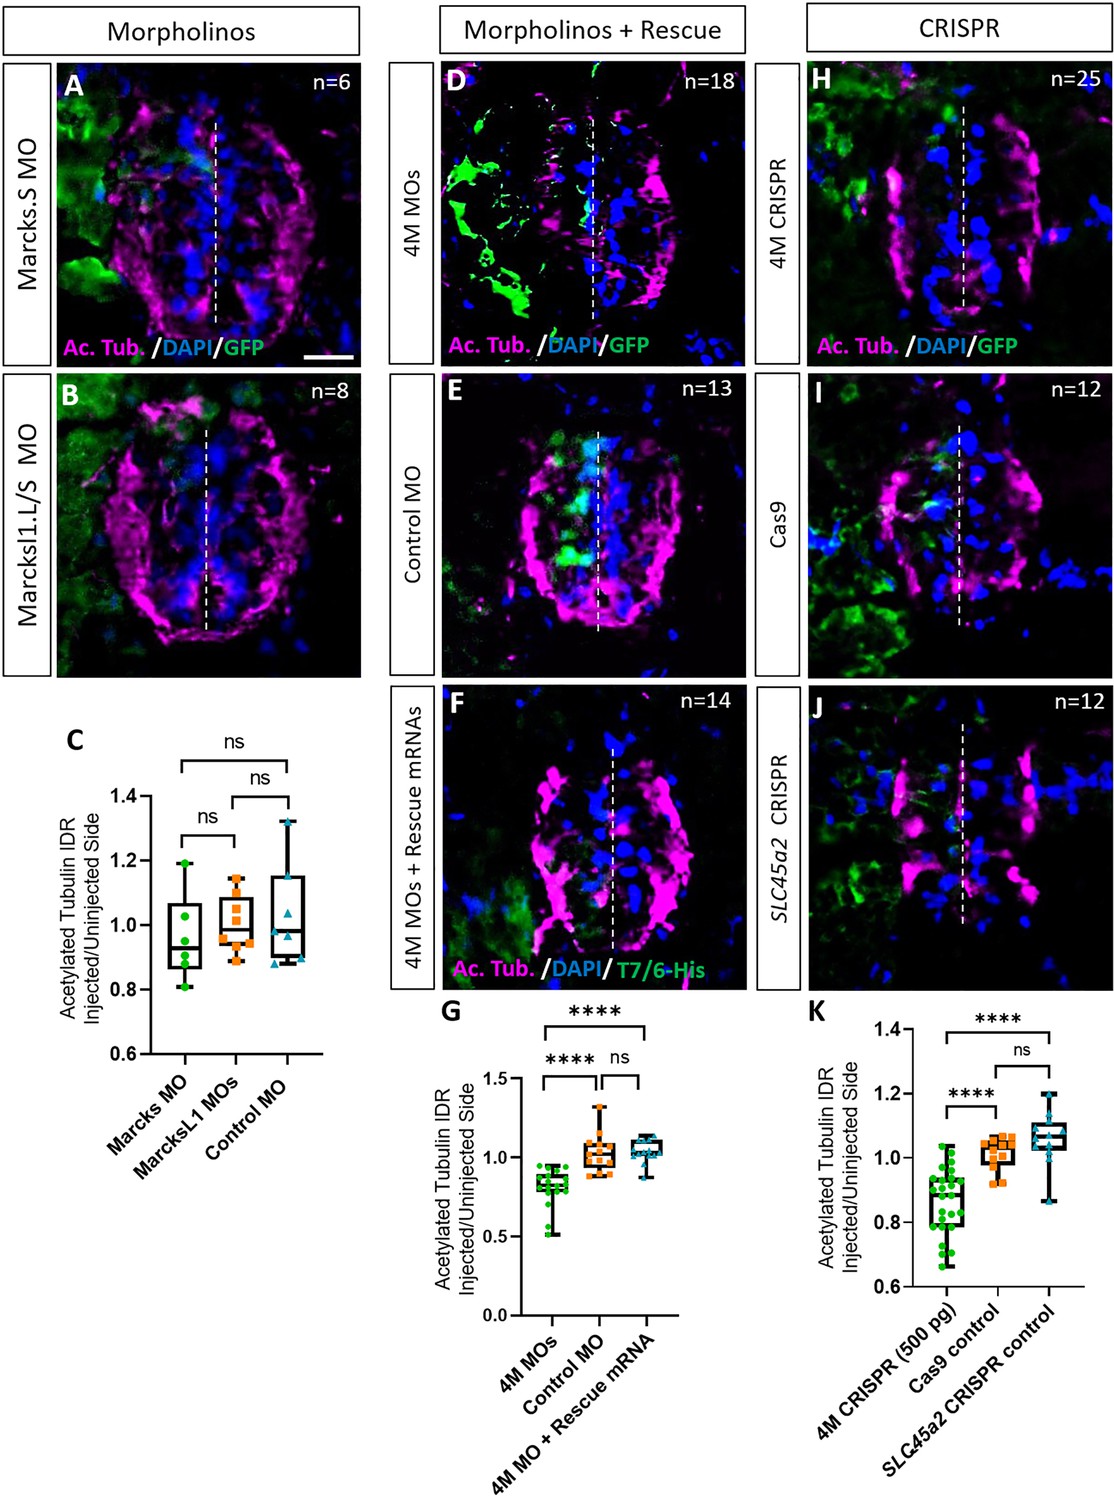
Marcks and Marcksl1 are required for neurite outgrowth during Xenopus spinal cord development.
(A–C) Evaluation of neurite outgrowth after individual morpholino (MO) knockdown of Marcks or Marcksl1 in stage 34–36 developing spinal cords. A dorsal blastomere of 4- to 8-cell stage embryos was injected with either 9 ng of marcks MOs (A, C), 9 ng of marcksl1.L and marcksl1.S MOs each (B, C), or 9 ng of control MO (C). All injections contained 125 pg of myc-GFP mRNA to identify the injected side. (D–J) Evaluation of neurite outgrowth after loss of function of all four homeologs (marcks.S, marcks.L, marcksl1.S, and marcksl1.L) by MO knockdown (4M MO) or CRISPR gene editing (4M CRISPR). A dorsal blastomere of 4- to 8-cell stage embryos was co-injected with 9 ng of each MO (marcks.S, marcksl1.L, and marcksl1.S MO) (D, G); 27 ng standard control MO (E, G); 9 ng of each MO plus 300 pg of mutated chicken marcks and 350 pg of mutated X. tropicalis marcksl1 rescue mRNA constructs encoding T7 and 6-His tags (F, G); 500 pg of each single-guide RNA (marcks.L/S and marcksl1.L/S sgRNA) with 1 ng Cas9 protein (H, K); 1 ng Cas9 protein (I, K); or slc45a2 sgRNA and 1 ng Cas9 protein (J, K). All injections contained 125 pg of myc-GFP mRNA to identify the injected side. Injected (left) and uninjected (right) spinal cord sides (separated by the dashed line) were compared in transverse sections immunostained for acetylated tubulin (A, B, D–F, H–J) and for GFP, T7, and 6-His to determine the injected side. Immunostaining for acetylated tubulin was quantified (G, K) by determining the integrated density ratio (IDR) of staining in injected to uninjected sides. Significance was determined using an ordinary one-way ANOVA with Tukey’s multiple comparisons test. NS, not significant; ****p < 0.0001. Error bars represent minimum to maximum values showing all points with a line at the median. n refers to the number of animals analyzed. Scale bar in A = 25 µm (for all panels).
Figure 2—figure supplement 1
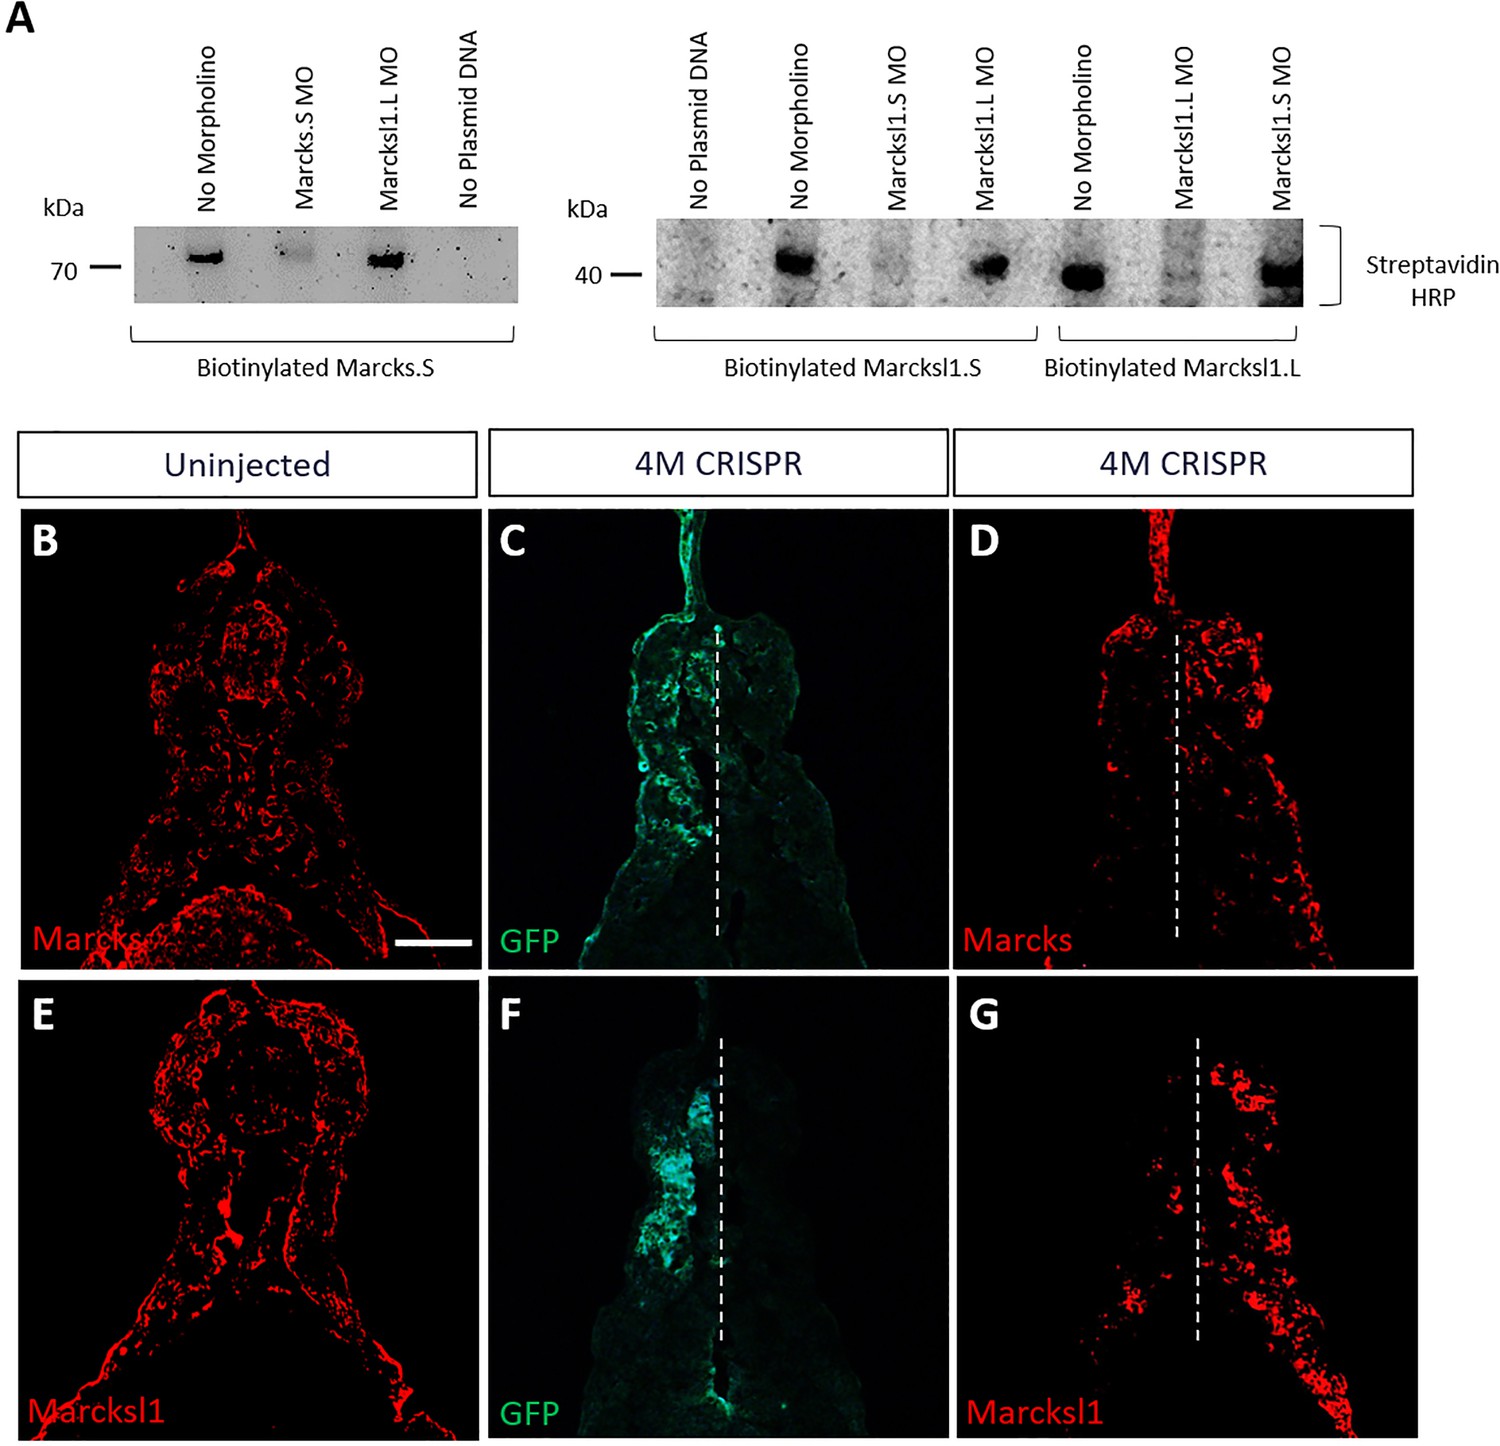
Validation of Marcks and Marcksl1 knockdown and gene editing.
(A) Morpholino (MO) specificity and efficacy verified by in vitro TNT. Biotinylated Marcks.S, Marcksl1.L, and Marcksl1.S proteins were expressed by in vitro transcription and translation (TNT) and detected in western plots by streptavidin–HRP. In vitro TNT reactions without any morpholino added served as positive control. In vitro TNT reactions without plasmid DNA added served as negative control. Protein translation was blocked when the appropriate MO was added, but not by an inappropriate MO. (B–G) Reduction of Marcks and Marcksl1 immunostaining in stage 36 embryos co-injected with marcks.L/S, marcksl1.L/S sgRNA, and myc-GFP mRNA (4M CRISPR). In uninjected embryos (B, E), Marcks (B) and Marcksl1 (E) expression are seen on both sides. In 4M CRISPR-injected embryos Marcks (D) and Marcksl1 (G) immunostaining is reduced on the injected side as indicated by GFP immunostaining (C, F). Scale bar in B = 50 µm (for all panels).
-
Figure 2—figure supplement 1—source data 1
Full size gel pictures for Figure 2A (labeled).
- https://cdn.elifesciences.org/articles/98277/elife-98277-fig2-figsupp1-data1-v1.zip
-
Figure 2—figure supplement 1—source data 2
Full size gel pictures for Figure 2A (unlabeled).
- https://cdn.elifesciences.org/articles/98277/elife-98277-fig2-figsupp1-data2-v1.zip
Figure 2—figure supplement 2
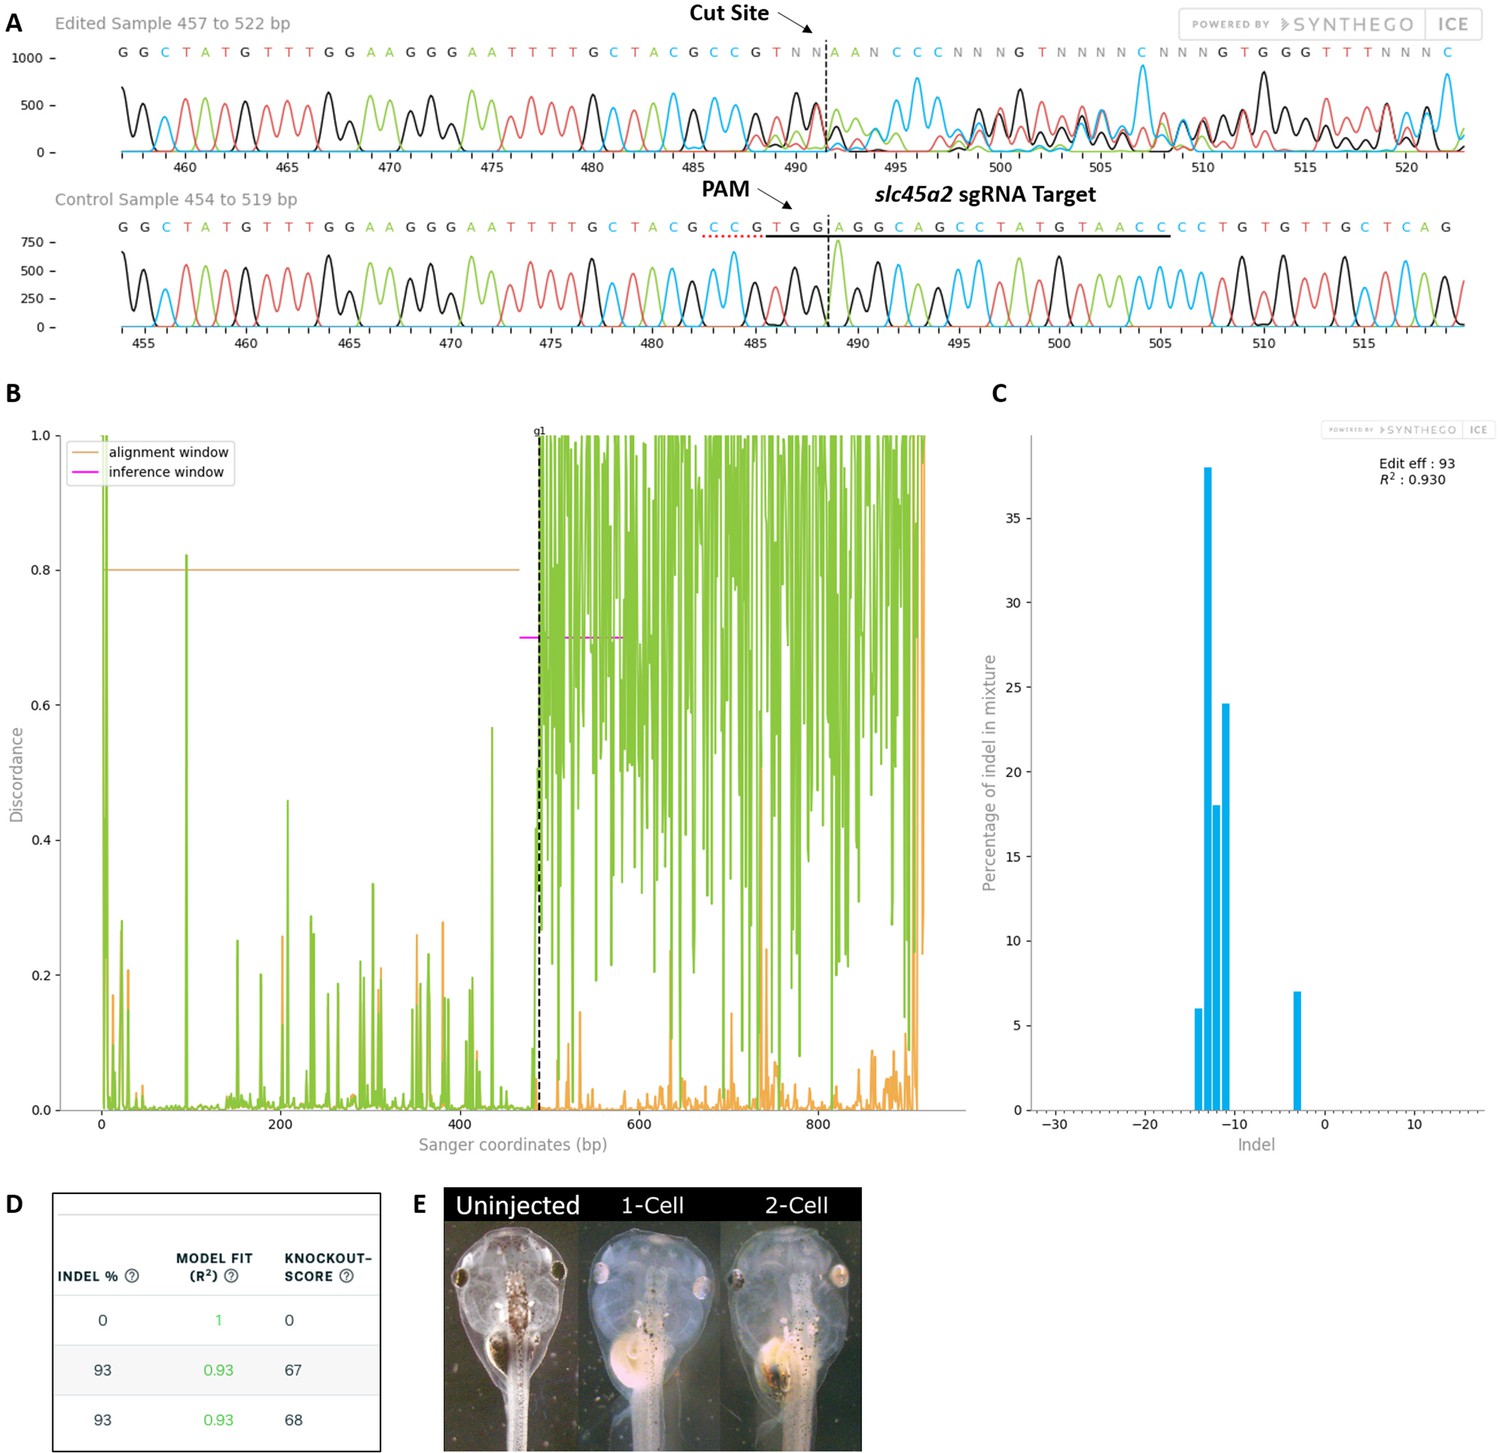
Control slc45a2 sgRNA/Cas9 efficiently and specifically edits targeted X. laevis DNA.
All data were generated by the Synthego Inference for CRISPR Edits (ICE) tool based on DNA samples from stage 26–42 embryos injected with slc45a2 sgRNA, Cas9 protein, and myc-GFP mRNA during the 1-cell stage in comparison with uninjected embryos. (A) Sanger sequence chromatograms showing degradation of the sequence trace from PCR products amplifying CRISPR-targeted slc45a2 DNA (top) compared with DNA from uninjected embryos (bottom). The underlined region indicates the sgRNA target binding sequence. Arrows indicate the Protospacer Adjacent Motif (PAM) and the Cas9 cleavage site. (B) Discordance plot showing the level of sequence-base disagreement between the control reference DNA from uninjected embryos (orange lines) and the CRISPR DNA (green lines) in the region surrounding the cut site, indicating a high level of sequence difference after the cleavage site, shown by the hatched line. (C) Synthego Indel Distribution plot, which infers the distribution of insertion–deletion sizes (±1 or more nucleotides) around the slc45a2 CRISPR-target site. The x-axis indicates the size of the indel, and the y-axis shows the percentage of the sequences containing it. The editing efficiency score indicates that 93% of the DNA in the CRISPR-targeted sequence was edited. A Pearson correlation coefficient (R2) was also generated by ICE with a value of 0.93 out of 1, measuring how well the indel distribution fits the Sanger sequence data. (D) Summary of three analyzed samples showing the sgRNA target and PAM sequences. DNA from PCR products comparing two slc45a2 sequences from uninjected embryos (top) shows an indel percentage of 0% and a predicted knockout (KO) score of 0%. Indel scores for DNA sequences derived from two CRISPR-edited embryos (middle and bottom) indicate that 93% of the DNA analyzed was edited. Knockout scores of 67–68% indicate the proportion of indels that contain a frameshift mutation or a 21+ base-pair indel. (E) slc45a2 CRISPR gene editing generates a visible loss of eye pigmentation in stage 46 tadpoles. Whereas uninjected tadpoles have no eye pigmentation defects, eye pigmentation is unilaterally reduced in the CRISPR-injected side of 2-cell stage-injected embryos and bilaterally reduced in 1-cell stage CRISPR-injected embryos.
Figure 2—figure supplement 3
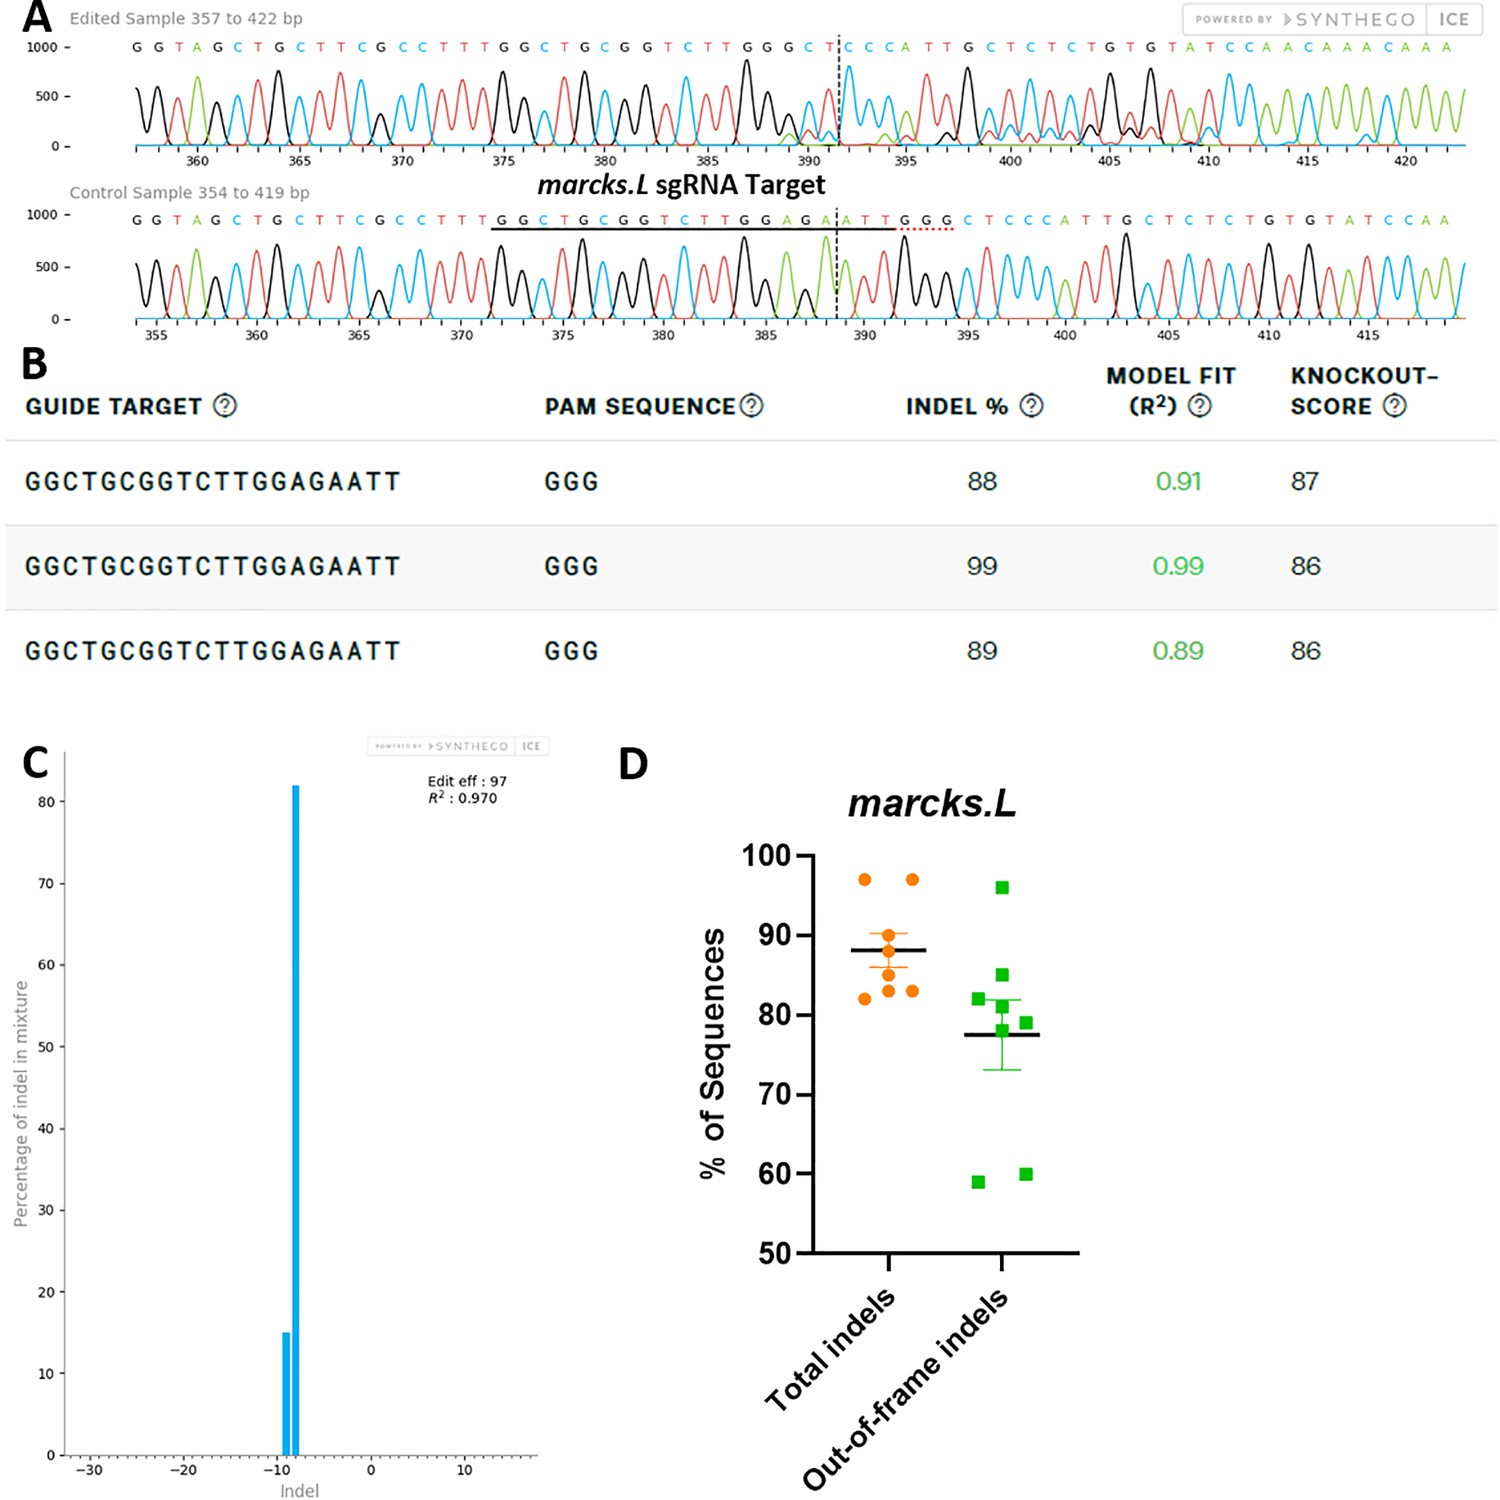
marcks.L/S sgRNA efficiently and specifically edits Xenopus laevis marcks.L DNA.
All data were generated by the Synthego Inference for CRISPR Edits (ICE) tool based on DNA samples from stage 26–42 embryos injected with marcks.L/S and marcksl1.L/S sgRNA, Cas9 protein, and myc-GFP mRNA during the 1-cell stage in comparison with uninjected embryos. (A) Sanger sequence chromatograms showing degradation of the sequence trace from PCR products amplifying CRISPR-targeted marcks.L exon 1 DNA (top) compared with DNA from an uninjected embryo (bottom). The underlined region indicates the sgRNA target binding sequence. (B) Summary of three analyzed samples showing the sgRNA target and PAM sequence. Indel scores for DNA sequences derived from three CRISPR-edited embryos compared with uninjected embryos, indicating that 88%, 89%, and 99% of the DNA analyzed were edited. Knockout scores of 86% and 87% indicate the proportion of indels that contain a frameshift mutation. (C) Synthego Indel Distribution plot from one representative CRISPR-embryo, which infers the distribution of insertion–deletion sizes (±1 or more nucleotides) around the marcks.L CRISPR-target site. The x-axis indicates the size of the indel, and the y-axis shows the percentage of the sequences containing it. The editing efficiency score indicates that 97% of the DNA in the CRISPR-targeted sequence was edited with mostly an eight base-pair deletion. A Pearson correlation coefficient (R2) was also generated by ICE with a value of 0.97 out of 1, measuring how well the indel distribution fits the Sanger sequence data. (D) Indel percentages calculated by ICE for eight CRISPR-edited embryos, indicating that an average of 88% of the DNA was edited for all animals. From this edited DNA, 78% contained out-of-frame mutations.
Figure 2—figure supplement 4
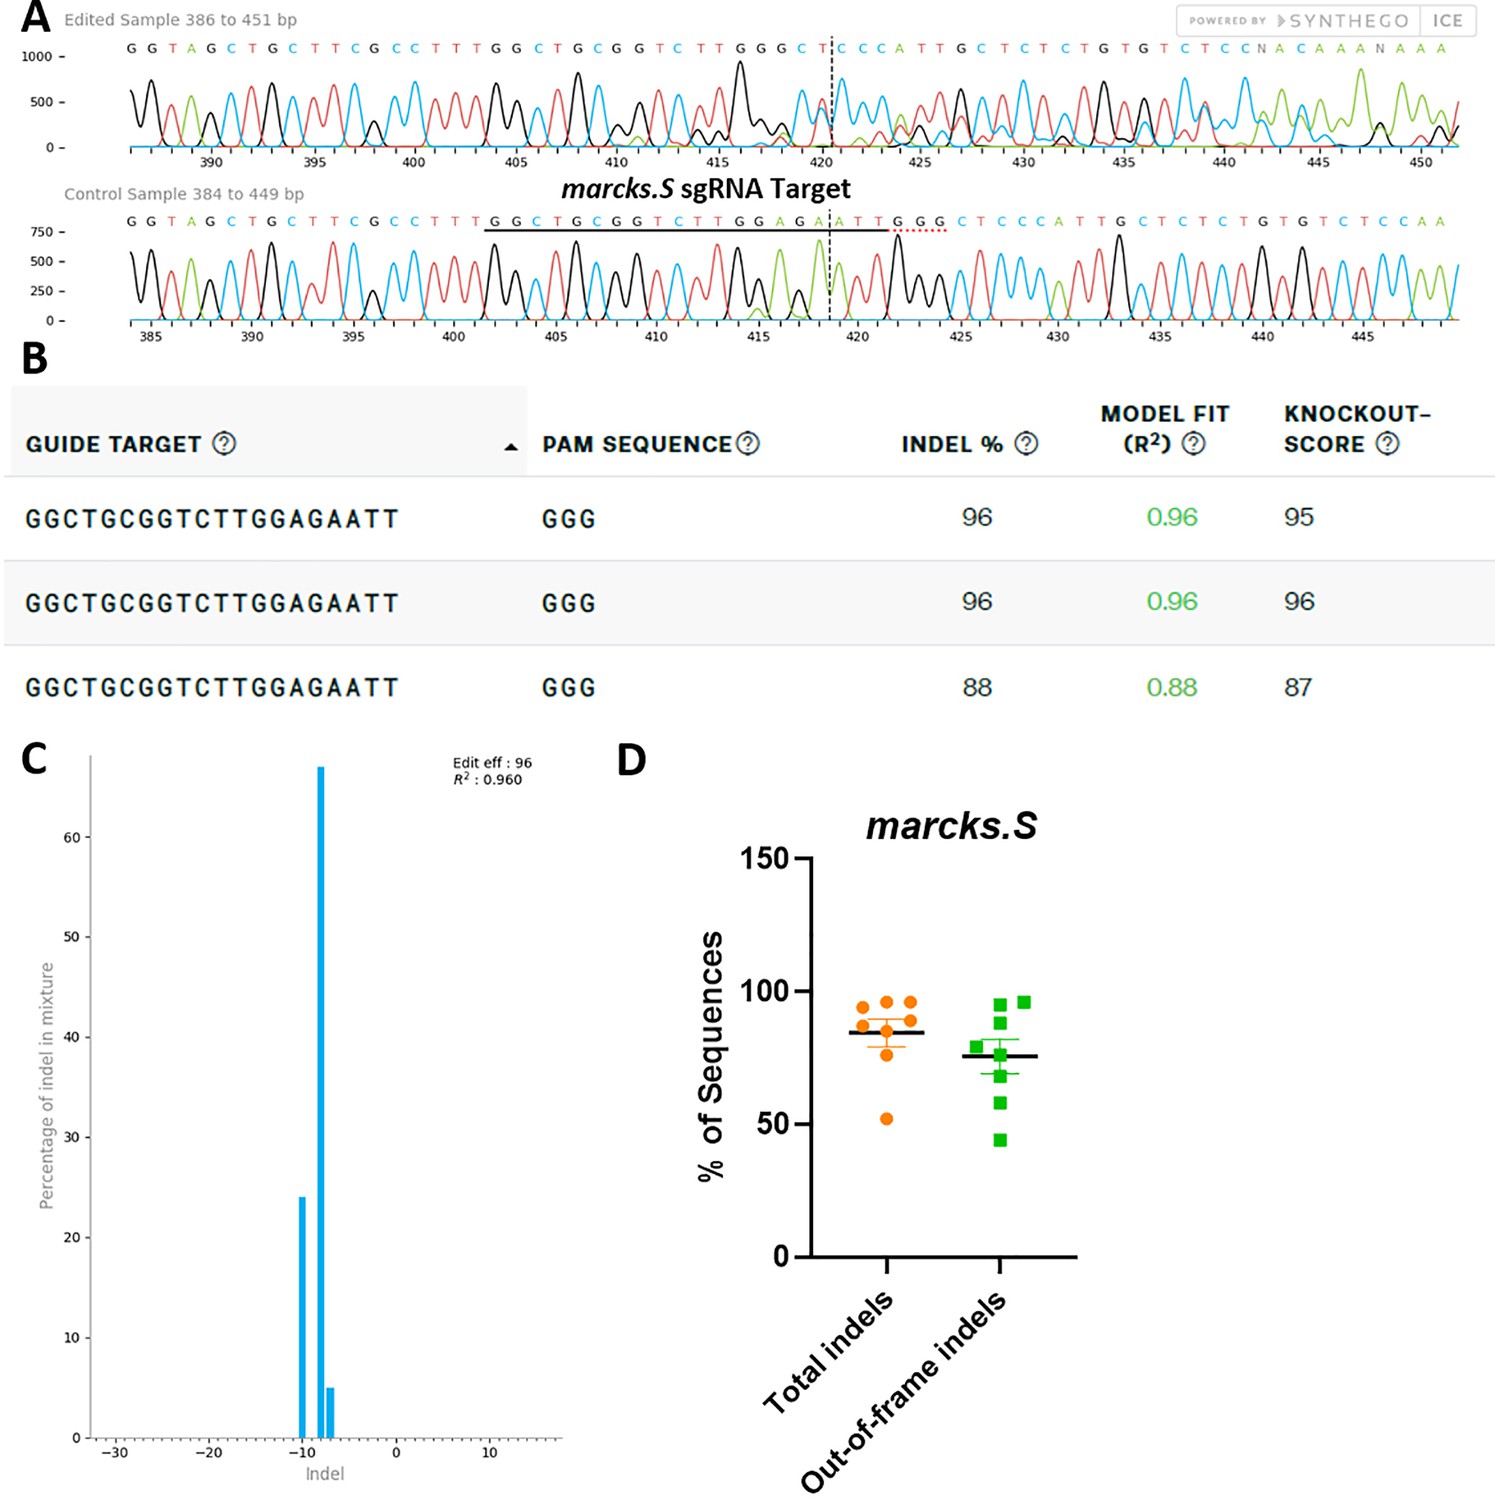
marcks.L/S sgRNA efficiently and specifically edits Xenopus laevis marcks.S DNA.
All data were generated by the Synthego ICE tool based on DNA samples from stage 26–42 embryos injected with marcks.L/S and marcksl1.L/S sgRNA, Cas9 protein, and myc-GFP mRNA during the 1-cell stage in comparison with uninjected embryos. (A) Sanger sequence chromatograms showing degradation of the sequence trace from PCR products amplifying CRISPR-targeted marcks.S exon 1 DNA (top) compared with DNA from an uninjected embryo (bottom). The underlined region indicates the sgRNA target binding sequence. (B) Summary of three analyzed samples showing the sgRNA target and PAM sequence. Indel scores for DNA sequences derived from three CRISPR-edited embryos compared with uninjected embryos, indicating that 88% and 96% of the analyzed DNA was edited. Knockout scores of 95%, 96%, and 87% indicate the proportion of indels that contain a frameshift mutation. (C) Synthego Indel Distribution plot from one representative CRISPR-embryo, which infers the distribution of insertion–deletion sizes (±1 or more nucleotides) around the marcks.S CRISPR-target site. The x-axis indicates the size of the indel, and the y-axis shows the percentage of the sequences containing it. The editing efficiency score indicates that 96% of the DNA in the CRISPR-targeted sequence was edited with a majority of eight base-pair deletions. A Pearson correlation coefficient (R2) was also generated by ICE with a value of 0.96 out of 1, measuring how well the indel distribution fits the Sanger sequence data. (D) Indel percentages calculated by ICE for eight CRISPR-edited embryos, indicating that an average of 84% of the DNA was edited for all animals. From this edited DNA, 76% contained out-of-frame mutations.
Figure 2—figure supplement 5
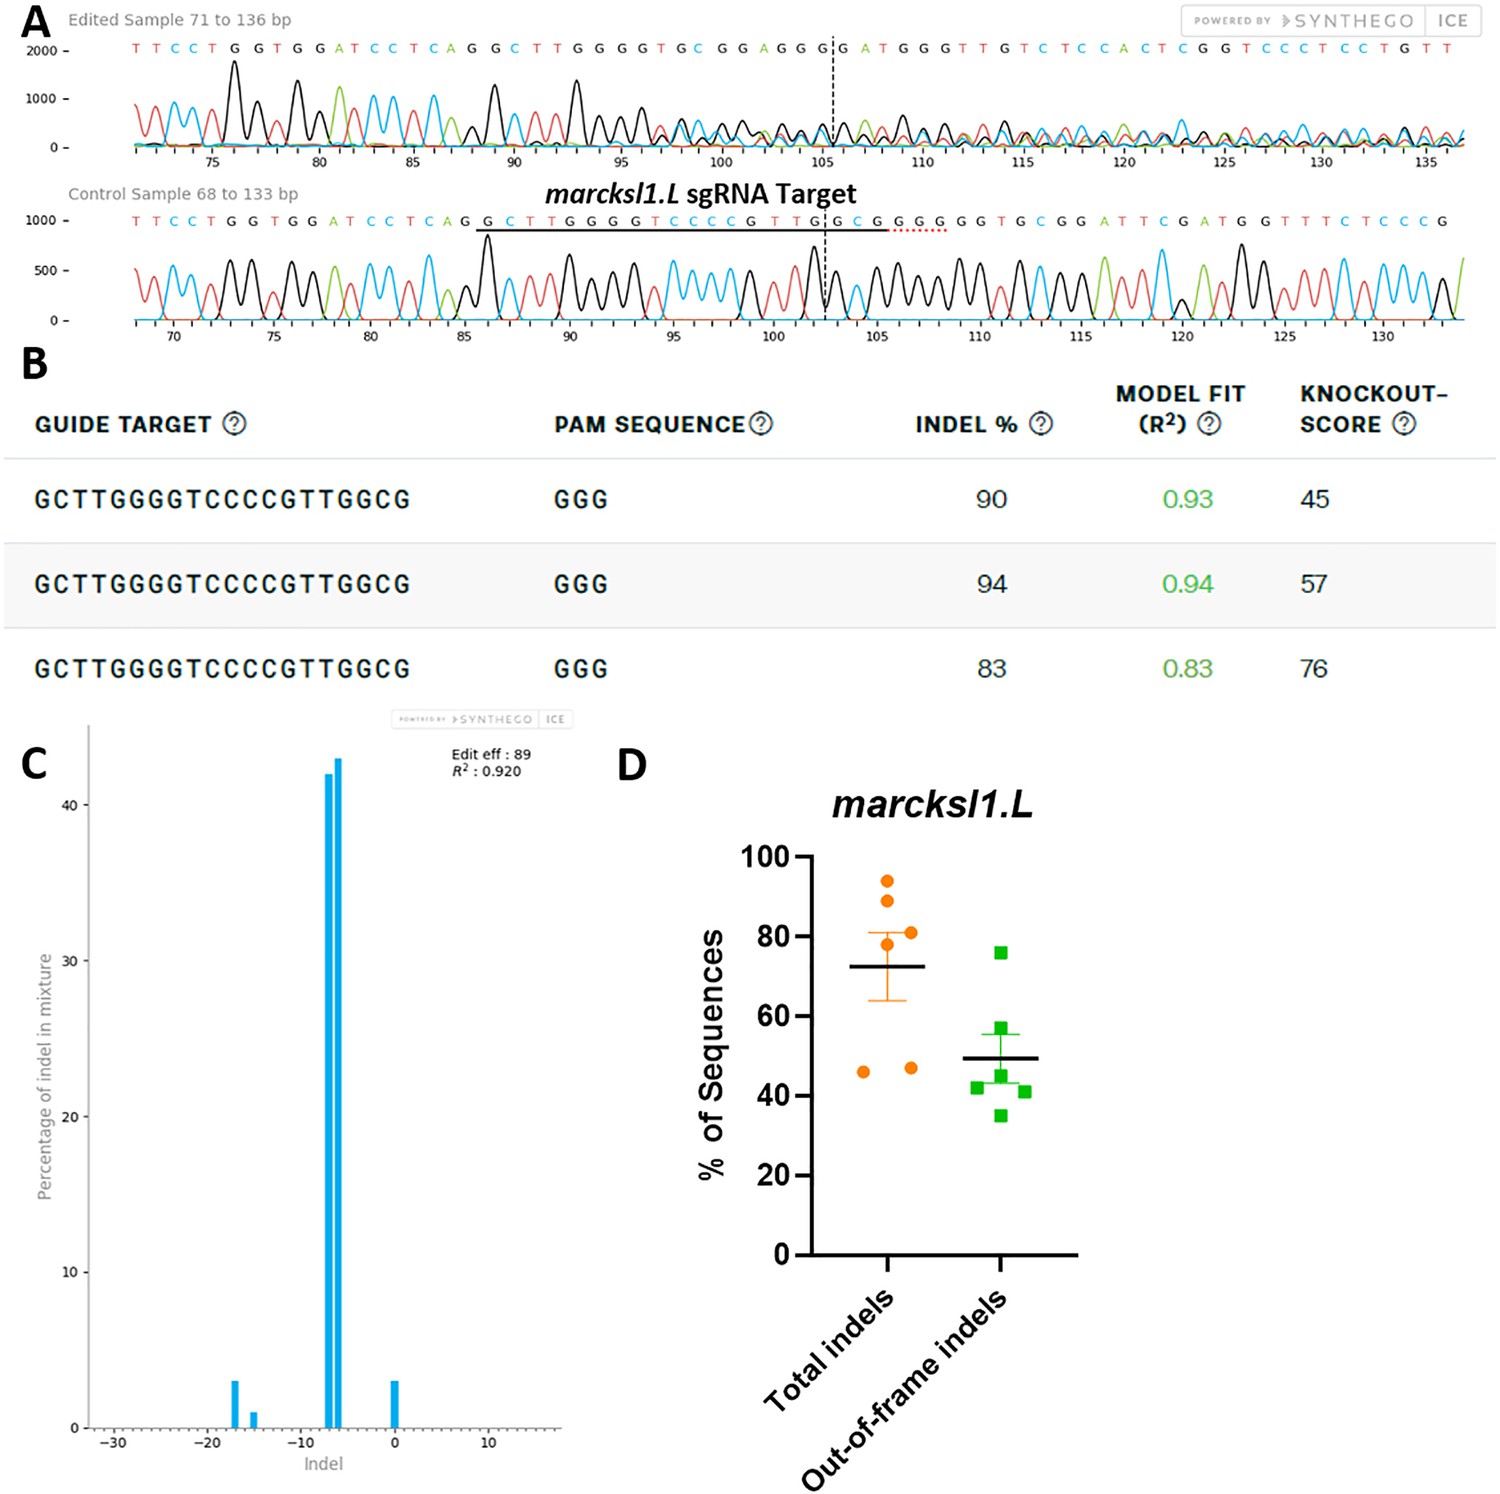
marcksl1.L/S sgRNA efficiently and specifically edits X. laevis marcksl1.L DNA.
All data were generated by the Synthego Inference for CRISPR Edits (ICE) tool based on DNA samples from stage 26–42 embryos injected with marcks.L/S and marcksl1.L/S sgRNA, Cas9 protein, and myc-GFP mRNA during the 1-cell stage in comparison with uninjected embryos. (A) Sanger sequence chromatograms showing degradation of the sequence trace from PCR products amplifying CRISPR-targeted marcksl1.L exon 2 DNA (top) compared with DNA from an uninjected embryo (bottom). The underlined region indicates the sgRNA target binding sequence. (B) Summary of three analyzed samples showing the sgRNA target and PAM sequence. Indel scores for DNA sequences derived from three CRISPR-edited embryos compared with uninjected embryos, indicating that 83%, 90%, and 94% of the DNA analyzed were edited. Knockout scores of 45%, 57%, and 76% indicate the proportion of indels that contain a frameshift mutation. (C) Synthego Indel Distribution plot from one representative CRISPR-embryo, which infers the distribution of insertion–deletion sizes (±1 or more nucleotides) around the marcksl1.L CRISPR-target site. The x-axis indicates the size of the indel, and the y-axis shows the percentage of the sequences containing it. The editing efficiency score indicates that 89% of the DNA in the CRISPR-targeted sequence was edited with mostly six to seven base-pair deletions. A Pearson correlation coefficient (R2) was also generated by ICE with a value of 0.92 out of 1, measuring how well the indel distribution fits the Sanger sequence data. (D) Indel percentages calculated by ICE for six CRISPR-edited embryos, indicating that an average of 73% of the DNA was edited for all animals. From this edited DNA, 50% contained out-of-frame mutations.
Figure 2—figure supplement 6
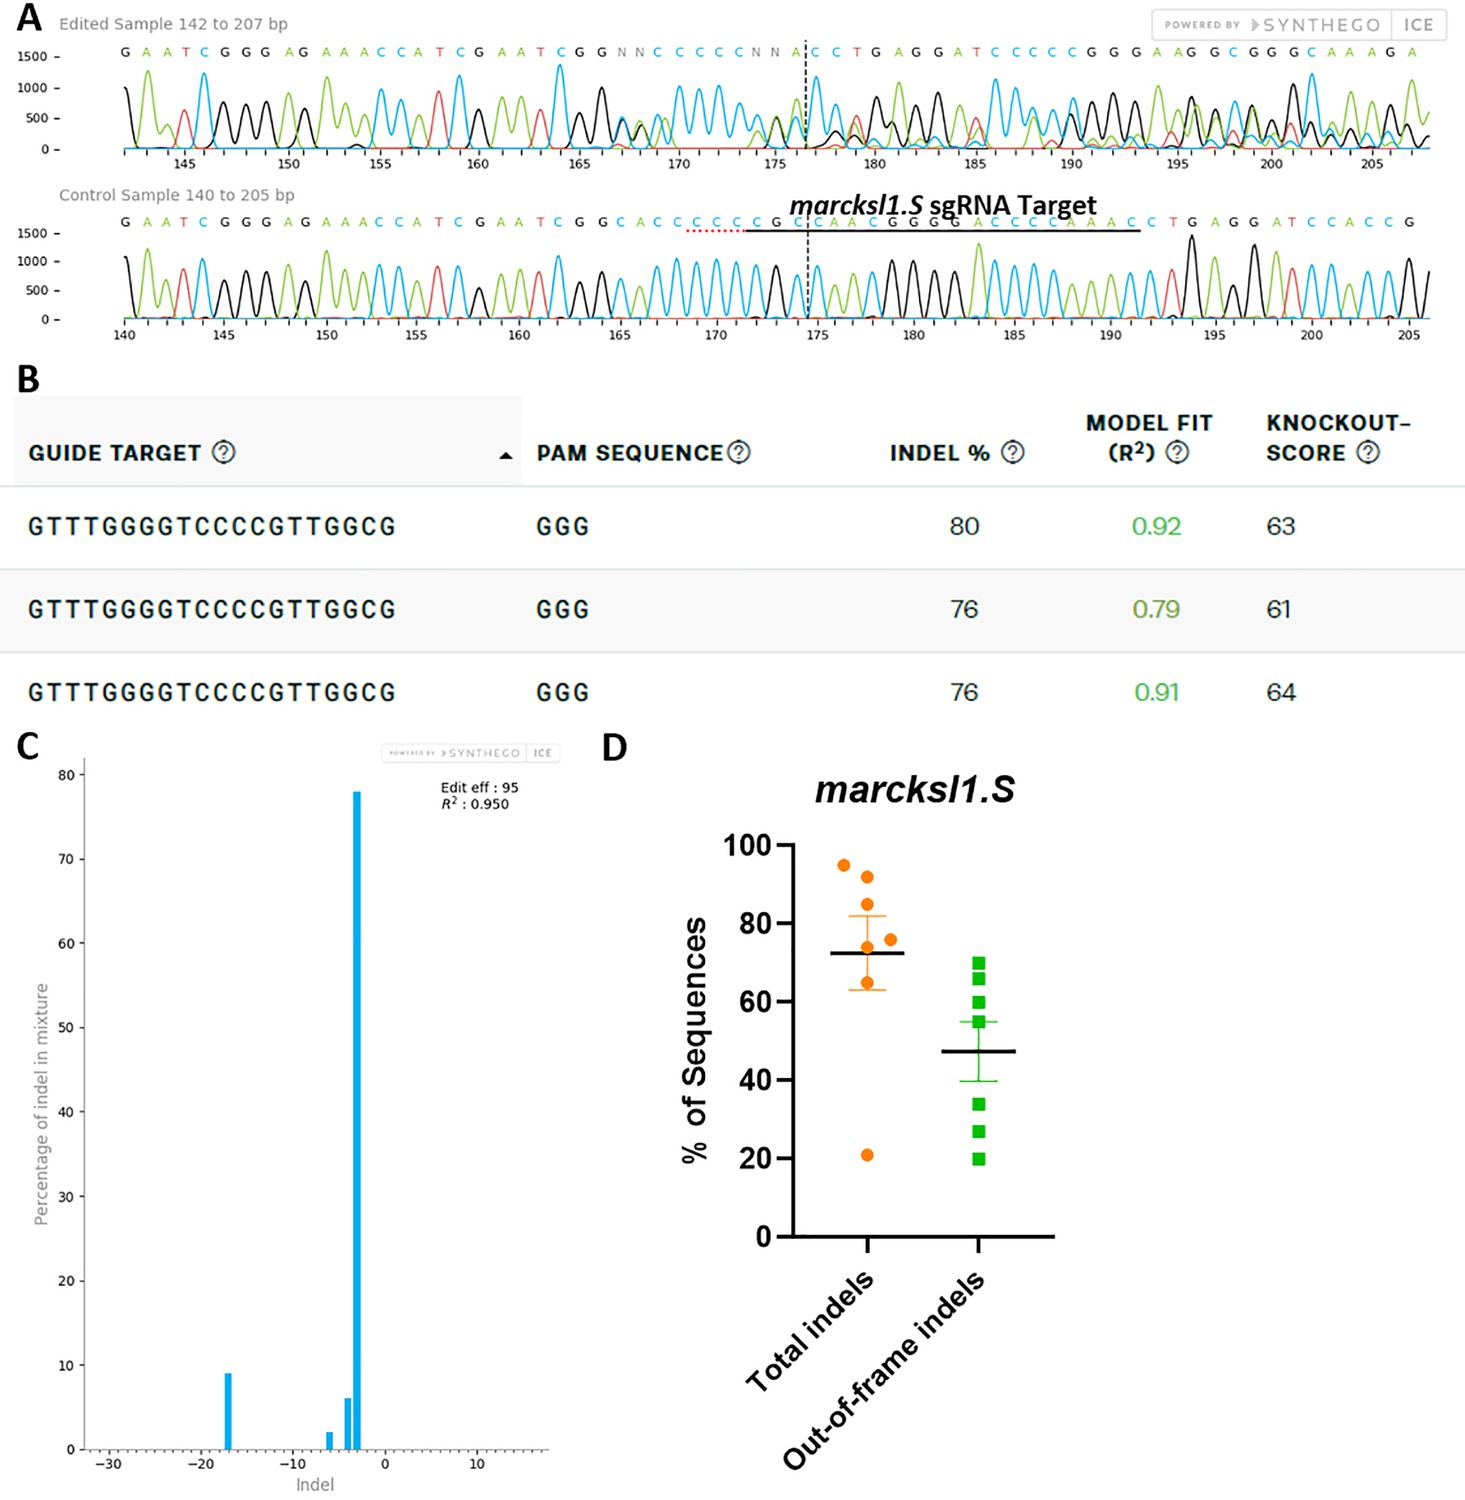
marcksl1.L/S sgRNA efficiently and specifically edits X. laevis marcksl1.S DNA.
All data were generated by the Synthego Inference for CRISPR Edits (ICE) tool based on DNA samples from stage 26–42 embryos injected with marcks.L/S and marcksl1.L/S sgRNA, Cas9 protein, and myc-GFP mRNA during the 1-cell stage in comparison with uninjected embryos. (A) Sanger sequence chromatograms showing degradation of the sequence trace from PCR products amplifying CRISPR-targeted marcksl1.S exon 2 DNA (top) compared with DNA from an uninjected embryo (bottom). The underlined region indicates the sgRNA target binding sequence. (B) Summary of three analyzed samples showing the sgRNA target and PAM sequence. Indel scores for DNA sequences derived from three CRISPR-edited embryos compared with uninjected embryos, indicating that 76% and 80% of the DNA analyzed were edited. Knockout scores of 61%, 63%, and 64% indicate the proportion of indels that contain a frameshift mutation. (C) Synthego Indel Distribution plot from one representative CRISPR-embryo, which infers the distribution of insertion–deletion sizes (±1 or more nucleotides) around the marcksl1.S CRISPR-target site. The x-axis indicates the size of the indel, and the y-axis shows the percentage of the sequences containing it. The editing efficiency score indicates that 95% of the DNA in the CRISPR-targeted sequence was edited with mostly a three-base-pair deletion. A Pearson correlation coefficient (R2) was also generated by ICE with a value of 0.95 out of 1, measuring how well the indel distribution fits the Sanger sequence data. (D) Indel percentages calculated by ICE for seven CRISPR-edited embryos, indicating that an average of 73% of the DNA was edited for all animals. From this edited DNA, 47% contained out-of-frame mutations.
Figure 2—figure supplement 7
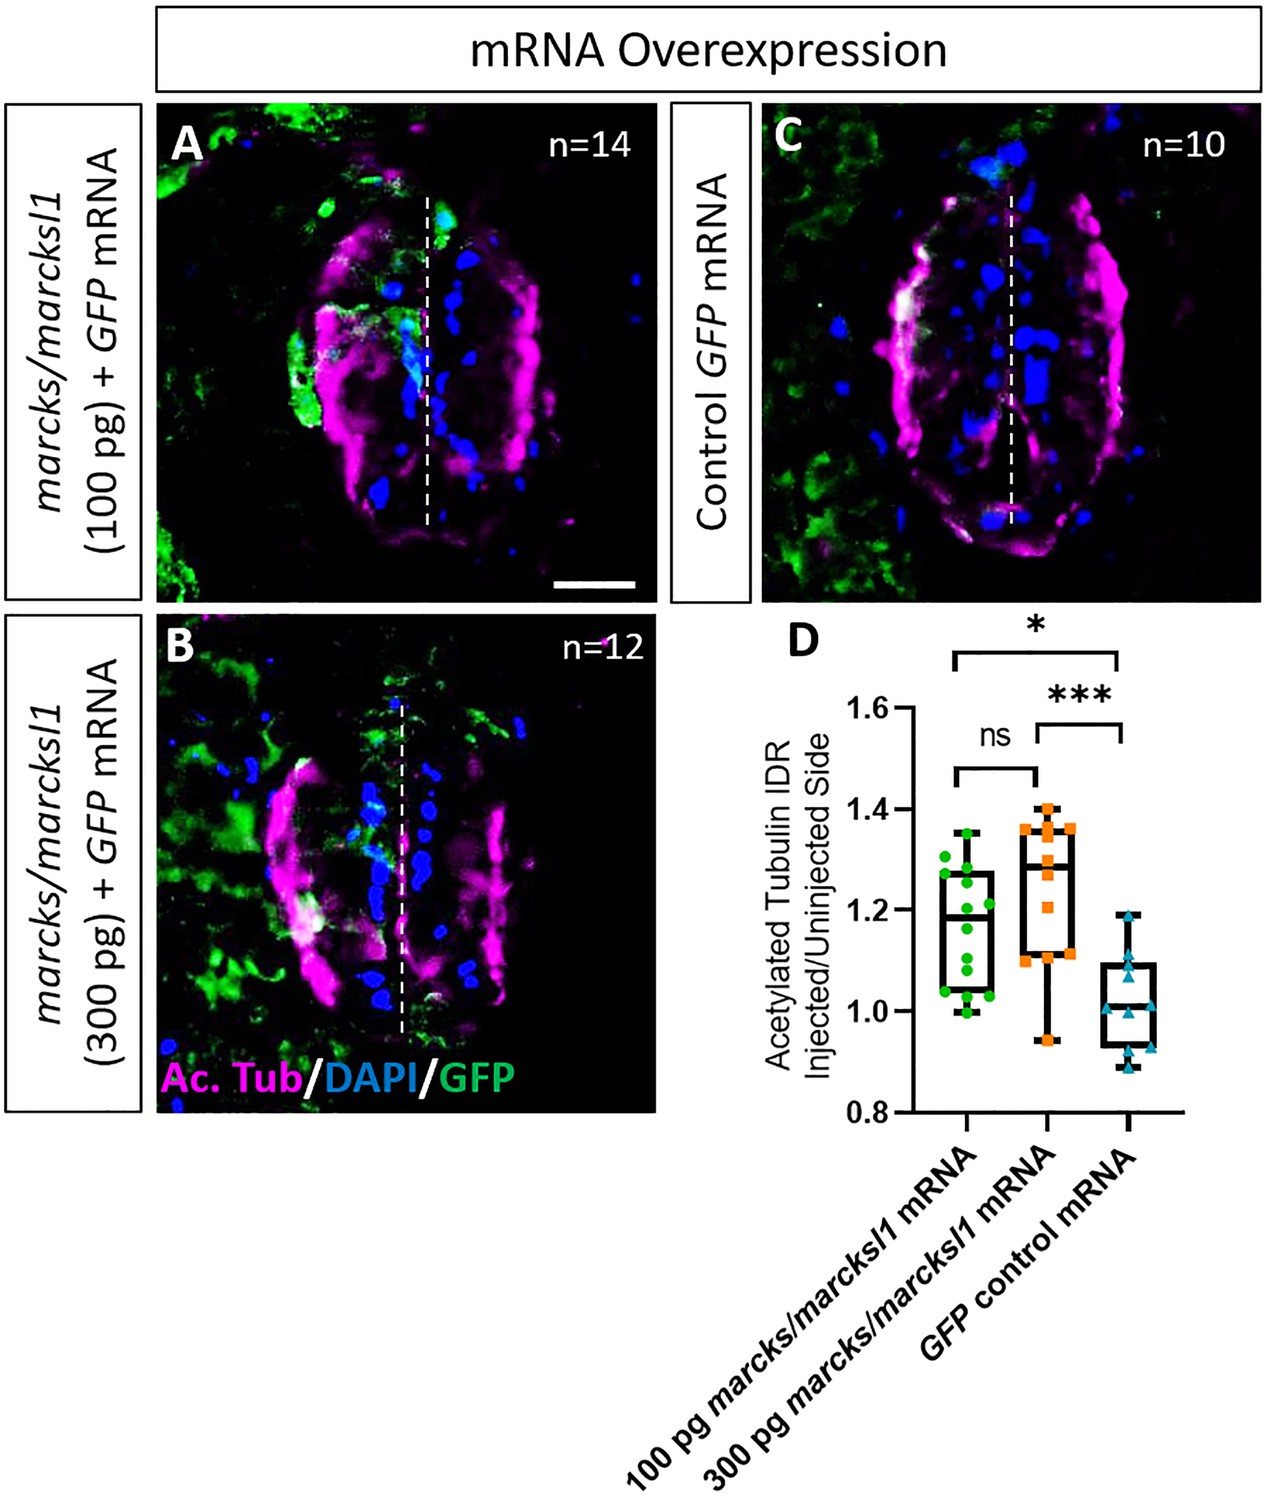
Marcks and Marcksl1 overexpression promotes neurite outgrowth during Xenopus spinal cord development.
A dorsal blastomere of 4- to 8-cell stage embryos was co-injected with 100 pg (A) and 300 pg (B) of each marcks.S, marcksl1.L, and marcksl1.S mRNA in addition to 125 pg myc-GFP mRNA. In control embryos, 125 pg myc-GFP mRNA was injected (C). Injected (left) and uninjected (right) spinal cord sides of stage 34–36 embryos (separated by the dashed line) were compared in transverse sections immunostained for acetylated tubulin (A–C) and for GFP to determine the injected side. Compared to control embryos, immunostaining for acetylated tubulin was quantified (D) by determining the integrated density ratio (IDR) of staining in injected to uninjected sides. Significance was determined using an ordinary one-way ANOVA with Tukey’s multiple comparisons test. NS, not significant; *p < 0.05; ***p < 0.001. Error bars represent minimum to maximum values showing all points with the line at mean. n refers to the number of animals analyzed. Scale bar in A = 25 µm (for all panels).
Figure 3 with 1 supplement
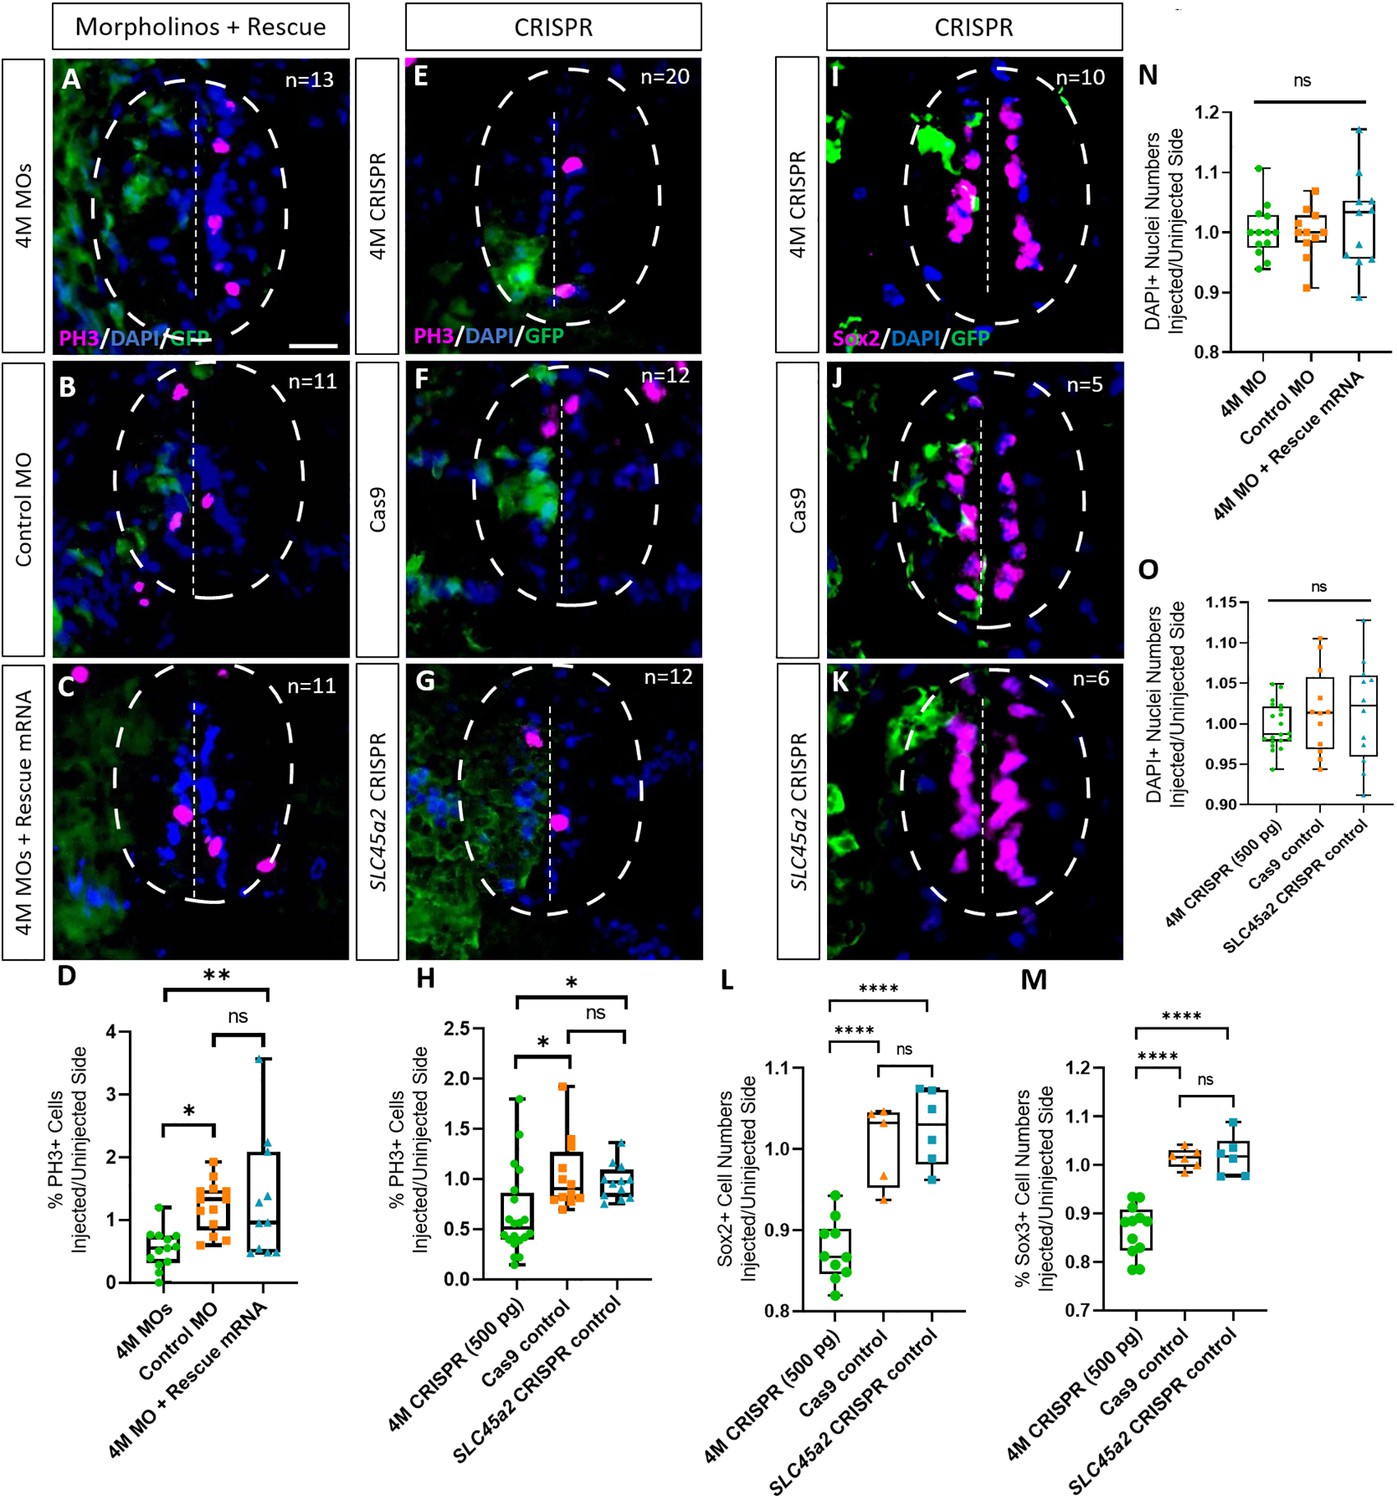
Marcks and Marcksl1 are required for the proliferation of neuro-glial progenitors during Xenopus spinal cord development.
Evaluation of mitotic activity (A–H), number of neuro-glial progenitors (I–M), and total cell numbers (N, O) after loss of function of all four homeologs (marcks.S, marcks.L, marcksl1.S, and marcksl1.L) by MO knockdown (4M MO) or CRISPR gene editing (4M CRISPR). A dorsal blastomere of 4- to 8-cell stage embryos was co-injected with 9 ng of each MO (marcks.S, marcksl1.L, and marcksl1.S MO) (A, D); 27 ng standard control MO (B, D); 9 ng of each MO plus 300 pg of mutated chicken marcks and 350 pg of mutated X. tropicalis marcksl1 rescue mRNA constructs encoding T7 and 6-His tags (C, D, N); 500 pg of each single-guide RNA (marcks.L/S and marcksl1.L/S sgRNA) with 1 ng Cas9 protein (E, H, I); 1 ng Cas9 protein (F, H, J, L, M, O); or slc45a2 sgRNA and 1 ng Cas9 protein (G, H, K, L, M, O). All injections contained 125 pg of myc-GFP mRNA to identify the injected side. Injected (left) and uninjected (right) spinal cord sides (separated by the dashed line; spinal cord outlined with hatched line) were compared in transverse sections of stage 34–36 embryos immunostained for phospho-histone 3 (PH3) (A–C, E–G) or Sox2 (I–K) and for GFP, T7, and 6-His to determine the injected side. Mitotic or neuro-glial progenitor cells were quantified by determining the ratio of the percentage of PH3+ cells (D, H) and the numbers of Sox2+ (L) or Sox3+ (M) cells on injected and uninjected sides. DAPI+ nuclei were counted to quantify overall cell numbers (N, O). Significance was determined using an ordinary one-way ANOVA with Tukey’s multiple comparisons test. NS, not significant; *p < 0.05; **p ≤ 0.01; ****p < 0.0001. Error bars represent minimum to maximum values showing all points with the line at median. n refers to the number of animals analyzed. Scale bar in A = 25 µm (for all panels).
Figure 3—figure supplement 1
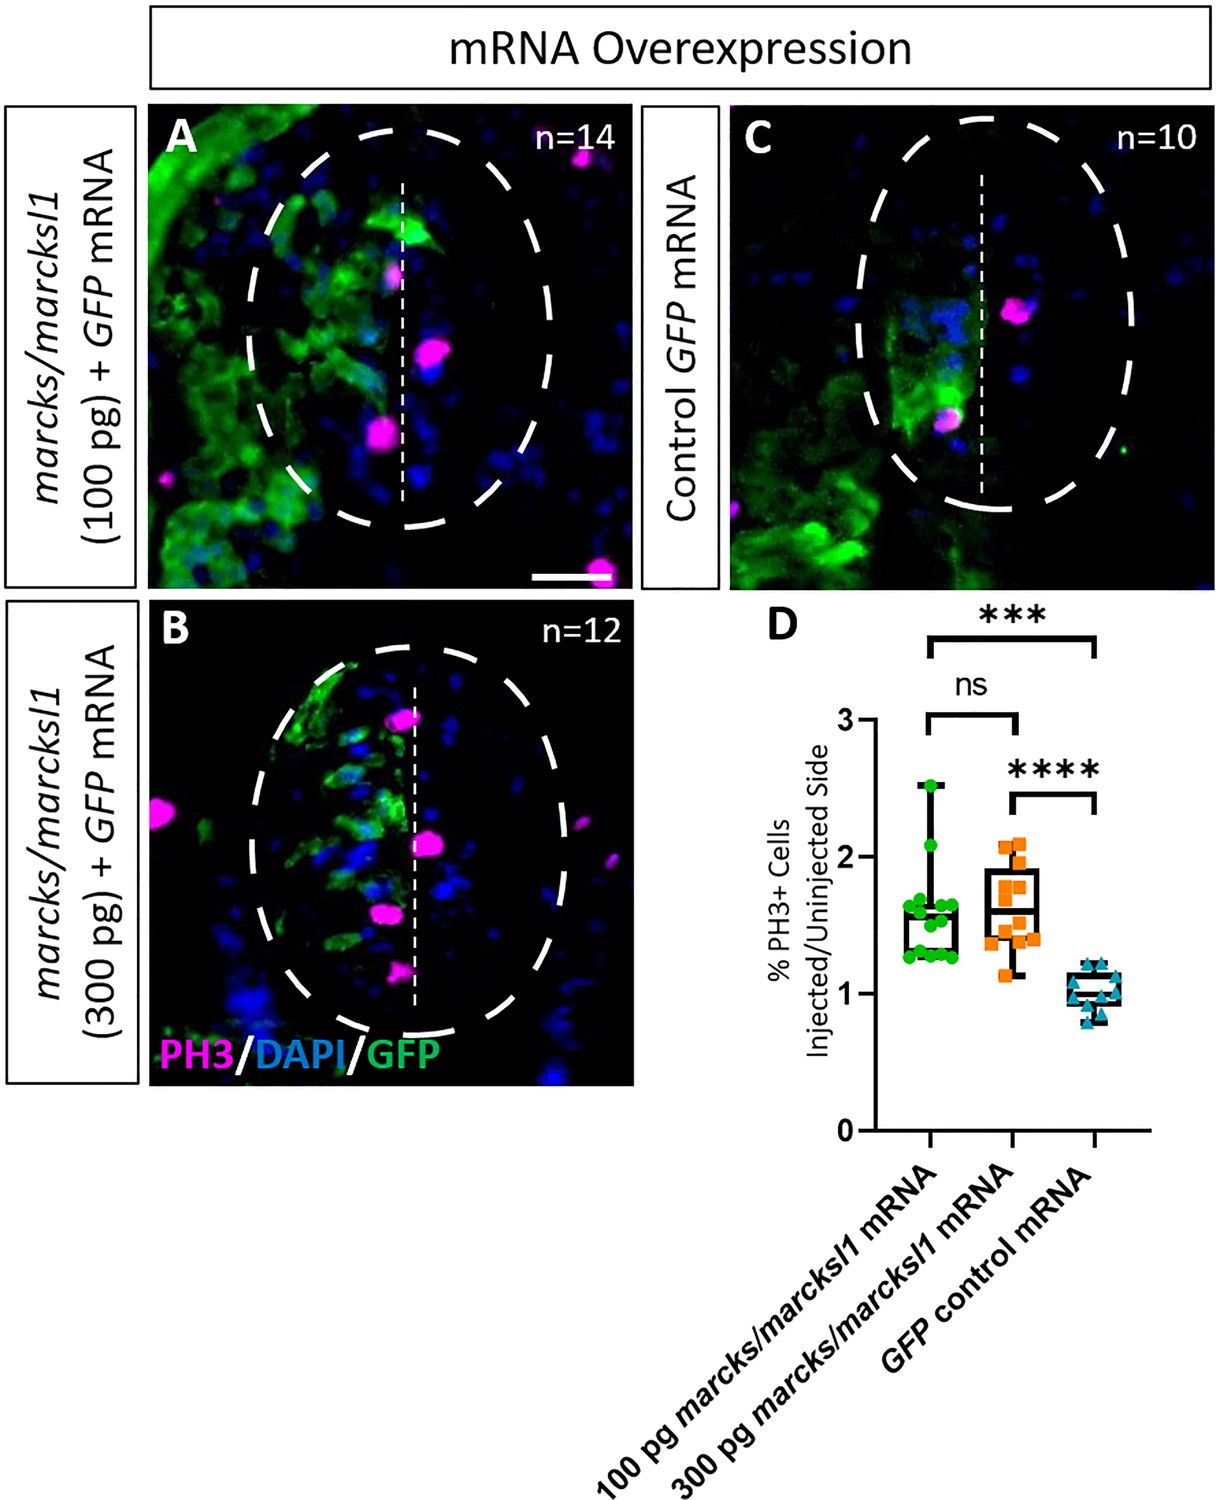
Marcks and Marcksl1 overexpression promotes mitotic activity during Xenopus spinal cord development.
A dorsal blastomere of 4- to 8-cell stage embryos was co-injected with 100 pg (A) and 300 pg (B) of each marcks.S, marcksl1.L, and marcksl1.S mRNA in addition to 125 pg myc-GFP mRNA. In control embryos, 125 pg myc-GFP mRNA was injected (C). Injected (left) and uninjected (right) spinal cord sides of stage 34–36 embryos (separated by the dashed line; spinal cord outlined with hatched line) were compared in transverse sections immunostained for PH3 (A–C) and for GFP to determine the injected side. Immunostaining for acetylated tubulin was quantified (D) by determining the ratio of the percentage of PH3+ cells in injected and uninjected sides in comparison with control embryos. Significance was determined using an ordinary one-way ANOVA with Tukey’s multiple comparisons test. NS, not significant; ***p < 0.001; ****p < 0.0001. Error bars represent minimum to maximum values showing all points with the line at the mean. n refers to the number of animals analyzed. Scale bar in A = 25 µm (for all panels).
Figure 4 with 1 supplement
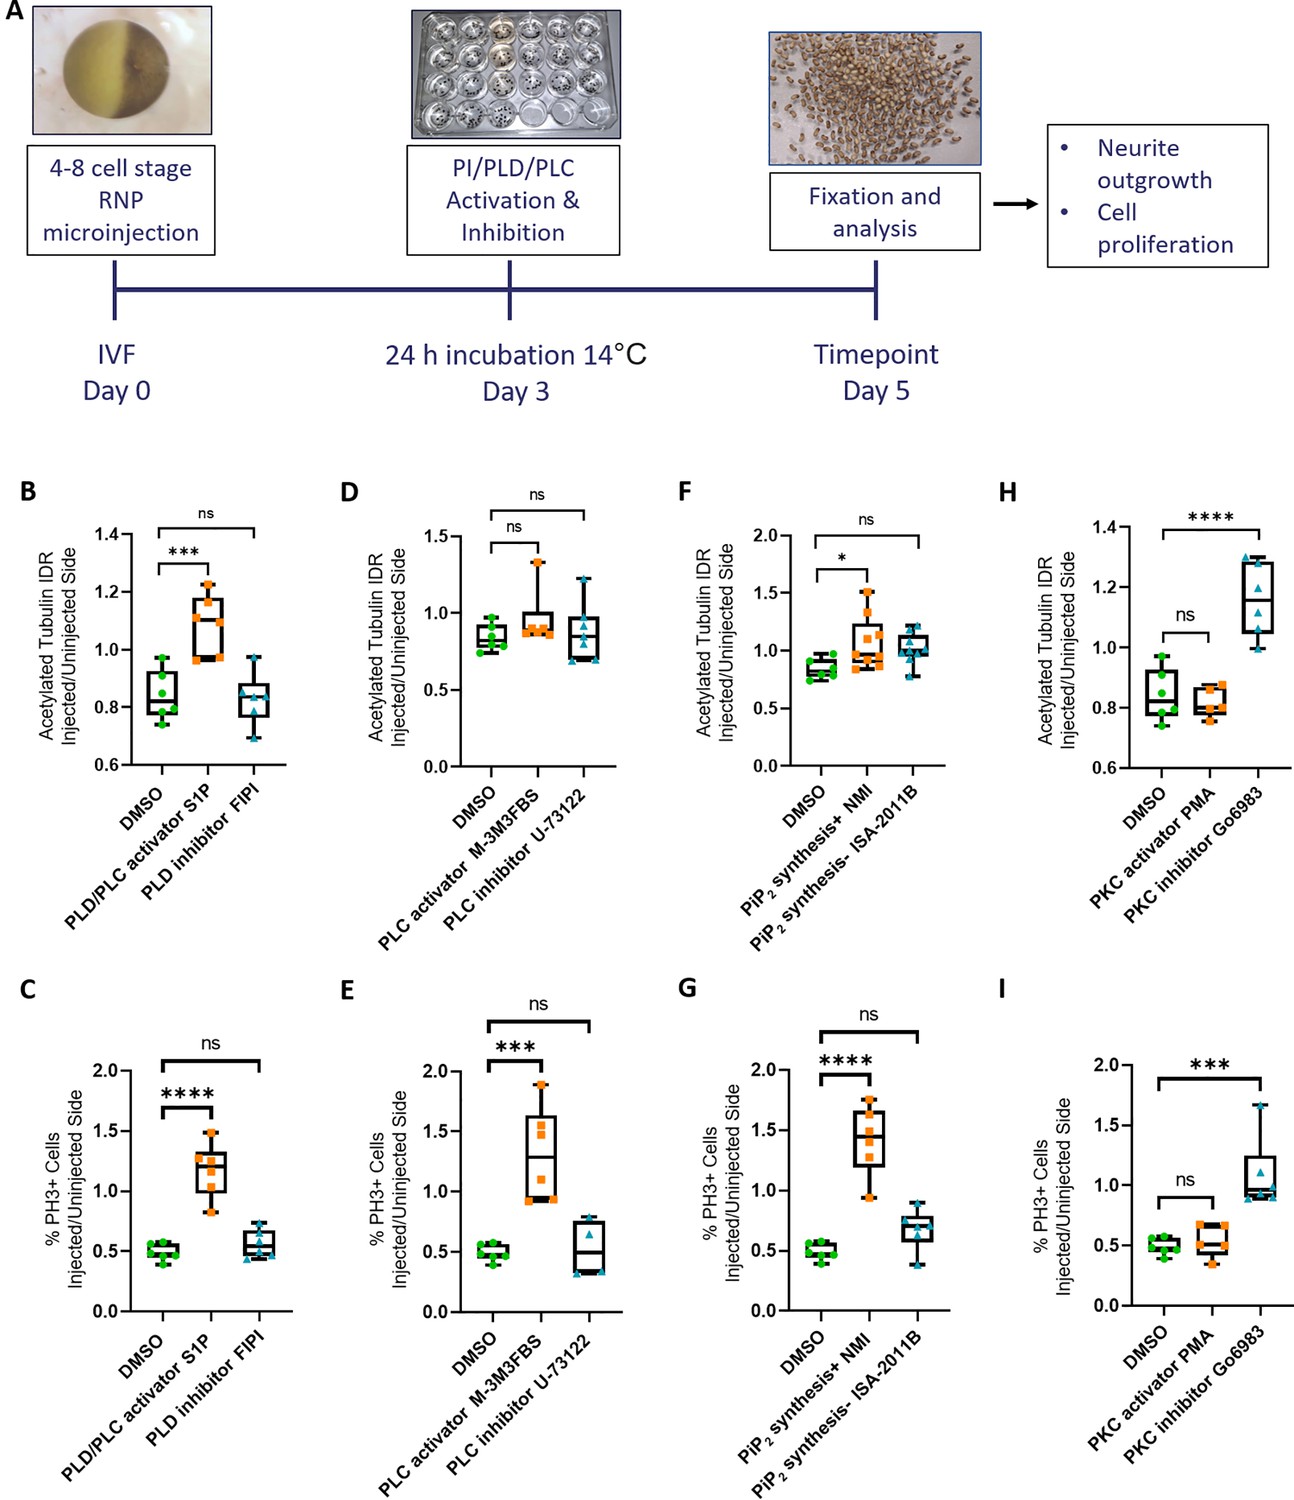
Rescue of Marcks and Marcksl1 knockout phenotype by activating phospholipid signaling.
(A) Experimental flow of the pharmacological study. A dorsal blastomere of 4- to 8-cell stage embryos was co-injected with 500 pg of each single-guide RNA (marcks.L/S and marcksl1.L/S sgRNA), 1 ng Cas9 protein and 125 pg myc-GFP mRNA to mutate all four homeologs (4M CRISPR). Embryos were then incubated in compounds modulating phospholipase D (PLD)/phospholipase C (PLC) signaling (B, C), PLC signaling (D, E), PIP2 synthesis (F, G), or protein kinase C (PKC) activity (H, I) and analyzed for neurite density (integrated density ratio or integrated density ratio (IDR) of acetylated tubulin on injected versus uninjected sides) and mitotic activity (ratio of the proportion of PH3+ cells on injected versus uninjected sides). Significance was determined using an ordinary one-way ANOVA with Dunnett’s multiple comparisons test. NS, not significant; *p < 0.05; ***p < 0.001; ****p < 0.0001. Error bars represent minimum to maximum values showing all points with the line at the median. Neurite density and mitotic activity were significantly increased (rescued) in the spinal cord of 4M-CRISPR embryos by activators of phospholipid signaling, enhancers of PIP2 synthesis, and PKC inhibitors. In contrast, inhibitors of phospholipid signaling, inhibitors of PIP2 synthesis, and PKC activators had no effect.
Figure 4—figure supplement 1
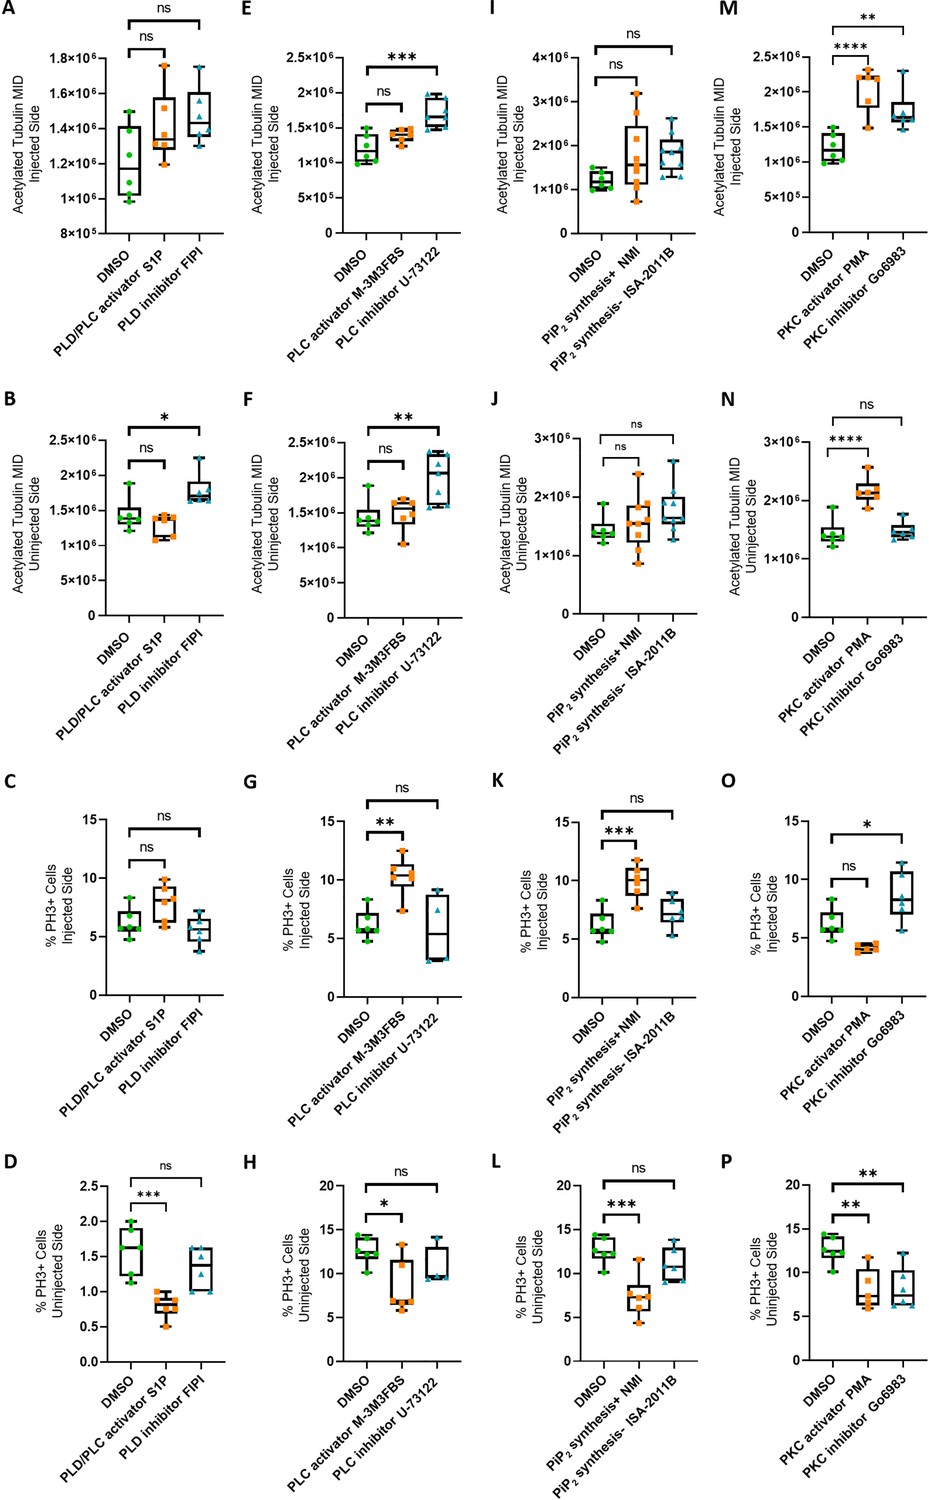
Efects of modulation of phospholipid signaling on uninjected and 4M CRISPR-injected spinal cord.
The data shown in Figure 4 as ratio of injected/uninjected sides are depicted here separately for injected (first and third rows) and uninjected sides (second and fourth rows) for acetylated tubulin staining of neurites (upper two rows) and percent of PH3-positive (mitotic) nuclei (lower two rows). A dorsal blastomere of 4- to 8-cell stage embryos was co-injected with 500 pg of each single-guide RNA (marcks.L/S and marcksl1.L/S sgRNA), 1 ng Cas9 protein and 125 pg myc-GFP mRNA to mutate all four homeologs (4M CRISPR). Embryos were then incubated in compounds modulating phospholipase D (PLD)/phospholipase C (PLC) signaling (A–D), PLC signaling (E–H), PIP2 synthesis (I–L), or protein kinase C (PKC) activity (M–P) and analyzed for neurite immunostaining (mean integrated density or MID of acetylated tubulin) and mitotic activity (percentage of PH3+ cells). Significance was determined using an ordinary one-way ANOVA with Dunnett’s multiple comparisons test. NS, not significant; *p < 0.05; **p ≤ 0.01; ***p < 0.001; ****p < 0.0001. Error bars represent minimum to maximum values showing all points with the line at the median. n refers to the number of animals analyzed.
Figure 5 with 2 supplements
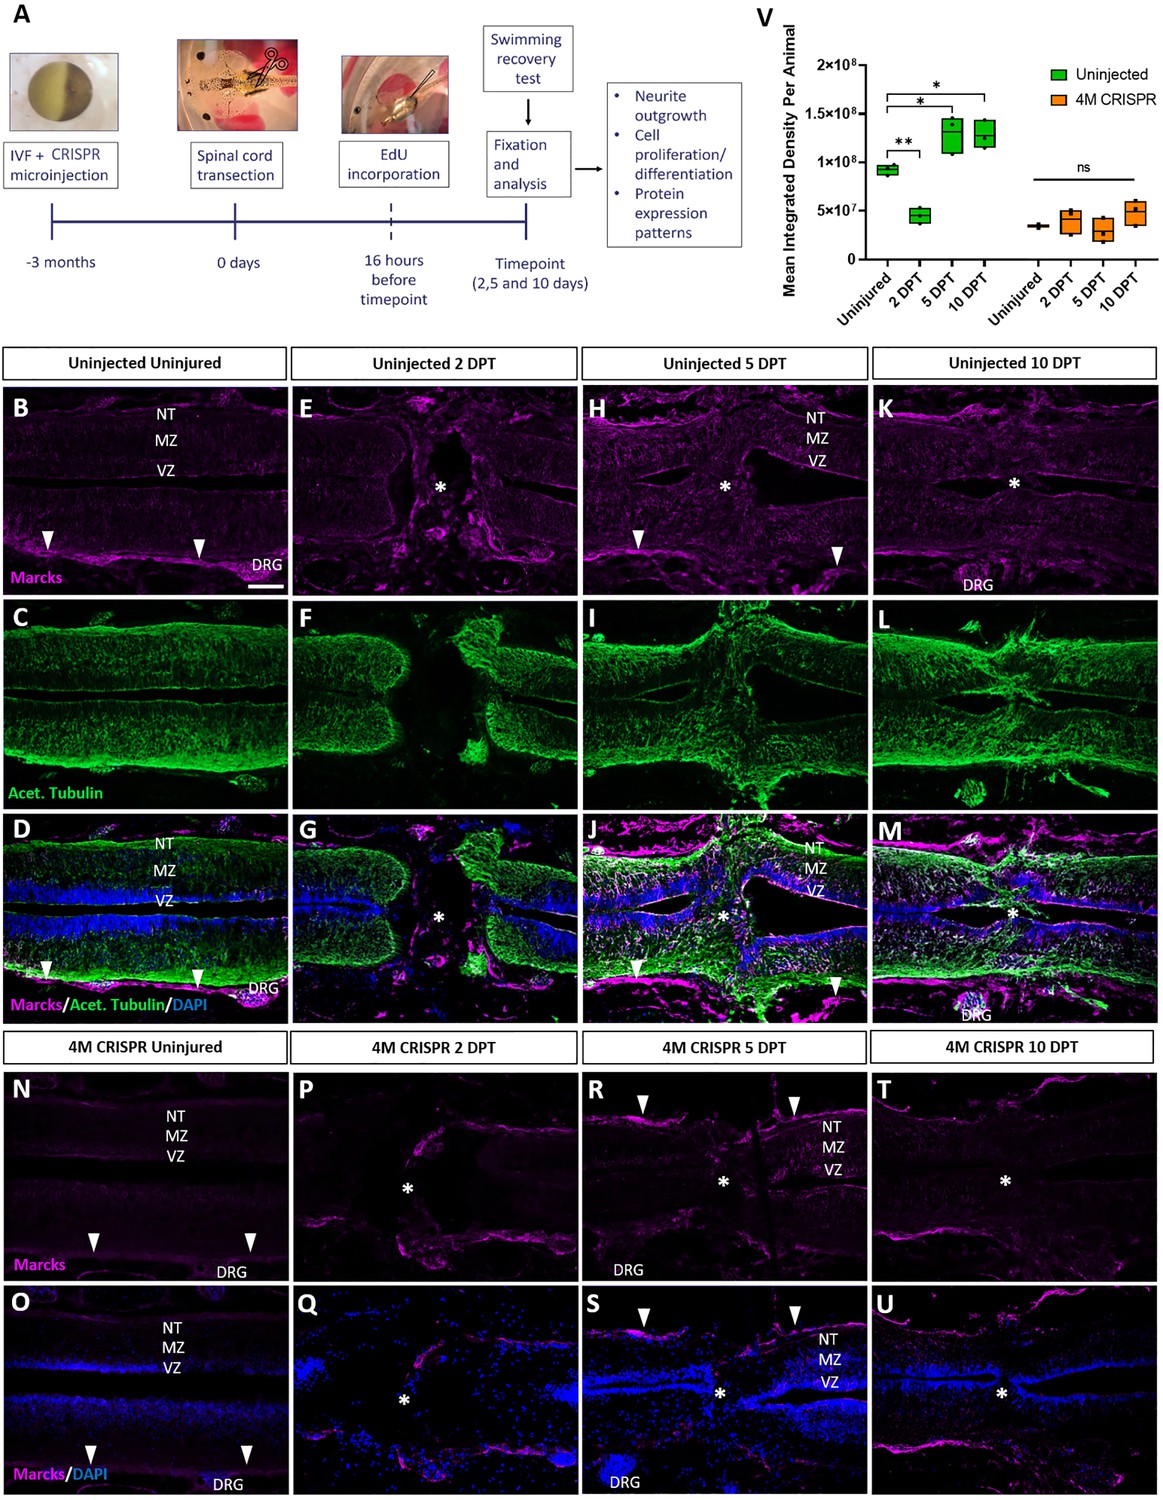
Upregulation of Marcks proteins after spinal cord transection is abolished in F0-CRISPants of Marcks and Marcksl1.
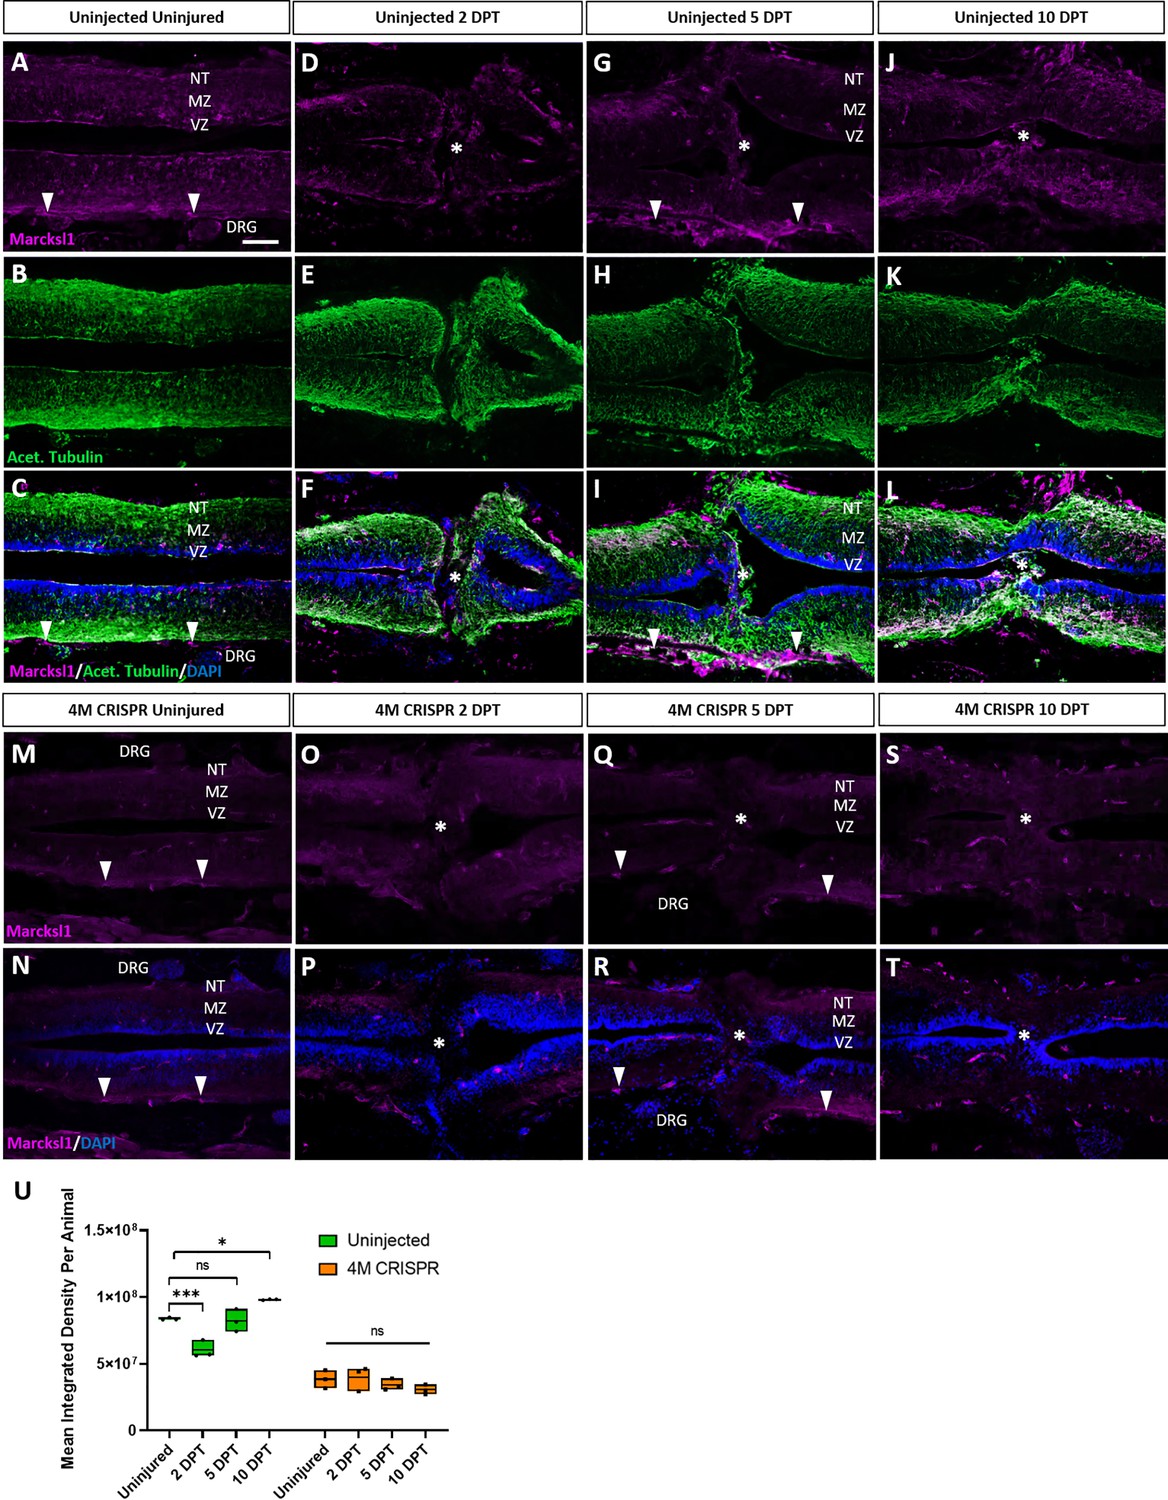
(A) Experimental flow of the spinal cord injury study. One-cell stage embryos were injected with CRISPR constructs targeting all homeologs of Marcks and Marcksl1. After approximately 3 months, the spinal cords of uninjected and CRISPR tadpoles (stage 50) were transected. Tadpoles underwent a swimming recovery test at 2-, 5-, and 10-day post transection (DPT). They were analyzed by immunostaining for regenerative outcomes, including neurite outgrowth and injury gap closure, cell proliferation (after prior EdU injection), and neuro-glial progenitor markers. Immunostaining for Marcks in horizontal sections of uninjected stage 50 tadpoles without injury (B–D) or at 2 DPT (E–G), 5 DPT (H–J), and 10 DPT (K–M). Before the injury, Marcks immunostaining was weakly detected in the ventricular zone (VZ), mantle zone (MZ), and the neurite tracts (NT) of the marginal zone of the spinal cord as well as in the dorsal root ganglia (DRG) and meninges (white arrowheads). After spinal cord transection, it was upregulated in all layers of the spinal cord cells surrounding the injury gap and in cells infiltrating the injury site (white asterisks). Scale bar = 50 µm. N = 6 tadpoles per condition. Immunostaining for Marcks in horizontal sections of 4M CRISPR-injected stage 50 tadpoles without injury (N, O) or at 2 DPT (P, Q), 5 DPT (R, S), and 10 DPT (T, U). Barely any Marcks immunostaining is detectable at any time point. N = 6 tadpoles per condition. (V) Quantification of Marcks immunostaining. Significance was determined using an ordinary one-way ANOVA with Tukey’s multiple comparisons test. NS, not significant; *p < 0.05; **p ≤ 0.01. Error bars represent minimum to maximum values showing all points with the line at median. Scale bar in B = 50 µm (for all panels).
Figure 5—figure supplement 1
Marcksl1 proteins are upregulated after spinal cord transection in uninjected but not in 4M CRISPR-injected tadpoles.
Immunostaining for Marcksl1 in horizontal sections of uninjected stage 50 tadpoles without injury (A–C) or at 2 DPT (D–F), 5 DPT (G–I), and 10 DPT (J–L). Before the injury, Marcksl1 immunostaining was weakly detected in the ventricular zone (VZ), mantle zone (MZ), and the neurite tracts (NT) of the marginal zone of the spinal as well as in the meninges (white arrowheads) and dorsal root ganglia (DRG). After spinal cord transection, it was slightly upregulated in cells infiltrating the injury site (white asterisks) and in all layers of the spinal cord surrounding the injury gap at 10 DPT. N = 6 tadpoles per condition. Immunostaining for Marcksl1 in horizontal sections of 4M CRISPR-injected stage 50 tadpoles without injury (M, N) or at 2 DPT (O, P), 5 DPT (Q, R), and 10 DPT (S, T). Barely any Marcksl1 immunostaining is detectable at any time point. N = 6 tadpoles per condition. (U) Quantification of Marcksl1 immunostaining. Significance was determined using an ordinary one-way ANOVA with Tukey’s multiple comparisons test. NS, not significant; *p < 0.05; ***p ≤ 0.001. Error bars represent minimum to maximum values showing all points with the line at median. Scale bar in A = 50 µm (for all panels).
Figure 5—figure supplement 2
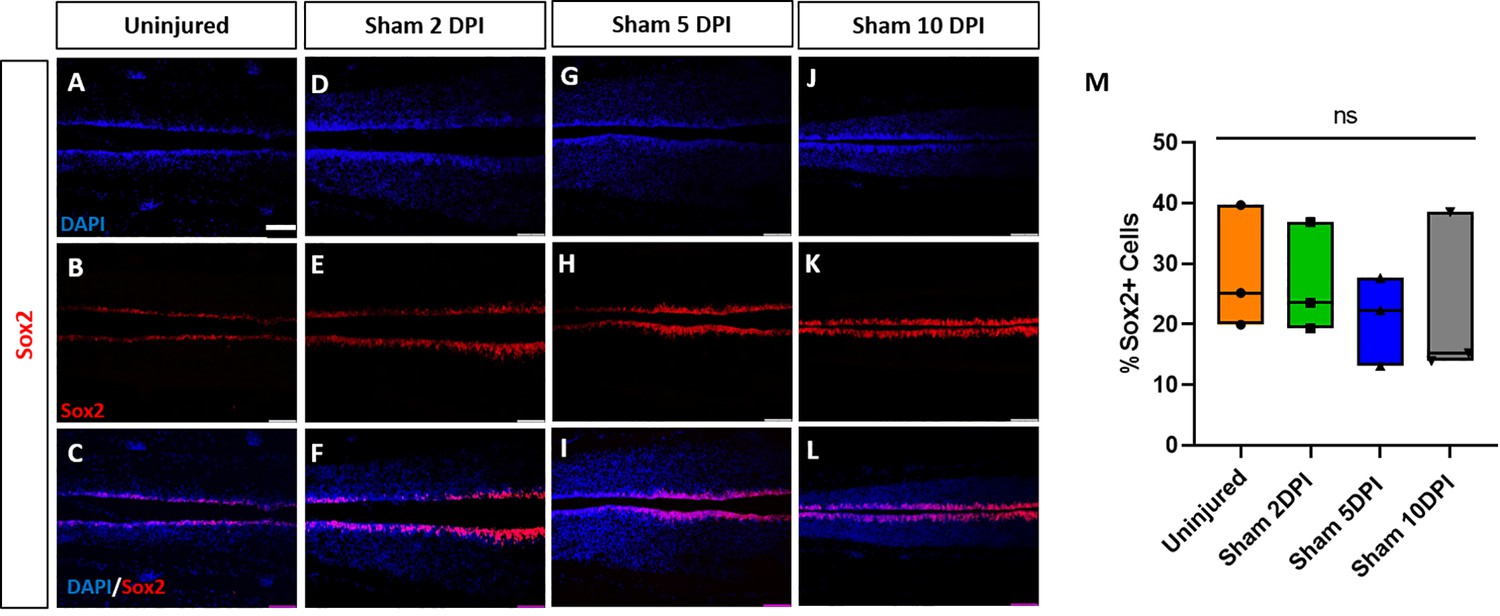
Marcks and Marcksl1 proteins do not change in uninjected sham-operated tadpoles.
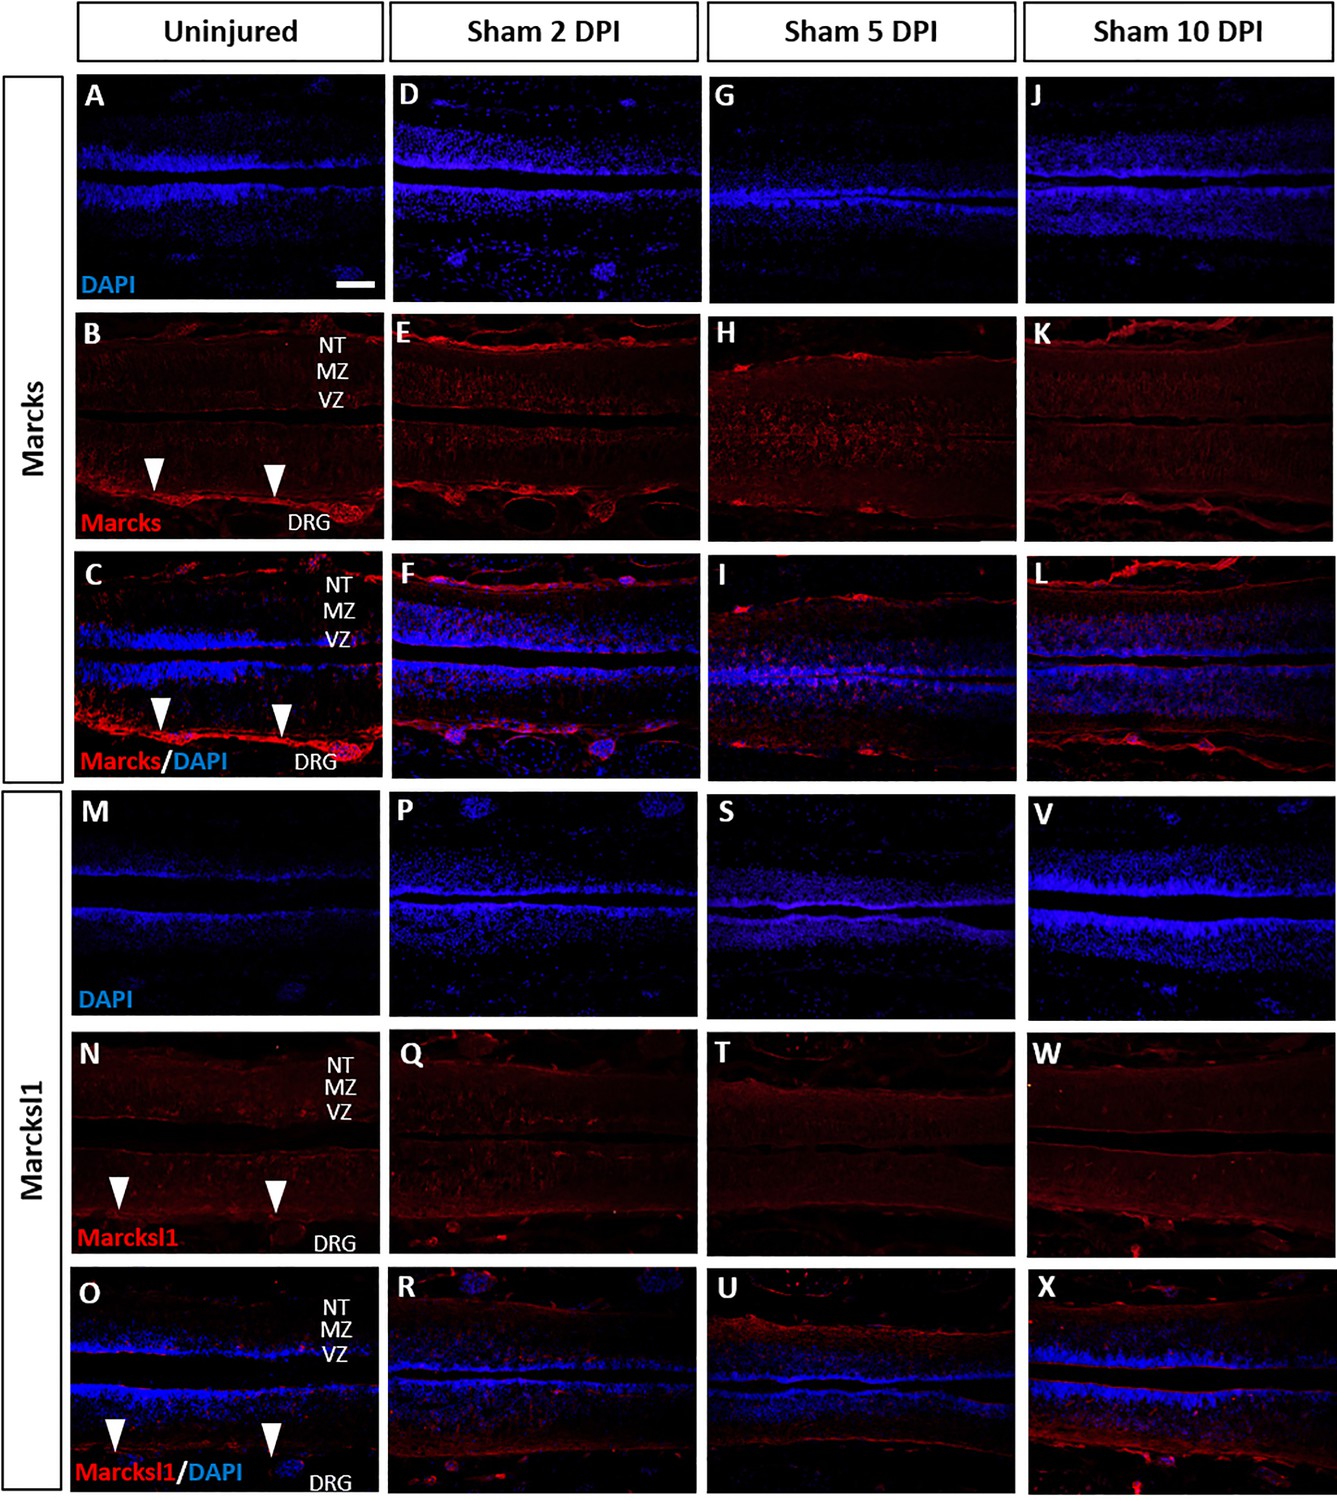
Immunostaining for Marcks (A–L) and Marcksl1 (M–X) in sham-operated tadpoles remained unaltered compared to the uninjured condition (A–C, M–O) at 2 days (D–F, P–R), 5 days (G–I, S–U), and 10 days (J–L, V–X) post-injury (DPI). N = 3 tadpoles per condition. White arrowheads indicate the meninges. Abbreviations: DRG: dorsal root ganglia; MZ: mantle zone; NT of the marginal zone; VZ: ventricular zone. Scale bar in A = 50 µm (for all panels).
Figure 6 with 1 supplement
Functional recovery and injury gap closure after spinal cord transection are compromised in F0-CRISPants of Marcks and Marcksl1.
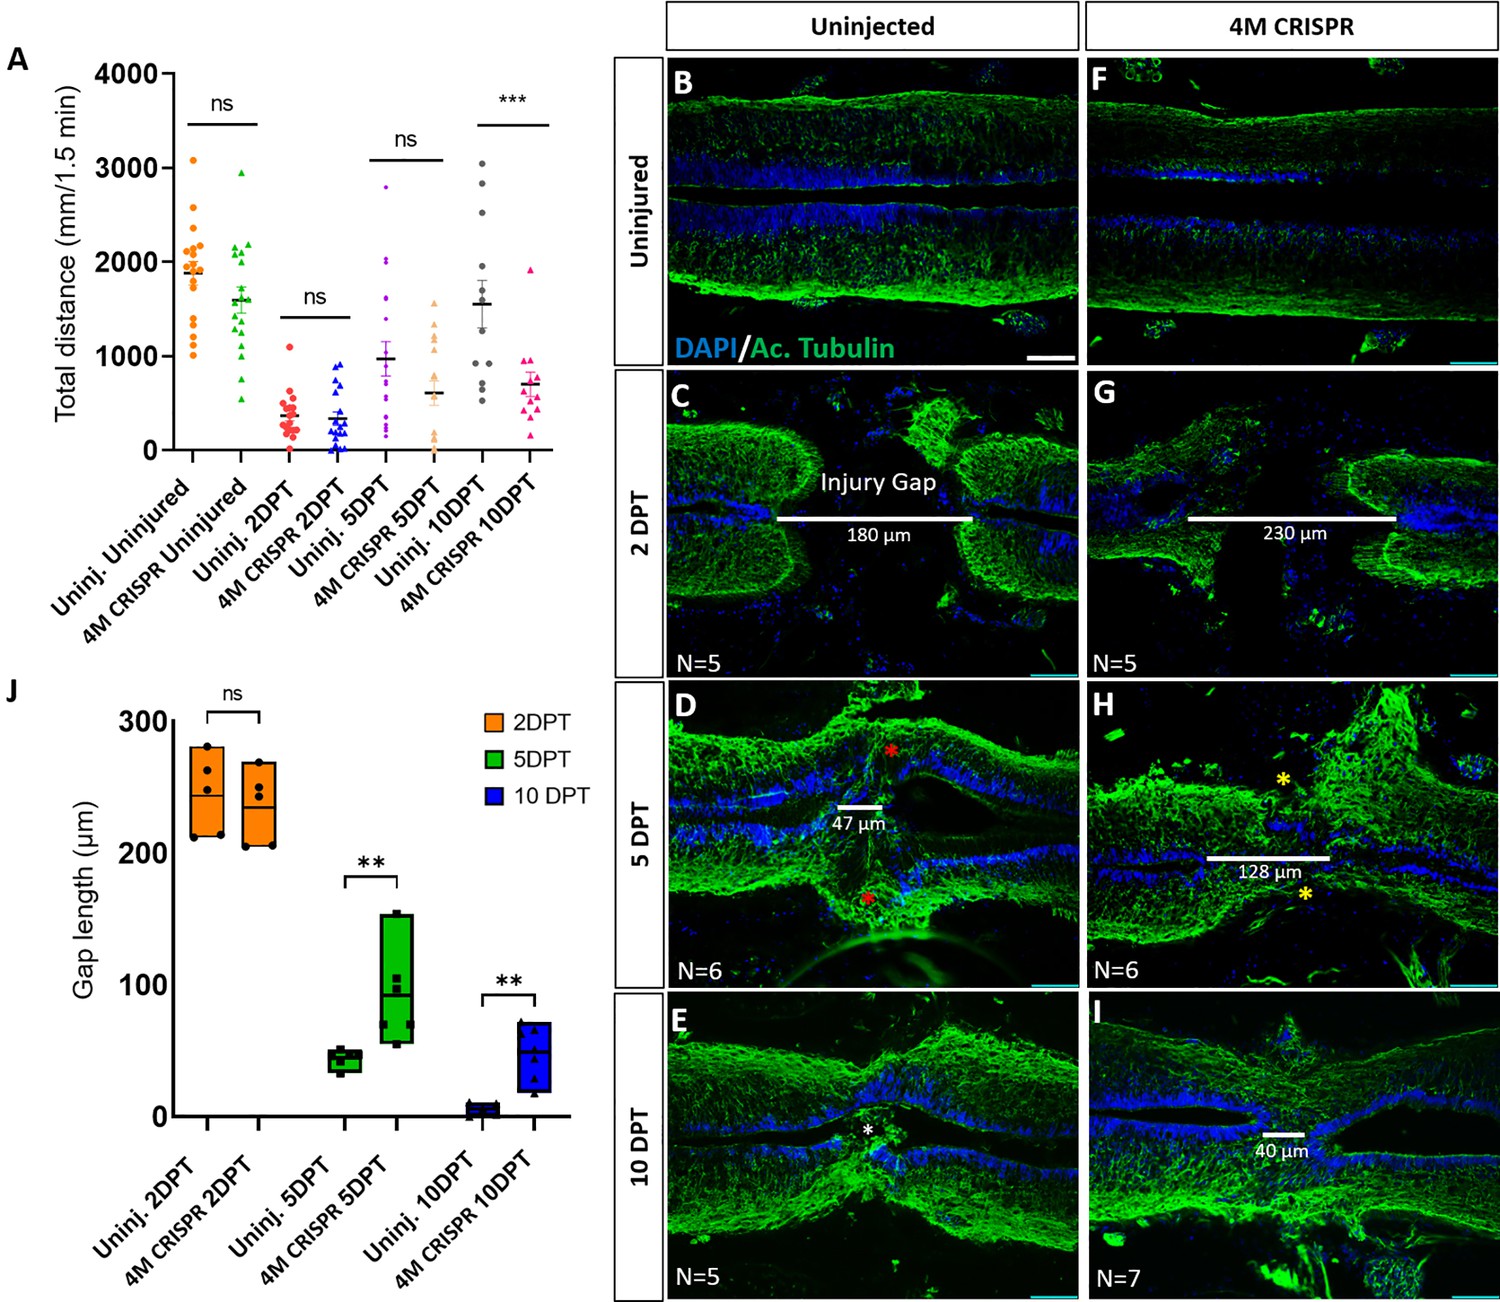
(A) Swimming recovery test in stage 50 tadpoles after spinal cord injury. The graph shows the total swimming distance in uninjected and 4M CRISPR-injected animals before the injury and at 2-, 5-, and 10-DPT. The y-axis indicates the distance traveled by the tadpoles in millimeters for 90 s. Significance was determined using an ordinary one-way ANOVA with an uncorrected Fisher’s least significant difference (LSD) test for multiple comparisons. NS, not significant; ***p < 0.001. All data points are shown with the line at mean with SEM. Error bars represent the standard error of the mean. (B–J) Comparison of injury gap closure between uninjected and 4M CRISPR-injected stage 50 tadpoles after spinal cord transection. Immunostaining for acetylated tubulin marking axonal tracts with 4′,6-diamidino-2-phenylindole (DAPI) marking nuclei in horizontal sections of the spinal cord (B–I) and quantification of injury gap length (J). Gap length was measured as the distance between the ventricular zones of rostral and caudal spinal cord stumps, as indicated by the white lines. At 2 DPT, an injury gap is visible in uninjected (C) and 4M CRISPR-injected (G) tadpoles. Axonal bridges connecting the rostral and caudal injury gap in the uninjected tadpoles at 5 DPT (red asterisks) are absent in the 4M CRISPR animals (yellow asterisks). The central canal in uninjected tadpoles becomes continuous at 10 DPT (E), in contrast to the 4M CRISPR-injected tadpoles (I). Significance was determined using a two-way ANOVA with uncorrected Fisher’s LSD of multiple comparisons. NS, not significant; **p ≤ 0.01. All data points are shown with the line at the mean. Scale bar in B = 50 µm (for B–I).
Figure 6—figure supplement 1
Functional recovery after spinal cord transection is compromised in F0-CRISPants of Marcks and Marcksl1.
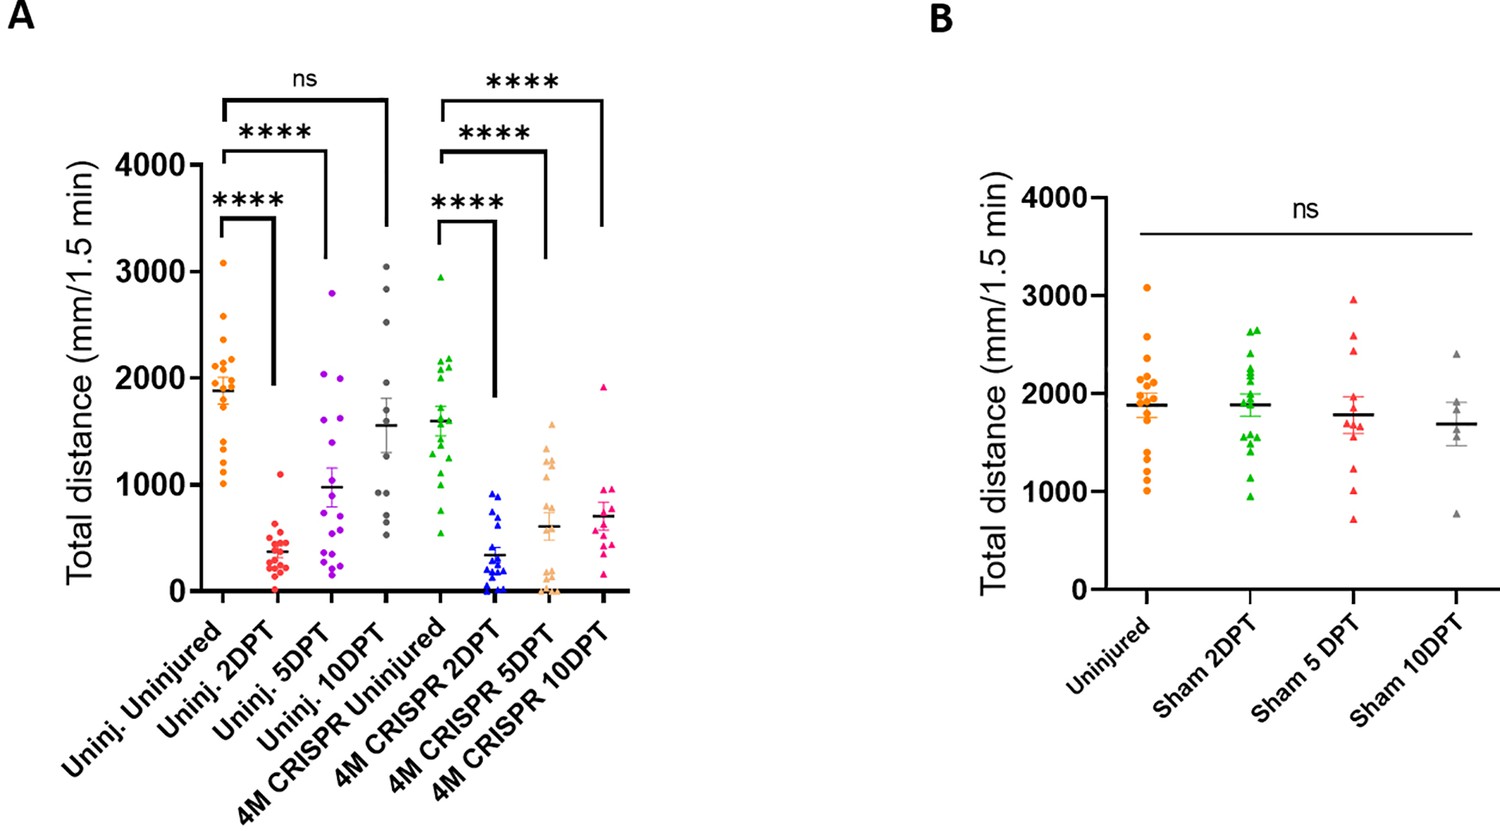
(A) Swimming recovery test in stage 50 wild-type and CRISPR tadpoles after spinal cord injury. The graph shows the total swimming distance in uninjected and 4M CRISPR-injected animals before the injury and at 2-, 5-, and 10-DPT. The y-axis indicates the distance traveled by the tadpoles in millimeters for 90 s (same data as in Figure 6A but different statistical comparison). Significance was determined using an ordinary one-way ANOVA with uncorrected Fisher’s least significant difference (LSD) for multiple comparisons. NS, not significant; ****p < 0.0001. All data points are shown with the line at mean. Error bars represent SEM. (B) Swimming test in stage 50 sham-operated tadpoles reveals no effect on swimming performance. The graph shows the total swimming distance before the injury and 2-, 5-, and 10-day post-sham-injury (DPI). Significance was determined using an ordinary one-way ANOVA with uncorrected Fisher’s LSD for multiple comparisons. NS, not significant. All data points are shown with the line at mean. Error bars represent SEM.
Figure 7 with 2 supplements
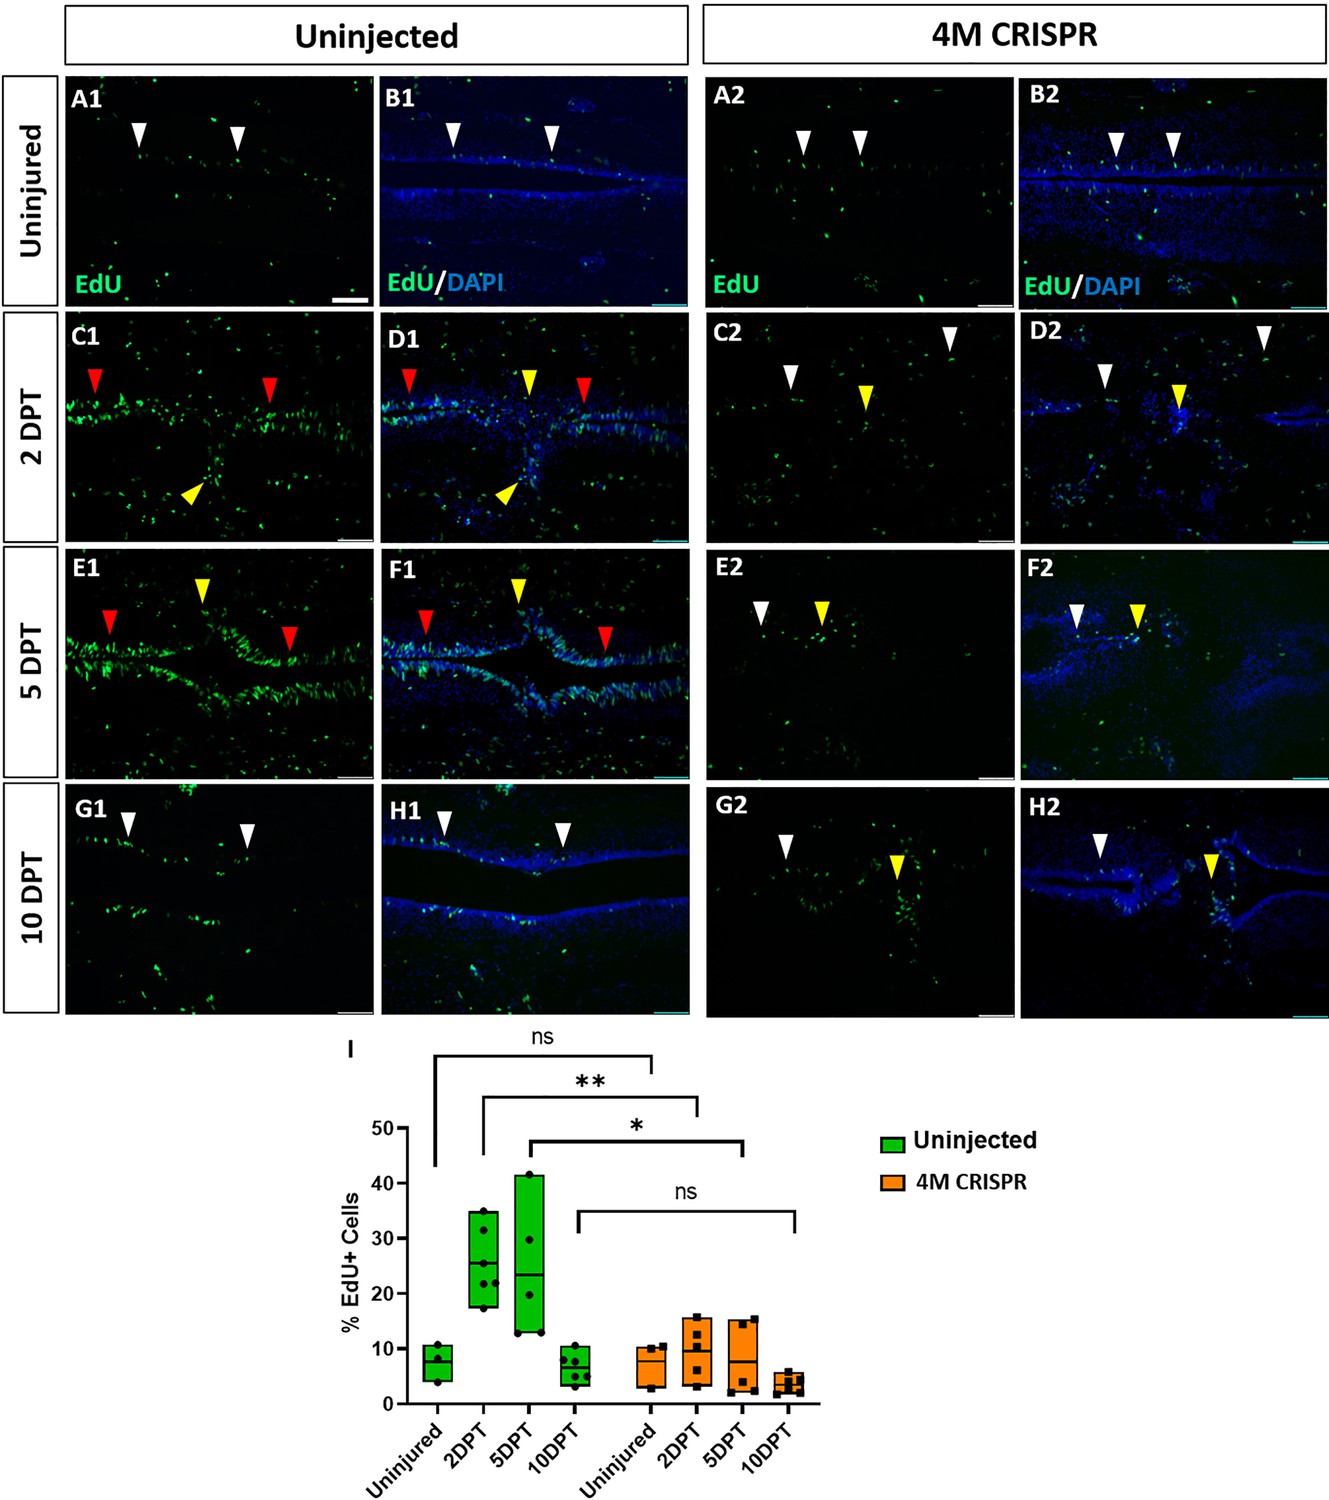
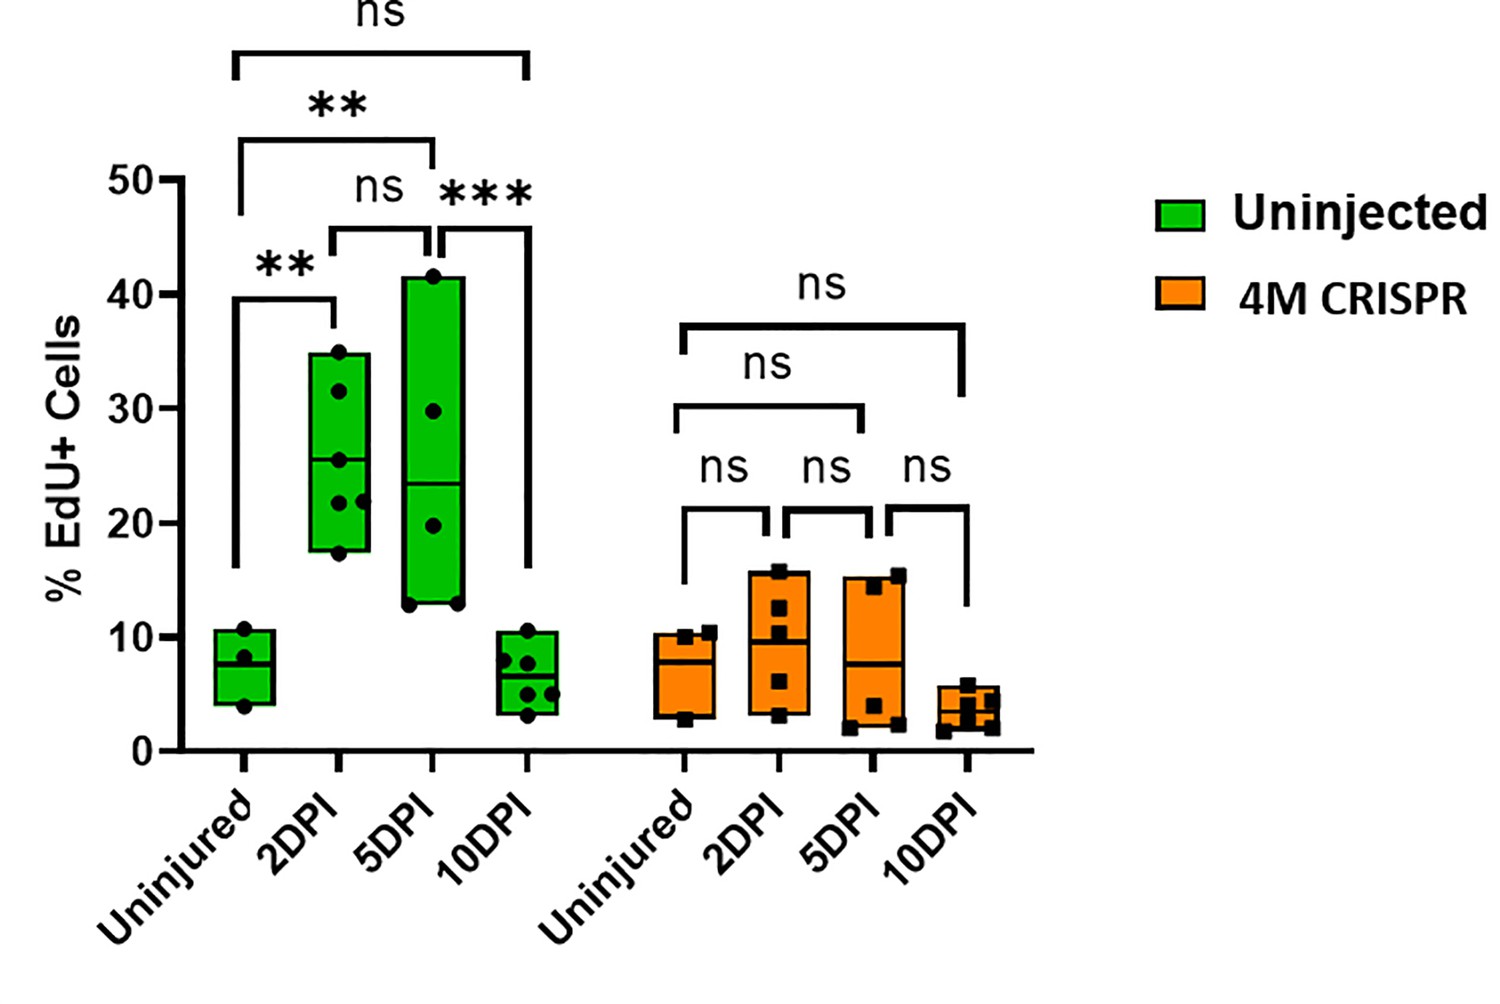
Upregulation of cell proliferation after spinal cord transection is compromised in F0-CRISPants of Marcks and Marcksl1.
(A–H) Evaluation of EdU+ proliferative cells at 2-, 5-, and 10-DPT in horizontal sections of uninjected (A1–H1) and 4M CRISPR-injected tadpoles (A2–H2) at stage 50 (A–H) and quantification of the average proportion of EdU+ cells in a defined window of the spinal cord adjacent to the injury site (I). White and red arrowheads indicate preinjury and elevated levels of EdU+ cells in the ventricular zone, respectively. Yellow arrowheads indicate EdU+ cells in and adjacent to the injury gap. Note the increase in EdU+ cells at 2 DPT and 5 DPT in uninjected (C1–F1, I) but not 4M CRISPR-injected (C2–F2, I) tadpoles. Significance was determined using a two-way ANOVA with Sidak’s multiple comparisons test. NS, not significant; *p < 0.05; **p ≤ 0.01. All data points are shown with the line at mean. Scale bar in A1 = 50 µm (for all panels).
Figure 7—figure supplement 1
Upregulation of cell proliferation after spinal cord transection is compromised in F0-CRISPants of Marcks and Marcksl1.
Quantification of EdU+ cells at 2-, 5-, and 10-DPI in sham-operated tadpoles at stage 50 (same data as in Figure 7I but different statistical comparison). Significance was determined using a two-way ANOVA with Sidak’s multiple comparisons test. NS, not significant; **p ≤ 0.01; ***p < 0.001. All data points are shown with the line at mean.
Figure 7—figure supplement 2
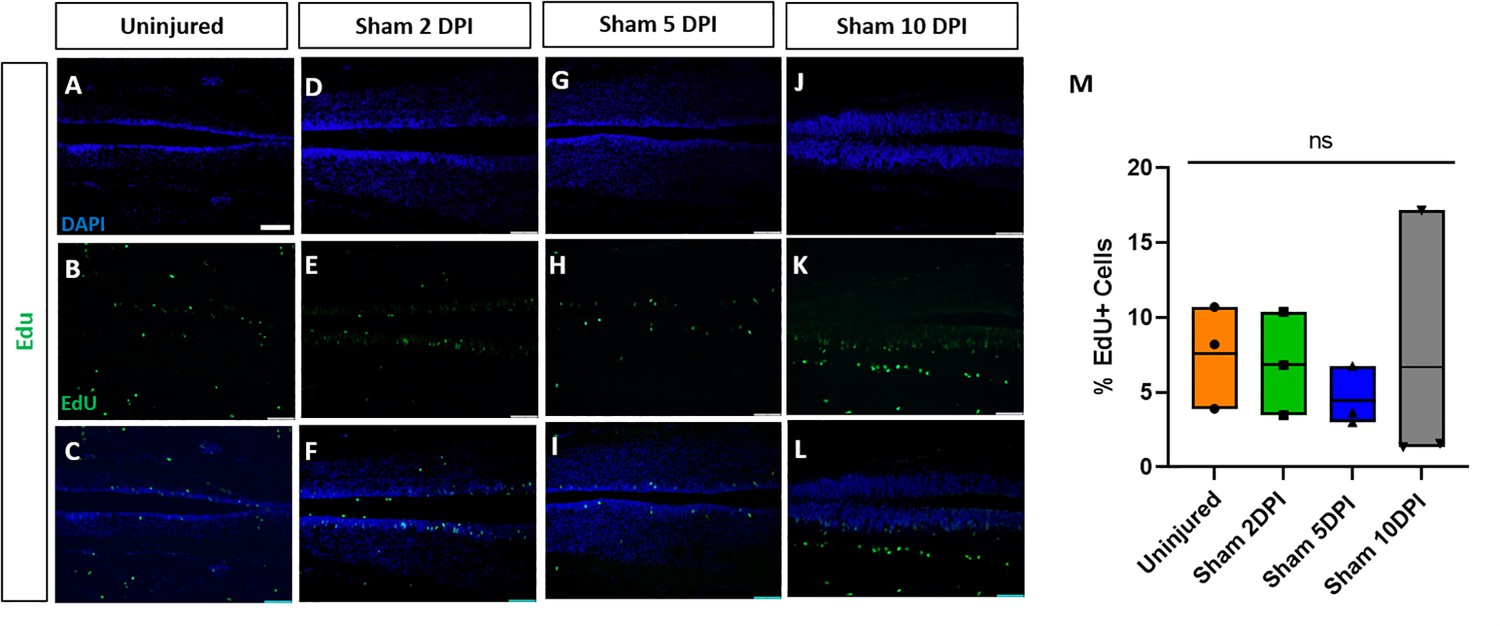
Sham-operated animals show no alterations of proliferation.
Evaluation and quantification of EdU+ proliferative cells (A–M) at 2-, 5-, and 10-DPI in horizontal sections of sham-operated tadpoles at stage 50. Significance was determined using a two-way ANOVA with Sidak’s multiple comparisons test. NS, not significant. All data points are shown with the line at mean. Scale bar in A = 50 µm (for all panels).
Figure 8 with 2 supplements
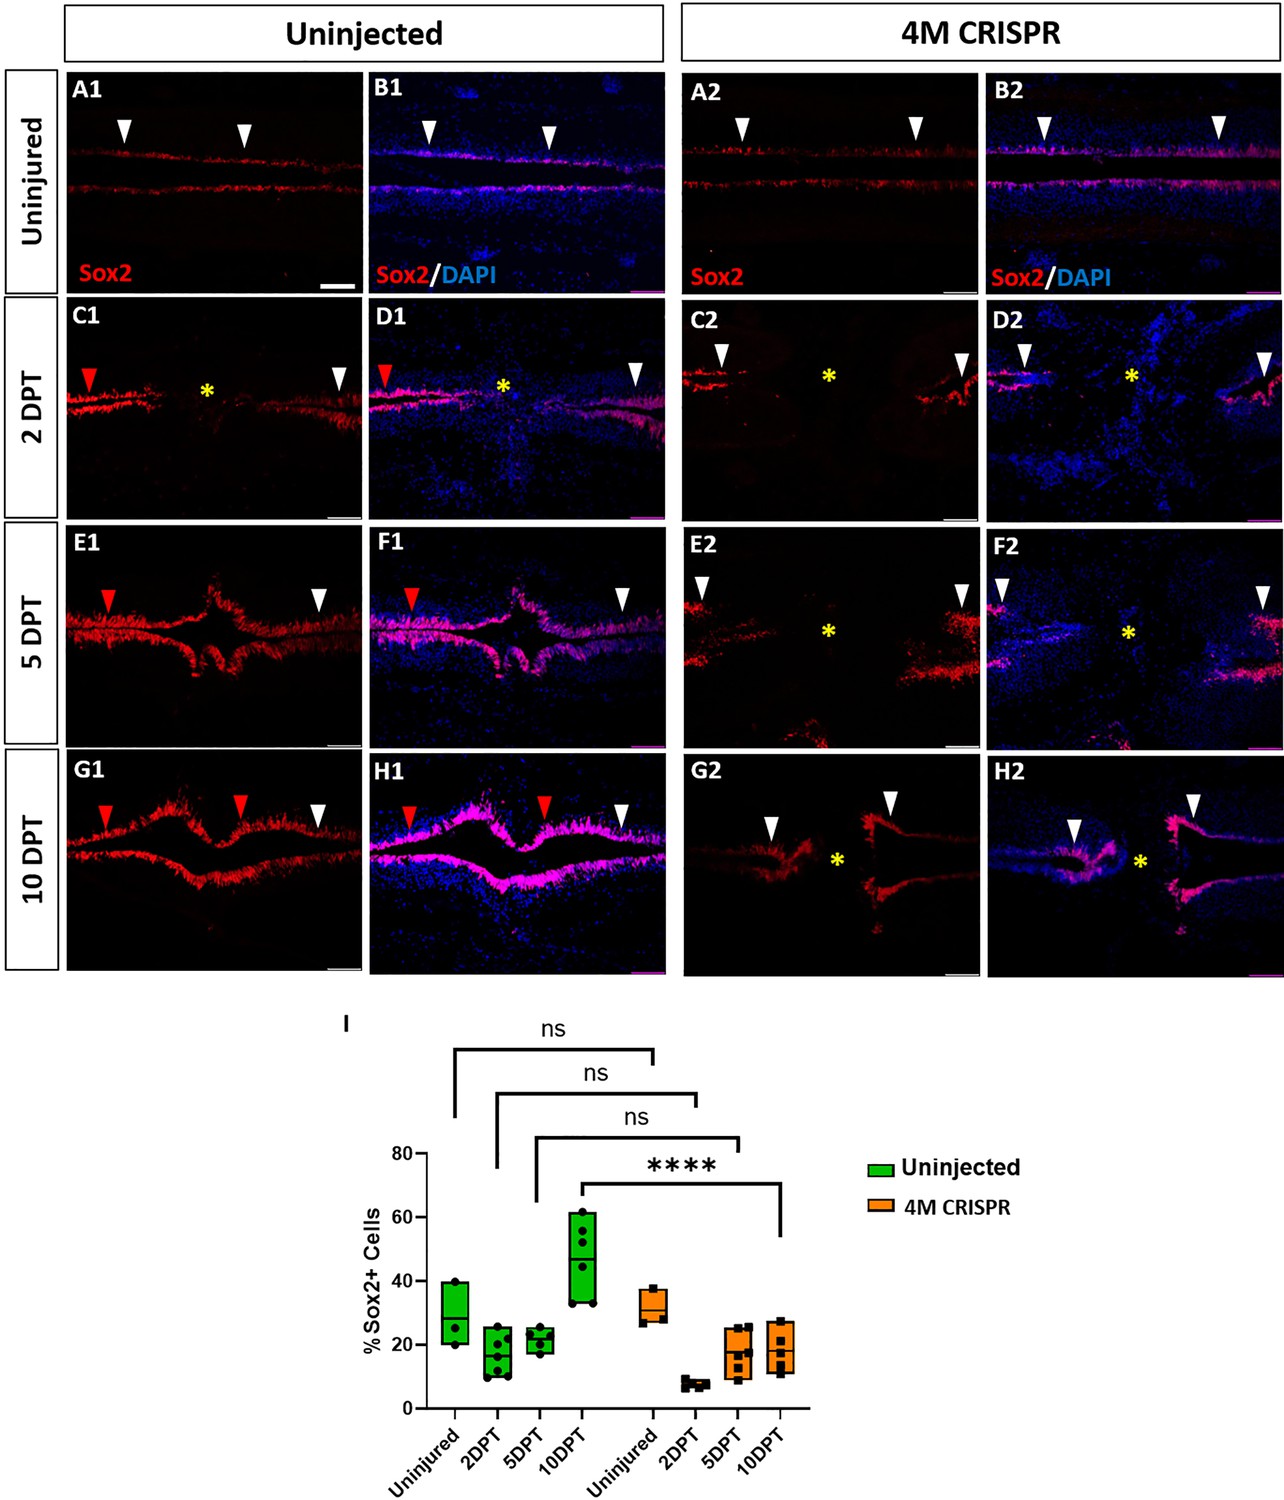
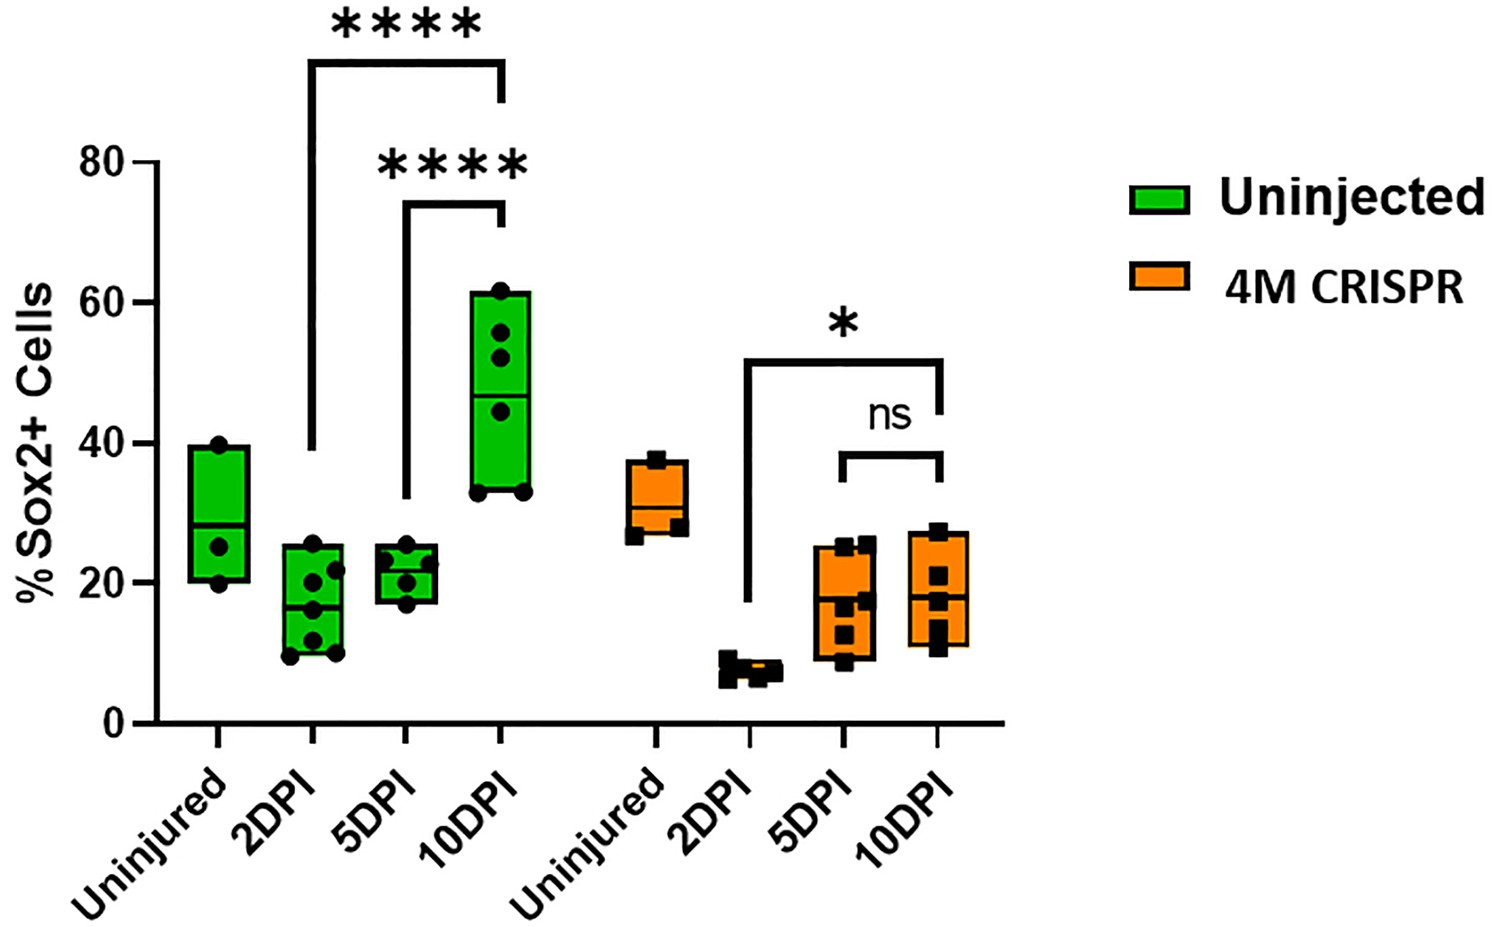
Expansion of Sox2+ neuro-glial progenitors after spinal cord transection is compromised in F0-CRISPants of Marcks and Marcksl1.
(A–H) Evaluation of Sox2+ neuro-glial progenitors at 2-, 5-, and 10-DPT in horizontal sections of uninjected (A1–H1) and 4M CRISPR-injected tadpoles (A2–H2) at stage 50 (A–H) and quantification of the average proportion of Sox2+ cells in a defined window of the spinal cord adjacent to the injury site (I). White and red arrowheads indicate preinjury and elevated levels of Sox2+ cells in the ventricular zone, respectively. A yellow asterisk indicates the absence of Sox2+ cells in and adjacent to the injury gap. Note the increase in Sox2+ cells in the spinal cord rostral to the injury gap at 2 DPT (C1, D1) and the increase in the proportion of Sox2+ cells at 10 DPT (G1, H1, I) in uninjected but not 4M CRISPR-injected tadpoles (C2, D2, G2, H2, I). Significance was determined using a two-way ANOVA with Sidak’s multiple comparisons test. NS, not significant; ****p < 0.0001. All data points are shown with the line at mean. Scale bar in A1 = 50 µm (for all panels).
Figure 8—figure supplement 1
Upregulation of Sox2+ neuro-glial progenitors after spinal cord transection is compromised in F0-CRISPants of Marcks and Marcksl1.
Quantification of Sox2+ cells at 2-, 5-, and 10-day post transection (DPI) in sham-operated tadpoles at stage 50 (same data as in Figure 8I but different statistical comparison). Significance was determined using a two-way ANOVA with Sidak’s multiple comparisons test. NS, not significant; *p < 0.05; ****p < 0.0001. All data points are shown with the line at mean.
Figure 8—figure supplement 2
Sham-operated animals show no alterations of numbers of neuro-glial progenitors.
Evaluation and quantification of Sox2+ neuro-glial progenitors (A–M) at 2-, 5-, and 10-DPI in horizontal sections of sham-operated tadpoles at stage 50. Significance was determined using a two-way ANOVA with Sidak’s multiple comparisons test. NS, not significant. All data points are shown with the line at mean. (D–I) depict Sox3 staining in same sections as shown for EdU staining in Figure 7—figure supplement 2 (D–I), respectively. Scale bar in A = 50 µm (for all panels).
Figure 9
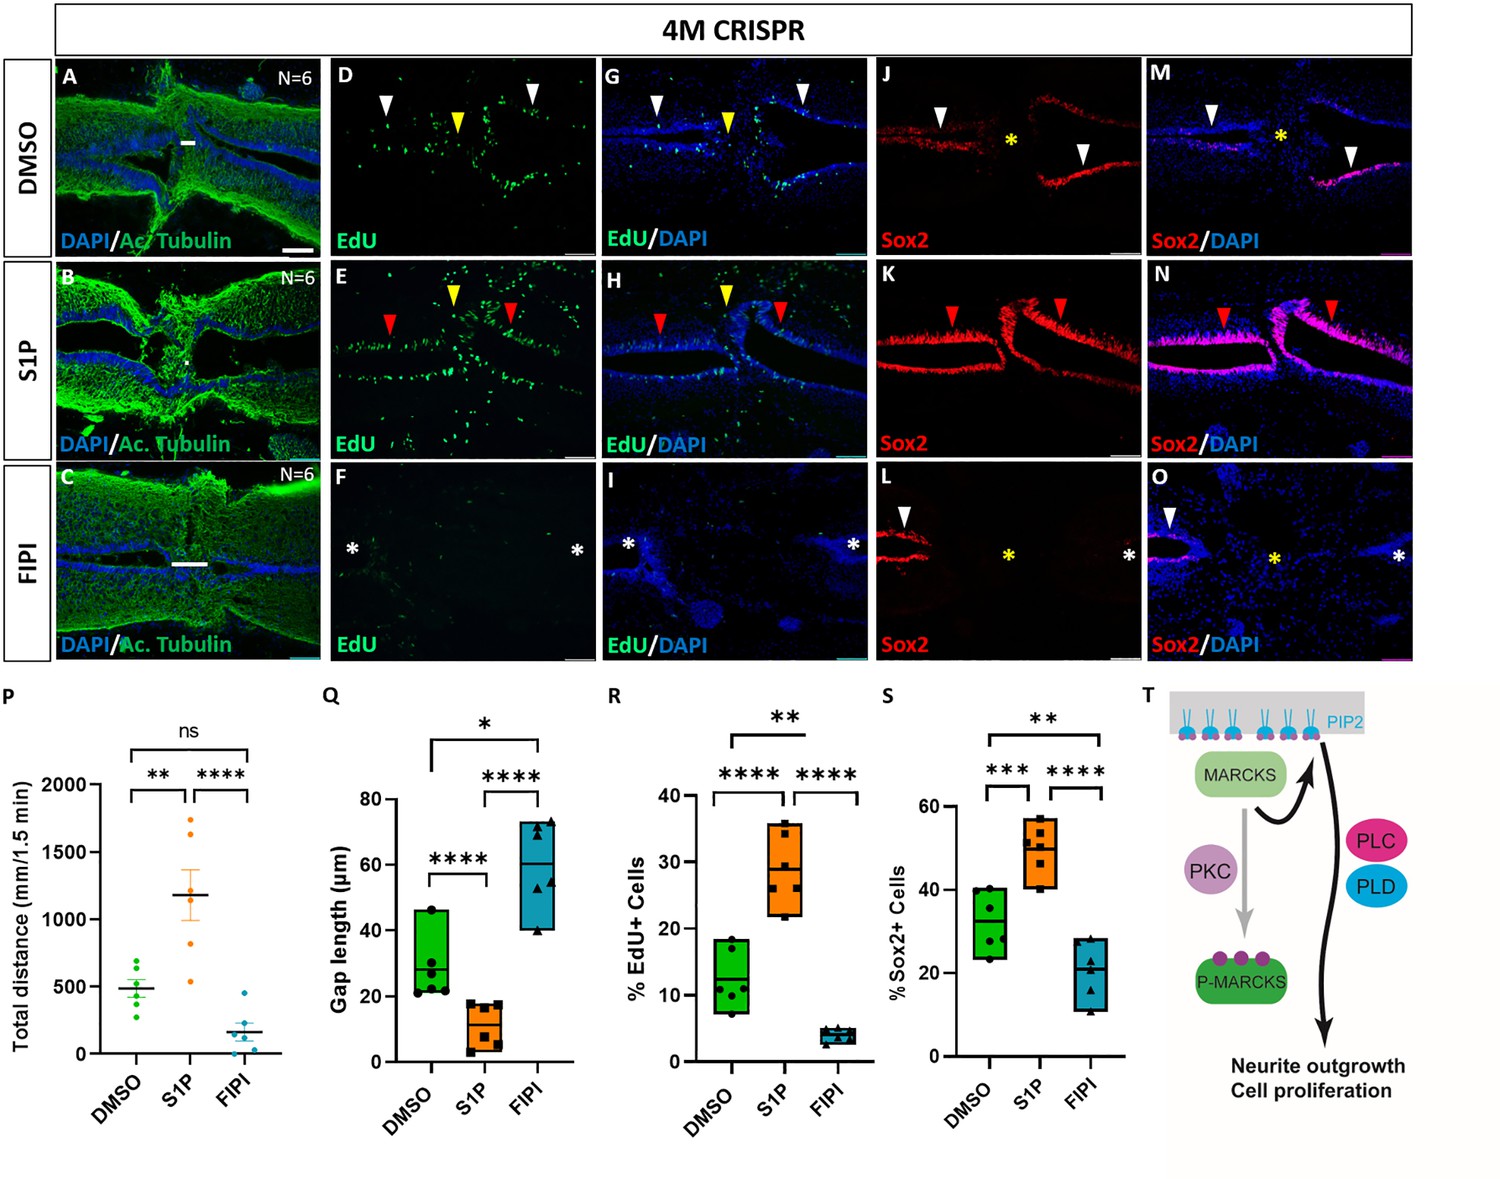
Activation of phospholipid signaling rescues deficiencies of spinal cord regeneration in 4M CRISPR-injected tadpoles.
(A–O) Horizontal sections of 4M CRISPR-injected tadpoles at stage 50 exposed to DMSO only (controls; A, D, G, J, M) or to PLD/PLC activator Sphingosine-1-phosphate (S1P) (B, E, H, K, N) or PLD inhibitor FIPI (C, F, I, L, O) for 7 DPT and analyzed for injury gap closure (A–C); the proportion of proliferative EdU+ cells (D–I) and the proportion of Sox2+ neuro-glial progenitors (J–O). Immunostaining for acetylated tubulin and nuclear DAPI staining was used to visualize injury gap closure (A–C). Gap length was measured as the distance between the ventricular zones of rostral and caudal spinal cord stumps, as indicated by the white lines. White and red arrowheads indicate preinjury and elevated levels of EdU+ or Sox2+ cells in the ventricular zone, respectively. Yellow arrowheads indicate EdU+ cells in and adjacent to the injury gap. White asterisks indicate reduced levels of EdU+ or Sox2+ cells in the ventricular zone. A yellow asterisk indicates the absence of Sox2+ cells in and adjacent to the injury gap. Quantification of effects of pharmacological treatments in 4M CRISPR-injected tadpoles at 7 DPT on swimming recovery (P), injury gap closure (Q), proportion of proliferative EdU+ cells (R), and proportion of Sox2+ neuro-glial progenitors (S). Note that the activator of phospholipid (PLD/PLC) signaling S1P significantly enhances swimming recovery, injury gap closure, and proportions of proliferating cells (EdU+) and neuro-glial progenitors (Sox2+) after spinal cord transection in 4M CRISPR tadpoles compared to DMSO-treated controls. At the same time, the PLD inhibitor FIPI significantly reduces injury gap closure and proportions of proliferating cells (EdU+) and neuro-glial progenitors (Sox2+). Significance was determined using an ordinary one-way ANOVA with uncorrected Fisher’s least significant difference (LSD) for multiple comparisons. N = 6 animals per condition. NS, not significant; *p < 0.05; **p ≤ 0.01; ***p < 0.001; ****p < 0.0001. All data points are shown with the line at mean. Error bars in (P) epresent the standard error of the mean. Scale bar in A = 50 µm (for all panels). (T) Model proposing that unphosphorylated, membrane-bound Marcks and Marcksl1 proteins promote neurite outgrowth and proliferation during spinal cord development and regeneration in a phospholipid-dependent manner.
Tables
Table 1
Primary antibodies.
| Antigen | Company, product code | Reactivity | Dilution |
|---|---|---|---|
| Acetylated tubulin | Sigma, T6793 | Mouse Monoclonal | 1:1000 |
| Phospho-Histone H3 (PH3) | Merck, 06-570 | Rabbit Polyclonal | 1:200 |
| GFP | Abcam, ab290 | Rabbit Polyclonal | 1:250 |
| GFP | Abcam, ab1218 | Mouse Monoclonal | 1:250 |
| c-Myc | Developmental Studies Hybridoma Bank (DSHB), 9E 10 | Mouse Monoclonal | 1:200 |
| c-Myc | Merck, PLA0001 | Rabbit Polyclonal | 1:200 |
| 6-His-Tag | Abcam, ab3554 | Chicken Polyclonal, FITC | 1:100 |
| T7-Tag | Invitrogen, PA1-32390 | Goat Polyclonal, FITC | 1:200 |
| X. laevis Marcks | Genscript, custom-made | Rabbit Polyclonal | 1:200 |
| X. laevis Marcksl1 | Genscript, custom-made | Rabbit Polyclonal | 1:100 |
| Sox2 | Cell Signaling Technology (CST), D6D9 | Rabbit Monoclonal | 1:100 |
| Sox3 | Zhang et al., 2004 | Rabbit Polyclonal | 1:100 |
Appendix 1—key resources table
| Reagent type (species) or resource | Designation | Source or reference | Identifiers | Additional information |
|---|---|---|---|---|
| Strain, strain background (Xenopus laevis) | X. laevis, Wild Type | 1 Corp, Michigan, USA | ||
| Sequence-based reagent | marcksl1.L MO | Gene Tools, LLC | Morpholinos | GGATTCTATACTACCCATTTTCCGC |
| Sequence-based reagent | marcksl1.S MO | Gene Tools, LLC; Zhao et al., 2001 | Morpholinos | GGACTCTACGCTACCCATTGTGACT |
| Sequence-based reagent | marcks MO | Gene Tools, LLC; Iioka et al., 2004 | Morpholinos | GGTCTTGGAGAATTGGGCTCCCATT |
| Sequence-based reagent | Control MO | Gene Tools, LLC | Morpholinos | CCTCTTACCTCAGTTACAATTTATA |
| Recombinant DNA reagent | marcks_OGa33947C_pET-23a(+) | GenScript | Plasmid | Clone ID: OGa33947C |
| Recombinant DNA reagent | marcksl1_OXa00945C_pET-23a(+) | GenScript | Plasmid | Clone ID: OXa00945C |
| Recombinant DNA reagent | marcks.S_ BC041207_ pCMV-Sport6 | Source Bioscience | Plasmid | Clone accession: BC041207 |
| Recombinant DNA reagent | Marcksl1.L_ BC084888_ pCMV-Sport6.ccdb | Source Bioscience | Plasmid | Clone accession: BC084888 |
| Recombinant DNA reagent | Marcksl1.S_ BC157454_ pCMV-Sport6 | Source Bioscience | Plasmid | Clone accession: BC157454 |
| Recombinant DNA reagent | memGFP-pCS2+ | Wallingford et al., 2000 | Plasmid | Membrane GFP |
| Recombinant DNA reagent | pCMTEGFP | Kindly provided by Doris Wedlich | Plasmid | c-Myc-GFP |
| Sequence-based reagent | marcks.L/S | This paper | Primers for sgRNA synthesis | CTAGCTAATACGACTCACTATAGGCTGCGGTCTTGGAGAATTGTTTTAGAGCTAGAAATAGCAAG |
| Sequence-based reagent | marcksl1.L/S | This paper | Primers for sgRNA synthesis | CTAGCTAATACGACTCACTATAGGTTGGGGTCCCCGTTGGCGGTTTTAGAGCTAGAAATAGCAAG |
| Sequence-based reagent | slc45a2 | DeLay et al., 2018 | Primers for sgRNA synthesis | CTAGCTAATACGACTCACTATAGGTTACATAGGCTGCCTCCAGTTTTAGAGCTAGAAATAGCAAG |
| Sequence-based reagent | Universal reverse | DeLay et al., 2018 | Primers for sgRNA synthesis | AAAAGCACCGACTCGGTGCCACTTTTTCAAGTTGATAACGGACTAGCCTTATTTTAACTTGCTATTTCTAGCTCTAAAAC |
| Sequence-based reagent | marcks.L_F | This paper | PCR primers | ATCACCTGATGGACGCATGG |
| Sequence-based reagent | marcks.L_R | This paper | PCR primers | CCCCCACATCTAAAGCGGAG |
| Sequence-based reagent | marcks.L | This paper | Sequencing primers | CCCATGCTGTCTGTCTTTGA |
| Sequence-based reagent | marcks.S_F | This paper | PCR primers | AGTGTCATGAATCAGCGGGG |
| Sequence-based reagent | marcks.S_R | This paper | PCR primers | GTGTGTCTATTAGCGGCGGA |
| Sequence-based reagent | marcks.S | This paper | Sequencing primers | GTGTGTCTATTAGCGGCGGA |
| Sequence-based reagent | marcksl1l1.L_F | This paper | PCR primers | GCTAGGAAGAAGCGAGTCCC |
| Sequence-based reagent | marcksl1.L_R | This paper | PCR primers | ACCCGTTAACATGAGCAGCA |
| Sequence-based reagent | marcksl1.L | This paper | Sequencing primers | TCTTCTTCTGGCGCCTGC |
| Sequence-based reagent | marcksl1l1.S_F | This paper | PCR primers | AGAAAGAAGTGAGCCTAGAGTGATT |
| Sequence-based reagent | marcksl1.S_R | This paper | PCR primers | ATCCCTCCAAGGGTGACAGG |
| Sequence-based reagent | marcksl1.S | This paper | Sequencing primers | AGTTTAGGGAGGCAGGGTTG |
| Sequence-based reagent | slc45a2.L_F | DeLay et al., 2018 | PCR primers | GTTCCCTTCGCTCATACAATG |
| Sequence-based reagent | slc45a2.L_R | DeLay et al., 2018 | PCR primers | GCCAGAAAGGGGTTTATTGC |
| Sequence-based reagent | slc45a2.L | DeLay et al., 2018 | Sequencing primers | GTTCCCTTCGCTCATACAATG |
| Strain, strain background (Escherichia coli) | XL1-Blue | Stratagene | 200249 | Chemically Competent Cells |
| Antibody | Anti-Tubulin, Acetylated (Mouse monoclonal) | Sigma | T6793 | IHC 1:1000 |
| Antibody | Anti-Phospho-Histone H3 (Rabbit Polyclonal) | Merck | 06-570 | IHC 1:200 |
| Antibody | Anti-GFP (Rabbit Polyclonal) | Abcam | ab290 | IHC 1:250 |
| Antibody | Anti-GFP (Mouse Monoclonal) | Abcam | ab1218 | IHC 1:250 |
| Antibody | Anti-c-Myc (Mouse Monoclonal) | Developmental Studies Hybridoma Bank | 9E 10 | IHC 1:200 |
| Antibody | Anti-c-Myc (Rabbit Polyclonal) | Merck | PLA0001 | IHC 1:200 |
| Antibody | Anti-6X-His-Tag (Chicken Polyclonal, FITC) | Abcam | ab3554 | IHC 1:100 |
| Antibody | Anti-T7-Tag (Goat Polyclonal, FITC) | Invitrogen | PA1-32390 | IHC 1:200 |
| Antibody | Anti-X. laevis MARCKS (Rabbit Polyclonal) | Genscript | Custom-made | IHC 1:200 |
| Antibody | Anti-X. laevis MARCKSL1 (Rabbit Polyclonal) | Genscript | Custom-made | IHC 1:100 |
| Antibody | Anti-Sox2 (Rabbit Monoclonal) | Cell Signalling Technology | D6D9 | IHC 1:100 |
| Antibody | Anti-Sox3 (Rabbit Polyclonal) | Zhang et al., 2004 | Custom-made | IHC 1:100 |
| Chemical compound, drug | Phorbol 12-myristate 13-acetate (PMA) | TOCRIS | 1201 | 0.01 μM |
| Chemical compound, drug | 5-Fluoro-2-indolyl des-chlorohalopemide (FIPI) | TOCRIS | 3600 | 10 μM |
| Chemical compound, drug | Go 6983 | TOCRIS | 2285 | 10 μM |
| Chemical compound, drug | N-Methyllidocaine iodide (NMI) | TOCRIS | 1042 | 10 μM |
| Chemical compound, drug | Sphingosine-1-phosphate (S1P) | TOCRIS | 1370 | 1 μM |
| Chemical compound, drug | U 73122 | TOCRIS | 1268 | 10 μM |
| Chemical compound, drug | m-3M3FBS | TOCRIS | 1941 | 10 μM |
| Chemical compound, drug | ISA-2011B | MedChemExpress | HY-16937 | 10 μM |
| Chemical compound, drug | DMSO | Sigma-Aldrich | D2650 | 2% |
| Commercial assay or kit | Q5 site-directed mutagenesis kit | New England Biolabs | E0554S | |
| Commercial assay or kit | Ambion mMessage mMachineTM T7/SP6 Transcription Kit | Invitrogen | AM1340/44 | |
| commercial assay or kit | Poly(A) Tailing Kit | Invitrogen | AM1350 | |
| Commercial assay or kit | MEGAshortscript T7 Transcription Kit | Invitrogen | AM1354 | |
| Commercial assay or kit | Q5 High-Fidelity DNA Polymerase | New England Biolabs | M0491S | |
| Commercial assay or kit | TNT SP6 Coupled Wheat Germ Extract System | Promega | L4130 | |
| Commercial assay or kit | Click-iT EdU Cell Proliferation Kit for Imaging, Alexa Fluor 488 dye | Invitrogen | C10337 | |
| Commercial assay or kit | Roche Digoxigenin RNA Labeling Kit | Sigma-Aldrich | 11175025910 | |
| Commercial assay or kit | QIAquick PCR Purification Kit | QIAGEN | ||
| Commercial assay or kit | EmeraldAmp GT PCR Master Mix | Takara Bio | RR310A | |
| Commercial assay or kit | Wizard Genomic DNA Purification Kit | Promega | A1120 | |
| Other | TrueCut Cas9 Protein v2 | Invitrogen | A36497 | 0.2 ng/nl; see Materials and methods, Microinjections |
| Other | Streptavidin Alkaline Phosphatase | Promega | V5591 | 1:5000; see Materials and methods, MO |
| Other | DAPI stain | Invitrogen | D1306 | 100 ng/µl; see Materials and methods, Histochemistry |
| Software | ImageJ | PMID:22930834; https://imagej.nih.gov/ij/ | RRID:SCR_003070 | Software for image viewing and processing |
| Software | NEBaseChanger | New England Biolabs; https://nebasechanger.neb.com | Cloning website | |
| Software | Prism | GraphPad; https://www.graphpad.com/updates/prism-900-release-notes | RRID:SCR_002798 | Software for statistical analysis |
| Software | Synthego ICE | Synthego; https://www.synthego.com/guide/how-to-use-crispr/ice-analysis-guide | RRID:SCR_024508 | Website for CRISPR editing assessment |
| Software | CRISPRscan | CRISPRscan; https://www.crisprscan.org/ | RRID:SCR_023777 | Website for sgRNA design |
| Software | InDelphi | InDelphi; https://indelphi.giffordlab.mit.edu/ | Website for predicting CRISPR outcomes | |
| Software | GGGenome | GGGenome; https://gggenome.dbcls.jp/ | Website for visualizing CRISPR off-targets | |
| Software | EthoVision XT | EthoVision; https://www.noldus.com/ethovision-xt | RRID:SCR_000441 | Software for animal video tracking |
Additional files
Download links
A two-part list of links to download the article, or parts of the article, in various formats.
Downloads (link to download the article as PDF)
Open citations (links to open the citations from this article in various online reference manager services)
Cite this article (links to download the citations from this article in formats compatible with various reference manager tools)
Marcks and Marcks-like 1 proteins promote spinal cord development and regeneration in Xenopus
eLife 13:e98277.
https://doi.org/10.7554/eLife.98277


