A synthetic method to assay polycystin channel biophysics
- Department of Pharmacology, Feinberg School of Medicine, Northwestern University, United States
- Department of Biomedical Engineering, McCormick School of Engineering and Applied Science, Northwestern University, United States
- Center for Synthetic Biology, Northwestern University, United States
- Chemistry of Life Processes Institute, Northwestern University, United States
Figures
Figure 1 with 1 supplement
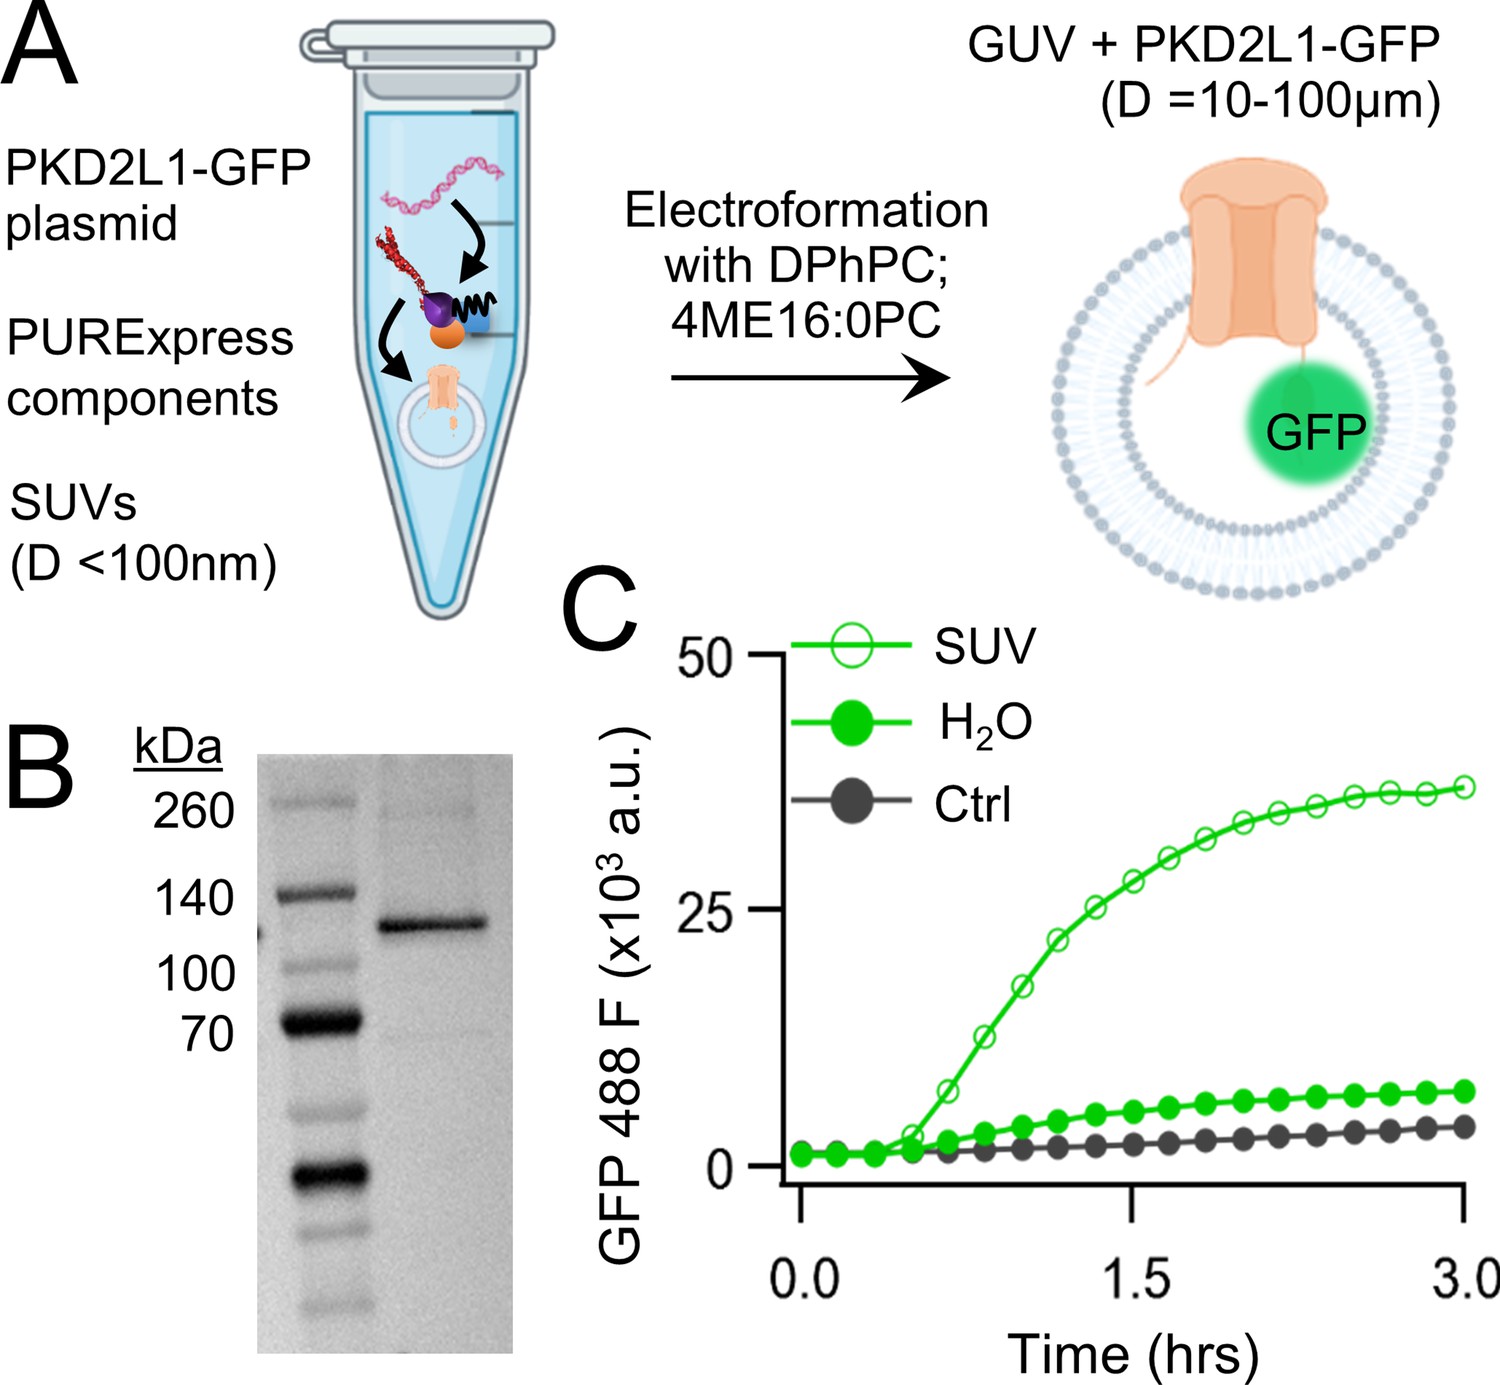
Cell-free expression of synthetic PKD2L1 protein and incorporation into lipid vesicles.
(A) Schematic of cell-free protein expression into synthetic lipid vesicles and subsequent electroformation with Vesicle Prep Pro (Nanion). (B) Full-length PKD2L1-GFP protein detected by western blot after cell-free expression into vesicles. (C) Monitored fluorescence over time of cell-free expressed PKD2L1-GFP and a non-fluorescent control plasmid produced in the presence or absence of lipid vesicles.
-
Figure 1—source data 1
Original file for western blot analysis displayed in Figure 1B.
- https://cdn.elifesciences.org/articles/98534/elife-98534-fig1-data1-v1.zip
-
Figure 1—source data 2
PDF file containing original western blot for Figure 1B, indicating the relevant bands and treatments.
- https://cdn.elifesciences.org/articles/98534/elife-98534-fig1-data2-v1.zip
Figure 1—figure supplement 1
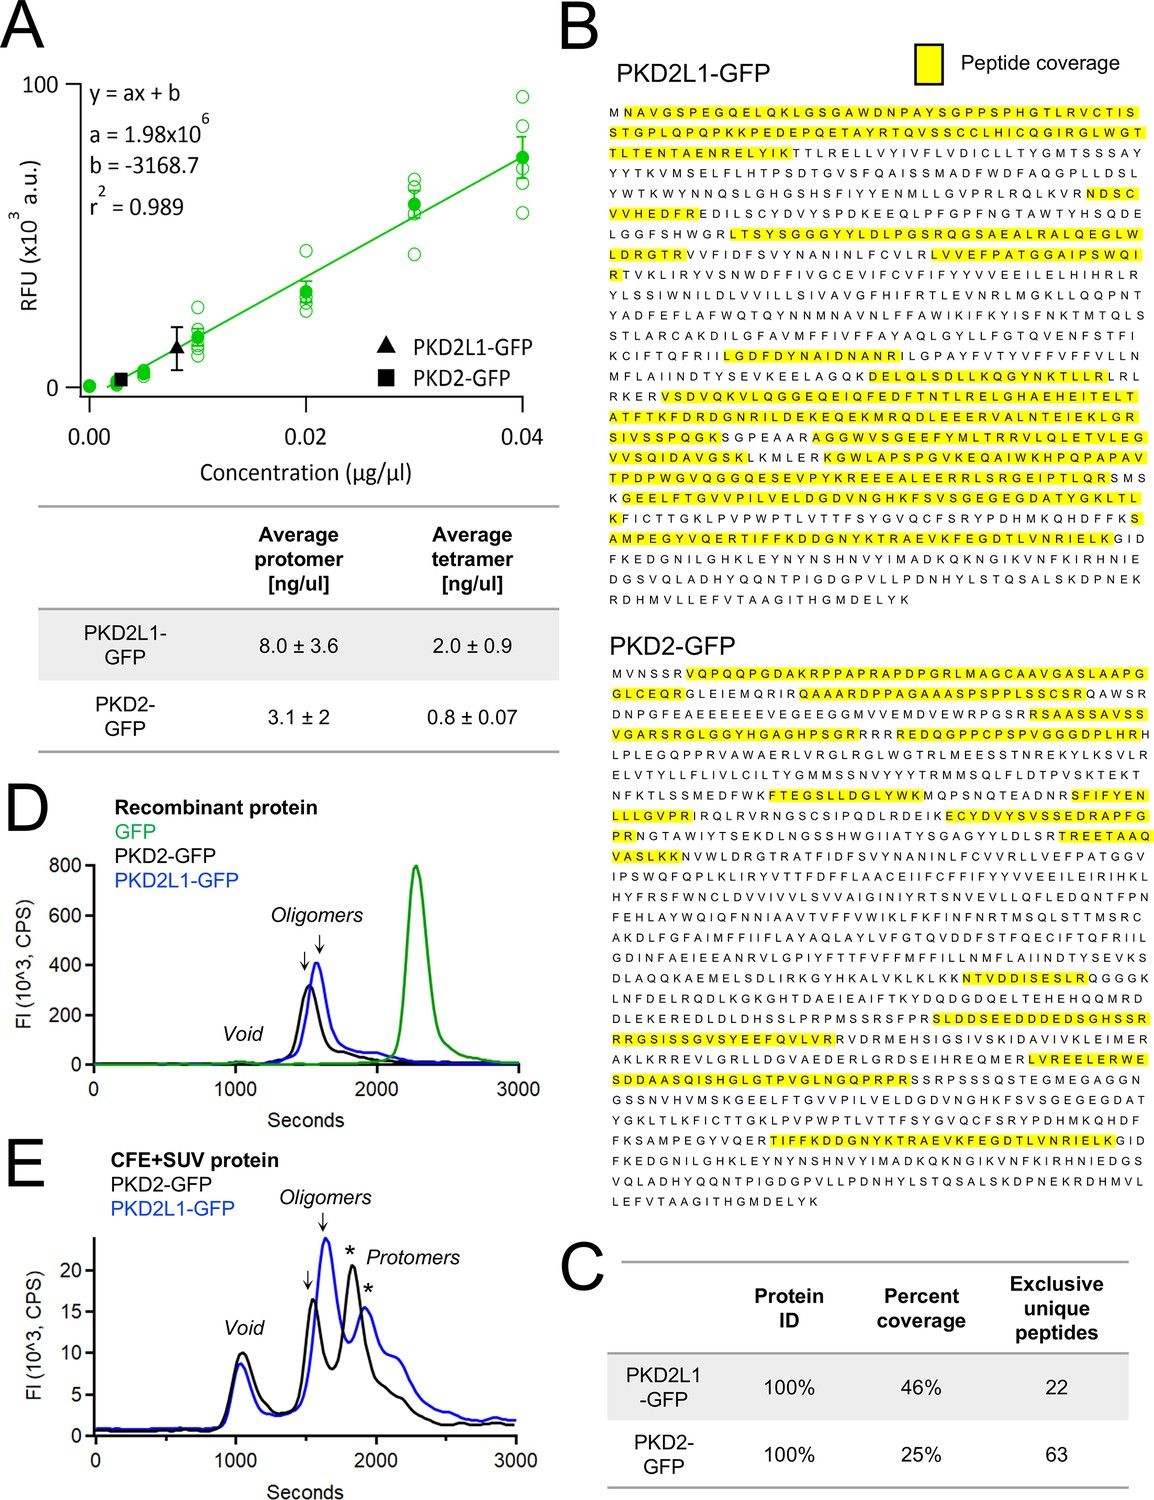
Quantification, identification, and assembly of cell-free synthesized polycystin channels.
(A) Top, fluorescence (488γ) standard curve determined with a recombinant GFP-tagged protein fit with a linear regression. PURExpress synthesized PKD2L1-GFP and PKD2-GFP were measured after 3 hr of expression at 37°C. (GFP standard curve N = 5, PKD2L1 and PKD2 N = 3 replicates). Bottom, average protomer and tetramer protein production from the PURExpress reaction. Error bars represent SEM. (B) Representative sequence coverage of PKD2L1-GFP (top) and PKD2-GFP (bottom) from tandem mass spectrometry spectra. (C) Mass spectrometry outputs identifying polycystin proteins. (D, E) Fluorescence-detection size-exclusion chromatography (FSEC) of polycystin proteins derived from recombinant and cell-free protein expression (CFE) sources. Recombinant human PKD2-GFP and PKD2L1-GFP protein was obtained from lysates of 0.5 × 10⁶ HEK cells stably expressing the channels. Purified Aequorea Victoria GFP His-tag protein was obtained from Thermo Fisher Scientific. SUVs containing CFE-derived polycystins were lysed using dodecyl β-D-maltoside (DDM) prior to FSEC analysis (see methods).
Figure 2 with 1 supplement
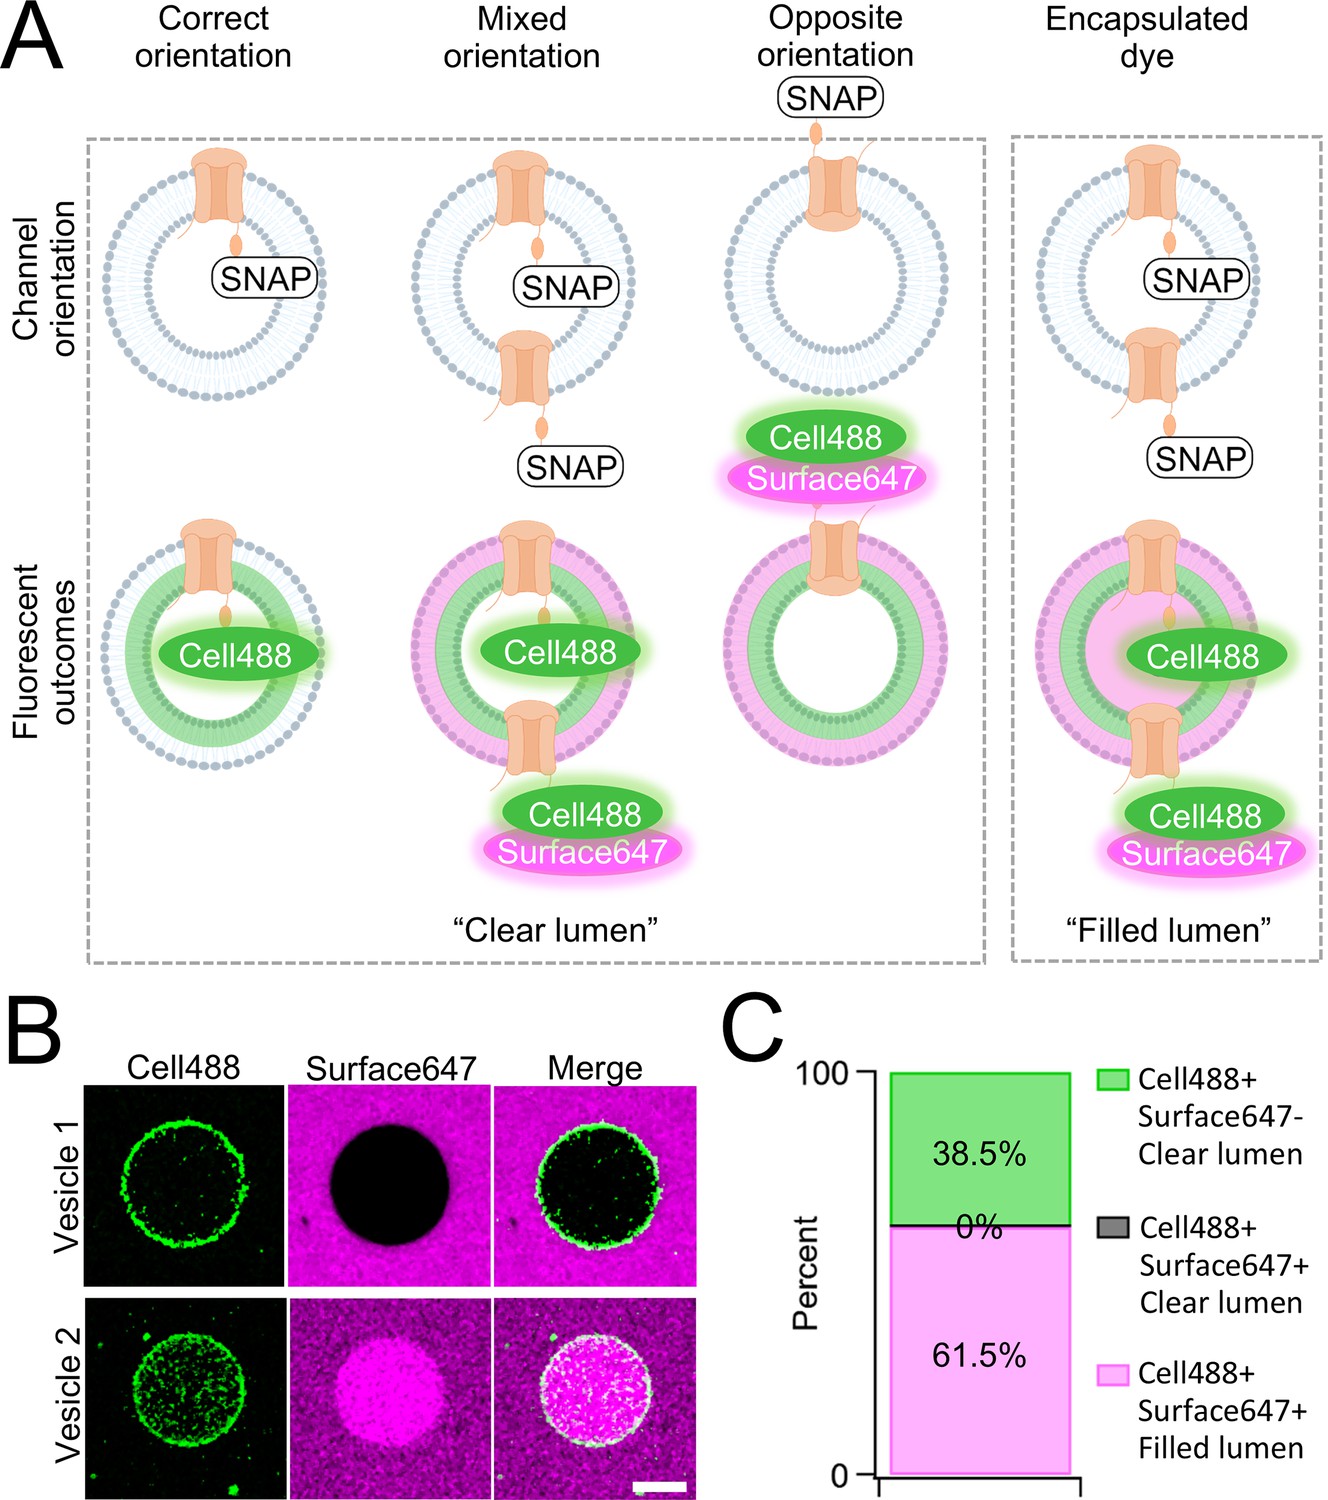
Orientation of synthetic PKD2L1 channels in vesicles.
(A) Schematic of possible ion channel orientation outcomes from PKD2L1 cell-free expression (top) and hypothesized fluorescence results when Cell488 and Surface647 added (bottom). (B) Fluorescent confocal images from the SNAP-tagged vesicles. The scale bar represents 10 μm for all images. (C) Vesicle percentage depicts the percent of vesicles with each fluorescent output (N = 65 vesicles).
Figure 2—figure supplement 1
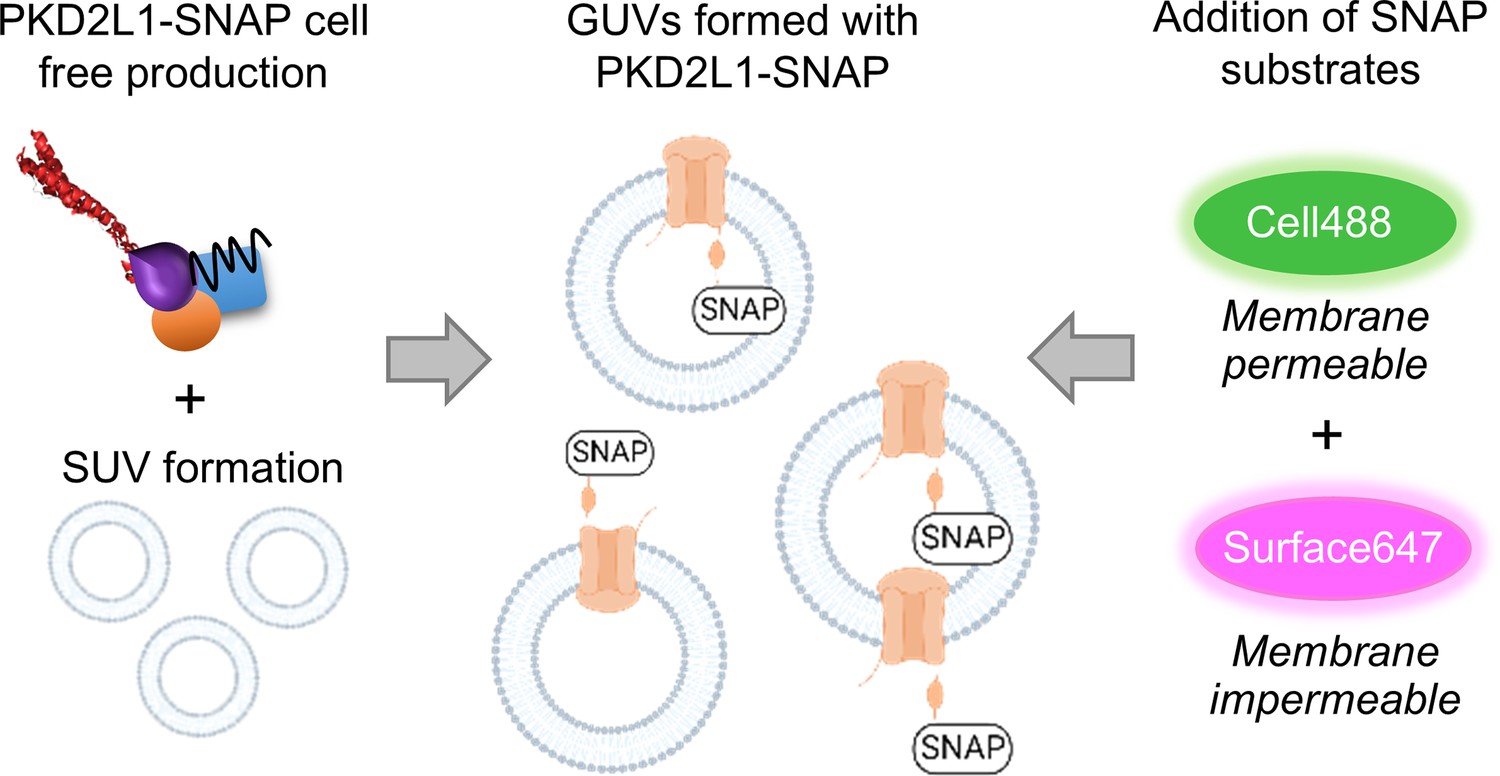
The SNAP-fluorescence approach to assess polycystin protein orientation in giant unilamellar vesicle (GUV).
Schematic of PKD2L1-SNAP incorporated into GUVs, followed by SNAP staining with cell permeable (Cell488), and cell impermeable (Surface647) SNAP-Tag marker.
Figure 3 with 1 supplement
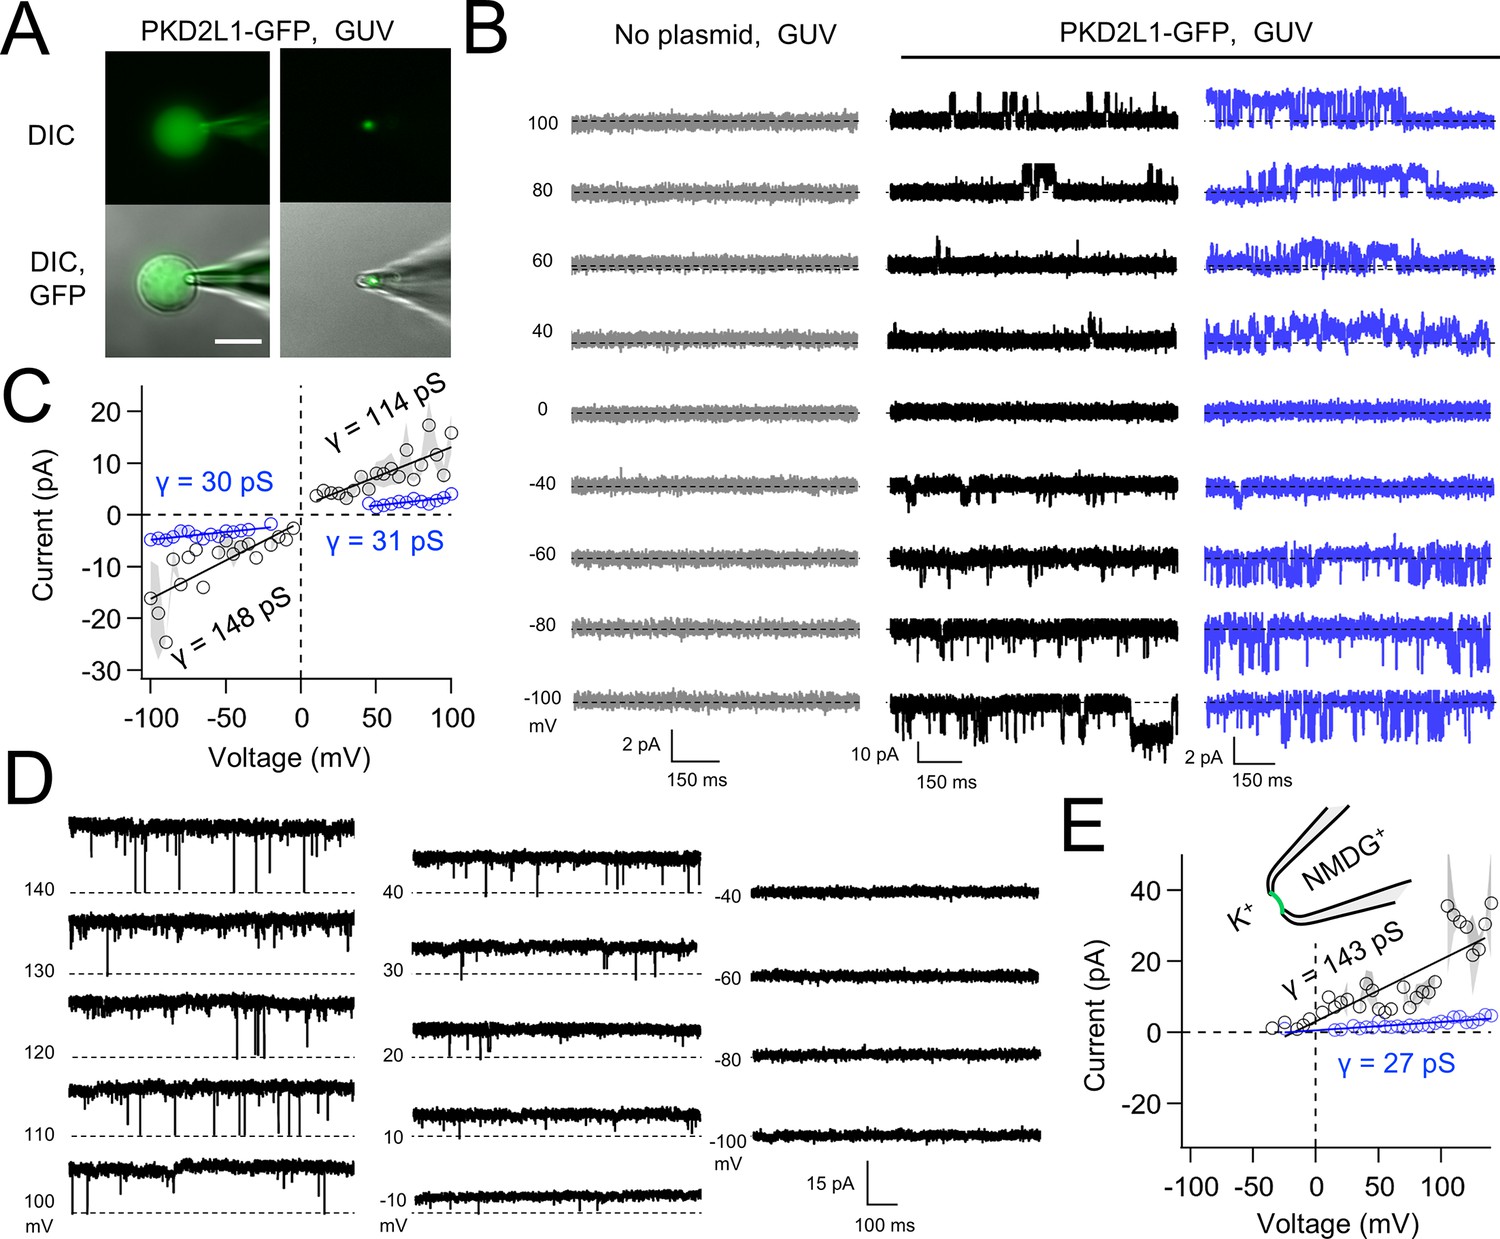
Synthetic PKD2L1 channels are functional in artificial membranes.
(A) Images of voltage-clamped giant unilamellar vesicles (GUVs) with incorporated PKD2L1-GFP channels. Left, establishing high-resistance seals in the on-cell patch configuration. Right, transitioning to the inside-our patch configuration. Scale bar = 20 μm. (B) Example unitary single-channel current records from GUVs reconstituted with or without PKD2L1 protein. Vesicles were patched using the symmetrical 150 mM K+ conditions (see methods) and PKD2L1 single-channel current producing full and sub-conductances are colored black and blue, respectively. (C) Average single-channel current amplitudes. Conductance (γ) estimated by fitting the average single-channel currents to a linear equation. Error (gray) indicates SEM from N = 3–8 GUVs. Several replicates lacked single-channel openings at all test potentials. (D) PKD2L1 single-channel current recorded using asymmetric cationic solutions, with 150 mM K+ in the bath and 150 mM NMDG+ in the pipette. (E) Resulting average single-channel current amplitudes where no inward single-channel current was detected (N = 3–4 GUVs).
Figure 3—figure supplement 1
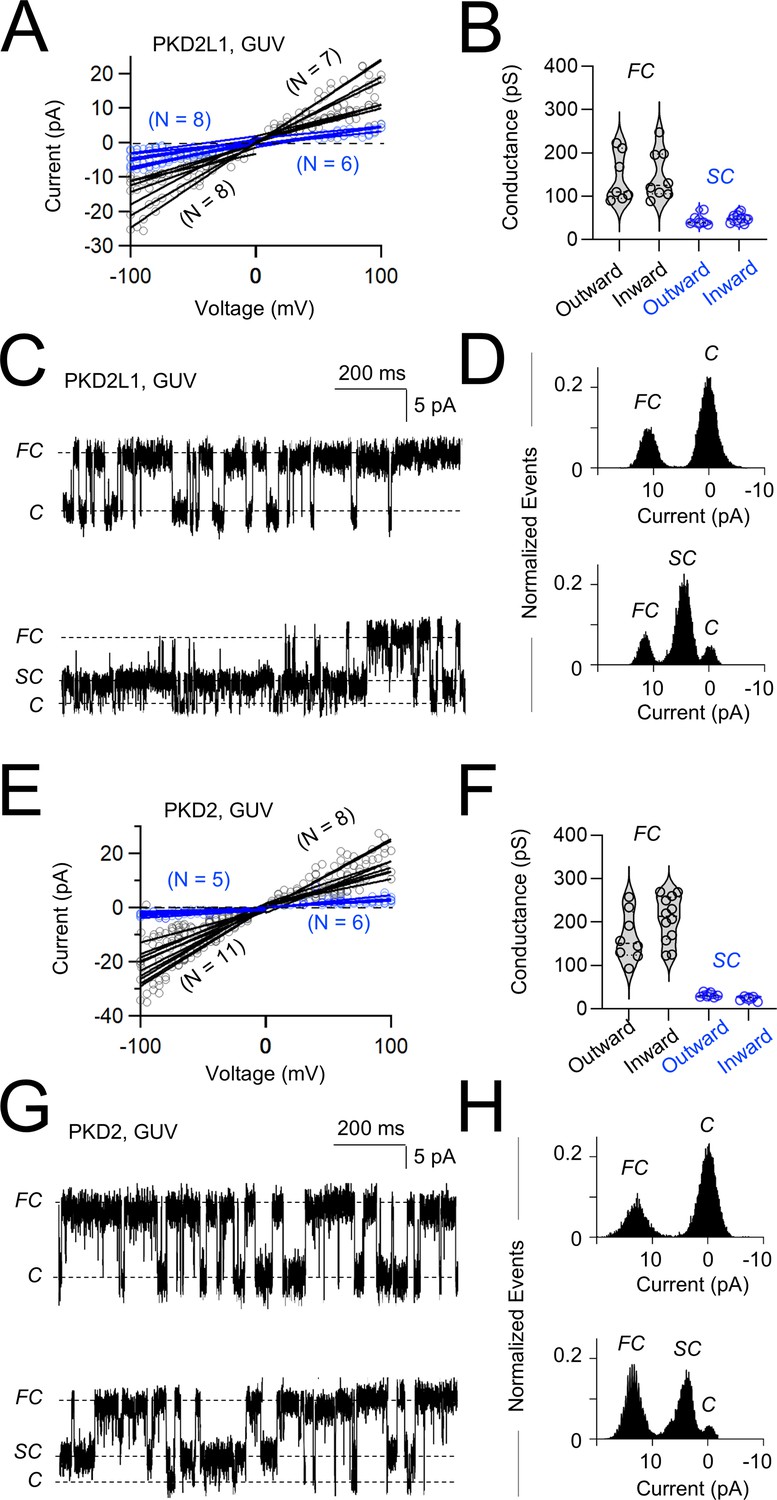
Synthetic polycystin channels exhibit full and sub-conductive states in giant unilamellar vesicles (GUVs).
(A, E) Single-channel current amplitudes measured from individual GUVs (open circles). GUVs with open channel events measure at four or more potentials in inward and outward direction were fit to a linear equation to estimate their conductance. (B, F) Resulting violin plots of the sub- (SC, blue) and full (FC, black) polycystin conductance as estimated from individual GUV recordings (N = 5–7 GUVs). (C, G) Unitary single-channel currents measured from GUVs expressing polycystins held at 100 mV. Examples on the top demonstrated channels transitioning from closed (C) to the full conductance current levels, whereas examples below are measured from channels shifting between sub- and fully conductive current levels. (D, H) Resulting histogram analysis of the corresponding single-channel currents.
Figure 4 with 1 supplement
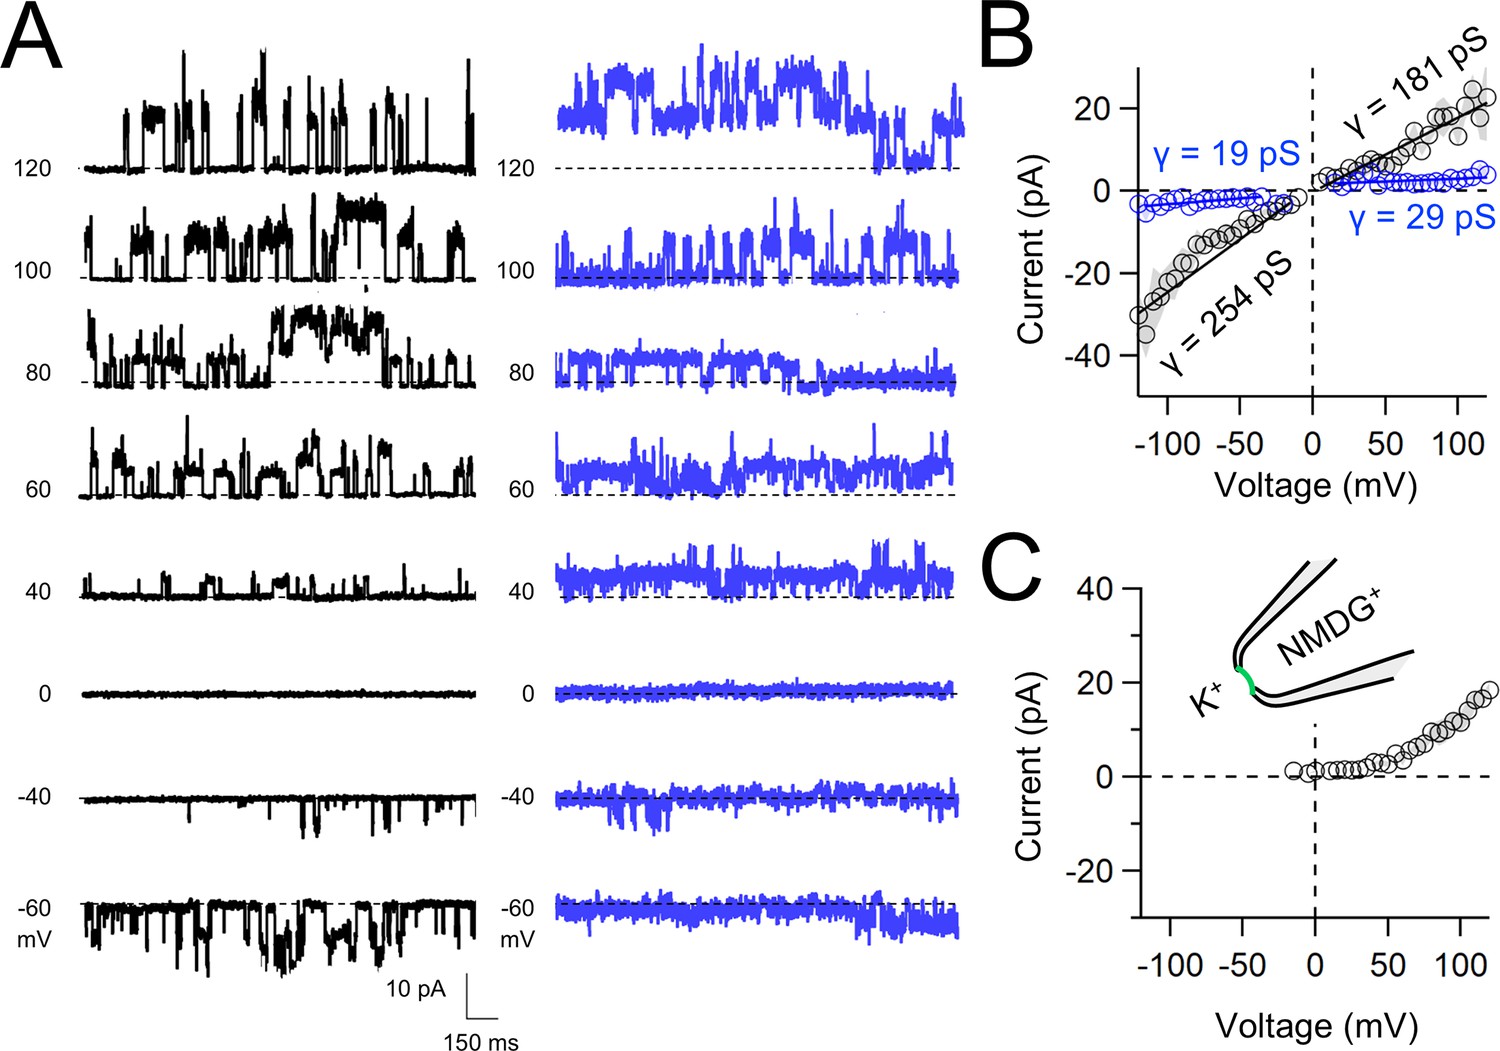
Functional synthetic PKD2 channels in artificial membranes.
(A) Example unitary single-channel current records from giant unilamellar vesicles (GUVs) reconstituted with PKD2 protein in symmetrical 150 mM K+ conditions producing full (black traces) and sub-conductances (blue traces), respectively. (B, C) Average single-channel current amplitudes recorded using K+ or NMDG+ in the recording electrode solution. Conductance (γ) estimated by fitting the average single-channel currents to a linear equation. Error (gray) indicate SEM from K+ (N = 3–12 GUVs) and NMDG+ (N = 2–5 GUVs) conditions.
Figure 4—figure supplement 1
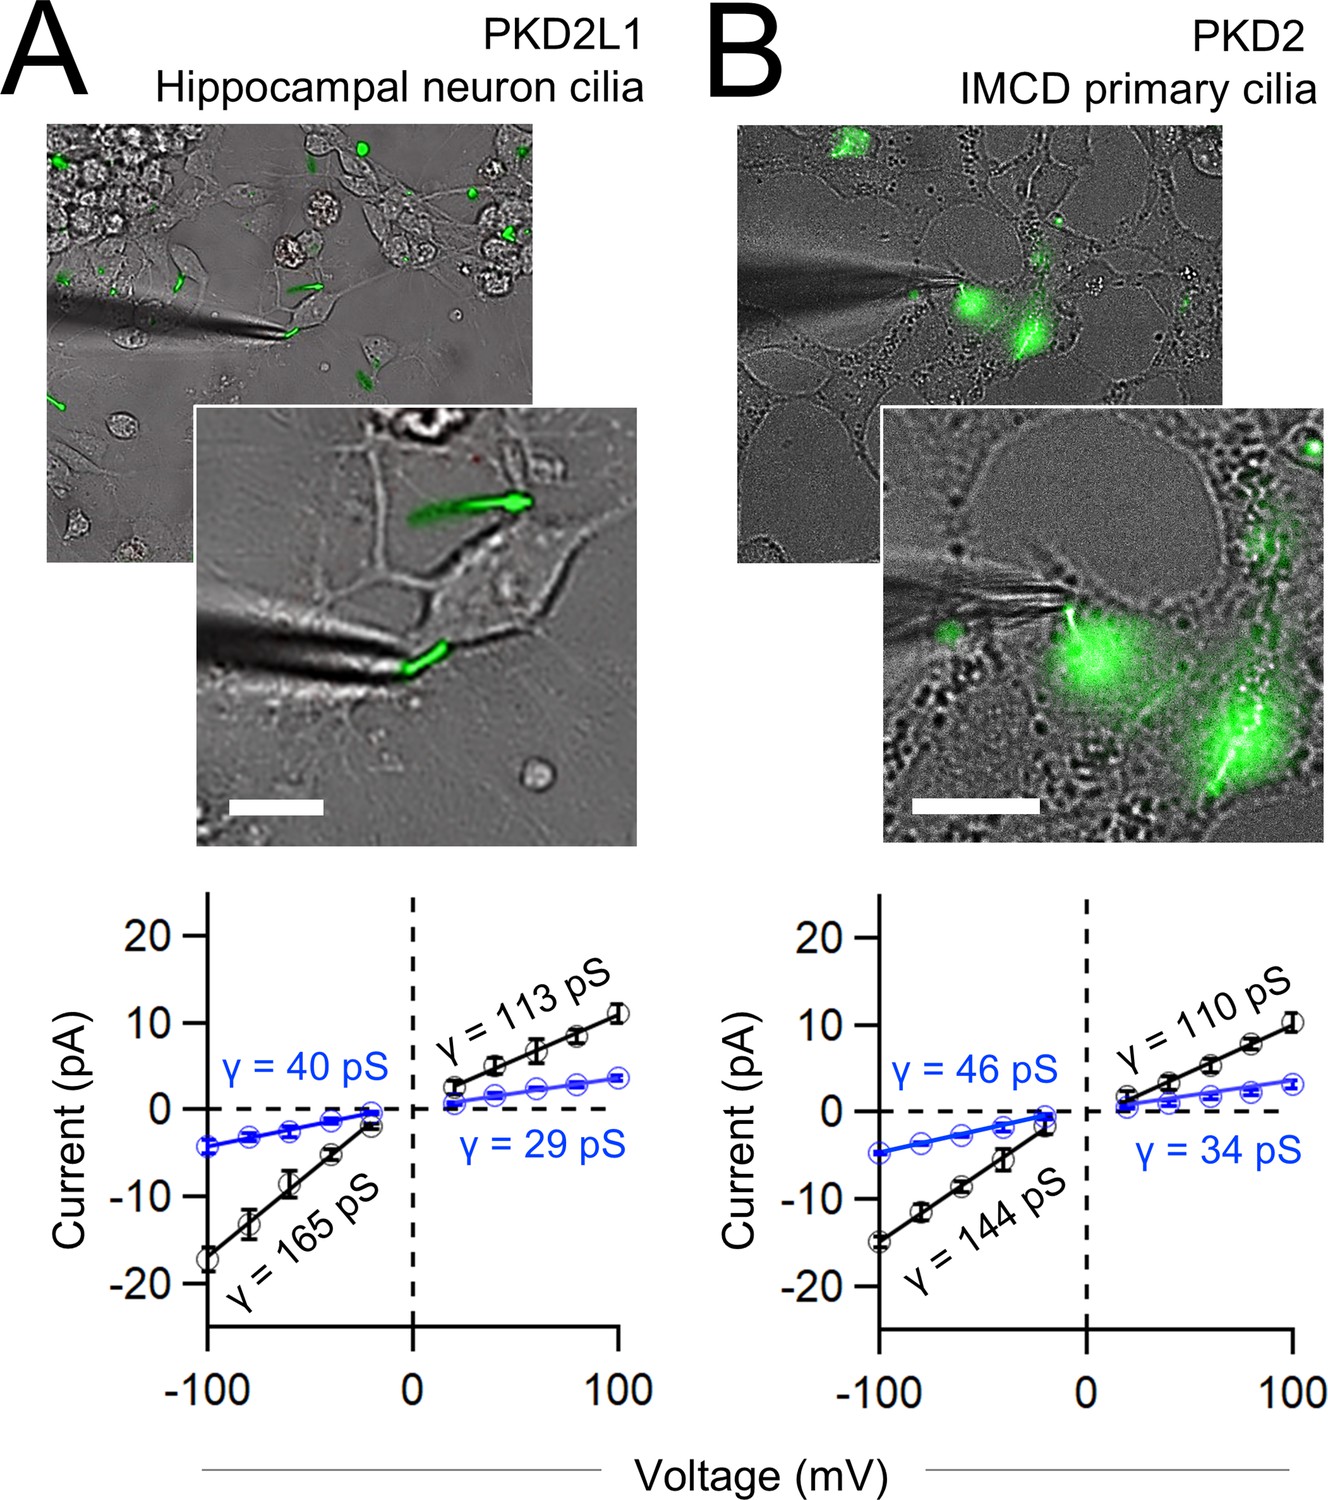
Native polycystin channels measured from primary cilia membranes exhibit full and sub-conductance states.
(A, B) Top, images of voltage-clamped primary cilia from mouse hippocampal neurons and inner medullary kidney collecting duct cells (IMCD) harvested from transgenic mice expressing a fluorescent cilia reporter (ARL13B-EGFPtg) (Delling et al., 2013). Scale bar = 20 μm. Previous work has genetically identified PKD2L1 and PKD2 as essential ion channel subunit in the primary cilia of the renal collecting duct cells and hippocampal neurons (Vien et al., 2023; Kleene and Kleene, 2017). Bottom, average single-channel current amplitudes recorded from primary cilia using K+ in the recording electrode solution. Conductance (γ) estimated by fitting the average single-channel currents to a linear equation. Error indicates SEM (N = 6 cilia).
Tables
Table 1
Conductance properties of polycystins measured from giant unilamellar vesicle (GUV) and cilia membranes.
| Polycystin channel and membrane context | Major K+ g (pS) ± SD | Minor K+ g (pS) ± SD | ||
|---|---|---|---|---|
| Inward | Outward | Inward | Outward | |
| PKD2 (GUV membrane, cell-free expression) | 282 ± 38 | 153 ± 32 | 23 ± 4 | 21 ± 3 |
| PKD2 (primary cilia membrane, endogenous murine inner medullary collecting duct [IMCD] cell line) | 144 ± 9 | 110 ± 6 | 46 ± 4 | 34 ± 4 |
| PKD2L1 (GUV membrane, cell-free expression) | 148 ± 29 | 114 ± 28 | 30 ± 6 | 31 ± 7 |
| PKD2L1 (primary cilia membrane, endogenous hippocampal neurons) | 165 ± 10 | 113 ± 6 | 40 ± 4 | 29 ± 3 |
Additional files
Download links
A two-part list of links to download the article, or parts of the article, in various formats.
Downloads (link to download the article as PDF)
Open citations (links to open the citations from this article in various online reference manager services)
Cite this article (links to download the citations from this article in formats compatible with various reference manager tools)
A synthetic method to assay polycystin channel biophysics
eLife 13:RP98534.
https://doi.org/10.7554/eLife.98534.3


