Transplantation of exogenous mitochondria mitigates myocardial dysfunction after cardiac arrest
- The First School of Clinical Medicine, Southern Medical University, China
- Department of Anesthesiology, General Hospital of Central Theater Command of PLA, China
- Base of Central Theater Command of People's Liberation Army, Hubei University of Medicine, China
Figures
Figure 1
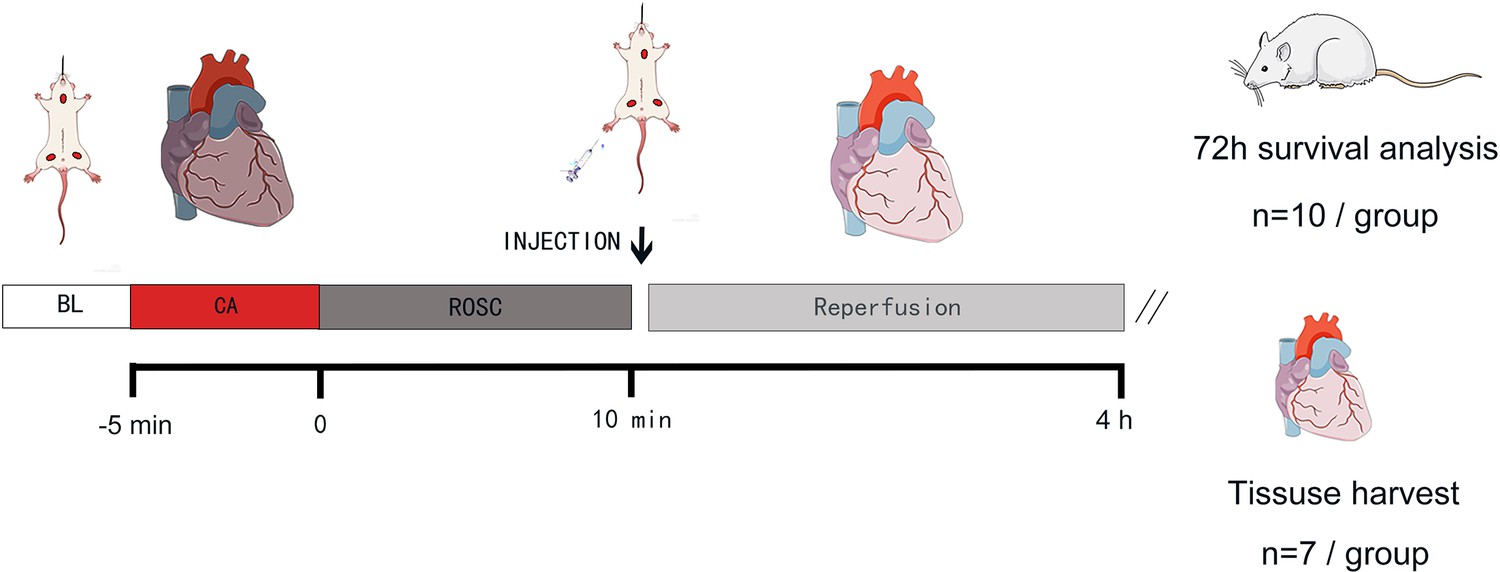
Experimental design of the in vivo study, rats in all groups except the Sham group underwent cardiac arrest for 5 min and then received the corresponding intervention 10 min after ROSC.
Four hours after ROSC, the 4 hr group was used to collect myocardial tissue and blood samples for detection, while the 72 hr group was used for survival detection. BL, baseline; CA, cardiac arrest; ROSC, return of spontaneous circulation.
Figure 2
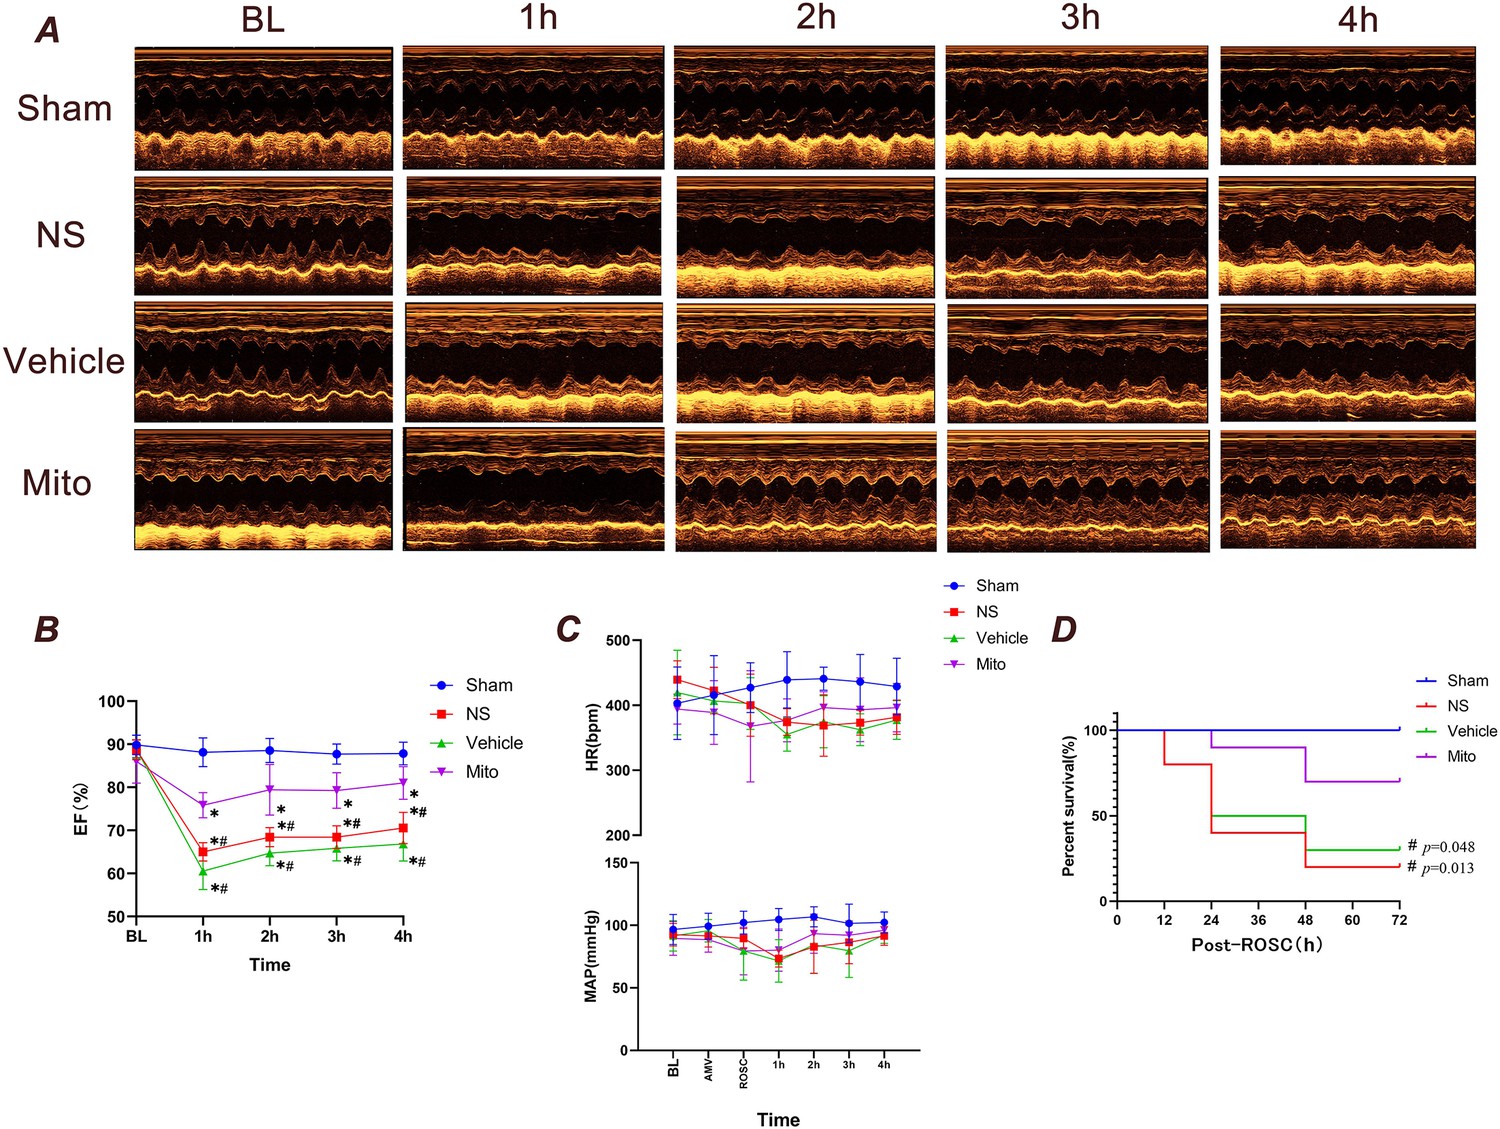
Observational results at 4 and 72 hr after cardiopulmonary resuscitation in rats.
(A) Echocardiograms of rats in each group from baseline to 4 hr following ROSC (n=7). (B) EF of rats in each group from baseline to 4 hr following ROSC (n=7). (C) HR and MAP changes during post -ROSC in 4 hr (n=7). (D) Survival rate during the first 72 hr following ROSC (n=10). Data presented as mean ± standard deviation (SD). Myocardial function between groups was compared by time-based measurements in each group using repeated-measures ANOVA. The survival rate between groups was compared by the Kaplan-Meier survival analysis test. * p<0.05 vs. the Sham group and # p<0.05 vs. the Mito group. BL, baseline; EF, ejection fraction; HR, heart rate; MAP, mean arterial pressure; bpm, beats per minute; mmHg, millimeters of mercury; AMV, after mechanical ventilation; ROSC, return of spontaneous circulation.
Figure 3
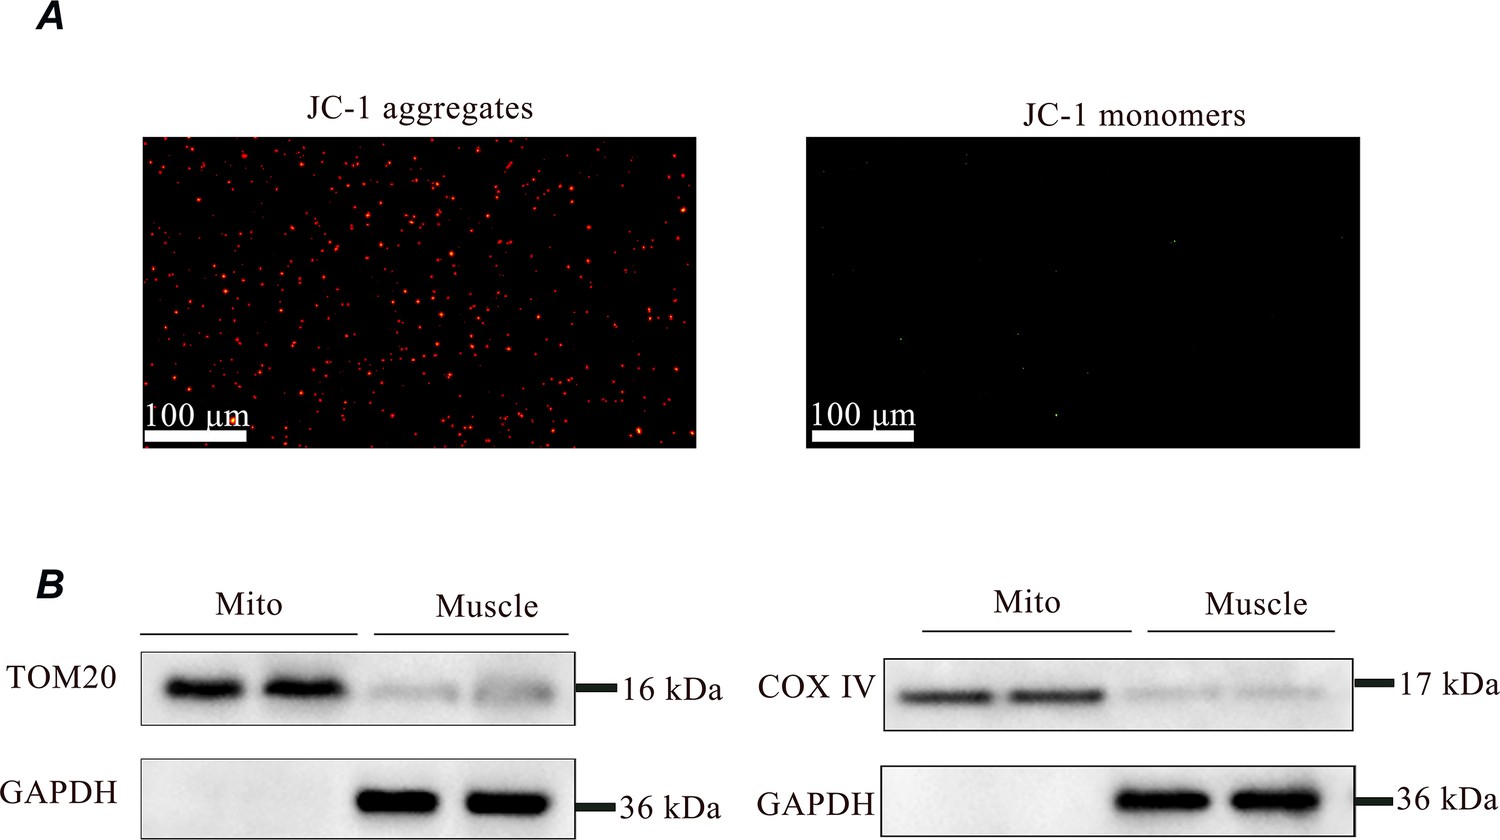
Assessment of the viability and purity of isolated mitochondria.
(A) JC-1 staining of mitochondria after isolation from muscle. The staining of isolated mitochondria by JC-1 is visible either as red for J-aggregates or green for J-monomers. The intensity of the red color indicates that the isolated mitochondria had a high membrane potential, confirming their quality for transplantation. Scale bar = 100 µm. (B) SDS/PAGE analysis of fractions obtained during the purification of muscle mitochondria. GAPDH is only expressed in muscle, confirming its purity for transplantation.
-
Figure 3—source data 1
PDF file containing uncropped western blots with labeling for panel B.
- https://cdn.elifesciences.org/articles/98554/elife-98554-fig3-data1-v1.zip
-
Figure 3—source data 2
Original tiff files of western blots for panel B.
- https://cdn.elifesciences.org/articles/98554/elife-98554-fig3-data2-v1.zip
Figure 4 with 1 supplement
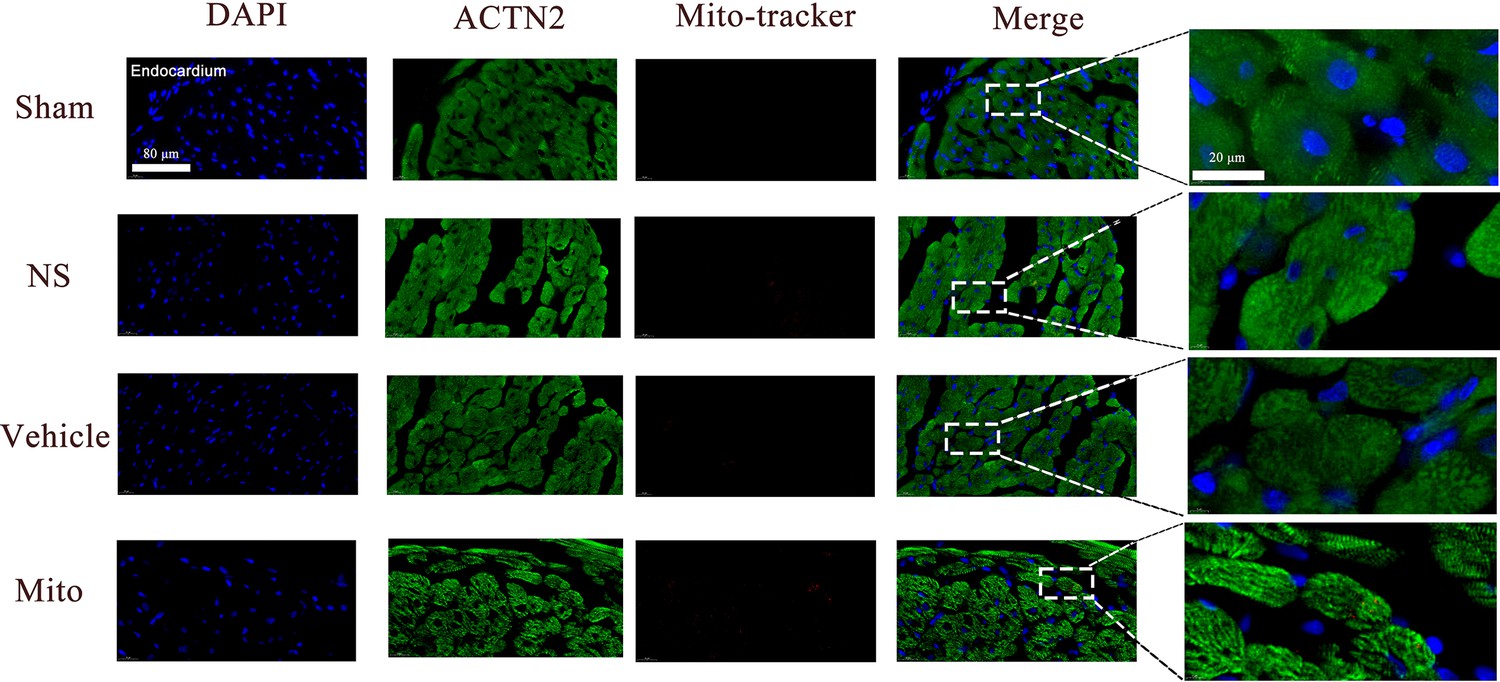
Localization and uptake of transplanted mitochondria in endocardium, myocardial tissue was stained for anti-α-actinin 2 (ACTN2; green) and nuclei (blue); the pre-stained isolated mitochondria were labeled red (n=3).
Scale bar = 80 µm.
Figure 4—figure supplement 1
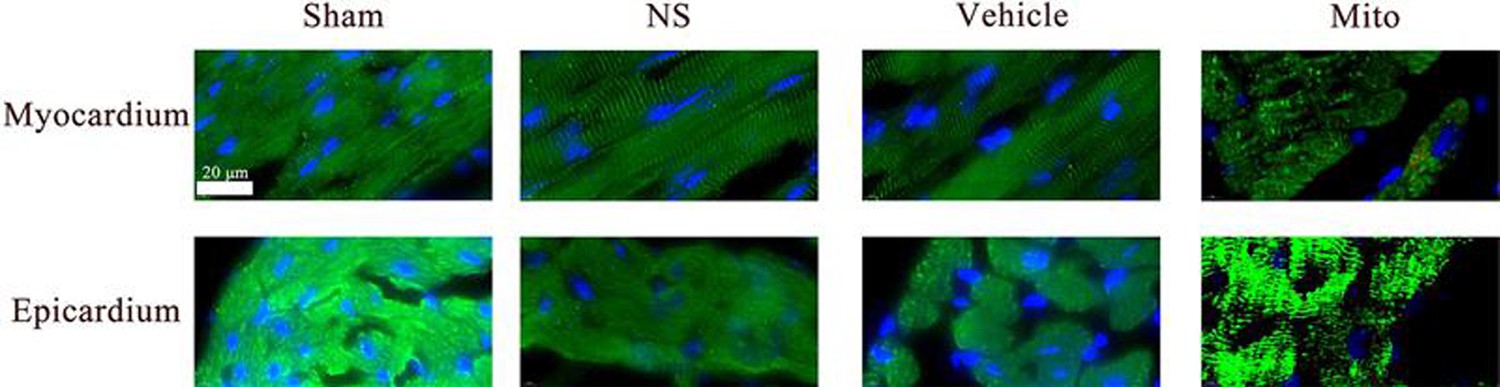
Localization and uptake of transplanted mitochondria in myocardium and epicardium, myocardial tissue was stained for anti-α-actinin 2 (ACTN2; green) and nuclei (blue); the pre-stained isolated mitochondria were labeled red (n=3).
Scale bar = 20 µm.
Figure 5
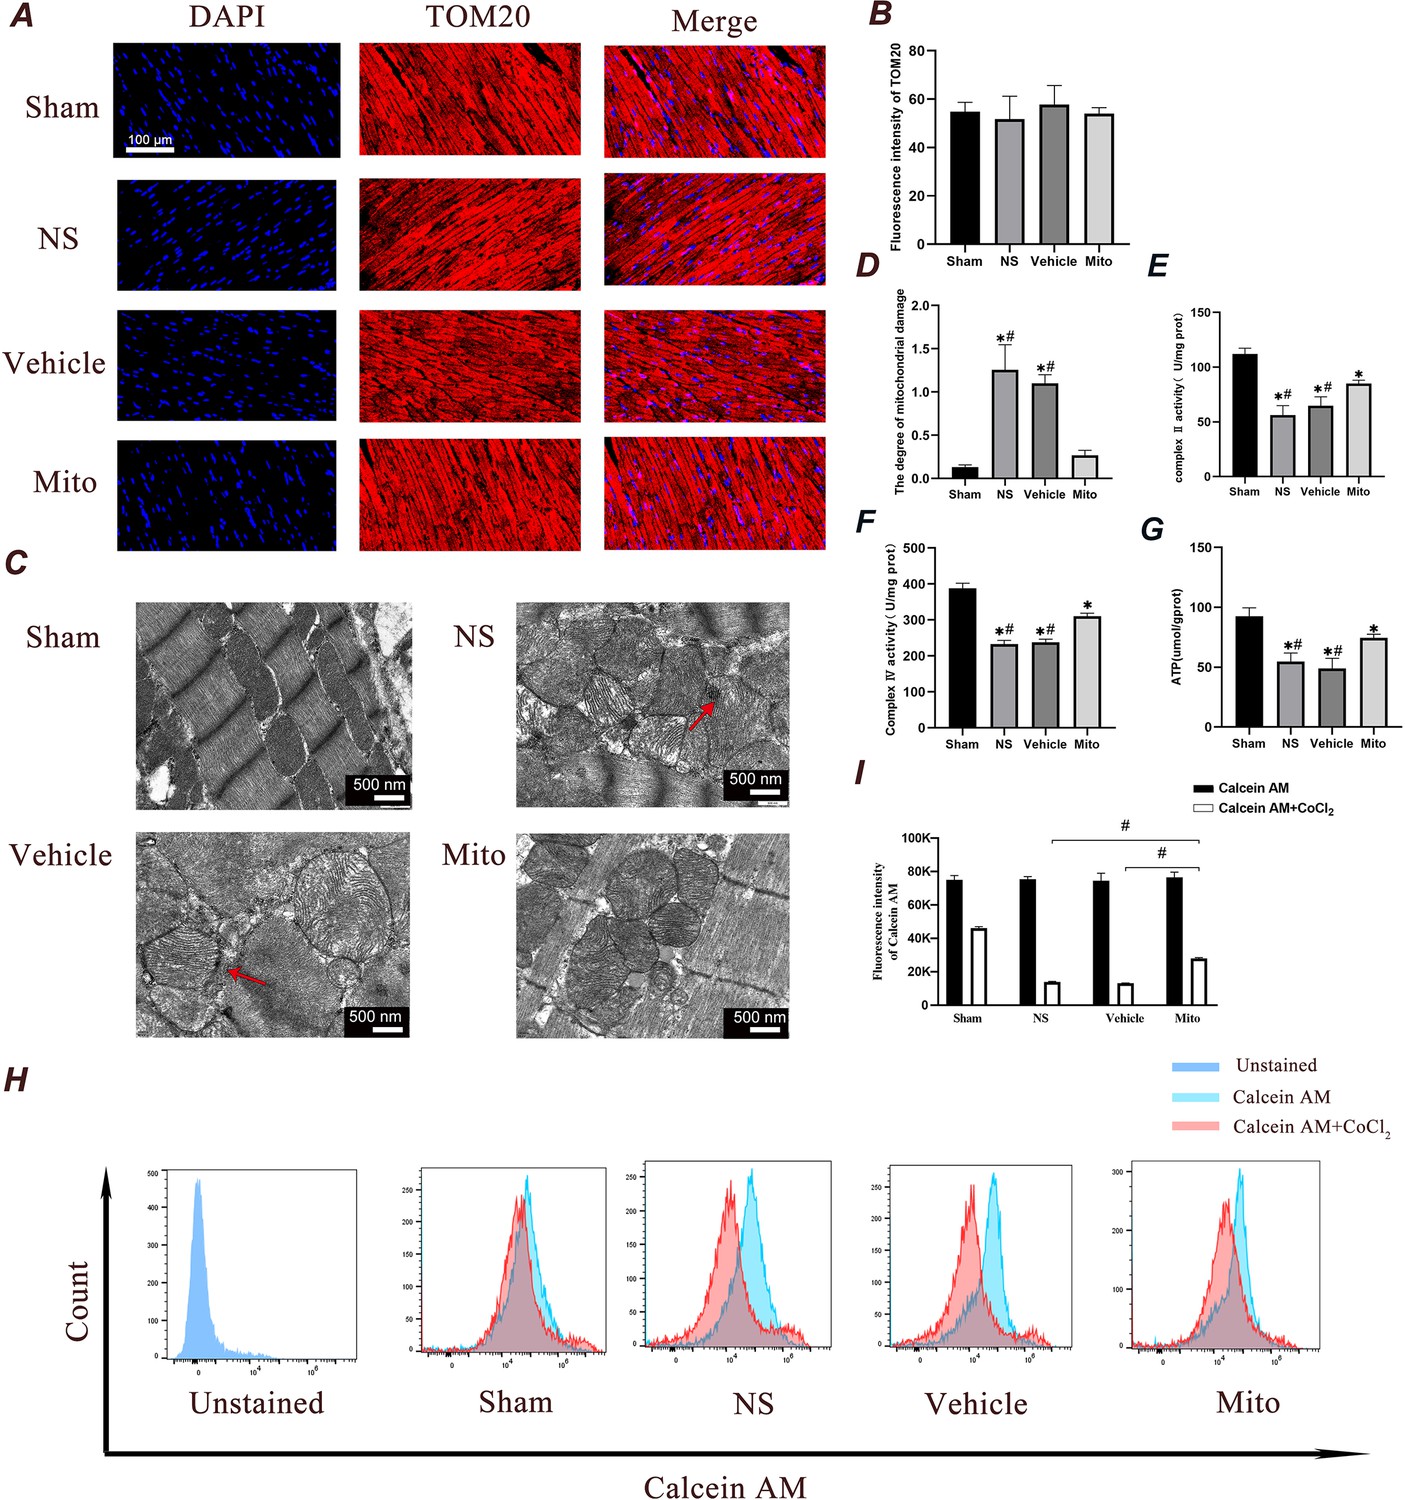
Administration of mitochondria ameliorates ischemia reperfusion-mediated mitochondrial alterations in cardiomyocytes four hours after ROSC.
(A and B) A and B represent the detection of fluorescence intensity of TOM20. A represents the image, while B represents the quantitative data. Scale bar = 100 µm (n=3). (C and D) C shows representative photographs of mitochondrial morphology obtained through TEM examination, with arrows indicate calcium accumulation, D illustrates the degree of mitochondrial damage (n=3). Scale bars = 500 nm. (E and F) Changes in myocardial mitochondrial complex II and IV enzyme activities in hearts (n=7). (G) The ATP content in myocardial tissue was measured by colorimetry (n=7). (H and I) mPTP opening was detected by Calcein staining. I represent the quantitative analysis of the mean fluorescent intensity acquired in H (n=3). Analyses were performed using ANOVA with Tukey’s post hoc test. mPTP opening detection between groups was compared by time-based measurements in each group using repeated-measures ANOVA. The data were expressed as the mean ± standard deviation (SD). * p<0.05 vs. the Sham group and # p<0.05 vs. the Mito group.
Figure 6
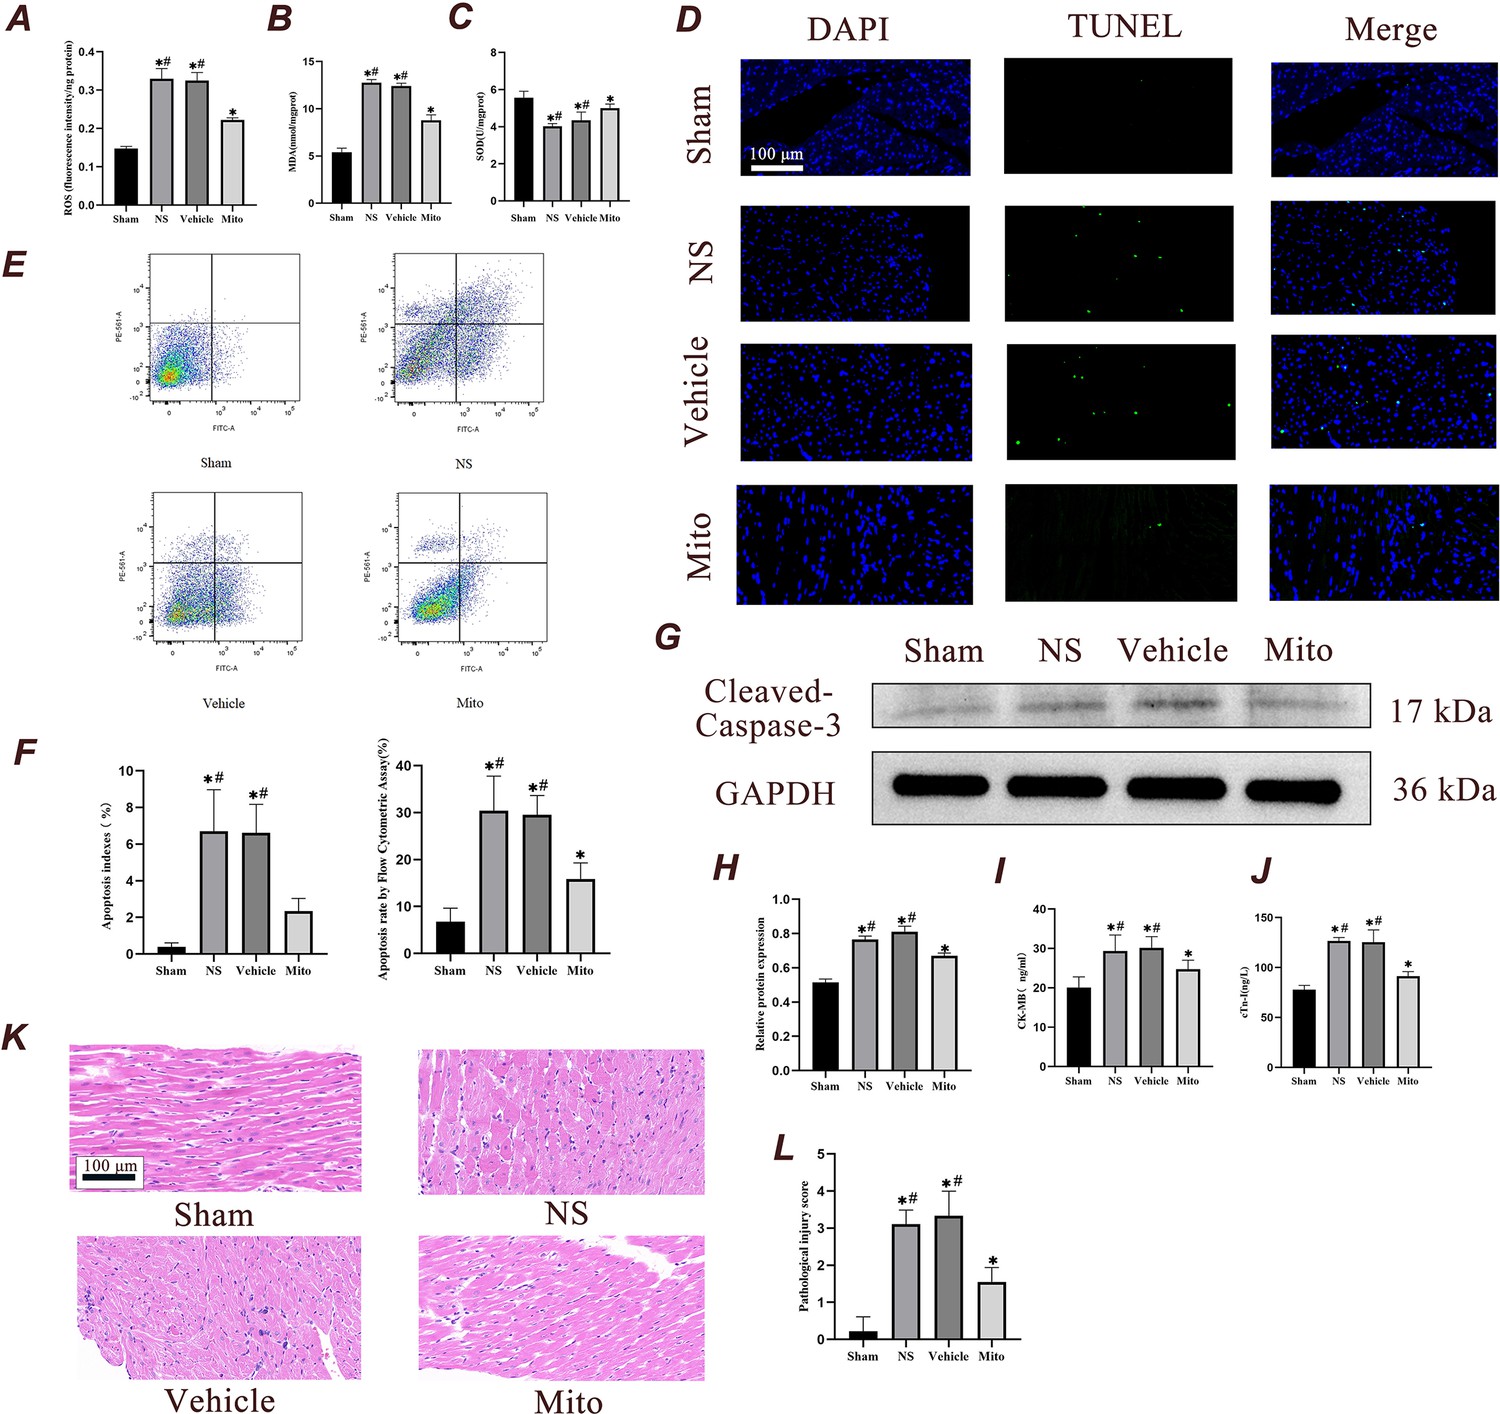
Mitochondrial transplantation reduces myocardial damage 4 hr after ROSC.
(A) Detection of mitochondrial ROS in various groups (n=3). (B and C) Changes in malondialdehyde and superoxide dismutase activity level in cardiac tissue (n=7). (D) Myocardial apoptosis level was examined using TUNEL (n=3). Scale bar = 100 µm. (E) The percentage of myocardial apoptosis was examined using flow cytometry (n=3). (F) Quantitative analysis of myocardial TUNEL apoptosis index and flow apoptosis rate (n=3). (G and H) Immunoblotting and quantitative analysis of the expression level of cleaved caspase-3 in the myocardium 4 hr after ROSC (n=3). (I and J) The changes in CK-MB and cTn-I level in the serum of rats were examined using ELISA (n=7). (K and L) Representative histological sections of the myocardium stained with hematoxylin and eosin. Myocardium from each experimental group were subjected to histological evaluation (n=3), Scale bar = 100 µm. Analyses were performed using ANOVA with Tukey’s post hoc test. The data were expressed as mean ± standard deviation (SD). * p<0.05 vs. Sham group and # p<0.05 vs. Mito group. CK-MB, creatine kinase-MB fraction; cTn-I: cardiac troponin-I.
-
Figure 6—source data 1
PDF file containing uncropped western blots with labeling for panel G.
- https://cdn.elifesciences.org/articles/98554/elife-98554-fig6-data1-v1.zip
-
Figure 6—source data 2
Original tiff files of western blots for panel G.
- https://cdn.elifesciences.org/articles/98554/elife-98554-fig6-data2-v1.zip
Figure 7
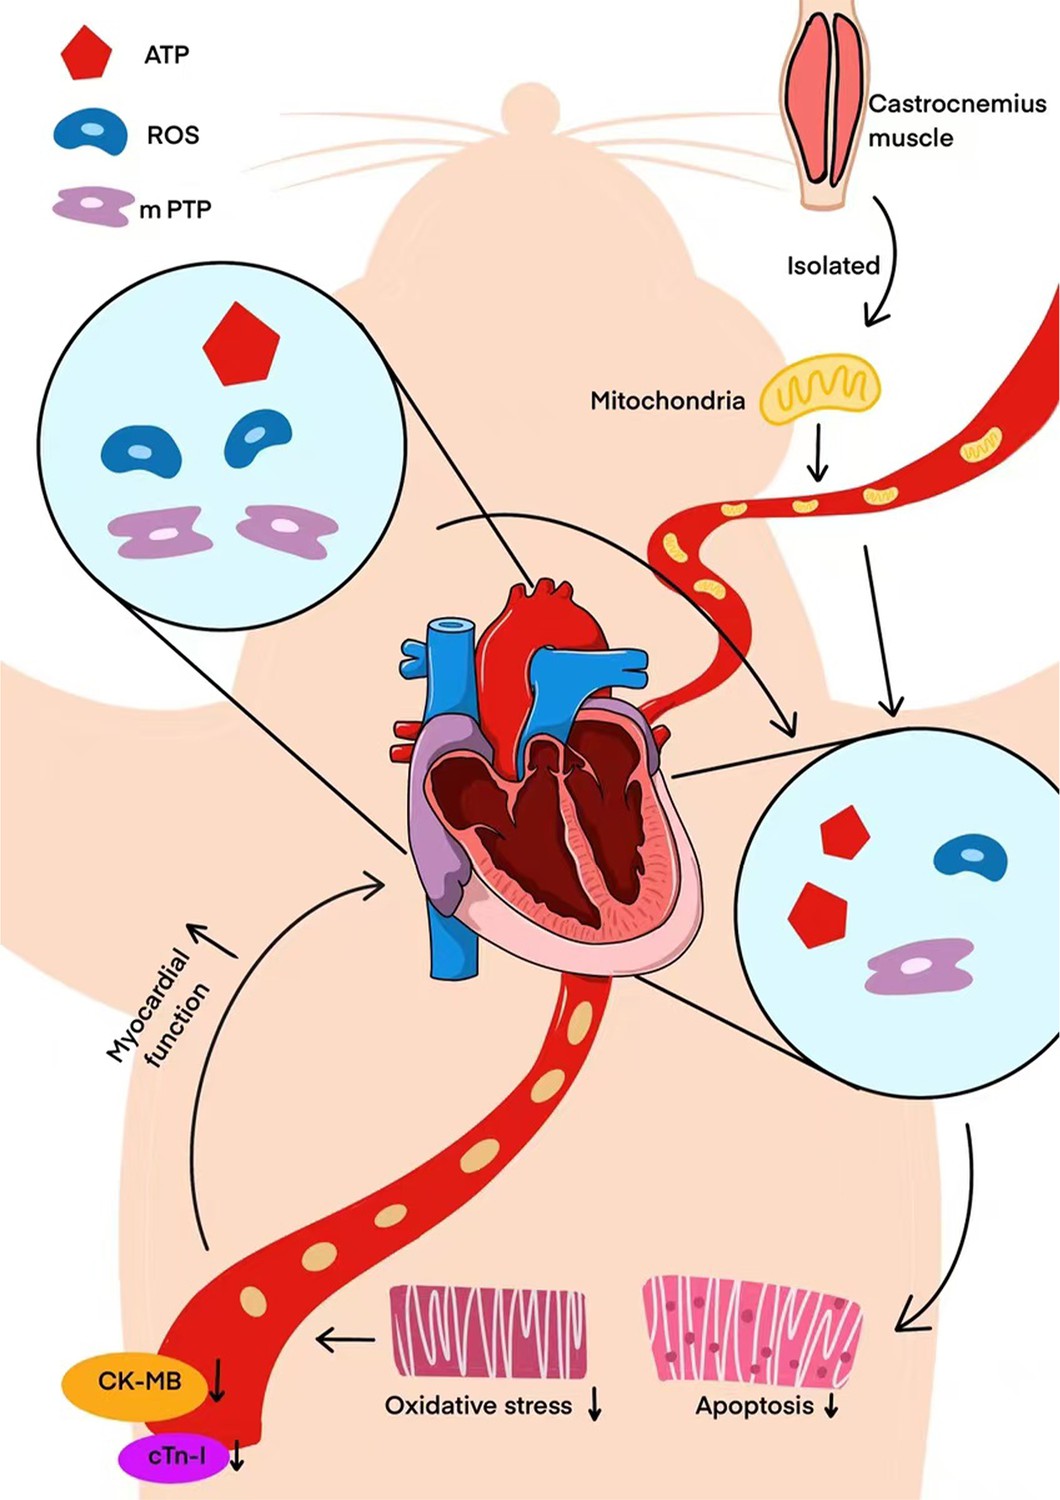
Exogenous mitochondrial transplantation improved cardiac function after CPR.
The specific mechanism involved may be related to the improvement in mitochondrial function, thus reducing the oxidative-stress response and apoptosis of myocardial cells. These dates suggest possible advantage in mitochondrial transplantation following CPR.
Tables
Table 1
Baseline characteristics of rats and resuscitation characteristics (‾x±s).
| Variable | n | Weight (g) | Temp (°C) | CA-induced time (sec) | CPR time (s) | Adrenaline (mcg) | Pentobarbital sodium (mg) | |
|---|---|---|---|---|---|---|---|---|
| Sham | 17 | 321.89±14.09 | 37.20±0.36 | - | - | - | 22.82±2.01 | |
| NS | 17 | 318.65±10.00 | 37.45±0.43 | 234.29±22.89 | 128.41±12.50 | 12.75±0.40 | 21.63±1.35 | |
| Vehicle | 17 | 326.80±11.64 | 37.33±0.37 | 247.06±23.61 | 138.82±14.64 | 13.07±0.47 | 21.79±0.98 | |
| Mito | 17 | 320.64±14.32 | 37.45±0.39 | 241.29±23.38 | 131.88±14.51 | 12.83±0.57 | 21.92±1.05 | |
| p-Value | 0.29 | 0.21 | 0.57 | 0.10 | 0.13 | 0.07 | ||
-
n=17 animals per group. CA, cardiac arrest; CPR, cardiopulmonary resuscitation. All data are expressed as Mean ± SD.
Author response table 1
The SOD activity levels of myocardial samples in groups (U/mgprot).
| Sham | NS | Vehicle | Mito | |
|---|---|---|---|---|
| n | 7 | 7 | 7 | 7 |
| Mean +- SD | 5.55+-0.35 | 4.02+-0.15 | 4.34+-0.45 | 5.00+-0.22 |
Additional files
-
Supplementary file 1
Details of antibodies used in the methodology.
- https://cdn.elifesciences.org/articles/98554/elife-98554-supp1-v1.docx
-
Supplementary file 2
Scoring standard of myocardial pathological injury.
- https://cdn.elifesciences.org/articles/98554/elife-98554-supp2-v1.docx
-
MDAR checklist
- https://cdn.elifesciences.org/articles/98554/elife-98554-mdarchecklist1-v1.docx
Download links
A two-part list of links to download the article, or parts of the article, in various formats.
Downloads (link to download the article as PDF)
Open citations (links to open the citations from this article in various online reference manager services)
Cite this article (links to download the citations from this article in formats compatible with various reference manager tools)
Transplantation of exogenous mitochondria mitigates myocardial dysfunction after cardiac arrest
eLife 13:RP98554.
https://doi.org/10.7554/eLife.98554.3


