A delta-tubulin/epsilon-tubulin/Ted protein complex is required for centriole architecture
- Department of Biology, Washington University in St. Louis, United States
- Department of Biology, Stanford University, United States
- Rockefeller University, United States
Figures
Figure 1 with 2 supplements
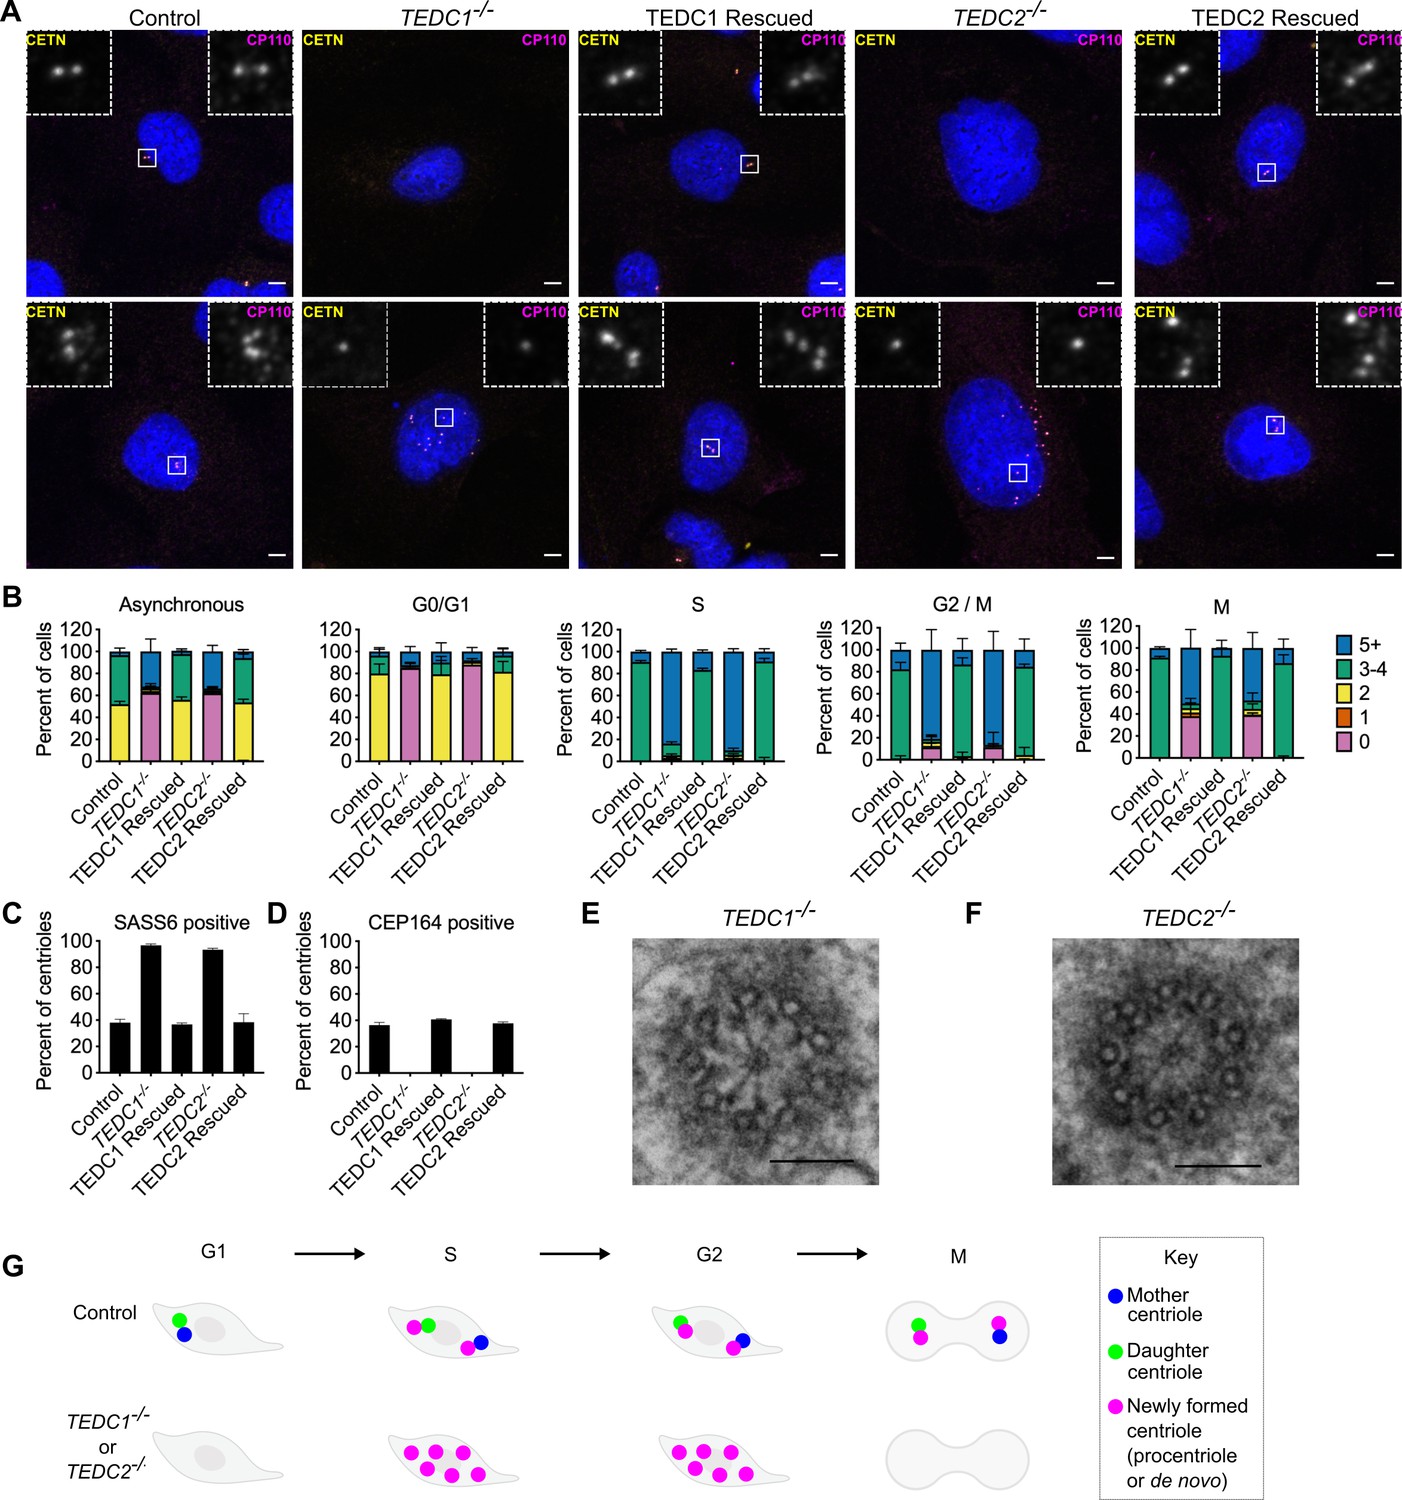
Loss of TEDC1 or TEDC2 phenocopies loss of delta-tubulin or epsilon-tubulin.
(A) Immunofluorescence staining of control (RPE1 TP53-/-), TEDC1-/- (RPE1 TP53-/-; TEDC1-/-), TEDC1 Rescued (RPE1 TP53-/-; TEDC1-/-; TEDC1-Halotag-3xflag), TEDC2-/- (RPE1 TP53-/-; TEDC2-/-), TEDC2 Rescued (RPE1 TP53-/-; TEDC2-/-; TEDC2-V5-APEX2) cells. Top row: G1 stage cells with 2 centrioles. Bottom row: S/G2 stage cells with 4 centrioles. Blue: DAPI; Yellow: Centrin (CETN); Magenta: CP110. Images are maximum projections of confocal stacks. Scale bar: 5 µm (B) Centriole number counts of the indicated cell lines. Cells were either asynchronous, serum-starved for G0/G1, stained for PCNA for S-phase, synchronized with RO-3306 for G2/M, or mitotic figures were identified by DAPI staining. Each condition was performed in triplicate, with n=100 cells scored for each. (C) Percent of all centrioles (parental, pro-, and de novo centrioles) in indicated cell types positive for SASS6 staining. Each condition was performed in triplicate, with 200 cells scored for each. (D) Percent of all centrioles (parental, pro-, and de novo centrioles) in indicated cell types positive for CEP164 staining. Each condition was performed in triplicate, with 100 cells scored for each. (E) TEM cross-section of a centriole in a G2-phase TEDC1-/- cell. Scale bar: 100 nm (F) TEM cross-section of a centriole in a G2-phase TEDC2-/- cell. Scale bar: 100 nm (G) Schematic of centriole formation and loss in control and TEDC1-/- or TEDC2-/- cells.
-
Figure 1—source data 1
Raw data (centriole counts) for Figure 1B, C and D.
- https://cdn.elifesciences.org/articles/98704/elife-98704-fig1-data1-v1.xlsx
Figure 1—figure supplement 1
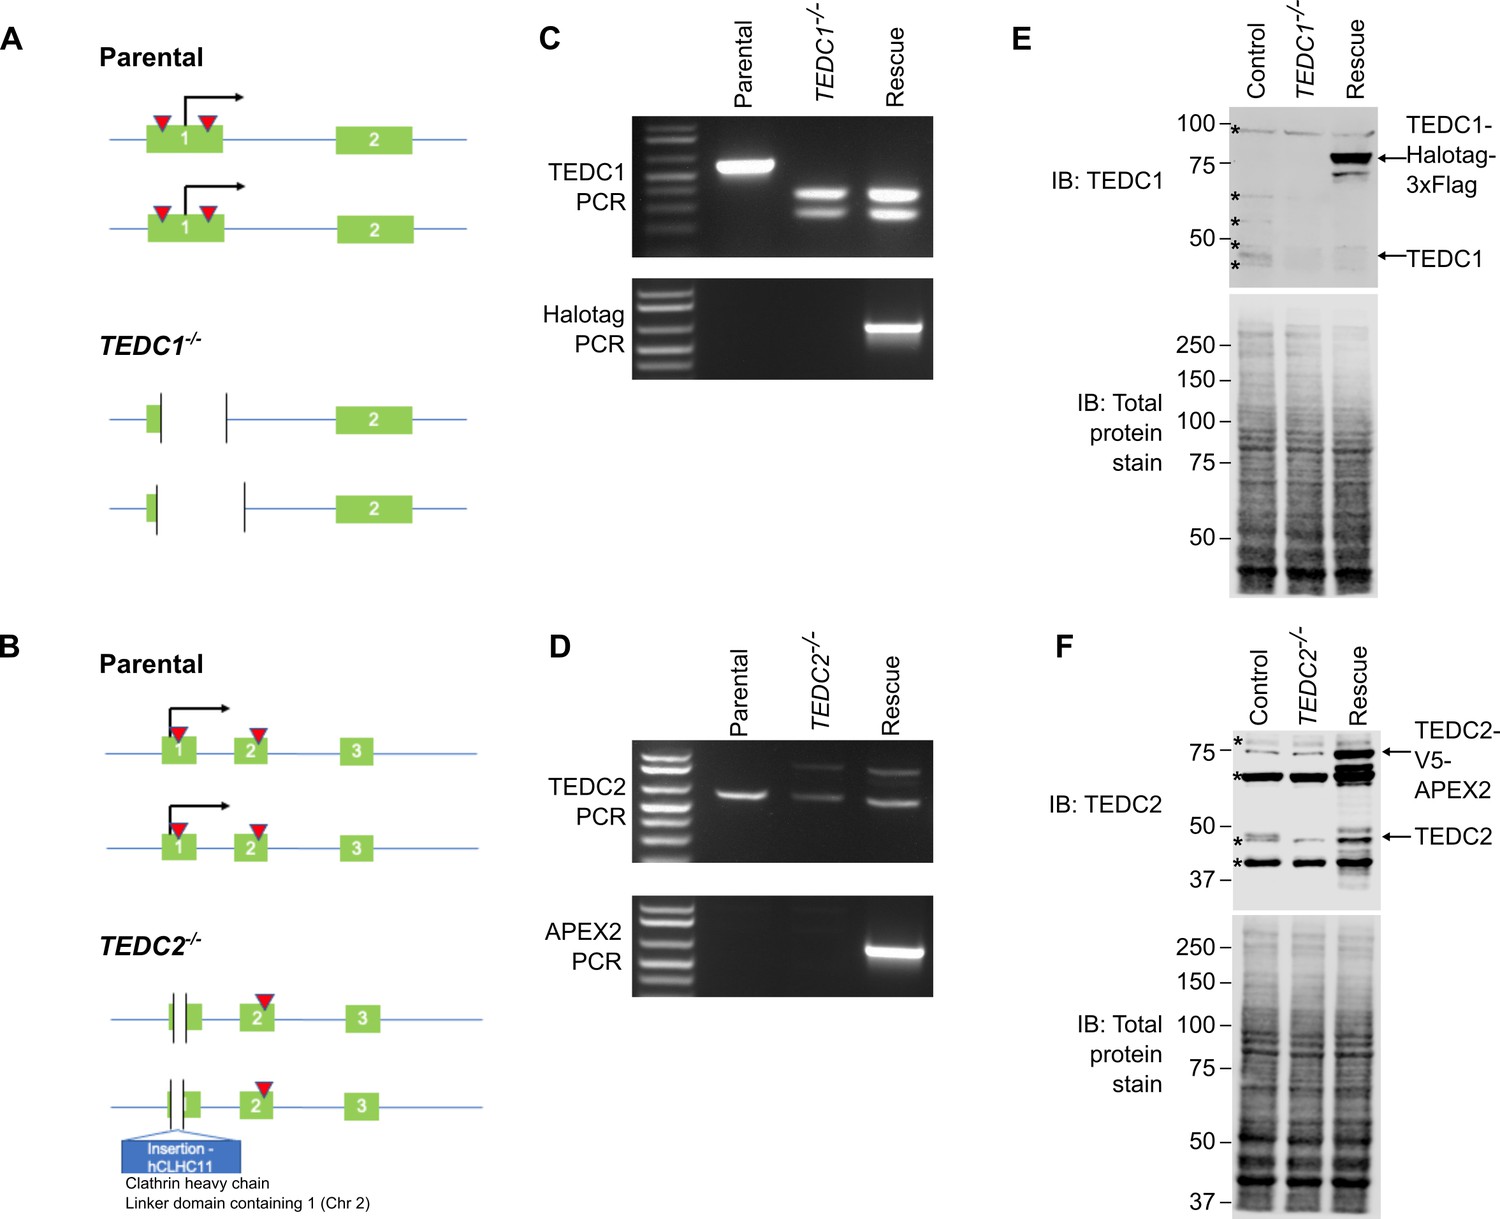
Creation of TEDC1-/- and TEDC2-/- mutant cell lines.
(A) Gene structure of the TEDC1 locus in parental TP53-/- cells and the TEDC1-/- mutant. Green boxes: exons; blue lines: introns; red triangles: sgRNA binding sites; black arrow: translation start site. The TEDC1-/- mutant (clone 2F4) is a compound heterozygote bearing a deletion of 227 bp on one allele and a deletion of 329 bp on the other allele. In both alleles, the ATG start site is deleted and the next ATG is not in-frame. (B) Gene structure of the TEDC2 locus in parental TP53-/- cells and the TEDC2-/- mutant. Green boxes: exons; blue lines: introns; red triangles: sgRNA binding sites; black arrow: translation start site. The TEDC2-/- mutant (clone F5) is a compound heterozygote bearing a deletion of 19 bp on one allele flanking the ATG start site. On the other allele, there is an insertion of 306 bp corresponding to a fusion between TEDC2 and the hCLHC1 gene. In both alleles, the ATG start site is deleted, the next ATG is not in-frame, and no additional ATG start sites are found. (C) Genotyping PCR of the TEDC1 locus in parental TP53-/- cells, the TEDC1-/- mutant, and TEDC1 Rescued (RPE1 TP53-/-; TEDC1-/-; TEDC1-Halotag-3xflag) cells. Top: PCR for TEDC1. Bottom: PCR for Halotag. (D) Genotyping PCR of the TEDC2 locus in parental TP53-/- cells, the TEDC1-/- mutant, and TEDC2 Rescued (RPE1 TP53-/-; TEDC2-/-; TEDC2-V5-APEX2) cells. Top: PCR for TEDC2. Bottom: PCR for APEX2. (E) Western blot of TEDC1 protein levels in parental TP53-/- cells, the TEDC1-/- mutant, and TEDC1 Rescued (RPE1 TP53-/-; TEDC1-/-; TEDC1-Halotag-3xflag) cells. Total protein stain is used as a loading control. TEDC1-Halotag-3xFlag is overexpressed 73-fold above endogenous levels (average of three independent experiments). Asterisks mark non-specific bands. (F) Western blot of TEDC2 protein levels in parental TP53-/- cells, the TEDC2-/- mutant, and TEDC2 Rescued (RPE1 TP53-/-; TEDC2-/-; TEDC2-V5-APEX2) cells. Total protein stain is used as a loading control. TEDC2-V5-APEX2 is overexpressed 26-fold above endogenous levels (average of three independent experiments). Asterisks mark non-specific bands.
-
Figure 1—figure supplement 1—source data 1
Original files of full uncropped, unedited blots in Figure 1—figure supplement 1E and F.
- https://cdn.elifesciences.org/articles/98704/elife-98704-fig1-figsupp1-data1-v1.zip
-
Figure 1—figure supplement 1—source data 2
Labeled uncropped, unedited blots in Figure 1—figure supplement 1E and F.
- https://cdn.elifesciences.org/articles/98704/elife-98704-fig1-figsupp1-data2-v1.zip
Figure 1—figure supplement 2
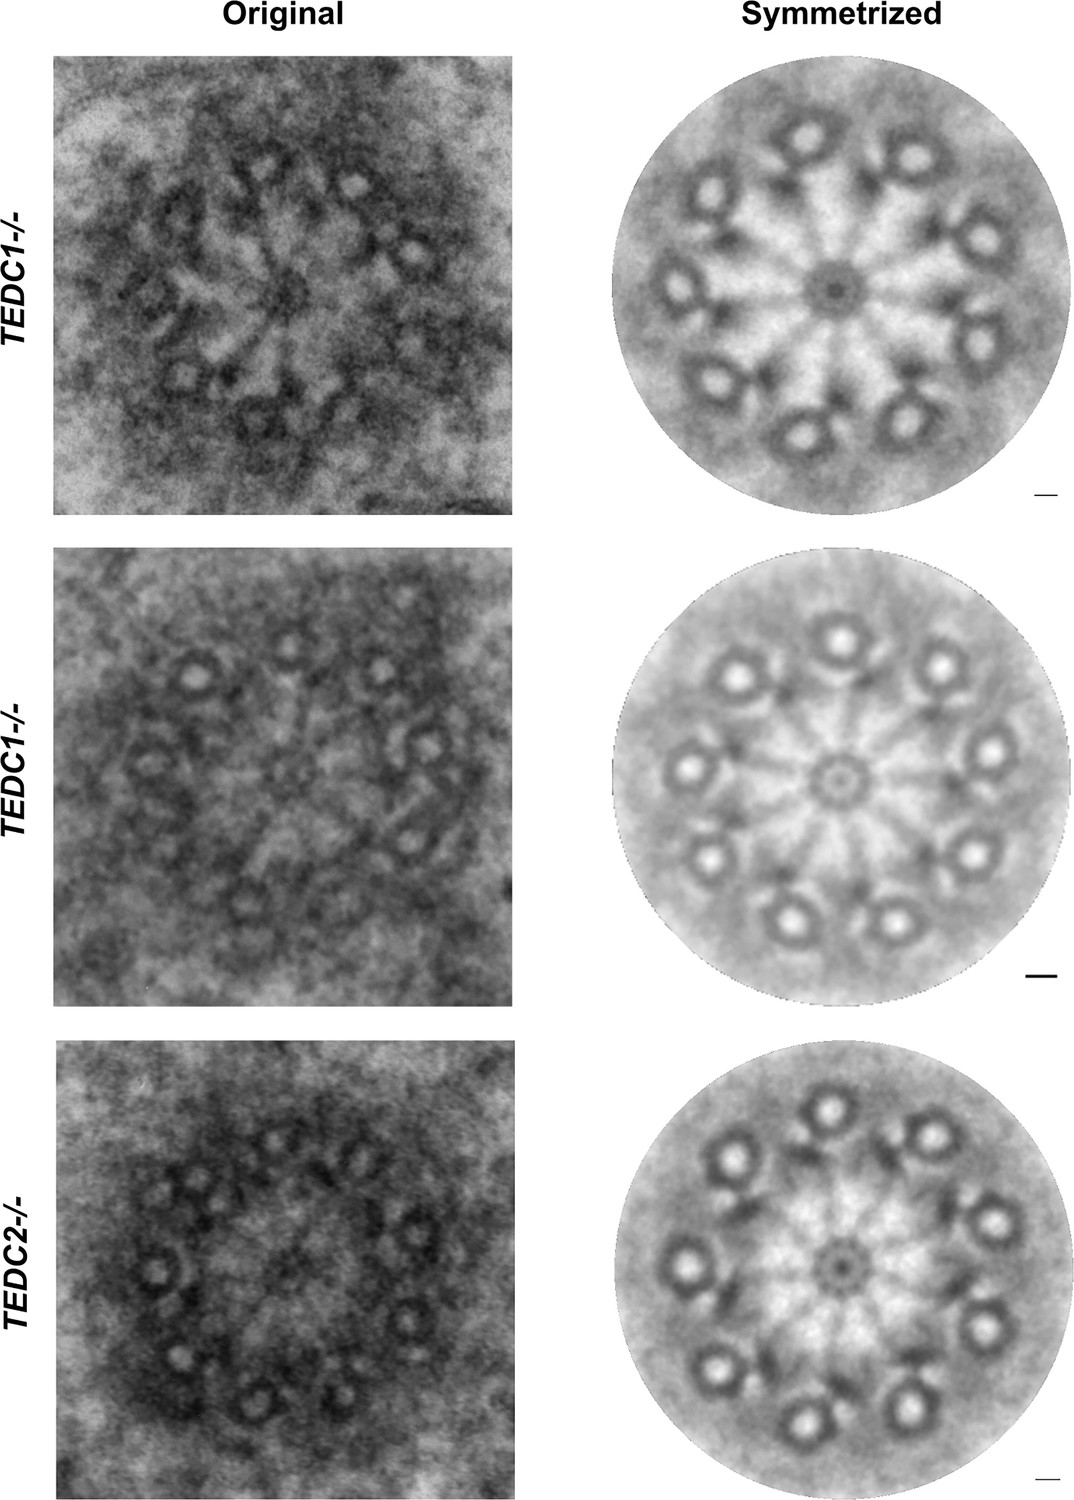
Symmetrization of TEDC1-/- and TEDC2-/- mutant centrioles.
Figure 2 with 1 supplement
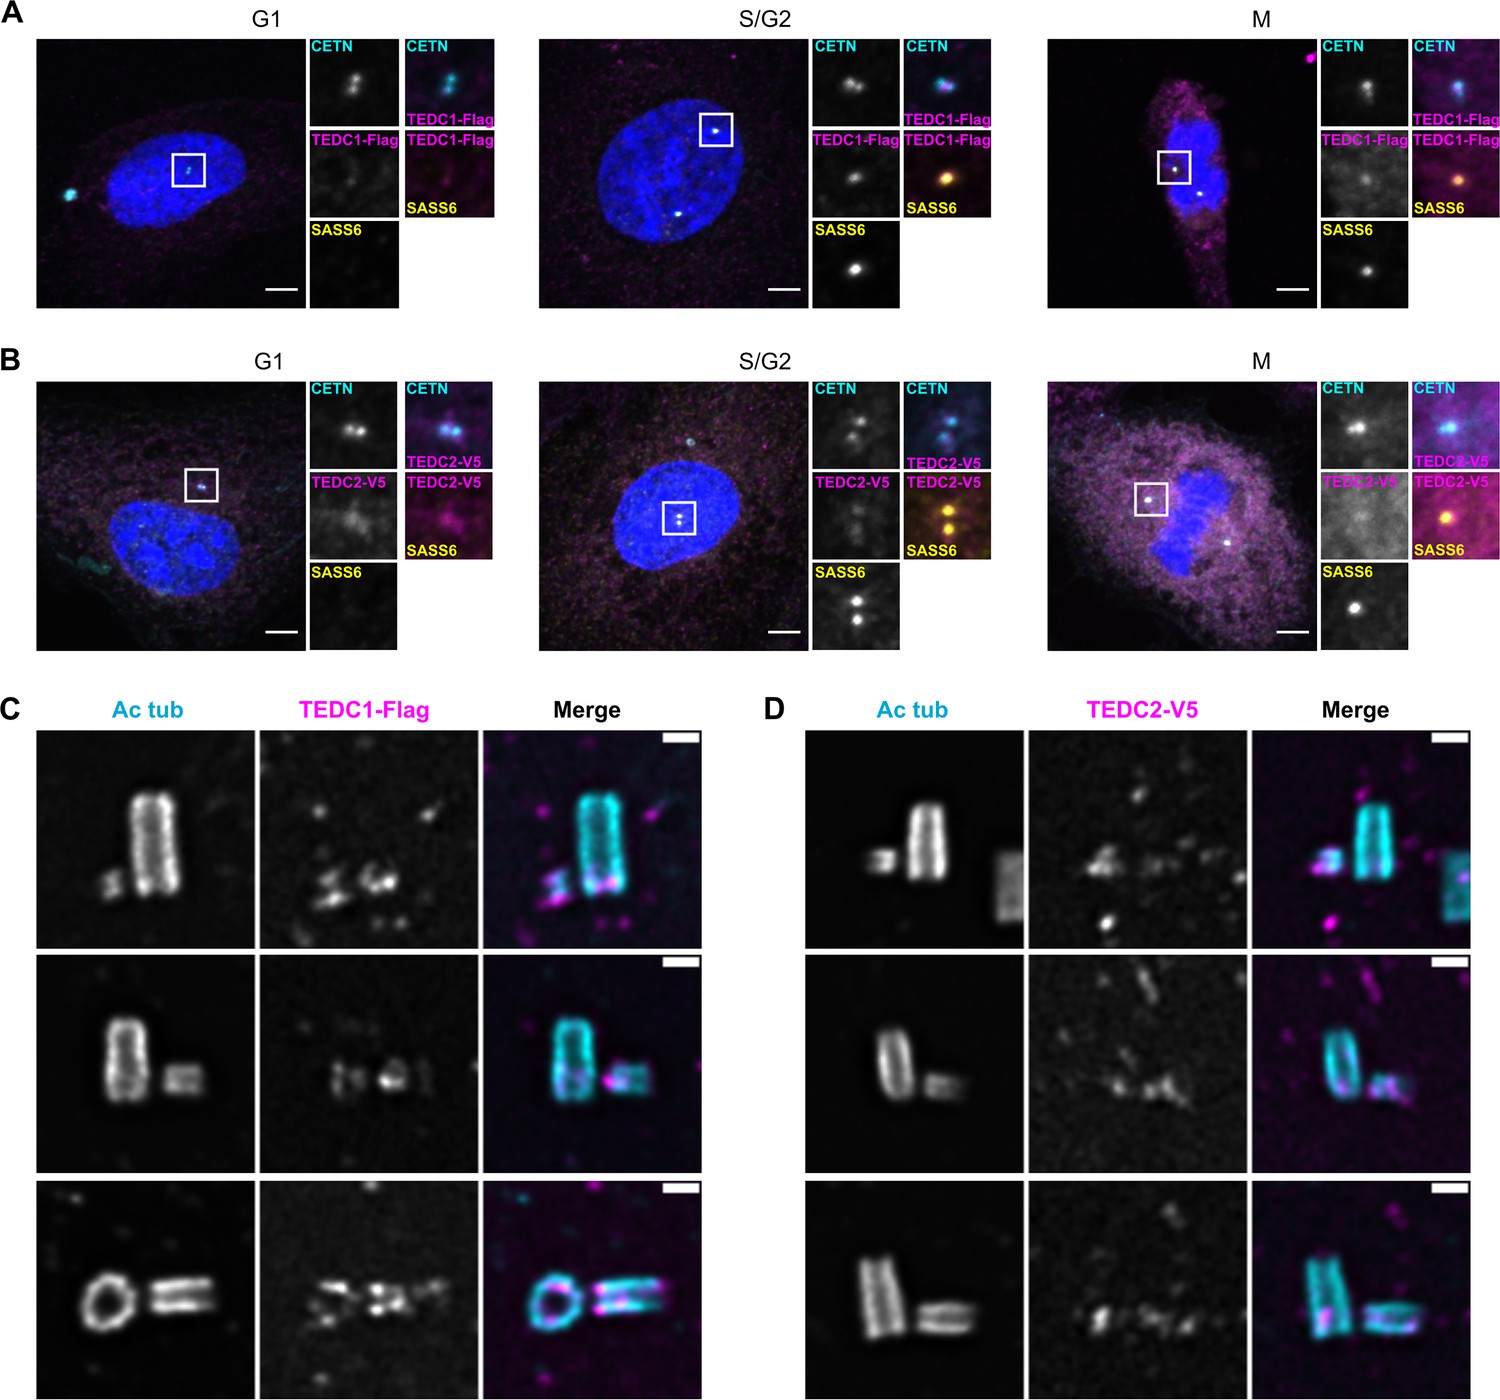
TEDC1 and TEDC2 localize to centrioles.
(A) Immunofluorescence staining of TEDC1 rescue cell lines expressing TEDC1-Halotag-3xFlag in G1, S/G2, and M. Images are maximum projections of confocal stacks. Blue: DAPI; Cyan: Centrin (CETN); Magenta: TEDC1-Halotag-3xFlag (localized with anti-Flag antibody); Yellow: SASS6. Scale bar: 5 µm. (B) Immunofluorescence staining of TEDC2 rescue cell lines expressing TEDC2-V5-APEX2 in G1, S/G2, and M. Images are maximum projections of confocal stacks. Blue: DAPI; Cyan: Centrin (CETN, localized with anti-GFP antibody recognizing GFP-centrin); Magenta: TEDC2-V5-APEX2 (localized with anti-V5 antibody); Yellow: SASS6. Scale bar: 5 µm. (C) U-ExM of TEDC1 rescue cell lines expressing TEDC1-Halotag-3xFlag, arranged by procentriole length. Cyan: Acetylated tubulin; Magenta: TEDC1-Halotag-3xFlag (localized with anti-Flag antibody). Confocal image stacks were deconvolved using Microvolution; single plane images shown. Scale bar: 1 µm. (D) U-ExM of TEDC2 rescue cell lines expressing TEDC2-V5-APEX2, arranged by procentriole length. Cyan: Acetylated tubulin; Magenta: TEDC2-V5-APEX2 (localized with anti-V5 antibody). Confocal image stacks were acquired with a Yokogawa CSU-W1 spinning disk microscope and deconvolved using Microvolution; single plane images shown. Scale bar: 1 µm.
Figure 2—figure supplement 1
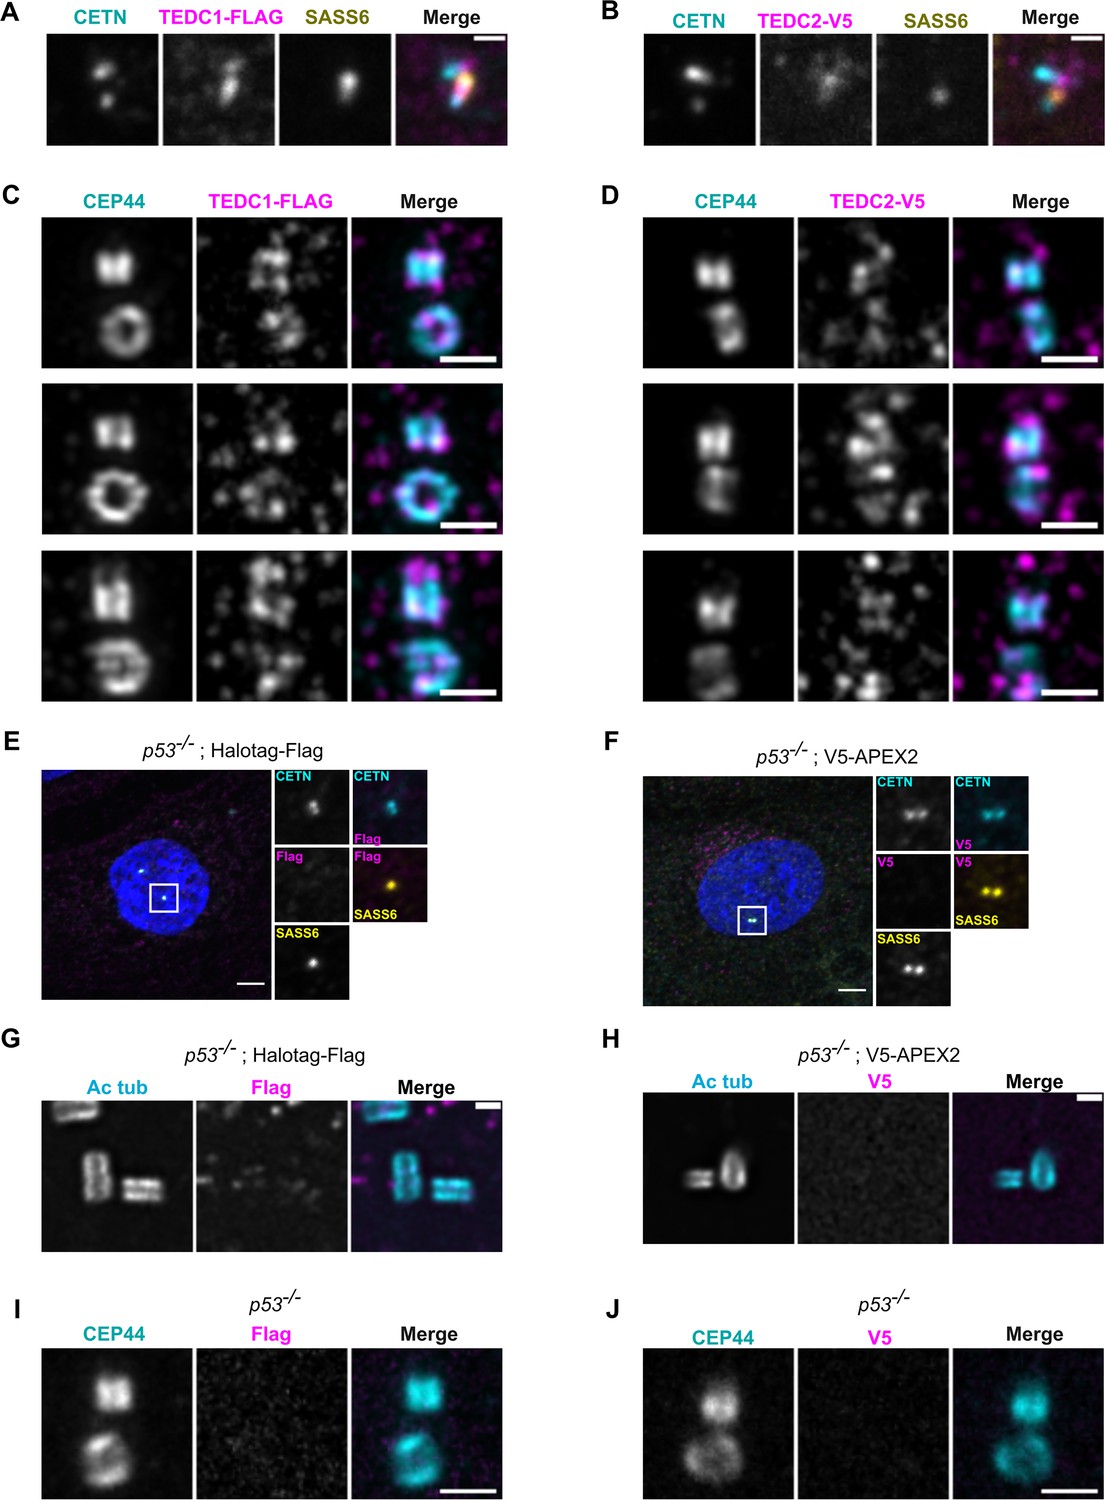
Extended localization analyses of TEDC1 and TEDC2.
(A) Immunofluorescence staining of a TEDC1 rescue cell in G2 phase expressing TEDC1-Halotag-3xFlag, super-resolution image using SoRA disk and 2.8 x relay. Maximum projection. Cyan: Centrin (CETN); Magenta: TEDC1-Halotag-3xFlag (localized with anti-Flag antibody); Yellow: SASS6. Scale bar: 0.5 µm (B) Immunofluorescence staining of a TEDC2 rescue cell in G2 phase expressing TEDC2-V5-APEX2, super-resolution image using SoRA disk and 2.8 x relay. Maximum projection. Cyan: Centrin (CETN); Magenta: TEDC2-V5-APEX2 (localized with anti-V5 antibody); Yellow: SASS6. Scale bar: 0.5 µm (C) Expansion microscopy image of TEDC1 rescue cells expressing TEDC1-Halotag-3xFlag. Expansion gel was made as described in Kong et al., 2024. The procentriole is oriented vertically. Cyan: CEP44; Magenta: TEDC1-Halotag-3xFlag (localized with anti-Flag antibody). Deconvolved using Microvolution; maximum projection. Scale bar: 1 µm. (D) Expansion microscopy image of TEDC2 rescue cells expressing TEDC2-V5-APEX2. Expansion gel was made as described in Kong et al., 2024. The procentriole is oriented vertically. Cyan: CEP44; Magenta: TEDC2-V5-APEX2 (localized with anti-V5 antibody). Deconvolved using Microvolution; maximum projection of confocal stacks. Scale bar: 1 µm. (E) Immunofluorescence staining of TP53-/- cells expressing Halotag-Flag - negative control for Figure 2A. Images are maximum projections of confocal stacks and were acquired with the same exposure settings as in Figure 2A. Blue: DAPI; Cyan: Centrin; Magenta: Flag; Yellow: SASS6. Scale bar: 5 µm. (F) Immunofluorescence staining of TP53-/- cells expressing V5-APEX2 - negative control for Figure 2B. Images are maximum projections of confocal stacks and were acquired with the same exposure settings as in Figure 2B. Blue: DAPI; Cyan: Centrin (localized with anti-GFP antibody recognizing GFP-centrin); Magenta: V5; Yellow: SASS6. Scale bar: 5 µm. (G) U-ExM of TP53-/- cells expressing Halotag-Flag - negative control for Figure 2C. Cyan: Acetylated tubulin; Magenta: Flag. Confocal image stacks were deconvolved using Microvolution; single plane images shown. Images were acquired using the same parameters as Figure 2C. Scale bar: 1 µm. (H) U-ExM of TP53-/- cells expressing V5-APEX2 - negative control for Figure 2D. Cyan: Acetylated tubulin; Magenta: V5. Confocal image stacks were deconvolved using Microvolution; single plane images shown. Images were acquired using the same parameters as Figure 2D. Scale bar: 1 µm. (I) Expansion microscopy image of TP53-/- cells stained with Flag antibody, negative control for (C). Cyan: CEP44; Magenta: Flag. Confocal image stacks were deconvolved using Microvolution; image is a maximum projection of confocal stack. Scale bar: 1 µm. (J) Expansion microscopy image of TP53-/- stained with V5 antibody, negative control for (D).Cyan: CEP44; Magenta: V5. Confocal image stacks were deconvolved using Microvolution; image is a maximum projection of confocal stack. Scale bar: 1 µm.
Figure 3 with 1 supplement
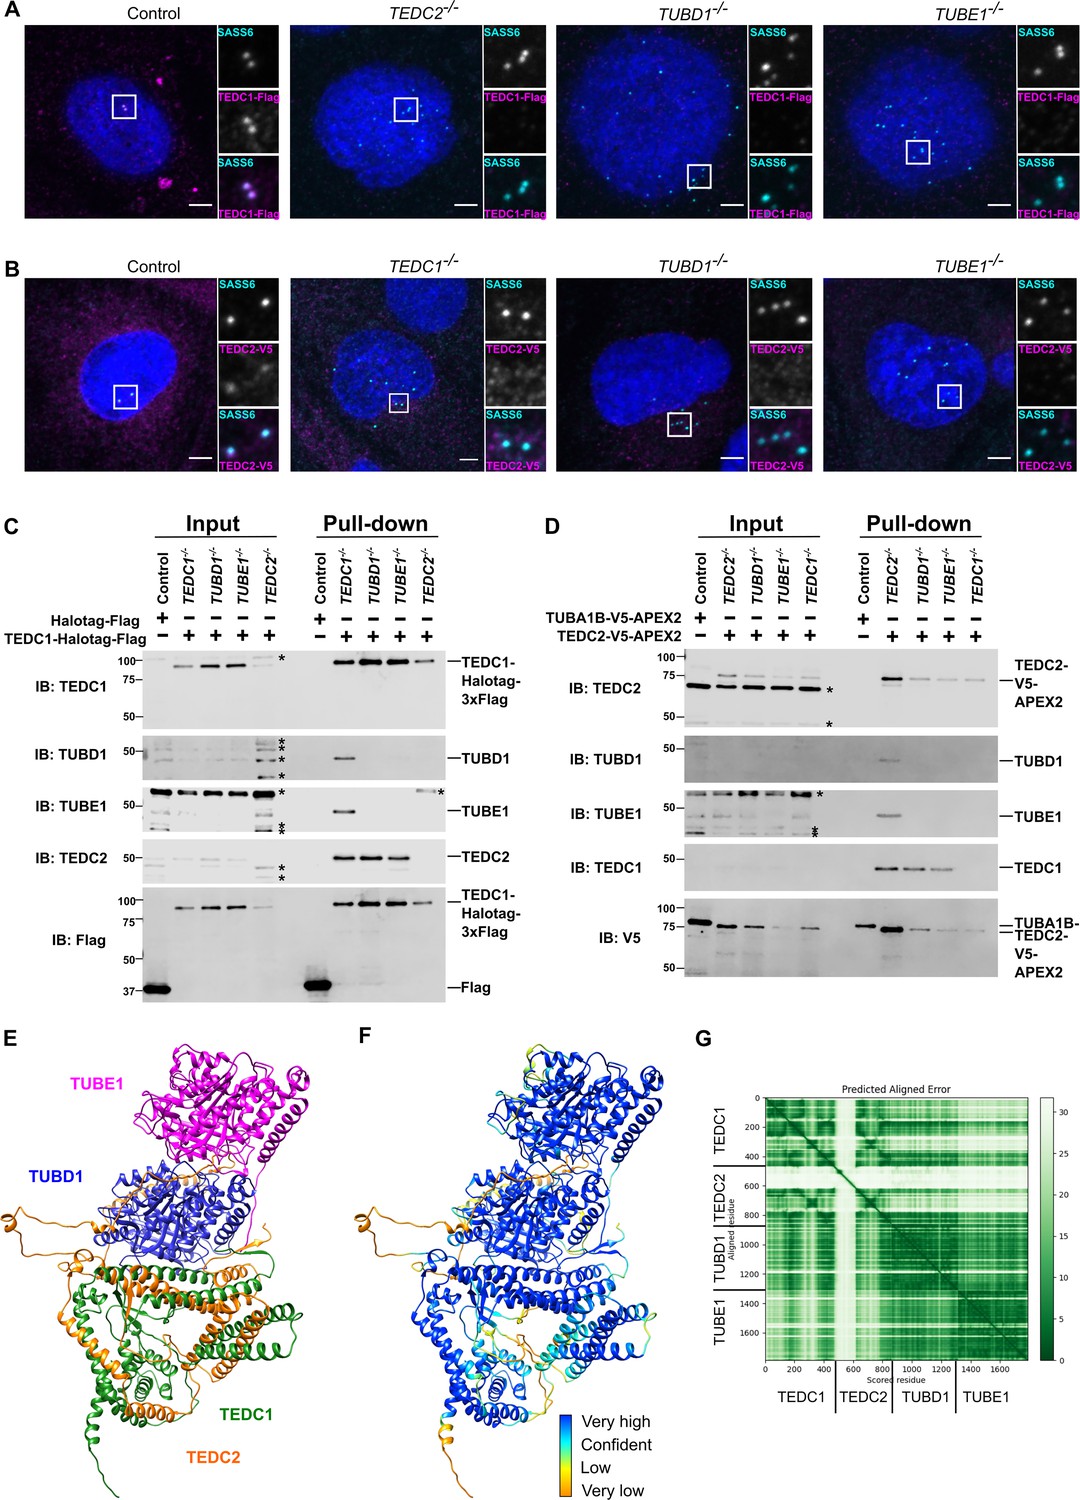
TEDC1, TEDC2, TUBD1, TUBE1 form a complex in cells.
(A) Centrosomal TEDC1 localization depends on TEDC2, TUBD1, TUBE1. Immunofluorescence staining of cells expressing TEDC1-Halotag-3xFlag. Control cell is TEDC1-/- mutant cells rescued with TEDC1-Halotag-3xFlag. Images are maximum projections of confocal stacks. Blue: DAPI; Cyan: SASS6; Magenta: TEDC1-Halotag-3xFlag (localized with anti-Flag antibody). Scale bar: 5 µm. (B) Centrosomal TEDC2 localization depends on TEDC1, TUBD1, TUBE1. Immunofluorescence staining of cells expressing TEDC2-V5-APEX2. Control cell is TEDC2 mutant cells rescued with TEDC2-V5-APEX2. Images are maximum projections of confocal stacks. Blue: DAPI; Cyan: SASS6; Magenta: TEDC2-V5-APEX2 (localized with anti-V5 antibody). Scale bar: 5 µm. (C) TEDC1 pulls down TEDC2 in the absence of delta or epsilon-tubulin. Western blot of input and pulldown of Halotag-Flag or TEDC2-Halotag-Flag in the indicated cell lines. Control cells are TP53-/- cells expressing Halotag-3xFlag. IB: indicates the antibody used for immunoblotting. The proteins and their positions are labeled on the right. Asterisks mark non-specific bands. (D) TEDC2 pulls down TEDC1 in the absence of delta or epsilon-tubulin. Western blot of input and pulldown of TUBA1B-V5-APEX2 or TEDC2-V5-APEX2 in the indicated cell lines. Control cells are TP53-/- cells expressing TUBA1B-V5-APEX2. IB: indicates the antibody used for immunoblotting. The proteins and their positions are labeled on the right. Asterisks mark non-specific bands. (E) AlphaFold-Multimer prediction of the complex (F) AlphaFold-Multimer prediction colored according to pLDDT. Very high: pLDDT > 90. High: 90 > pLDDT > 70. Low: 70 > pLDDT > 50. Very low: pLDDT <50 (G) Predicted align error of the AlphaFold Multimer prediction. Expected position error (Angstroms) is graphed.
-
Figure 3—source data 1
Original files of full uncropped, unedited blots in Figure 3C and D.
- https://cdn.elifesciences.org/articles/98704/elife-98704-fig3-data1-v1.zip
-
Figure 3—source data 2
Labeled uncropped, unedited blots in Figure 3C and D.
- https://cdn.elifesciences.org/articles/98704/elife-98704-fig3-data2-v1.zip
Figure 3—figure supplement 1
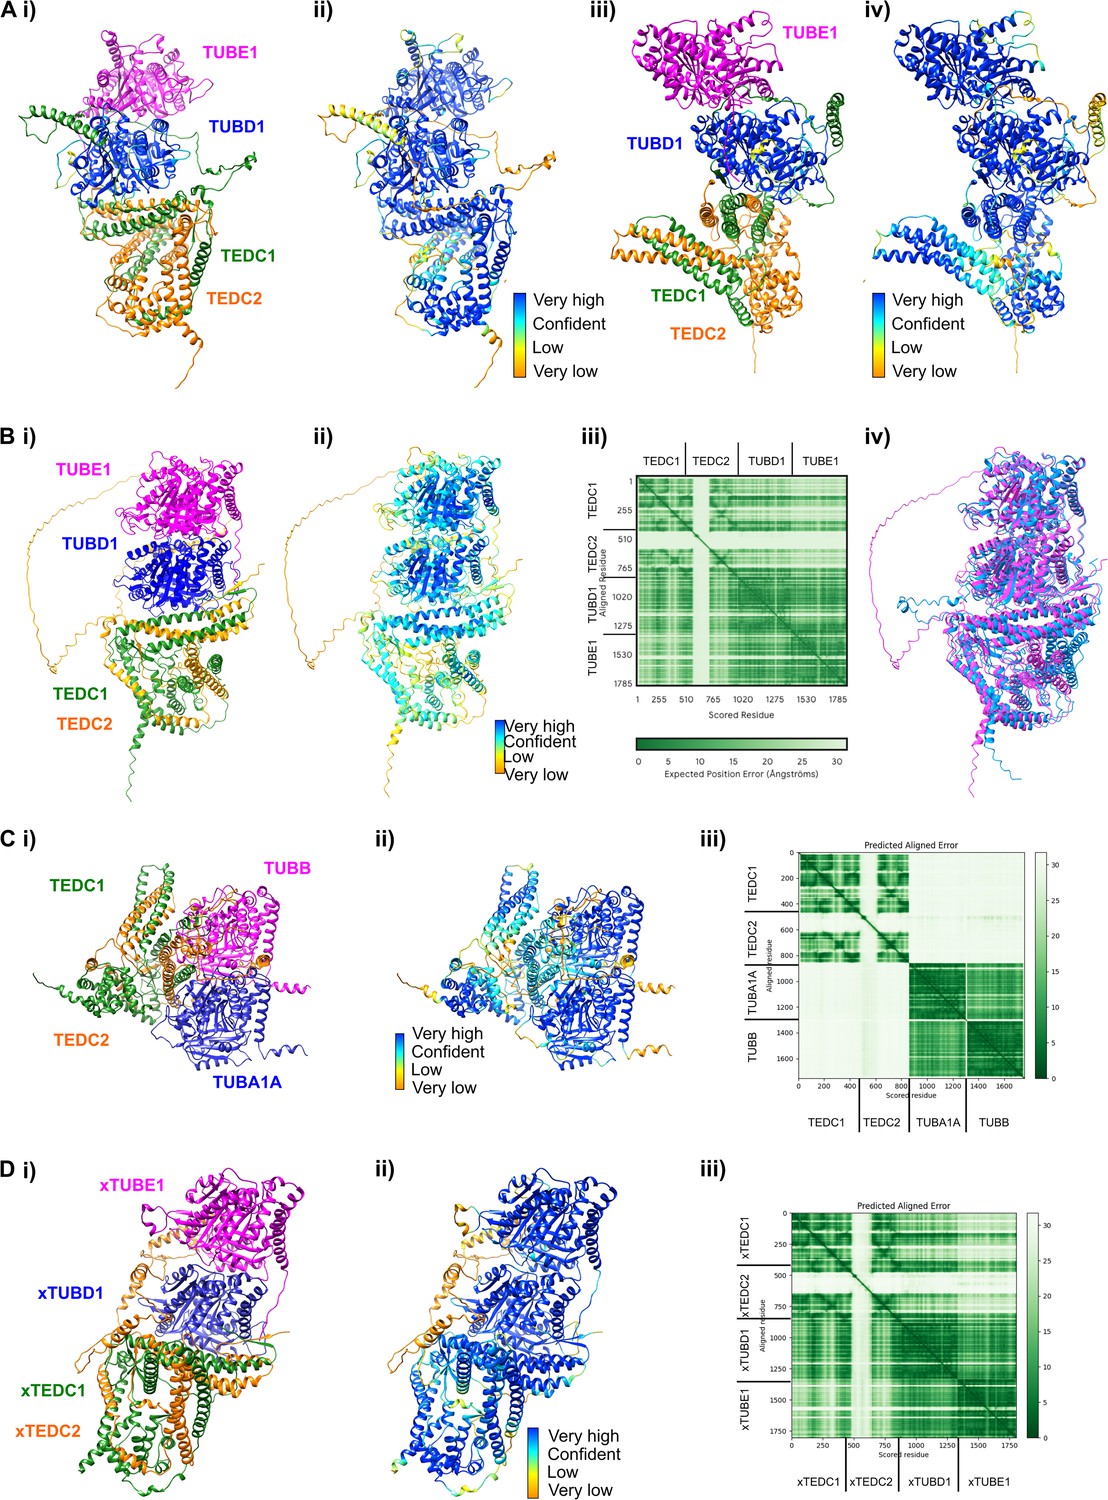
AlphaFold-Multimer and AlphaFold3 predictions.
(Ai) Rotated view of the AlphaFold-Multimer prediction from Figure 3E (120 degrees around the y-axis) (Aii) Rotated view colored according to pLDDT. Very high: pLDDT > 90. High: 90 > pLDDT > 70. Low: 70 > pLDDT > 50. Very low: pLDDT <50 (Aiii) Rotated view of the AlphaFold-Multimer prediction from Figure 3E (240 degrees around the y-axis) (Aiv) Rotated view colored according to pLDDT. Very high: pLDDT >90. High: 90>pLDDT > 70. Low: 70>pLDDT > 50. Very low: pLDDT <50 (Bi) AlphaFold3 prediction of the complex (Bii) AlphaFold3 prediction colored according to pLDDT. Very high: pLDDT >90. High: 90>pLDDT > 70. Low: 70>pLDDT > 50. Very low: pLDDT <50 (Biii) Predicted align error of the AlphaFold3 prediction. Expected position error (Angstroms) is graphed. (Biv) Structural alignment between the AlphaFold3 prediction (magenta) and the AlphaFold-Multimer prediction (cyan). Using ChimeraX v1.7.1 Matchmaker, the RMSD between 450 pruned atom pairs is 0.538 angstroms (across all 475 pairs: 0.979). (Ci) AlphaFold-Multimer prediction of TEDC1, TEDC2, TUBA1A, TUBB (Cii) AlphaFold-Multimer prediction from (Ci) colored according to pLDDT. Very high: pLDDT >90. High: 90>pLDDT > 70. Low: 70>pLDDT > 50. Very low: pLDDT <50 (Ciii) Predicted align error of the AlphaFold-Multimer prediction from (Ci). Expected position error (Angstroms) is graphed. (Di) AlphaFold Multimer prediction of Xenopus TEDC1, TEDC2, TUBD1, TUBE1 (Dii) AlphaFold-Multimer prediction from (Di) colored according to pLDDT. Very high: pLDDT >90. High: 90>pLDDT > 70. Low: 70>pLDDT > 50. Very low: pLDDT <50 (Diii) Predicted align error of the AlphaFold-Multimer prediction from (Di). Expected position error (Angstroms) is graphed.
Figure 4 with 5 supplements
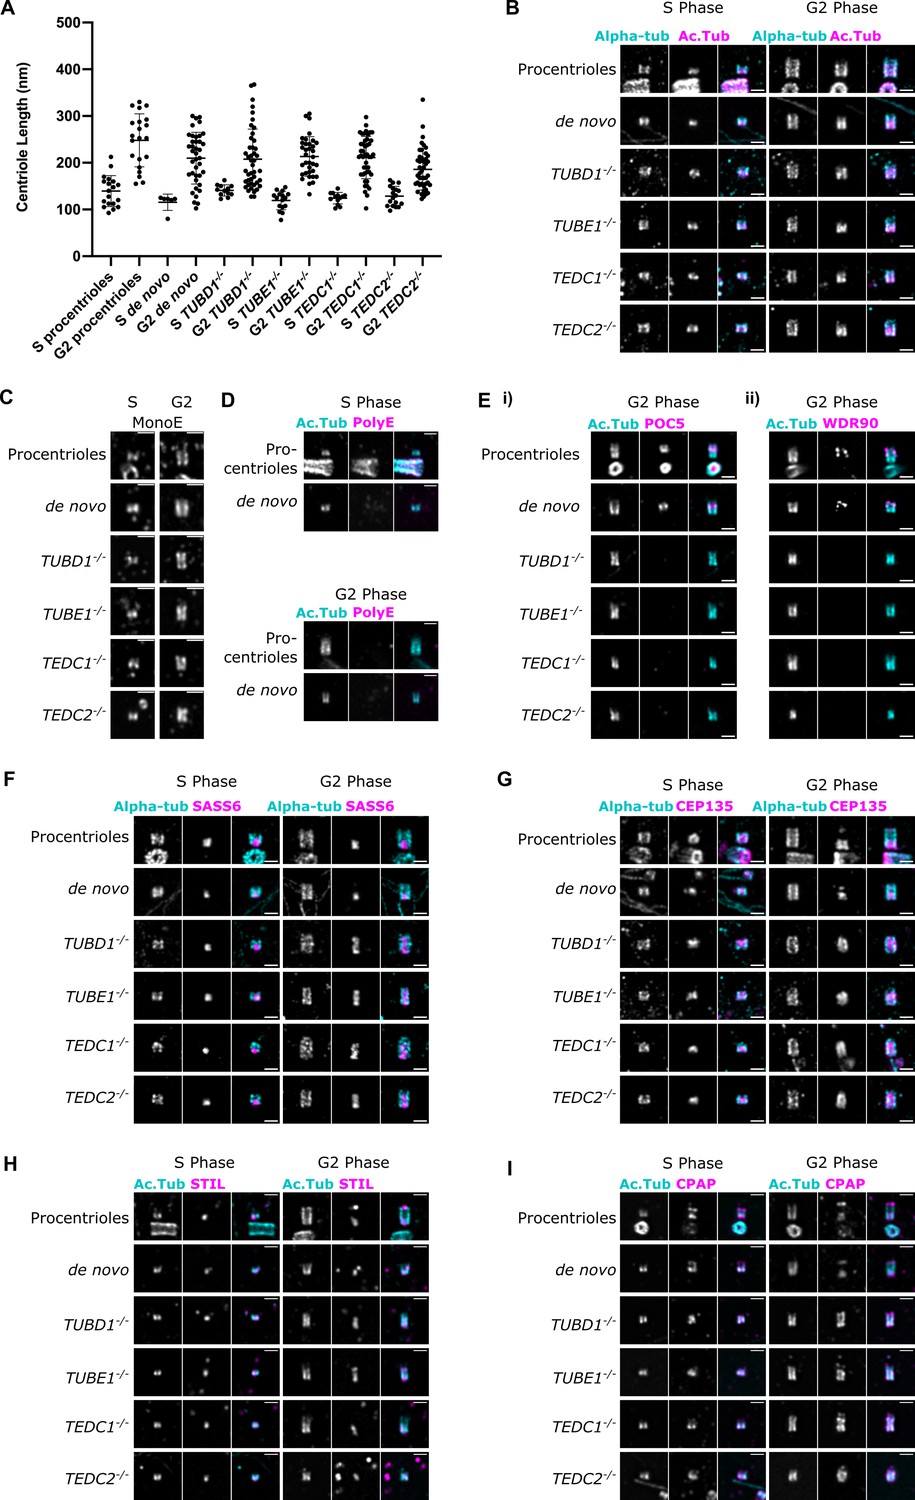
Mutant centrioles elongate in G2 but fail to recruit central core proteins and have an expanded proximal region.
(A) Lengths of expanded centrioles from cells of the indicated cell cycle stages. Lengths were adjusted for the gel expansion factors. Cells were synchronized in S/G2/M and S-phase cells were marked with PCNA. For each genotype, the differences between S and G2 phase centriole lengths are statistically significant (p<0.0001, Welch’s t-test). (B) U-ExM images of centrioles stained for alpha-tubulin and acetylated tubulin. (C) U-ExM of centrioles in S or G2 phase stained with monoE (GT335) antibody. (D) U-ExM of control centrioles in S or G2 phase stained with acetylated tubulin and polyE antibodies (Ei) U-ExM of centrioles in G2-phase stained with acetylated tubulin (cyan) and POC5 (magenta) antibodies. POC5 is present in the central core of control procentrioles and de novo centrioles and absent from mutants. (Eii) U-ExM of centrioles in G2 phase stained with acetylated tubulin (cyan) and WDR90 (magenta) antibodies. WDR90 is present in the central core of control procentrioles and de novo centrioles, and absent from mutants. (F–I) U-ExM of centrioles in S and G2 phase stained for alpha tubulin (cyan) or acetylated tubulin (Ac Tub, cyan) and the following antibodies in magenta: (F) SASS6, (G) CEP135, (H) STIL, (I) CPAP. In control centrioles, these proteins are limited to the proximal end. In mutant centrioles, these proteins are present at the proximal end in S phase centrioles and elongate throughout the entire centriole in G2 phase. Images were acquired with a Yokogawa CSU-W1 SoRA with 2.8 x relay and deconvolved with 10 iterations using Microvolution. Scale bars: 1 µm.
-
Figure 4—source data 1
Data for Figure 4A.
- https://cdn.elifesciences.org/articles/98704/elife-98704-fig4-data1-v1.xlsx
Figure 4—figure supplement 1
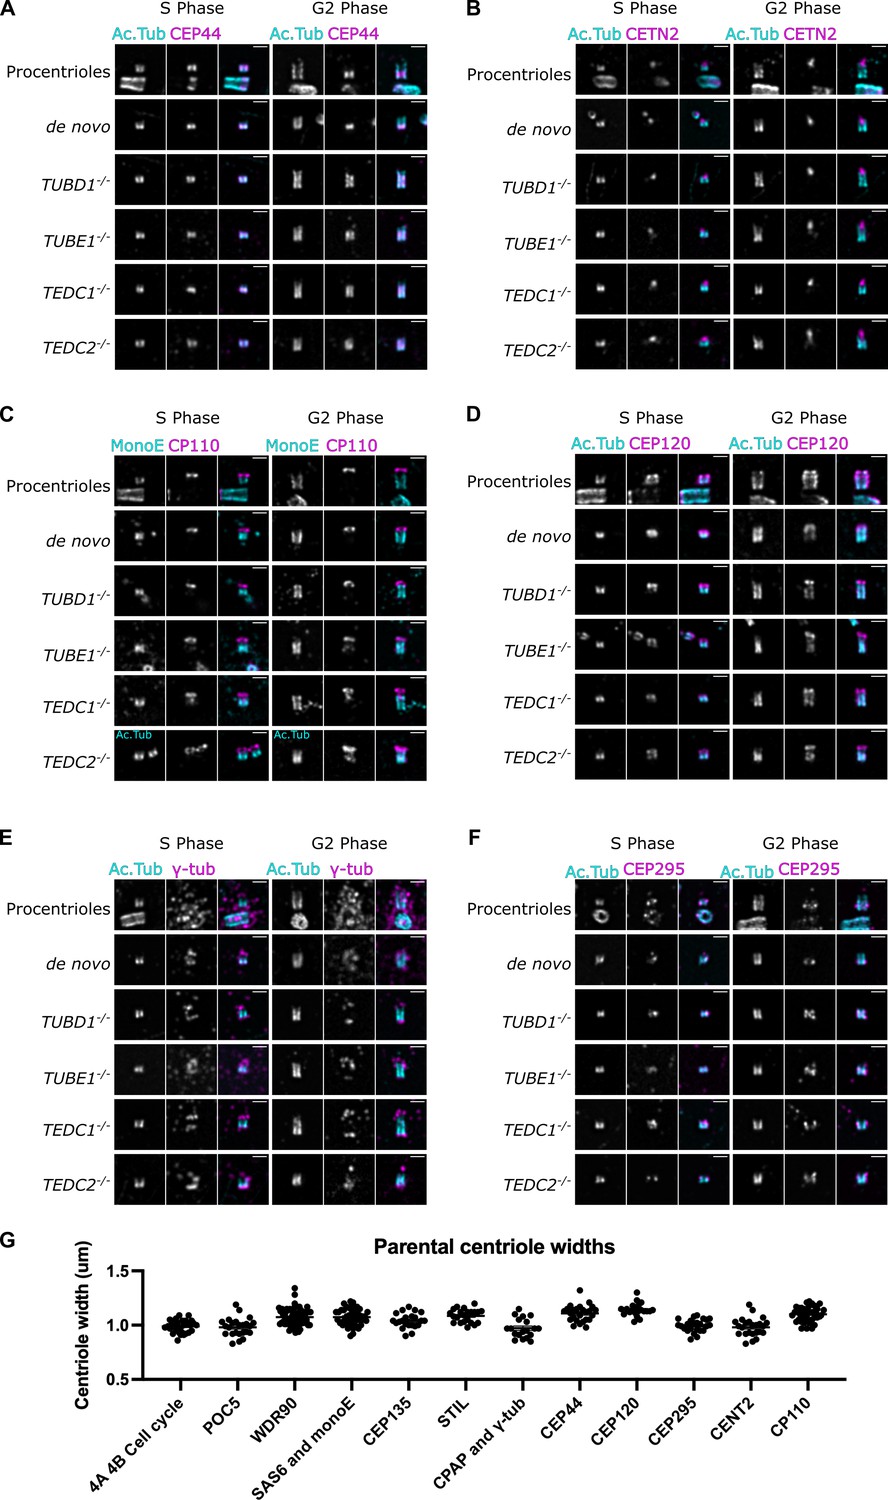
Extended analyses of mutant centriole architecture and U-ExM gel expansion factor.
(A–F) U-ExM of centrioles in S and G2 phase stained for acetylated tubulin (cyan) and the following proteins in magenta: (A) CEP44, (B) CETN2, (C) CP110, (D) CEP120, (E) gamma-tubulin, (F) CEP295. Scale bars = 1 µm. Images were acquired with a Yokogawa CSU-W1 SoRA with 2.8 x relay and deconvolved with 10 iterations using Microvolution. (G) Measurements of the widths of parental centrioles from each experiment as a readout of expansion factor, including the cell cycle analyses in Figure 4A and B. Centriole widths were a mean of 1.0 um, corresponding to a fourfold expansion factor.
-
Figure 4—figure supplement 1—source data 1
Data for Figure 4—figure supplement 1G.
- https://cdn.elifesciences.org/articles/98704/elife-98704-fig4-figsupp1-data1-v1.xlsx
Figure 4—figure supplement 2
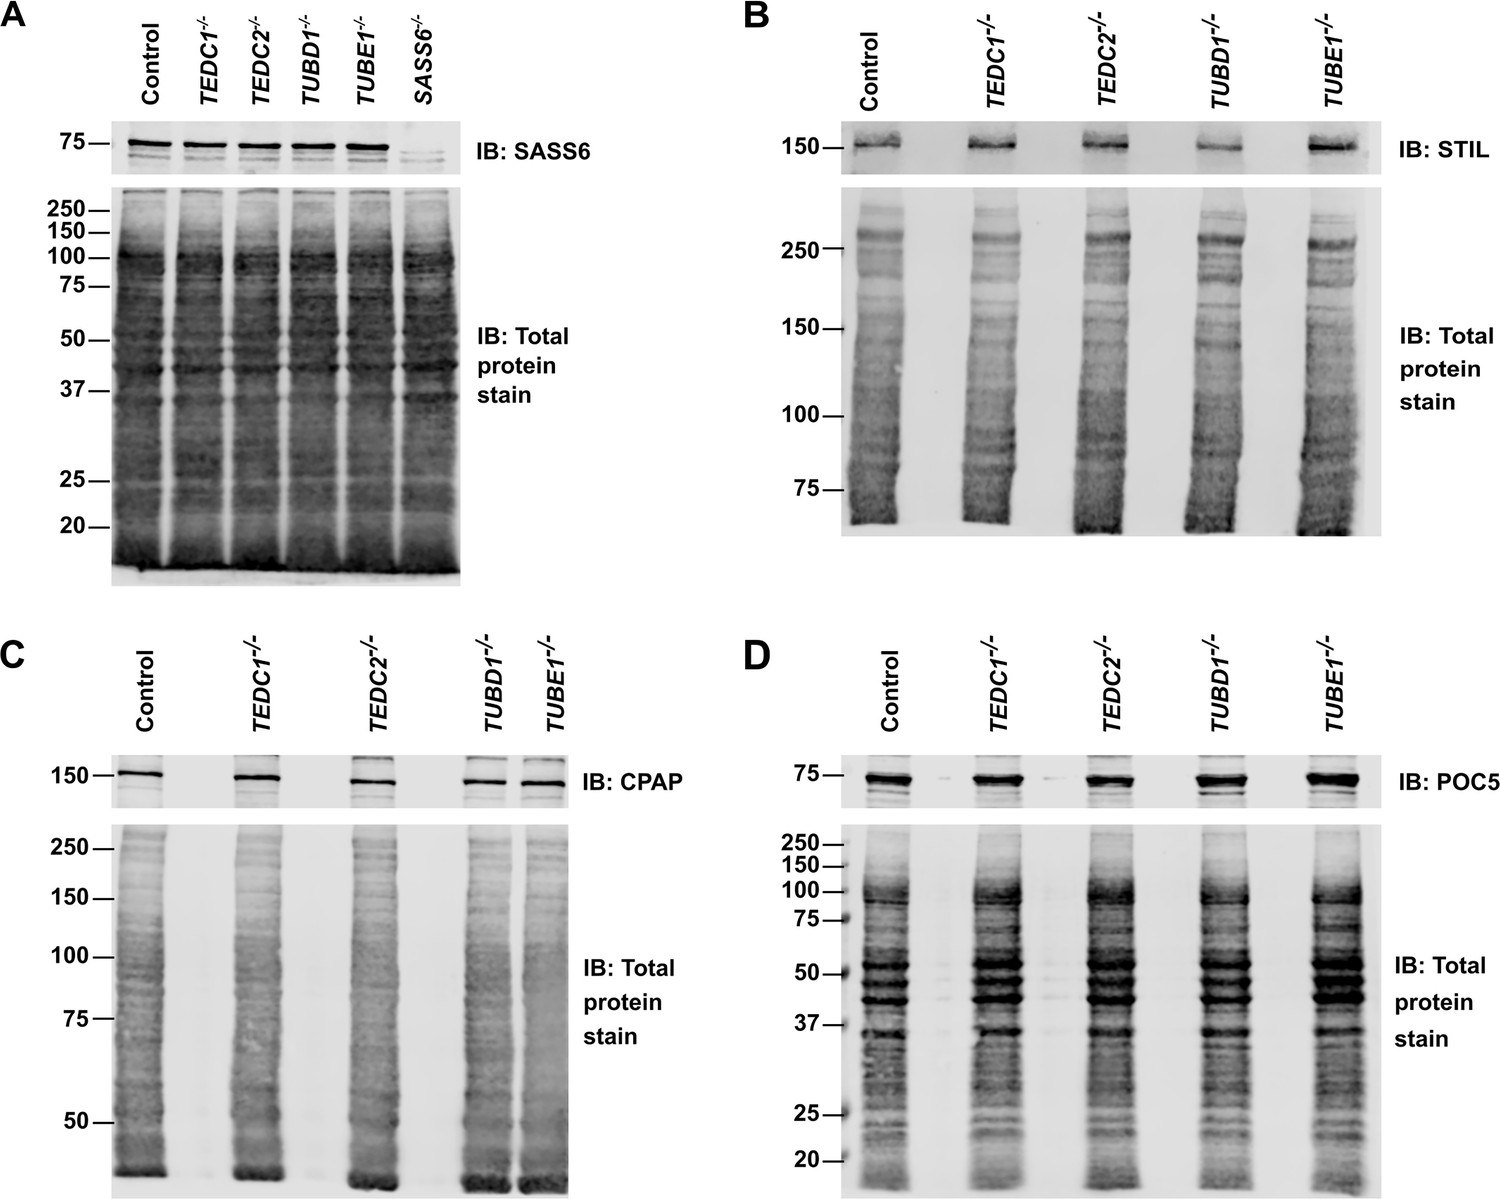
Total protein levels of centrosomal proteins are unchanged in mutant cells.
(A) Western blot of control (RPE1 TP53-/-), TEDC1-/-, TEDC2-/-, TUBD1-/-, TUBE1-/-, SASS6-/- cell lysates, immunoblotted for SASS6. Total protein stain (Revert) serves as a loading control. (B) Western blot of control (RPE1 TP53-/-), TEDC1-/-, TEDC2-/-, TUBD1-/-, TUBE1-/- cell lysates, immunoblotted for STIL. Total protein stain (Revert) serves as a loading control. (C) Western blot of control (RPE1 TP53-/-), TEDC1-/-, TEDC2-/-, TUBD1-/-, TUBE1-/- cell lysates, immunoblotted for CPAP. Total protein stain (Revert) serves as a loading control. (D) Western blot of control (RPE1 TP53-/-), TEDC1-/-, TEDC2-/-, TUBD1-/-, TUBE1-/- cell lysates, immunoblotted for POC5. Total protein stain (Revert) serves as a loading control.
-
Figure 4—figure supplement 2—source data 1
Original files of full uncropped, unedited blots in Figure 4—figure supplement 2.
- https://cdn.elifesciences.org/articles/98704/elife-98704-fig4-figsupp2-data1-v1.zip
-
Figure 4—figure supplement 2—source data 2
Labeled uncropped, unedited blots in Figure 4—figure supplement 2.
- https://cdn.elifesciences.org/articles/98704/elife-98704-fig4-figsupp2-data2-v1.zip
Figure 4—figure supplement 3
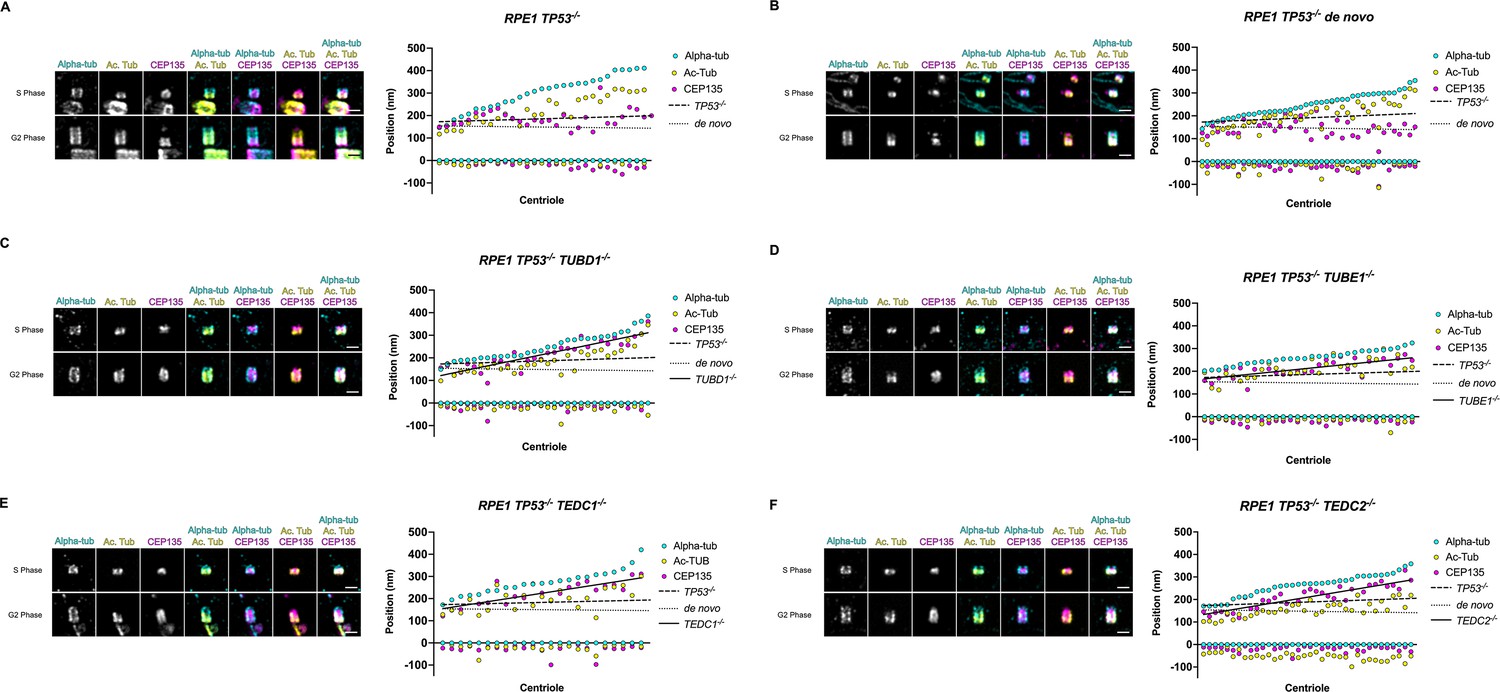
Quantification of CEP135 centriolar localization through S and G2 phases.
Mutant centrioles have over-elongated CEP135. (A) control procentrioles, n=29 centrioles; (B) de novo centrioles, n=42 centrioles; (C) TUBD1-/-, n=32 centrioles; (D) TUBE1-/-, n=30 centrioles; (E) TEDC1-/-, n=23 centrioles; (F) TEDC2-/-, n=36 centrioles. For each panel, representative U-ExM images of centrioles in S and G2 phase are shown. These are the same centrioles as shown in Figure 4G and were stained for alpha-tubulin (cyan), acetylated tubulin (yellow), and CEP135 (magenta). Scale bars = 1 µm. Graphs: Each column represents a centriole, for which the proximal and distal positions of CEP135 (magenta), acetylated tubulin (yellow) and alpha-tubulin (cyan) are displayed. Centrioles were arranged from shortest to longest. Numbers were adjusted for expansion factor. Lines of best fit were added for CEP135 position: control procentrioles (dashed), de novo centrioles (dotted), and mutants (solid).
-
Figure 4—figure supplement 3—source data 1
Data for Figure 4—figure supplement 3.
- https://cdn.elifesciences.org/articles/98704/elife-98704-fig4-figsupp3-data1-v1.xlsx
Figure 4—figure supplement 4
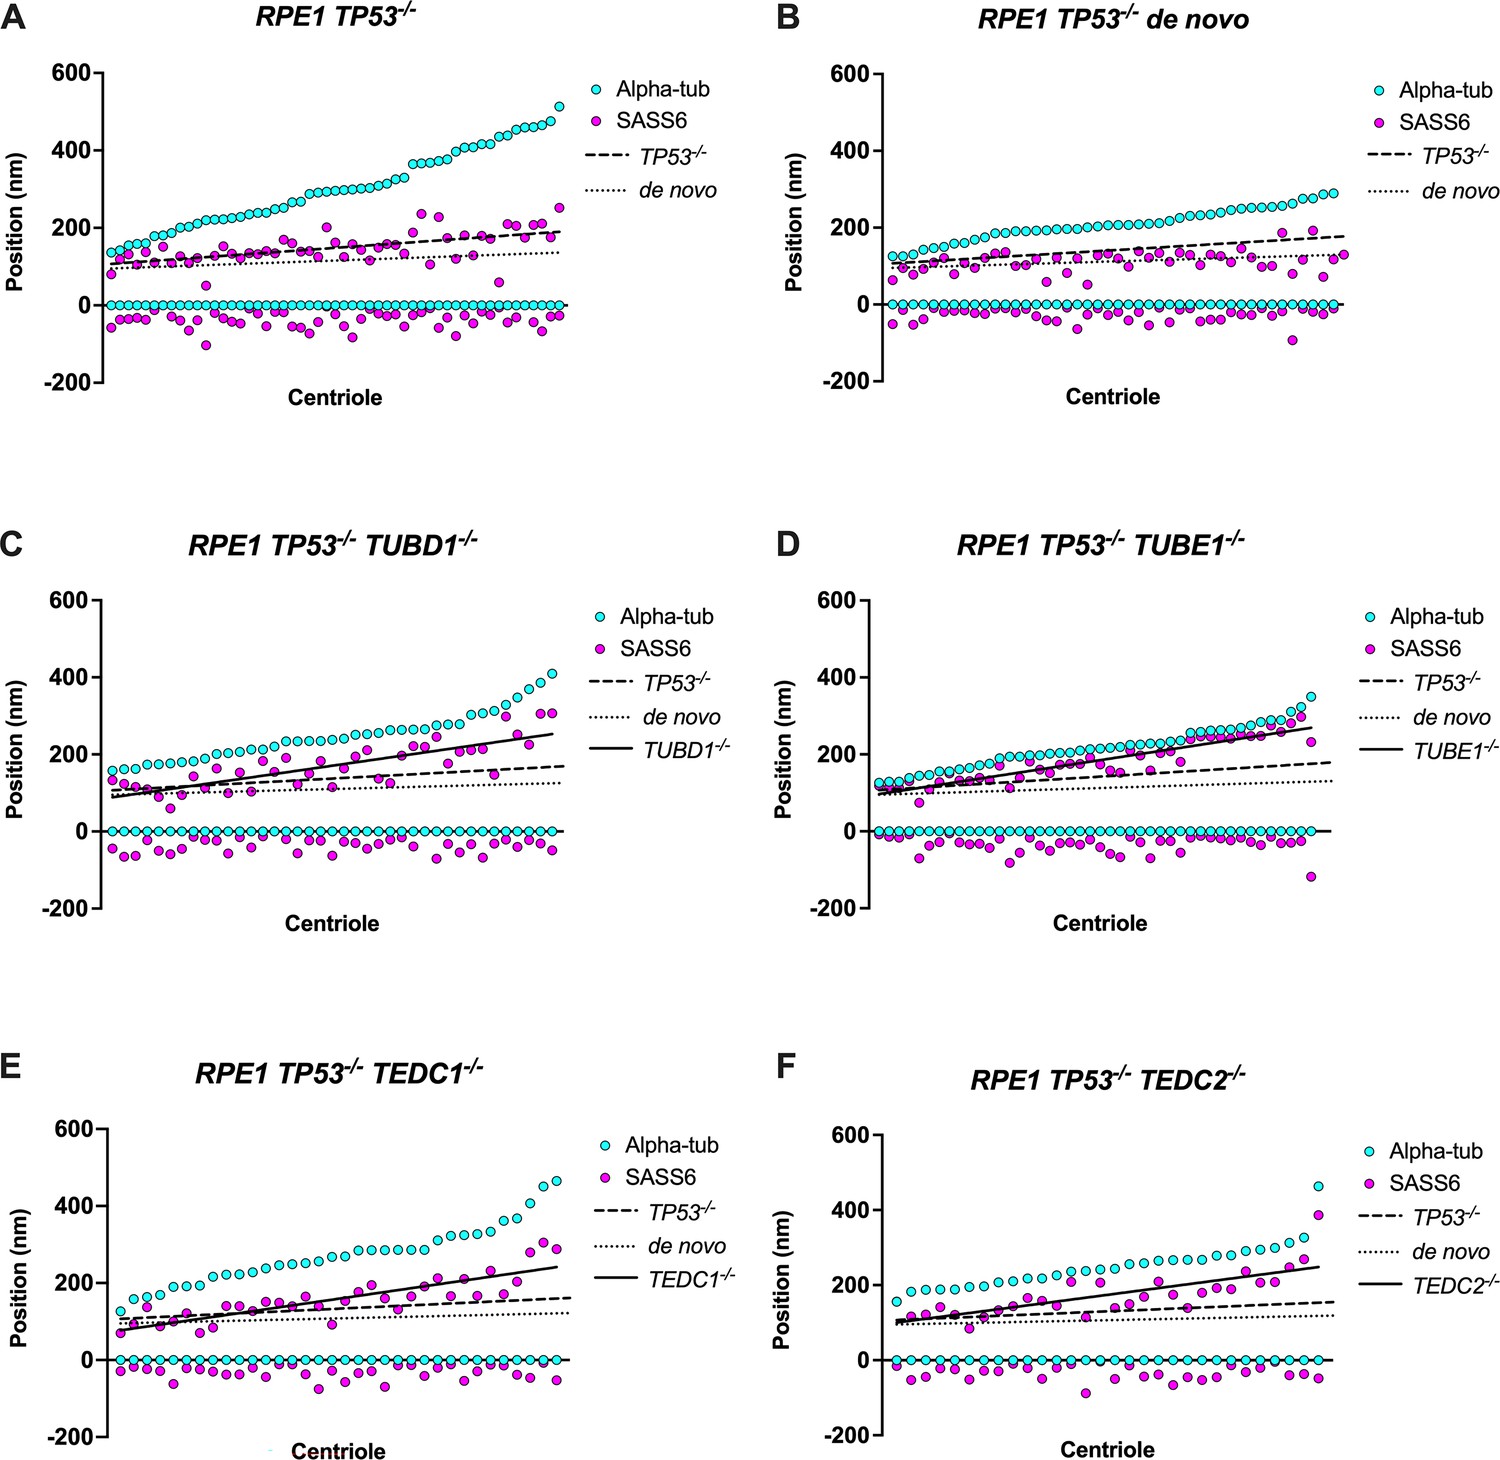
Quantification of SASS6 centriolar localization through S and G2 phase.
Mutant centrioles have over-elongated SASS6. (A) control procentrioles, n=53 centrioles; (B) de novo centrioles, n=44 centrioles; (C) TUBD1-/-, n=39 centrioles; (D) TUBE1-/-, n=44 centrioles; (E) TEDC1-/-, n=34 centrioles; (F) TEDC2-/-, n=30 centrioles. Each column represents a centriole, for which the proximal and distal positions of SASS6 (magenta) and alpha-tubulin (cyan) are displayed. Centrioles were arranged from shortest to longest. Numbers were adjusted for expansion factor. Lines of best fit were added for SASS6 position: control procentrioles (dashed), de novo centrioles (dotted), and mutants (solid).
-
Figure 4—figure supplement 4—source data 1
Data for Figure 4—figure supplement 4.
- https://cdn.elifesciences.org/articles/98704/elife-98704-fig4-figsupp4-data1-v1.xlsx
Figure 4—figure supplement 5
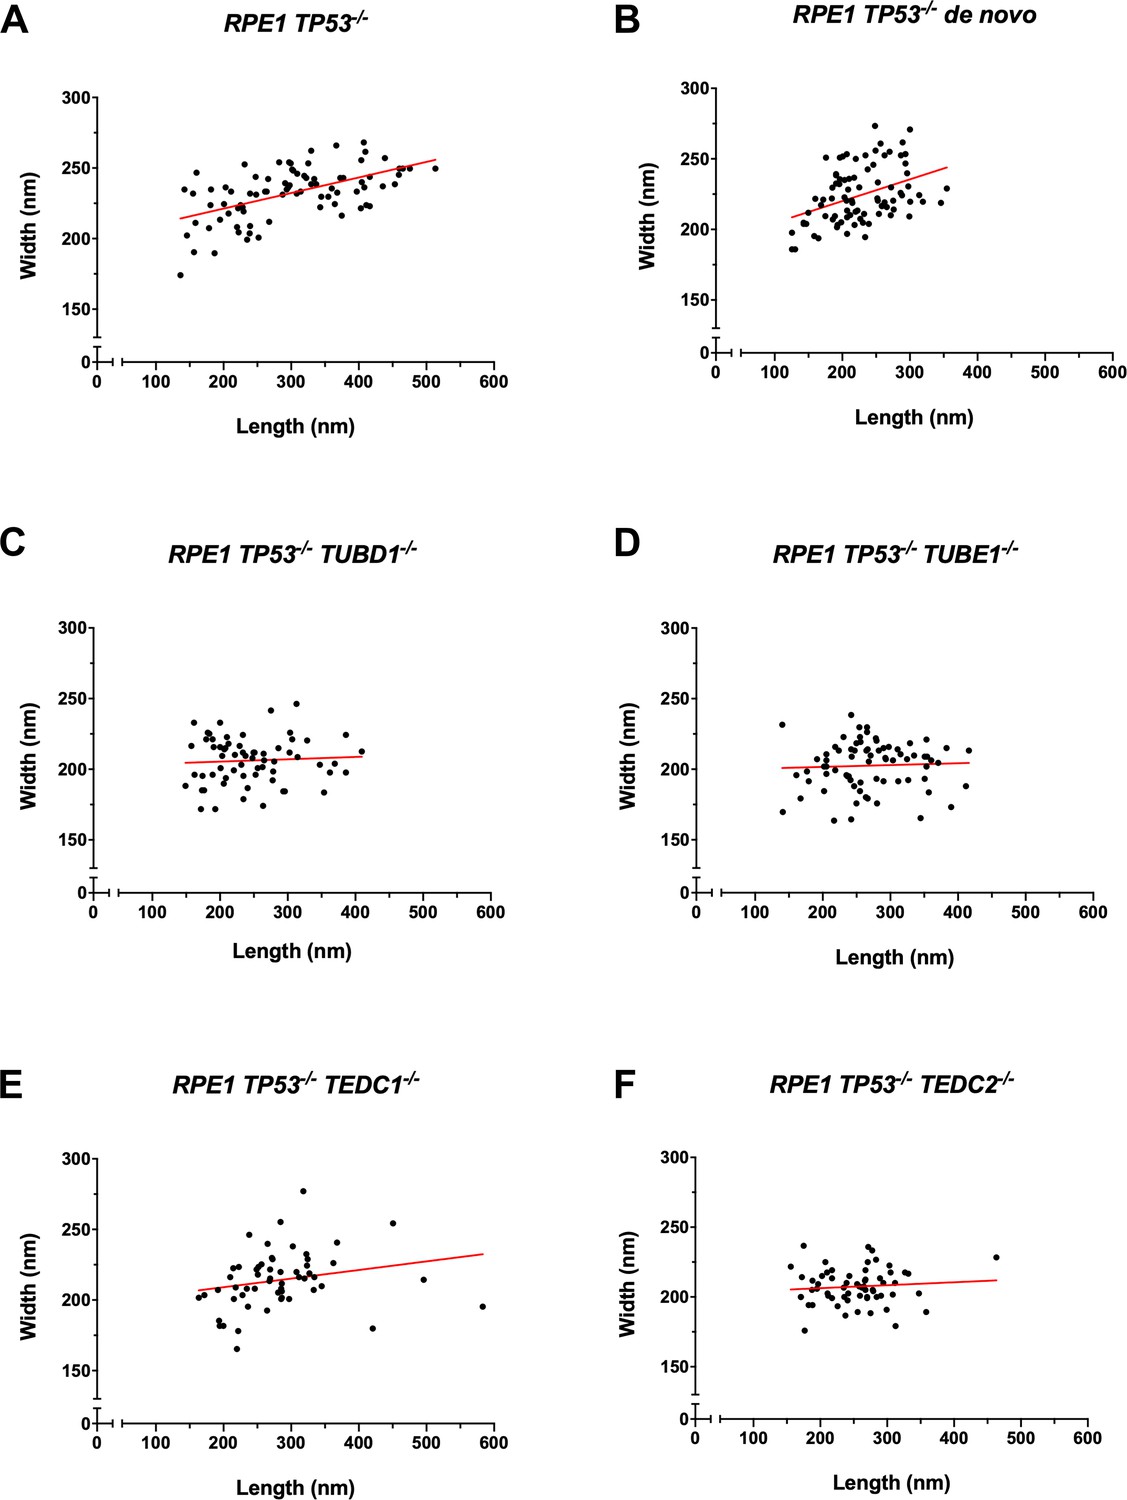
Quantification of centriole widths and lengths.
Mutant centrioles have smaller widths compared to controls. (A) control procentrioles, n=82 centrioles; (B) de novo centrioles, n=86 centrioles; (C) TUBD1-/-, n=64 centrioles; (D) TUBE1-/-, n=74 centrioles; (E) TEDC1-/-, n=56 centrioles; (F) TEDC2-/-, n=62 centrioles. Centriole widths and lengths measured by alpha-tubulin antibody are graphed, adjusted for expansion factor. A line of best fit was added (red).
-
Figure 4—figure supplement 5—source data 1
Data for Figure 4—figure supplement 5.
- https://cdn.elifesciences.org/articles/98704/elife-98704-fig4-figsupp5-data1-v1.xlsx
Figure 5
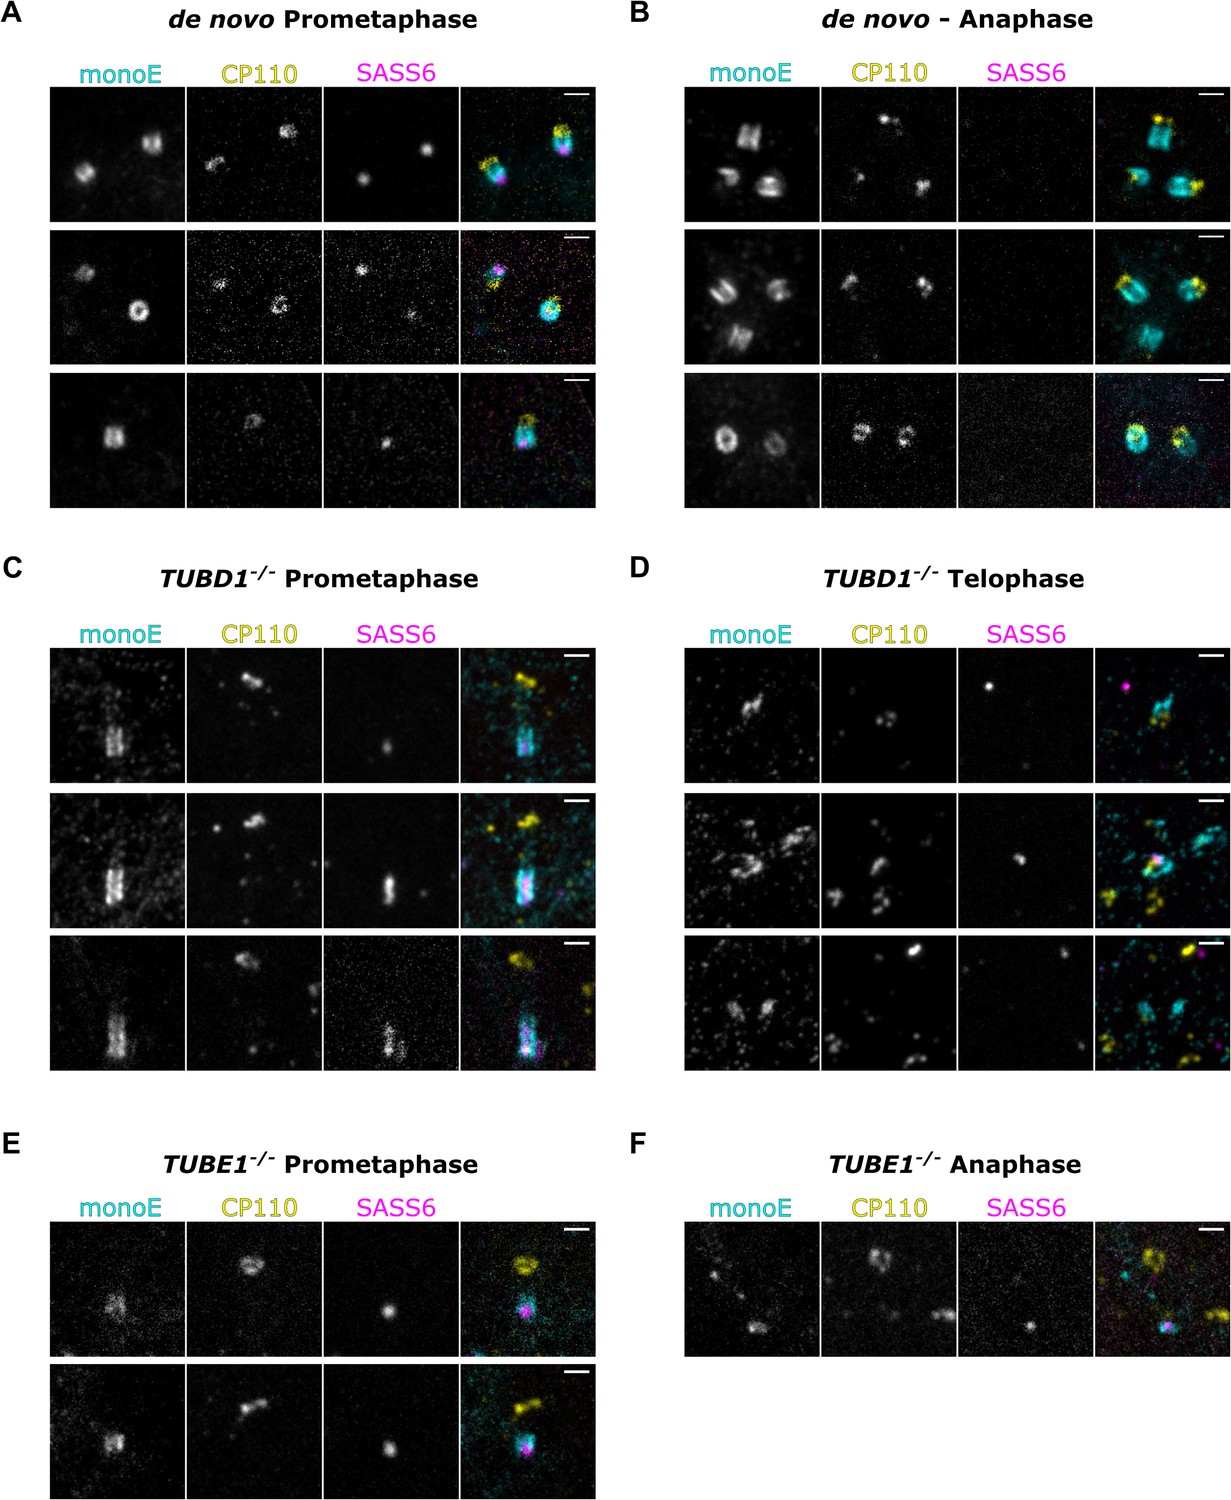
Mutant centrioles elongate further in mitosis before fragmenting.
U-ExM of centrioles stained for monoE (GT335, cyan), CP110 (yellow) and SASS6 (magenta). (A) A prometaphase cell with centrioles formed de novo after centrinone washout (B) An anaphase cell with centrioles formed de novo (C) A prometaphase TUBD1-/- cell (D) A telophase TUBD1-/- cell (E) A prometaphase TUBE1-/- cell (F) An anaphase TUBE1-/- cell. Scale bars: 1 um. Images were acquired with a Yokogawa CSU-W1 SoRA with 2.8 x relay.
Tables
Key resources table
| Reagent type (species) or resource | Designation | Source or reference | Identifiers | Additional information |
|---|---|---|---|---|
| Chemical compound, drug | Sodium acrylate | AK Scientific or Sigma Aldrich | AK Sci cat# R624, Sigma cat# 408220 | There is batch to batch variability in acrylate purity |
| Chemical compound, drug | 40% Acrylamide | Sigma Aldrich | Cat# A4058 | |
| Chemical compound, drug | 36–38% Formaldehyde | Sigma Aldrich | Cat# F8775 | |
| Chemical compound, drug | N,N′-Methylenebisacrylamide solution (BIS) | Sigma Aldrich | Cat# M1533 | |
| Chemical compound, drug | Ammonium Persulfate (APS) | Bio-Rad | Cat# 1610700 | |
| Chemical compound, drug | N,N,N',N'-Tetramethylethylenediamine (TEMED) | Bio-Rad | Cat# 1610800 | |
| Chemical compound, drug | Sodium dodecyl sulfate (SDS) | Sigma Aldrich | Cat# 75746 | |
| chemical compound, drug | Sodium chloride (NaCl) | Sigma Aldrich | Cat# S9888 | |
| Chemical compound, drug | Tris base | Sigma Aldrich | Cat# 93362 | |
| Chemical compound, drug | Potassium chloride (KCl) | Sigma Aldrich | Cat# P3911 | |
| Chemical compound, drug | Triton X-100 | Sigma Aldrich | Cat# T8787 | |
| Chemical compound, drug | DL-Dithiothreitol (DTT) | Sigma Aldrich | Cat# D9779 | |
| Chemical compound, drug | Glycine | Thermo Fisher Scientific | Cat# BP381-5 | |
| Chemical compound, drug | Tween 20 | Sigma Aldrich | Cat# P1379 | |
| Antibody | Anti-acetlyated- tubulin, clone 6-11B-1 (monoclonal mouse IgG2b) | Sigma Aldrich | Cat# T6793, RRID:AB_477585 | UExM (1:1000) |
| Antibody | Anti-acetyl-alpha-tubulin, Lys40 (rabbit polyclonal) | Cell Signaling Technology | Cat# 5335, RRID:AB_10544694 | UExM 1:100 |
| Antibody | Anti-centrin, clone 20H5 (monoclonal mouse IgG2a) | EMD Millipore | RRID:AB_10563501 | IF 1:200, UExM 1:500 |
| Antibody | Anti-centrin3, clone 3e6 (monoclonal mouse IgG2b) | Novus Biological | RRID:AB_537701 | UExM 1:1000 |
| Antibody | Anti-CENPJ (rabbit polyclonal) | Proteintech | Cat# 11517–1-AP, RRID:AB_2244605 | WB 1:1000 UExM 1:500 |
| Antibody | Anti-Cep44 (rabbit polyclonal) | Proteintech | Cat# 24457–1-AP, RRID:AB_2879557 | UExM 1:100 |
| Antibody | Anti-Cep120 (rat polyclonal) | Gift from Moe Mahjoub | Betleja et al., 2018 | |
| Antibody | Anti-Cep135 (rabbit polyclonal) | Proteintech | Cat# 24428–1-AP, RRID:AB_2879543 | UExM 1:500 |
| Antibody | Anti-Cep295 (rabbit polyclonal) | Sigma-Aldrich | Cat# HPA038596, RRID:AB_10672720 | UExM 1:1000 |
| Antibody | Anti-CP110 (rabbit polyclonal) | Proteintech | Cat# 12780–1-AP, RRID:AB_10638480 | IF 1:200, UExM 1:2000 |
| Antibody | Anti-Flag, clone M2 (monoclonal mouse IgG1) | Sigma-Aldrich | Cat# F1804, RRID:AB_262044 | WB 1:2000, UExM 1:500 |
| Antibody | Anti-gamma-tubulin, clone GTU-88 (monoclonal mouse IgG1) | Sigma-Aldrich | RRID:AB_477584 | IF 1:1000, UExM 1:500 |
| Antibody | Anti-PCNA (monoclonal mouse IgG2a) | BioLegend | RRID:AB_314692 | UExM 1:500 |
| Antibody | Anti-POC5 (rabbit polyclonal) | Bethyl Laboratories | RRID:AB_10949152 | IF 1:500 |
| Antibody | Anti-POC5 (rabbit polyclonal) | Thermo Fisher Scientific | Cat# A303-341A, RRID:AB_10971172 | WB 1:1000 UExM 1:500 |
| Antibody | Anti-polyglutamylation, clone GT335 (monoclonal mouse IgG1) | AdipoGen | Cat# AG-20B-0020, RRID:AB_2490210 | UExM 1:500 |
| Antibody | Anti-polyglutamylate-chain, polyE (rabbit polyclonal) | AdipoGen | Cat# AG-25B-0030, RRID:AB_2490540 | UExM 1:500 |
| Antibody | Anti-SASS6 (monoclonal mouse IgG2b) | Santa Cruz | Cat# sc-81431, RRID:AB_1128357 | IF, WB, UExM 1:200 |
| Antibody | Anti-STIL (rabbit polyclonal) | Abcam | Cat# ab89314, RRID:AB_2197878 | WB 1:2000 UExM 1:500 |
| Antibody | Anti-V5 (monoclonal mouse IgG2a) | Thermo Fisher Scientific | Cat# R960-25, RRID:AB_2556564 | WB 1:1000 UExM 1:100 |
| Antibody | Anti-WDR90 (rabbit polyclonal) | Thermo Fisher Scientfic | Cat# PA5-61943, RRID:AB_2649628 | UExM 1:100 |
| Antibody | Goat anti-mouse IgG1, 488 | Thermo Fisher Scientific | Cat# A21121, RRID:AB_2535764 | UExM 1:1000 |
| Antibody | Goat anti-Mouse IgG2a, 488 | Thermo Fisher Scientific | Cat# A-21131, RRID:AB_2535771 | UExM 1:1000 |
| Antibody | Goat anti-Mouse IgG2b, 488 | Thermo Fisher Scientific | Cat# A-21141, RRID:AB_2535778 | UExM 1:1000 |
| Antibody | Goat anti-rabbit IgG (H+L), 488 | Thermo Fisher Scientific | Cat# A-11034, RRID:AB_2576217 | UExM 1:1000 |
| Antibody | Goat anti-Mouse IgG1, 568 | Thermo Fisher Scientific | Cat# A-21124, RRID:AB_2535766 | UExM 1:500 |
| Antibody | Goat anti-Mouse IgG2a, 568 | Thermo Fisher Scientific | Cat# A-21134, RRID:AB_2535773 | UExM 1:500 |
| Antibody | Goat anti-Mouse IgG2b, 568 | Thermo Fisher Scientific | Cat# A-21144, RRID:AB_2535780 | UExM 1:500 |
| antibody | Goat anti-rabbit IgG (H+L), 568 | Thermo Fisher Scientific | Cat# A-11036, RRID:AB_10563566 | UExM 1:500 |
| Antibody | Goat anti-Mouse IgG3, 594 | Thermo Fisher Scientific | Cat# A-21155, RRID:AB_2535785 | UExM 1:500 |
| Antibody | Goat anti-rat IgG (H+L), 594 | Thermo Fisher Scientific | Cat# A-11007, RRID:AB_10561522 | UExM 1:500 |
| Antibody | Goat anti-Mouse IgG1, 647 | Thermo Fisher Scientific | Cat# A-21240, RRID:AB_2535809 | UExM 1:500 |
| Antibody | Goat anti-Mouse IgG2a, 647 | Thermo Fisher Scientific | Cat# A-21241, RRID:AB_2535810 | UExM 1:500 |
| antibody | Goat anti-Mouse IgG2b, 647 | Thermo Fisher Scientific | Cat# A-21242, RRID:AB_2535811 | UExM 1:500 |
| Antibody | Goat anti-rabbit IgG (H+L), 647 | Thermo Fisher Scientific | Cat# A32733, RRID:AB_2633282 | UExM 1:500 |
| Antibody | Rabbit Anti-TUBD1 (rabbit polyclonal) | Sigma-Aldrich | Cat# HPA027090, RRID:AB_1858457 | WB 1:1000 |
| Antibody | Rabbit Anti-TUBE1 (rabbit polyclonal) | Sigma-Aldrich | Cat# HPA032074, RRID:AB_10601216 | WB 1:1000 |
| Antibody | rabbit anti C14orf80 (rabbit polyclonal) | Sigma-Aldrich | Cat# HPA039049, RRID:AB_2676320 | WB 1:1000 |
| Antibody | rabbit anti C16orf59 (rabbit polyclonal) | Sigma-Aldrich | Cat# HPA055389, RRID:AB_2732595 | WB 1:1000 |
| Antibody | 680 Donkey anti rabbit (H+L) | Thermo Fisher Scientific | Cat# A10043, RRID:AB_2534018 | WB 1:20,000 |
| Antibody | 800 Donkey anti rabbit (H+L) | Li-COR | Cat# 926–32213, RRID:AB_621848 | WB 1:20,000 |
| Antibody | 680 Donkey anti mouse (H+L) | Thermo Fisher Scientific | Cat# A10038, RRID:AB_11180593 | WB 1:20,000 |
| Antibody | 800 Donkey anti mouse (H+L) | Li-COR | Cat# 926–32212, RRID:AB_621847 | WB 1:20,000 |
Additional files
Download links
A two-part list of links to download the article, or parts of the article, in various formats.
Downloads (link to download the article as PDF)
Open citations (links to open the citations from this article in various online reference manager services)
Cite this article (links to download the citations from this article in formats compatible with various reference manager tools)
A delta-tubulin/epsilon-tubulin/Ted protein complex is required for centriole architecture
eLife 13:RP98704.
https://doi.org/10.7554/eLife.98704.3


