Impact of liver-specific survival motor neuron (SMN) depletion on central nervous system and peripheral tissue pathology
- Regenerative Medicine Program, Ottawa Hospital Research Institute, Canada
- Centre for Neuromuscular Disease, University of Ottawa, Canada
- Department of Cellular and Molecular Medicine, University of Ottawa, Canada
- Department of Medicine, University of Ottawa, Canada
Figures
Figure 1 with 1 supplement
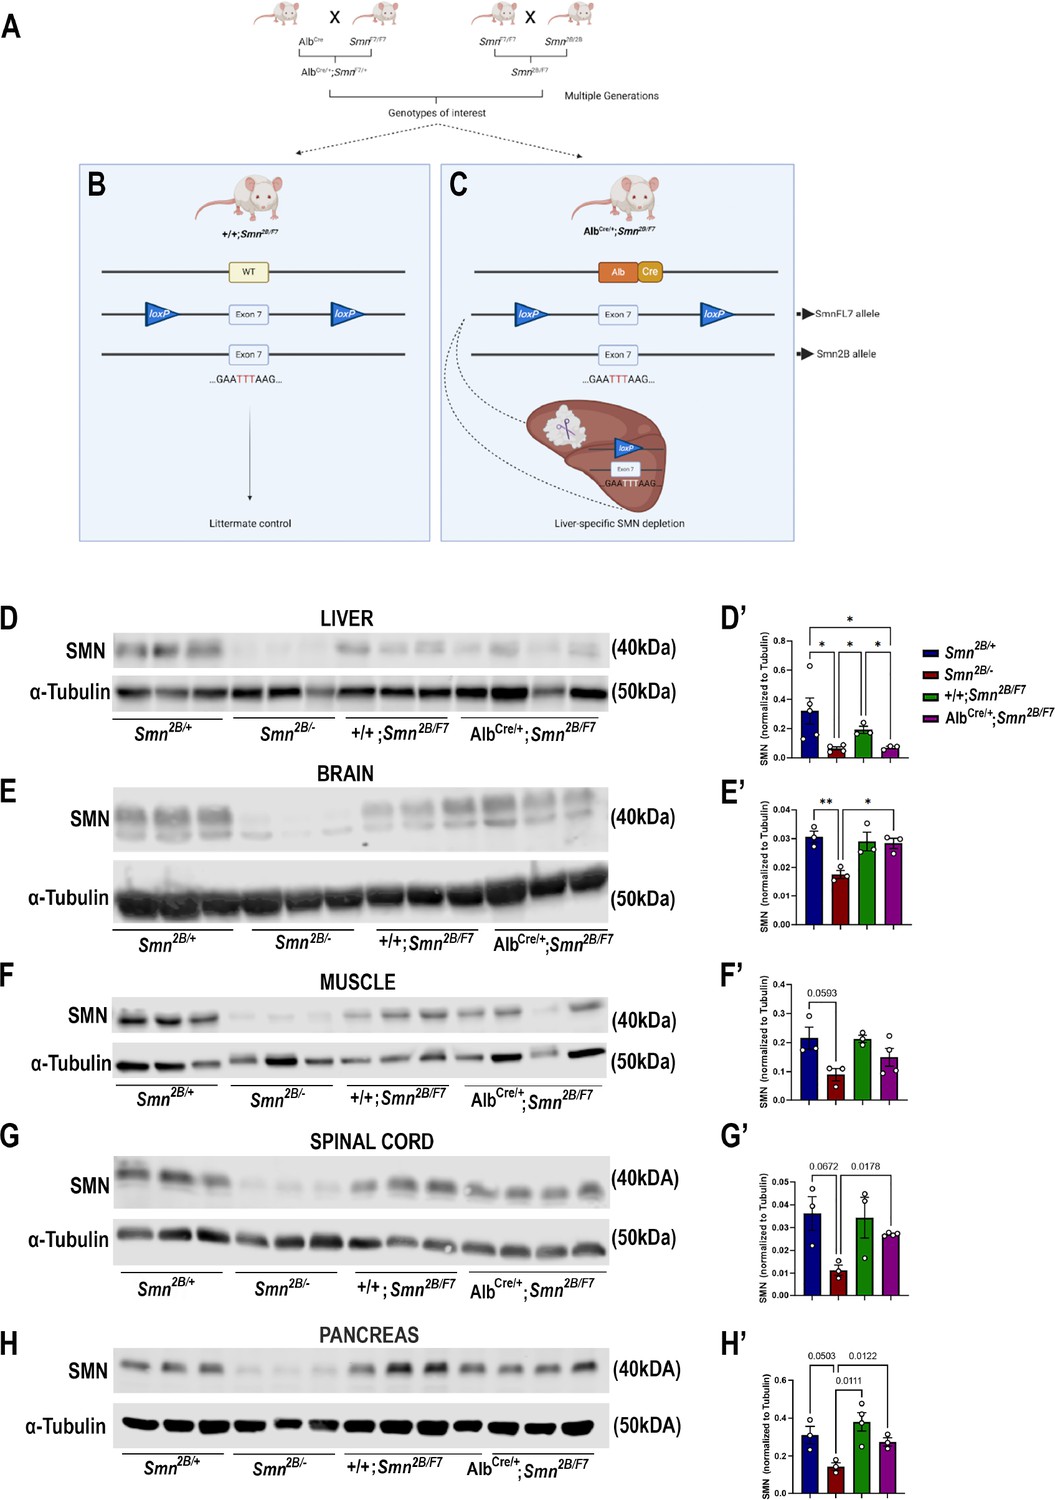
Generation of liver-specific SMN-depleted mice.
(A) Schematic representation of the breeding scheme to generate liver-specific SMN depletion. In these mice, the Smn1 gene carries one Smn2B allele that harbors a three-nucleotide switch in exon 7, and one Smn1 allele whose exon 7 is floxed by loxP sites (SmnF7). The Alb-Cre transgene has also been crossed into this background to provide liver-specific expression of the Cre recombinase. (B) Littermate controls do not harbor Cre recombinase but do carry one Smn2B allele and are thus used as heterozygous controls. (C) Upon crossing AlbCre/+;SmnF7/+ with Smn2B/F7 animals, Cre recombination will induce specific excision of exon 7 in the liver, leading to reduced SMN protein production only in the liver. (D–H) Immunoblots were performed to assess SMN protein levels in various tissues from Smn2B/+, Smn2B/-, +/+;Smn2B/F7, and AlbCre/+;Smn2B/F7 mice at P19. Membranes were probed for SMN and then reprobed for α-tubulin (loading control). (D’-H’) Bar graphs show quantification of SMN protein levels in the liver (D’), brain (E’), muscle (F’), spinal cord (G’) and pancreas (H’), normalized to α-tubulin. n ≥ 3, mean ± SEM. Statistical significance indicated by *p < 0.05, **p < 0.01 or p values, following Brown-Forsythe and Welch ANOVA.
-
Figure 1—source data 1
PDF file containing original western blots for Figure 1D–H, indicating the relevant bands and treatments.
- https://cdn.elifesciences.org/articles/99141/elife-99141-fig1-data1-v1.pdf
-
Figure 1—source data 2
Original files for western blot analysis displayed in Figure 1D–H.
- https://cdn.elifesciences.org/articles/99141/elife-99141-fig1-data2-v1.zip
-
Figure 1—source data 3
Raw data for SMN protein levels plotted in Figure 1D’–H’.
- https://cdn.elifesciences.org/articles/99141/elife-99141-fig1-data3-v1.xlsx
Figure 1—figure supplement 1
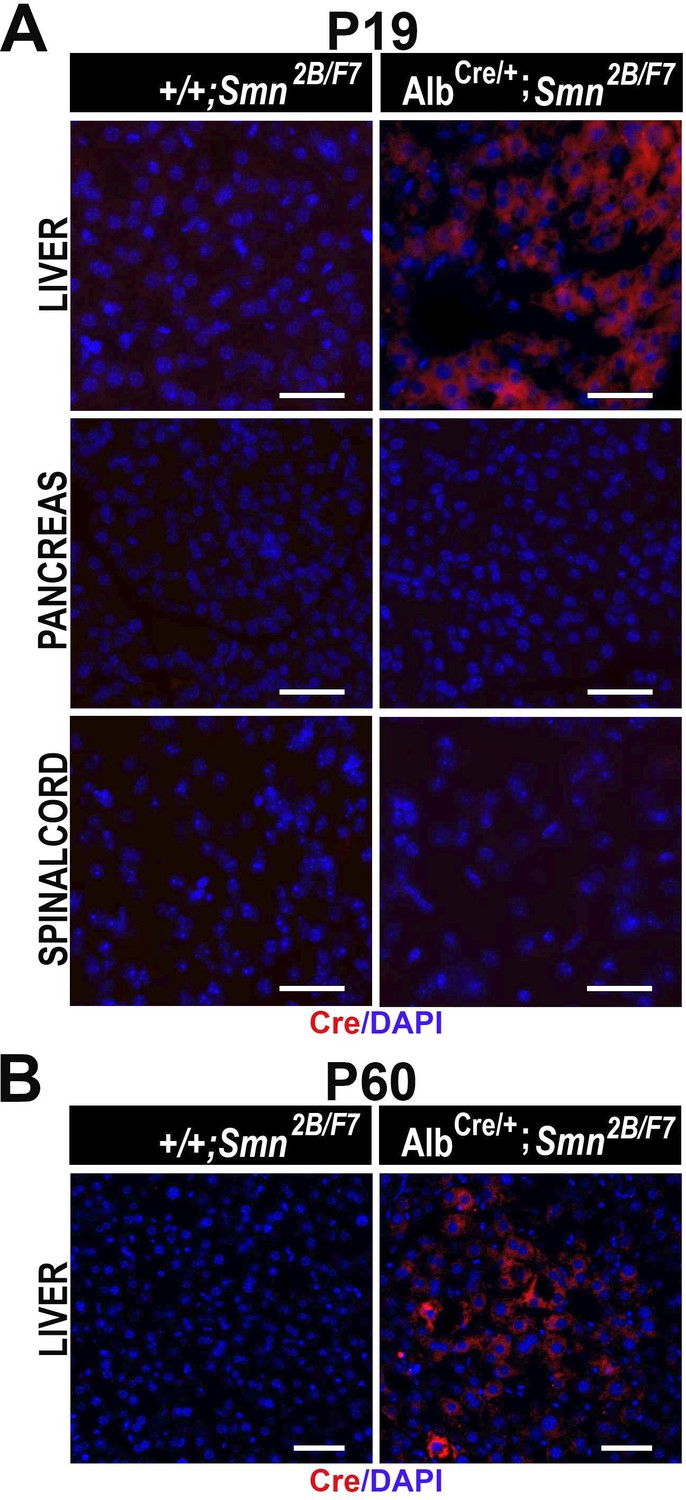
Cre expression across different tissues.
(A, B) Representative immunofluorescent images of liver, pancreas and spinal cord at P19 (A) and liver at P60 (B), stained for Cre (red) and counterstained for DAPI (blue, nuclei) from +/+;Smn2B/F7, and AlbCre/+; Smn2B/F7mice. Scale bar 50 μm. n=3 per group.
Figure 2
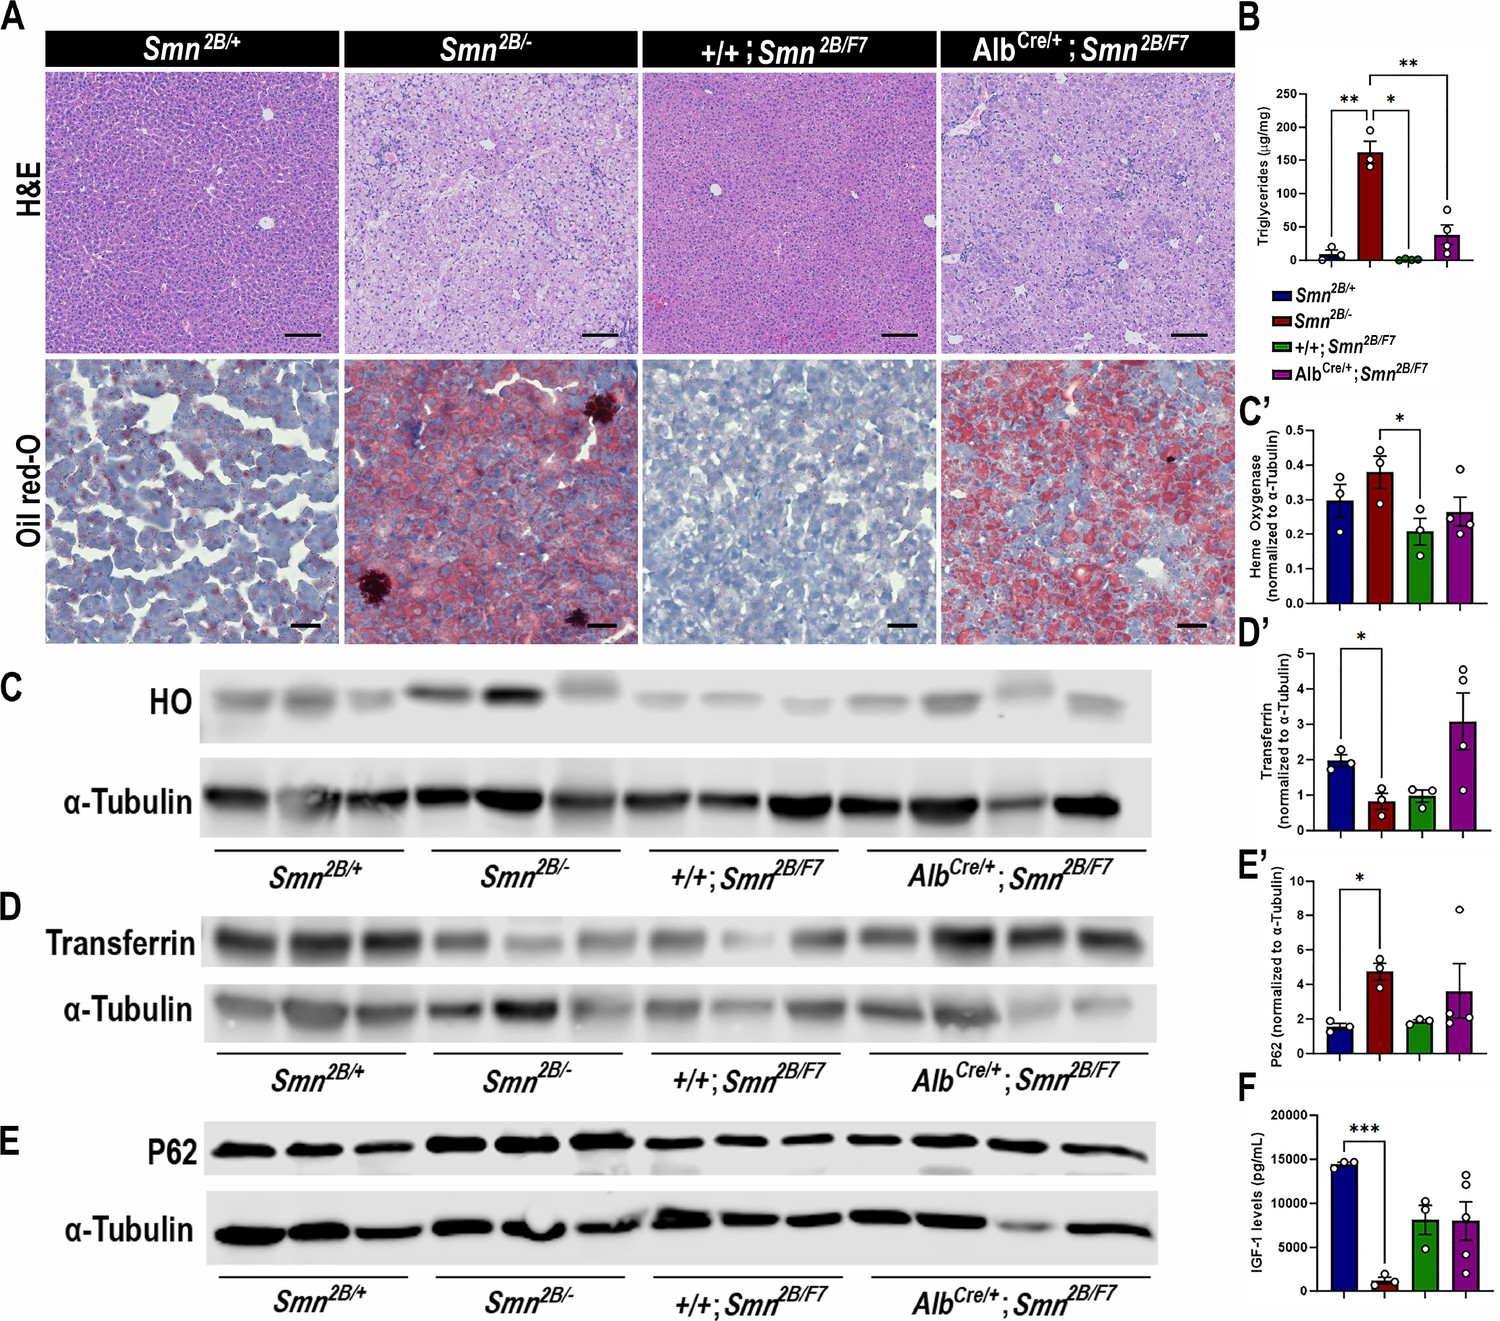
Impact of liver-specific SMN depletion in liver function.
(A) Representative images of H&E (top row, scale bar 100 μm) and Oil Red-O (bottom row, scale bar 50 μm) stained liver sections from Smn2B/+, Smn2B/-, +/+;Smn2B/F7, and AlbCre/+;Smn2B/F7 mice at P19. (B) Bar graph shows quantification of liver triglycerides. (C–E) Immunoblots were performed to assess heme oxygenase (HO, (C-C’)), transferrin (D-D’) and P62 (E-E’) protein levels in the liver. α-tubulin was used as a loading control. (C’-E’) Bar graphs show quantification of HO (C’), transferrin (D’), and P62 (E’) levels. (F) Bar graph depicts quantification of liver IGF-1. n ≥ 3, mean ± SEM. Statistical significance indicated by *p < 0.05, **p < 0.01, ***p < 0.001, following Brown-Forsythe and Welch ANOVA.
-
Figure 2—source data 1
PDF file containing original western blots for Figure 2C–E, indicating the relevant bands and treatments.
- https://cdn.elifesciences.org/articles/99141/elife-99141-fig2-data1-v1.pdf
-
Figure 2—source data 2
Riginal files for western blot analysis displayed in Figure 2C–E.
- https://cdn.elifesciences.org/articles/99141/elife-99141-fig2-data2-v1.zip
-
Figure 2—source data 3
Raw data for plots in Figure 2B, C’, D’, E’ and F.
- https://cdn.elifesciences.org/articles/99141/elife-99141-fig2-data3-v1.xlsx
Figure 3
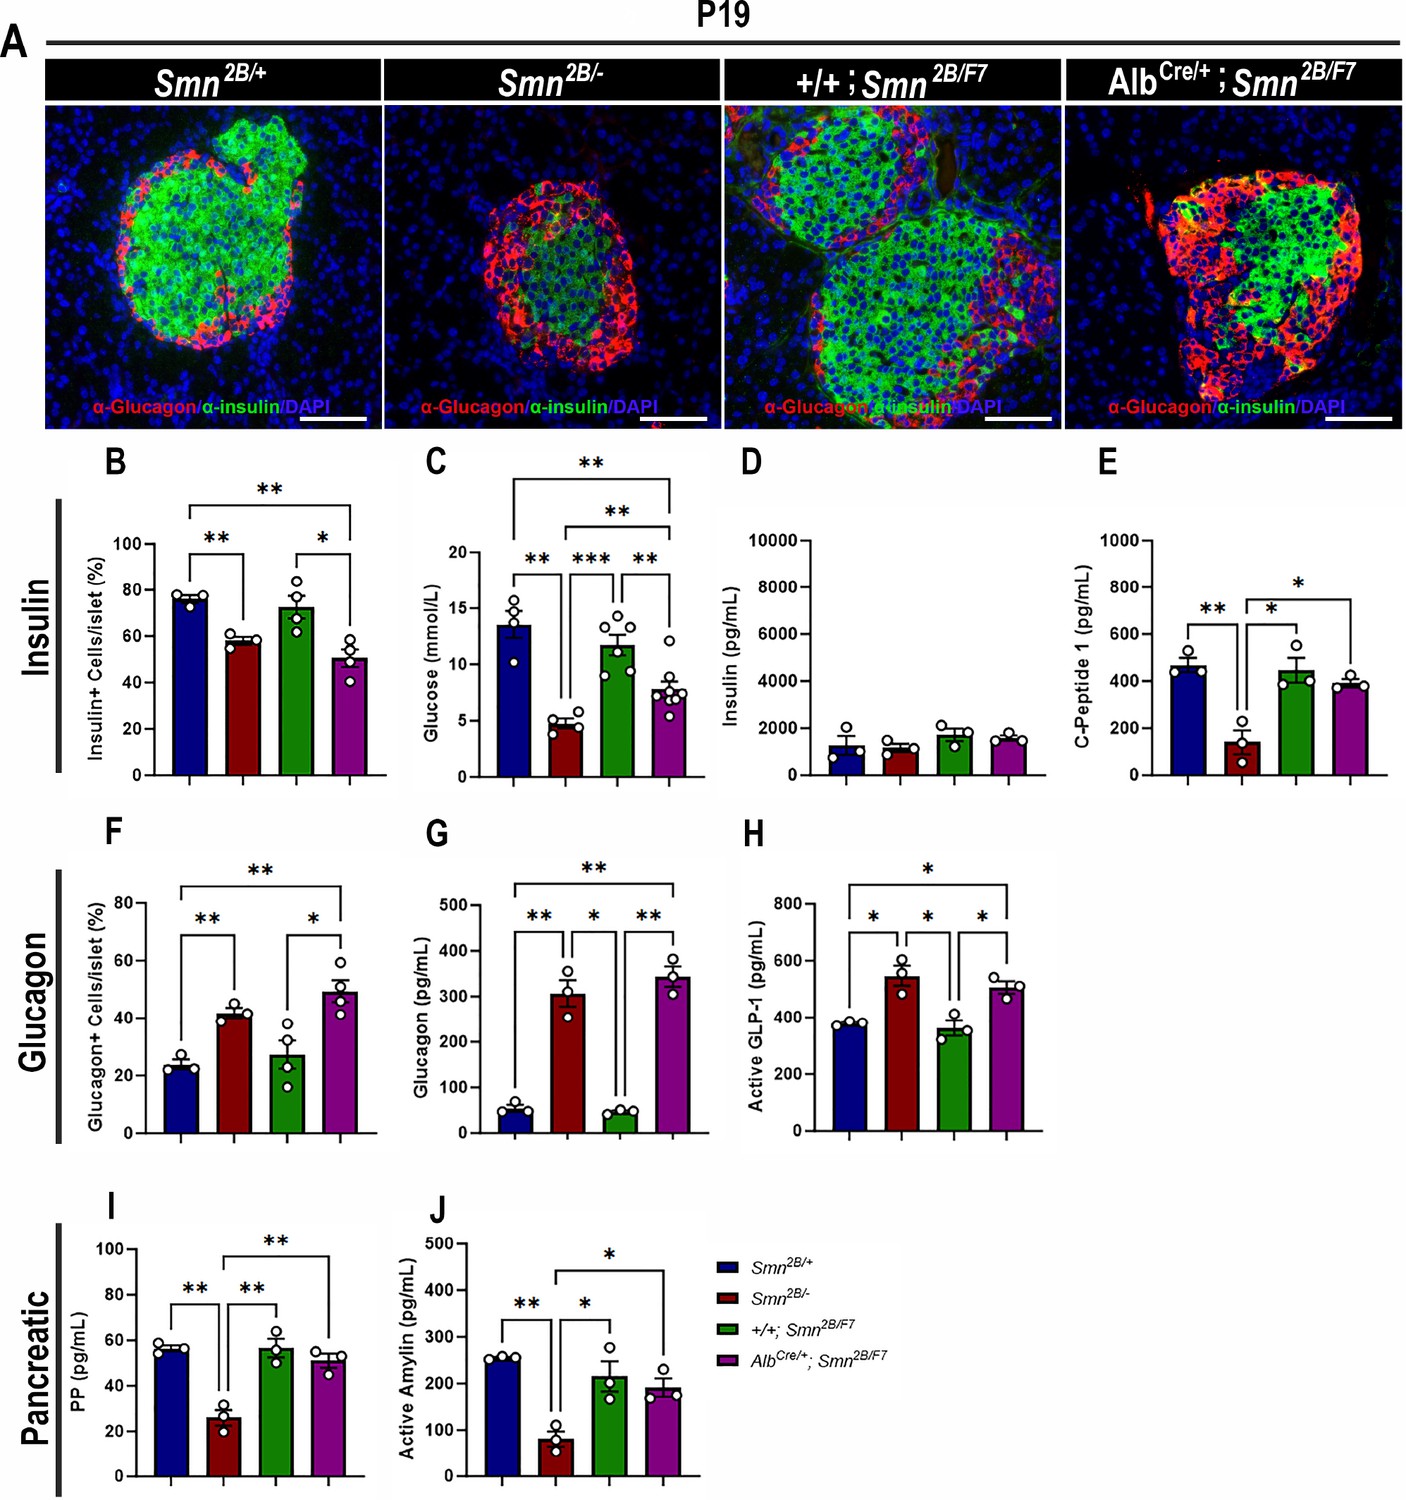
Contribution of liver-specific SMN depletion to pancreatic pathology.
(A) Representative immunofluorescent images of pancreatic islets stained for glucagon (red) and insulin (green) from Smn2B/+, Smn2B/-, +/+;Smn2B/F7, and AlbCre/+;Smn2B/F7 mice at P19. Scale bar 50 μm. (B) Bar graph shows quantification of insulin-positive cells relative to the total number of DAPI-positive cells within the pancreatic islet. (C) Bar graph depicts non-fasting blood glucose levels across different genotypes. (D, E) Bar graphs illustrate non-fasting plasma levels of insulin (D) and C-peptide (E). (F) Bar graph shows quantification of glucagon-positive cells relative to the total number of DAPI-positive cells within the pancreatic islet. (G–J) Bar graphs depict non-fasting plasma levels of glucagon (G), active GLP-1 (H), pancreatic polypeptide (I) and active amylin (J). n ≥ 3, mean ± SEM. Statistical significance indicated by *p < 0.05, **p < 0.01, ***p < 0.001, following Brown-Forsythe and Welch ANOVA.
-
Figure 3—source data 1
Raw data for plots in Figure 3B–J.
- https://cdn.elifesciences.org/articles/99141/elife-99141-fig3-data1-v1.xlsx
Figure 4
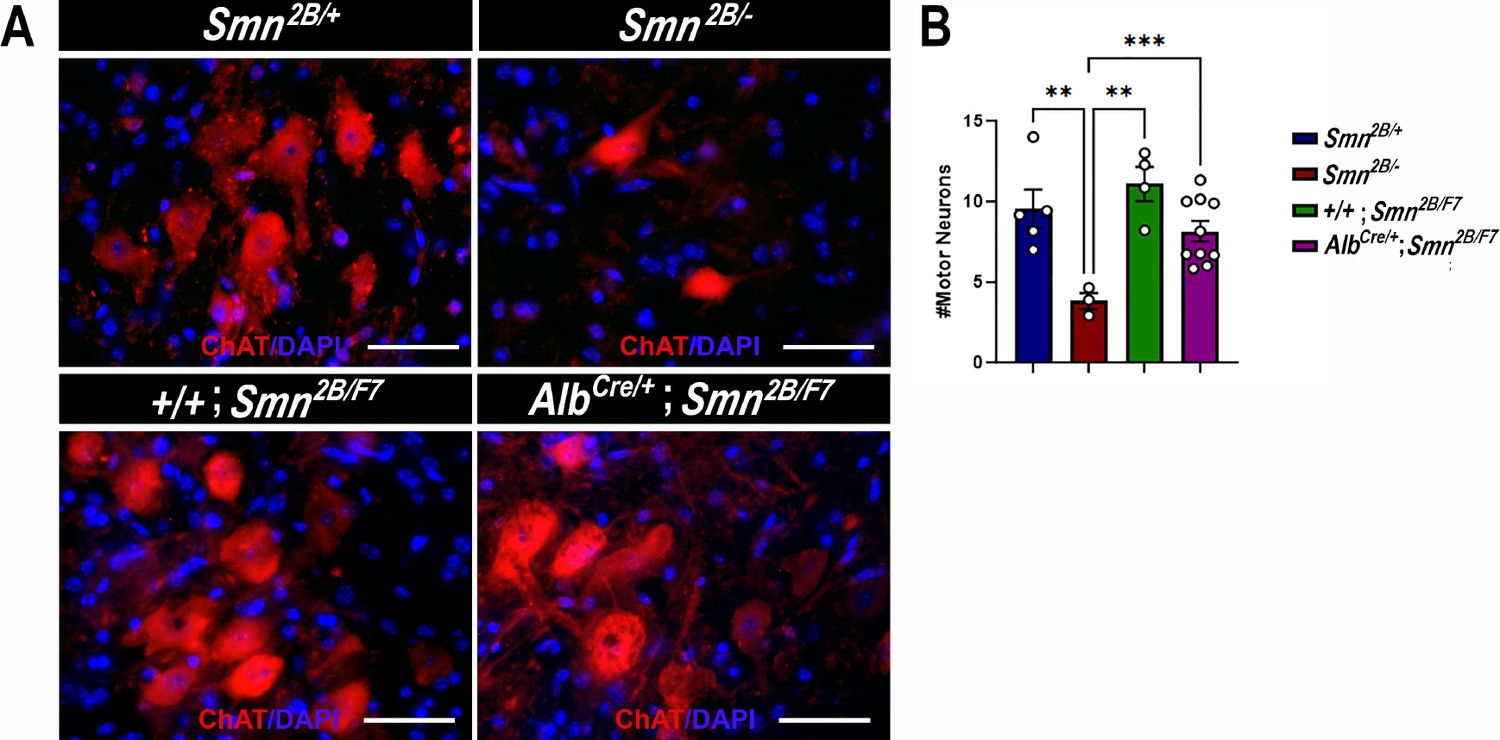
Impact of liver-specific SMN depletion on motor neuron cell body numbers.
(A) Representative images of lumbar spinal cord anterior horns stained for ChAT (red) and DAPI (blue) from Smn2B/+, Smn2B/-, +/+;Smn2B/F7, and AlbCre/+;Smn2B/F7 mice at P19. (B) Bar graph shows quantification of motor neuron cell body numbers. n ≥ 3, mean ± SEM. Statistical significance indicated by **p < 0.01, ***p < 0.001, following Brown-Forsythe and Welch ANOVA. Scale bar = 50 μm.
-
Figure 4—source data 1
Raw data for motor neuron counts in the plots in Figure 4B.
- https://cdn.elifesciences.org/articles/99141/elife-99141-fig4-data1-v1.xlsx
Figure 5
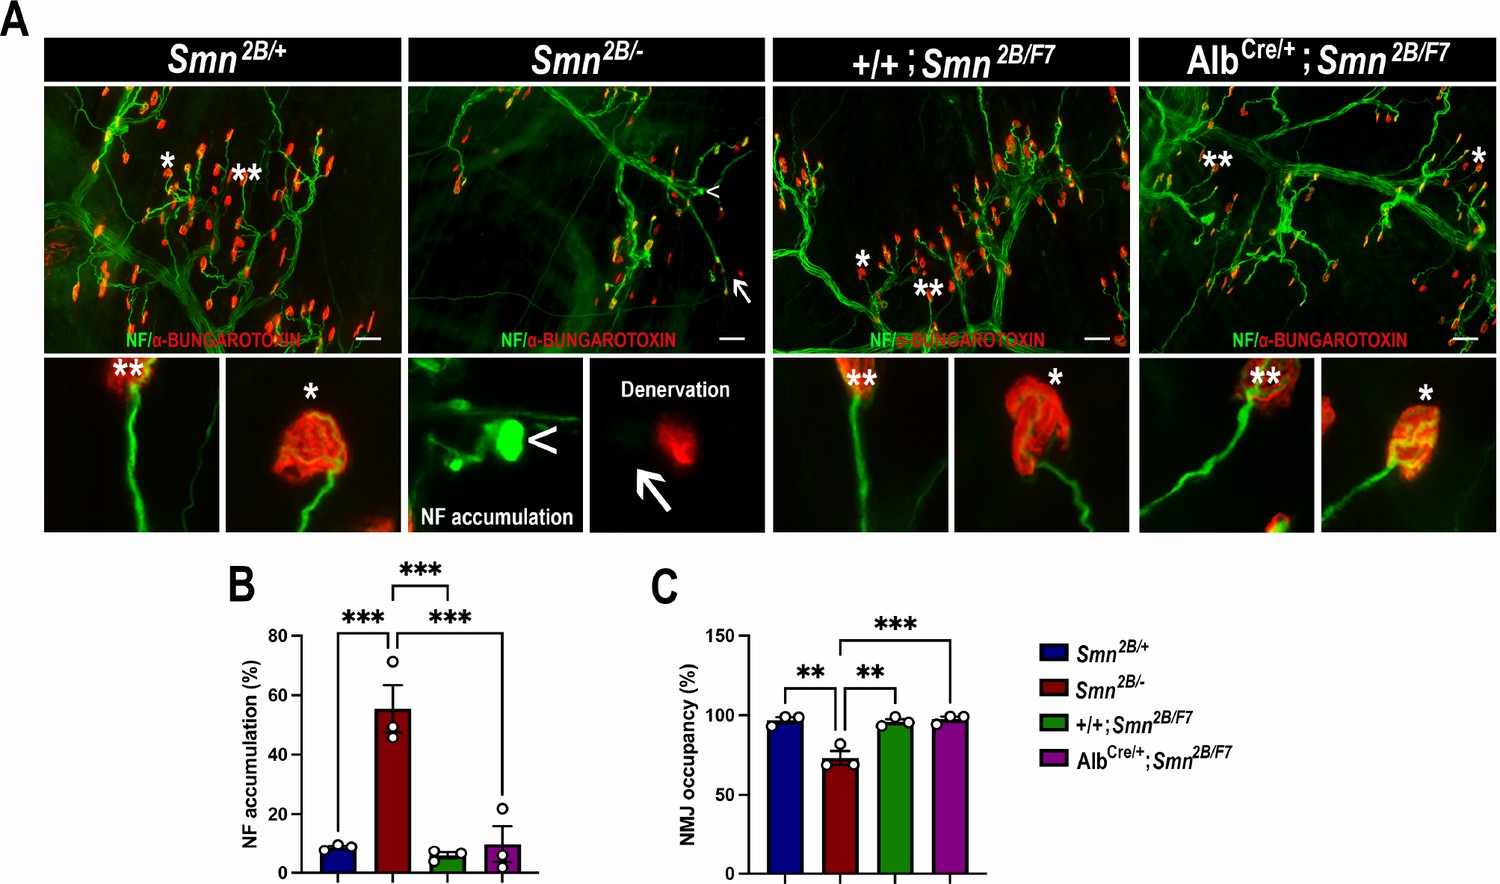
Impact of liver-specific SMN depletion on neuromuscular junction pathology.
(A) Representative images of transversus abdominis (TVA) muscle stained with bungarotoxin (red), neurofilament (NF) (green) and synaptic vesicle protein 2 (green) from Smn2B/+, Smn2B/-, +/+;Smn2B/F7, and AlbCre/+;Smn2B/F7 mice at P19. *Depicts occupied endplate, whereas **depicts normal neurofilament distribution; arrowheads show NF accumulation and arrows show unoccupied endplate/denervation. (B, C) Bar graphs show quantification of neurofilament accumulation (B) and endplate occupancy (C). n = 3, mean ± SEM. Statistical significance indicated by **p < 0.01, ***p < 0.001, following Brown-Forsythe and Welch ANOVA. Scale bar = 50 μm.
-
Figure 5—source data 1
Raw data for plots in Figure 5B and C.
- https://cdn.elifesciences.org/articles/99141/elife-99141-fig5-data1-v1.xlsx
Figure 6
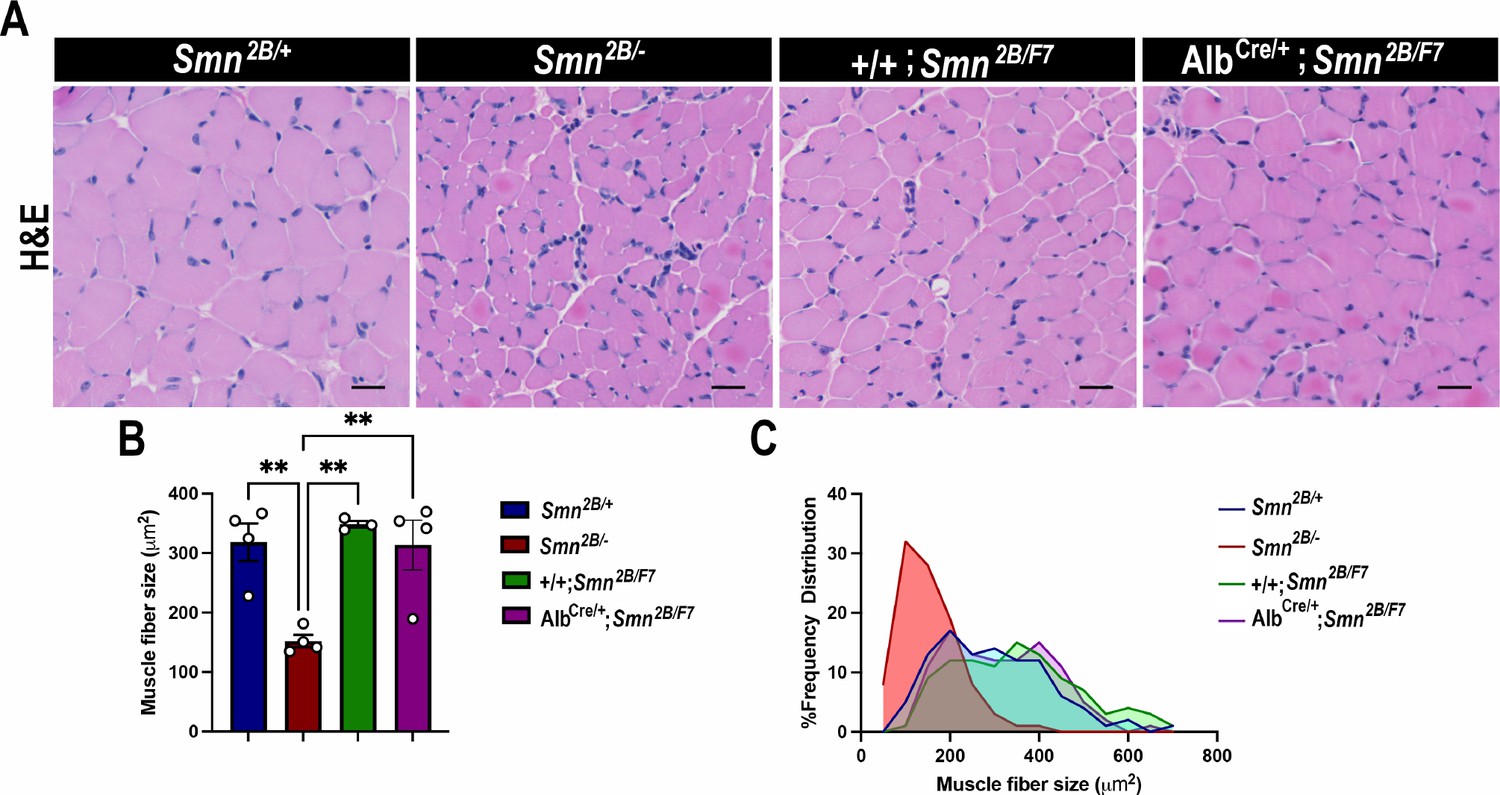
Impact of liver-specific SMN depletion on muscle fiber size and distribution.
(A) Representative images of H&E-stained tibialis anterior muscle sections from Smn2B/+, Smn2B/-, +/+;Smn2B/F7, and AlbCre/+;Smn2B/F7 mice at P19. (B) Bar graph shows quantification of muscle fiber cross-sectional area. C. Graph demonstrating frequency of muscle fiber size across different genotypes. n ≥ 3, mean ± SEM. Statistical significance indicated by **p < 0.01, following Brown-Forsythe and Welch ANOVA. Scale bar = 20 μm.
-
Figure 6—source data 1
Raw data for plots in Figure 6B and C.
- https://cdn.elifesciences.org/articles/99141/elife-99141-fig6-data1-v1.xlsx
Figure 7
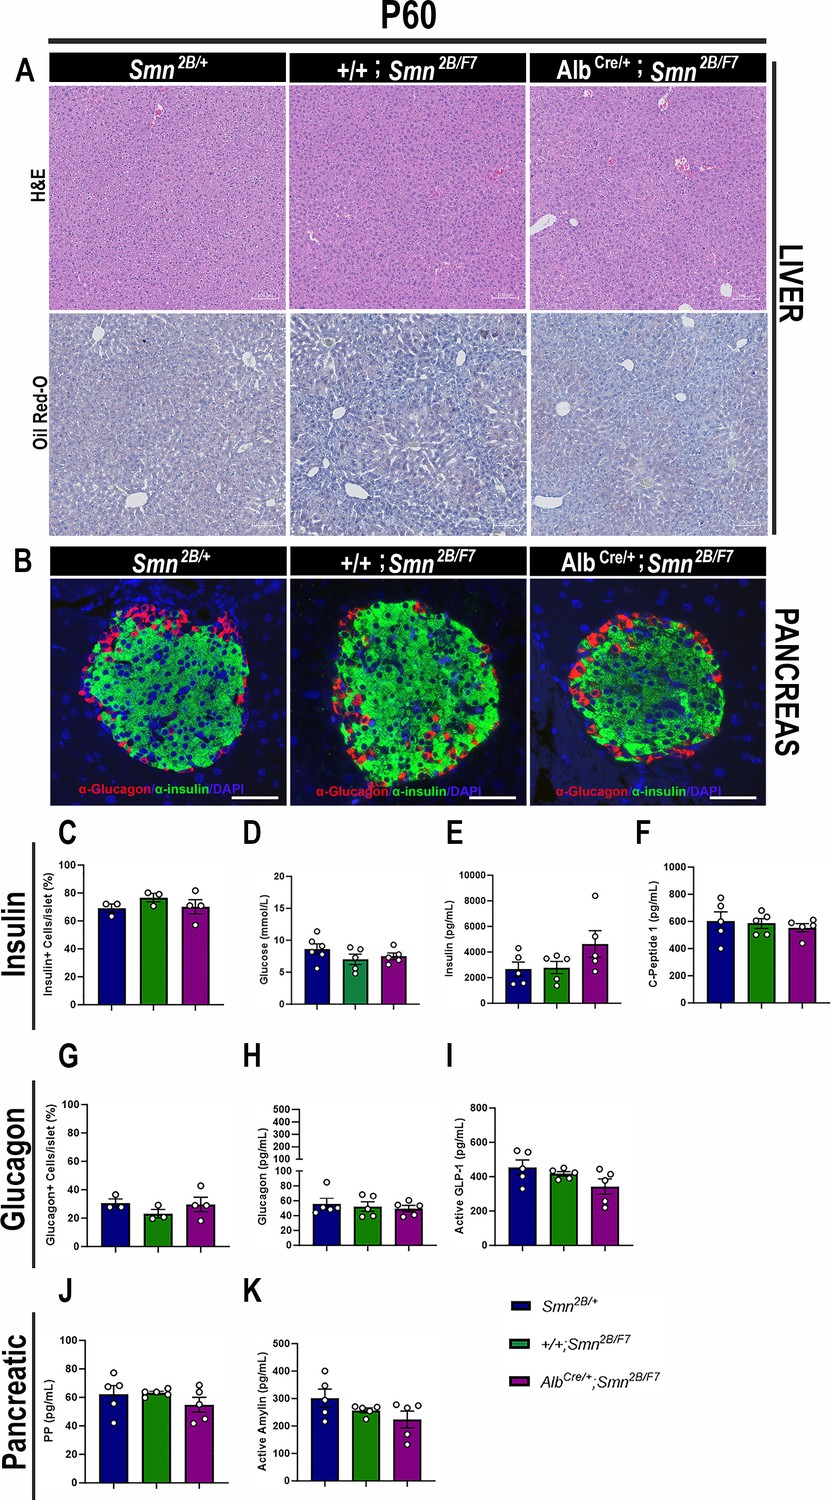
Consequences of liver-specific SMN depletion to early adulthood liver and pancreatic pathology.
(A) Representative images of H&E (top row) and Oil Red-O (bottom row) stained liver sections from Smn2B/+, +/+;Smn2B/F7, and AlbCre/+;Smn2B/F7 mice at P60. Scale bar 100 μm. (B) Representative immunofluorescent images of pancreatic islets stained for glucagon (red) and insulin (green) from Smn2B/+, +/+;Smn2B/F7, and AlbCre/+;Smn2B/F7mice at P60. Scale bar 50 μm. (C) Bar graph shows the quantification of insulin-positive cells relative to the total number of DAPI-positive cells within the pancreatic islet. (D) Bar graph depicts non-fasting blood glucose levels from P60 mice across different genotypes. (E, F) Bar graphs illustrate non-fasting plasma levels of insulin (E) and C-peptide (F). (G) Bar graph shows quantification of glucagon-positive cells relative to the total number of DAPI-positive cells within the pancreatic islet. (H–K) Bar graphs depict non-fasting plasma levels of glucagon (H), active GLP-1 (I), pancreatic polypeptide (J) and active amylin (K). n ≥ 3, mean ± SEM. Samples were analyzed using Brown-Forsythe and Welch ANOVA, and no statistically significant differences were observed.
-
Figure 7—source data 1
Raw data for plots in Figure 7C–K.
- https://cdn.elifesciences.org/articles/99141/elife-99141-fig7-data1-v1.xlsx
Figure 8
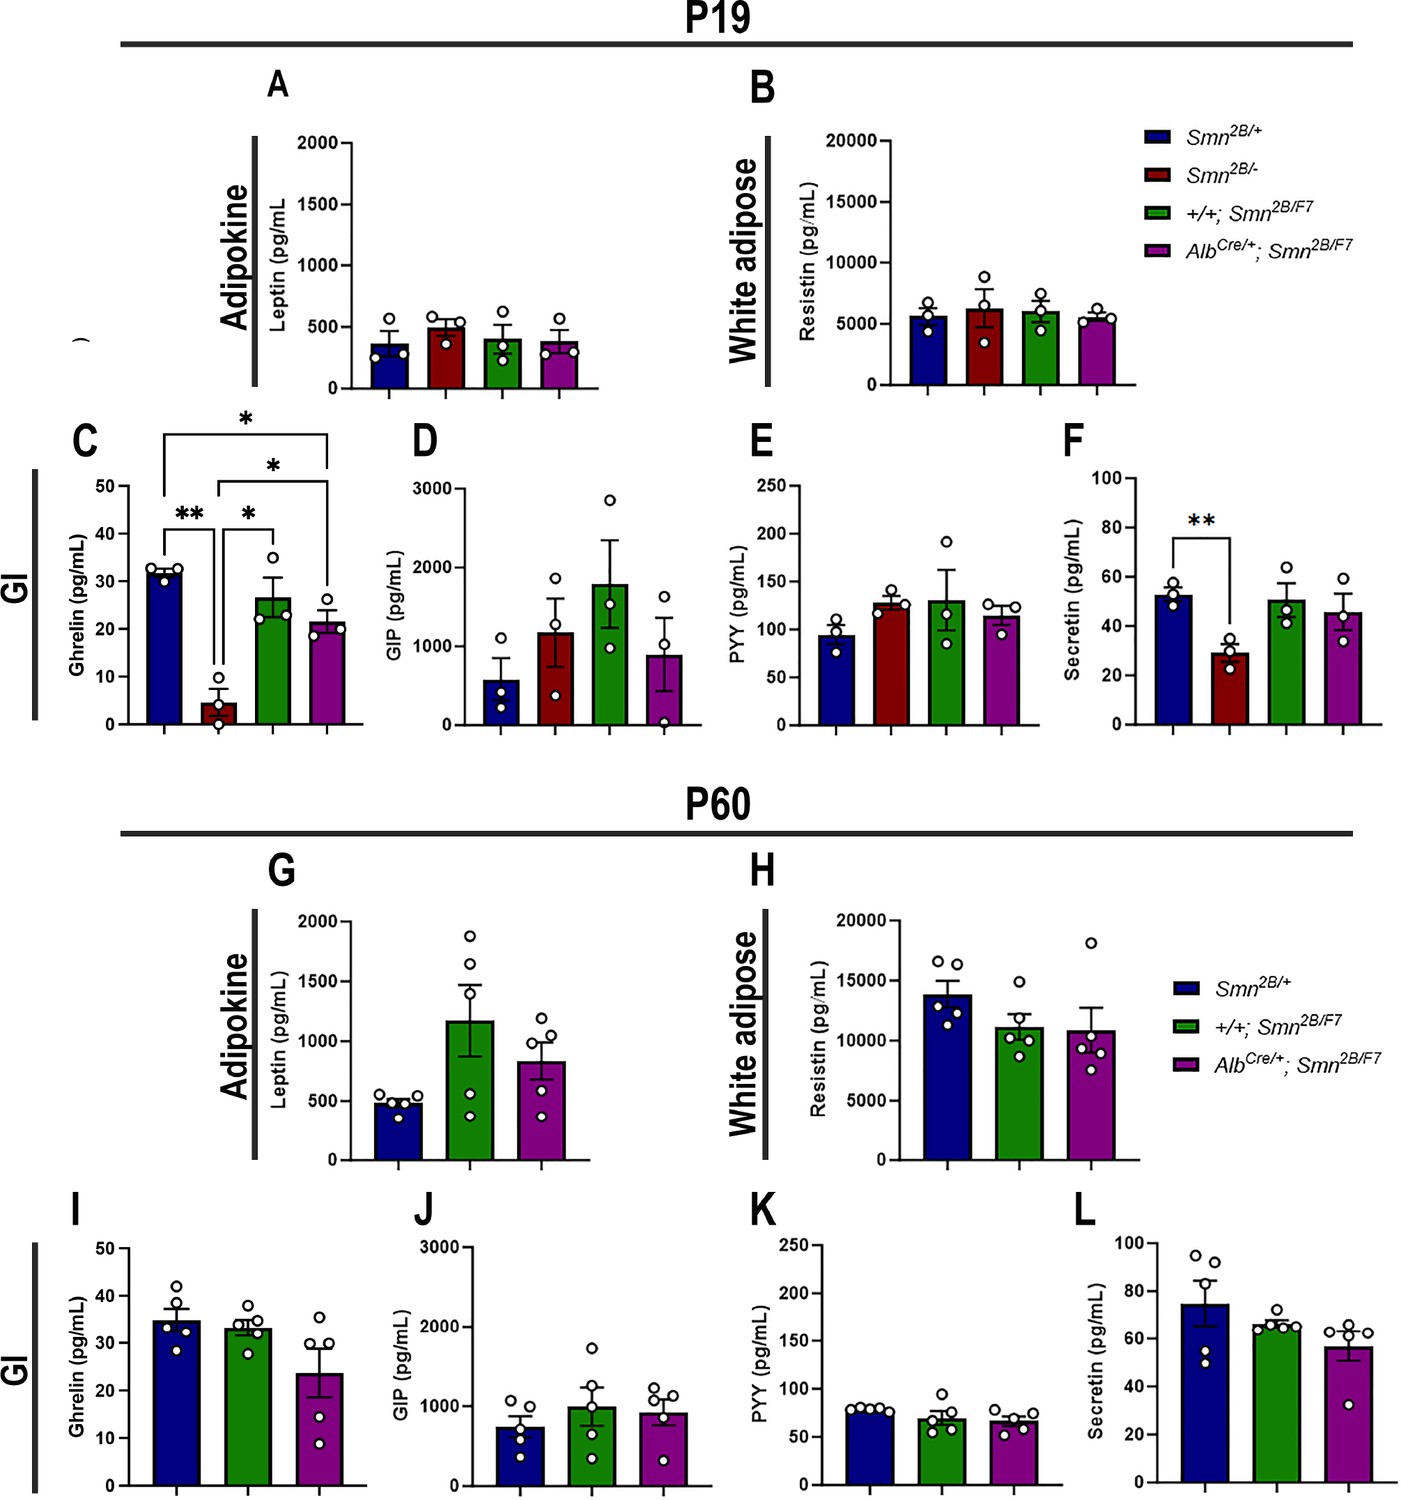
Contribution of liver-specific SMN depletion to major adipocyte and gastrointestinal hormones at P19 and P60.
Panels A-B and G-H show bar graphs depicting non-fasting plasma levels of adipocyte-secreted hormones leptin (A, G) and resistin (B, H) in P19 (A–B) and P60 (G–H) mice across different genotypes. Panels C-F and I-L illustrate non-fasting plasma levels of gastrointestinal-secreted hormones, including ghrelin (C, I), gastric inhibitory polypeptide (D, J), peptide YY (E, K), and secretin (F, L) in P19 (C–F) and P60 (I–L) mice. n ≥ 3, mean ± SEM. Statistical significance is indicated by *p < 0.05, **p < 0.01, following Brown-Forsythe and Welch ANOVA.
-
Figure 8—source data 1
Raw data for plots in Figure 8.
- https://cdn.elifesciences.org/articles/99141/elife-99141-fig8-data1-v1.xlsx
Figure 9
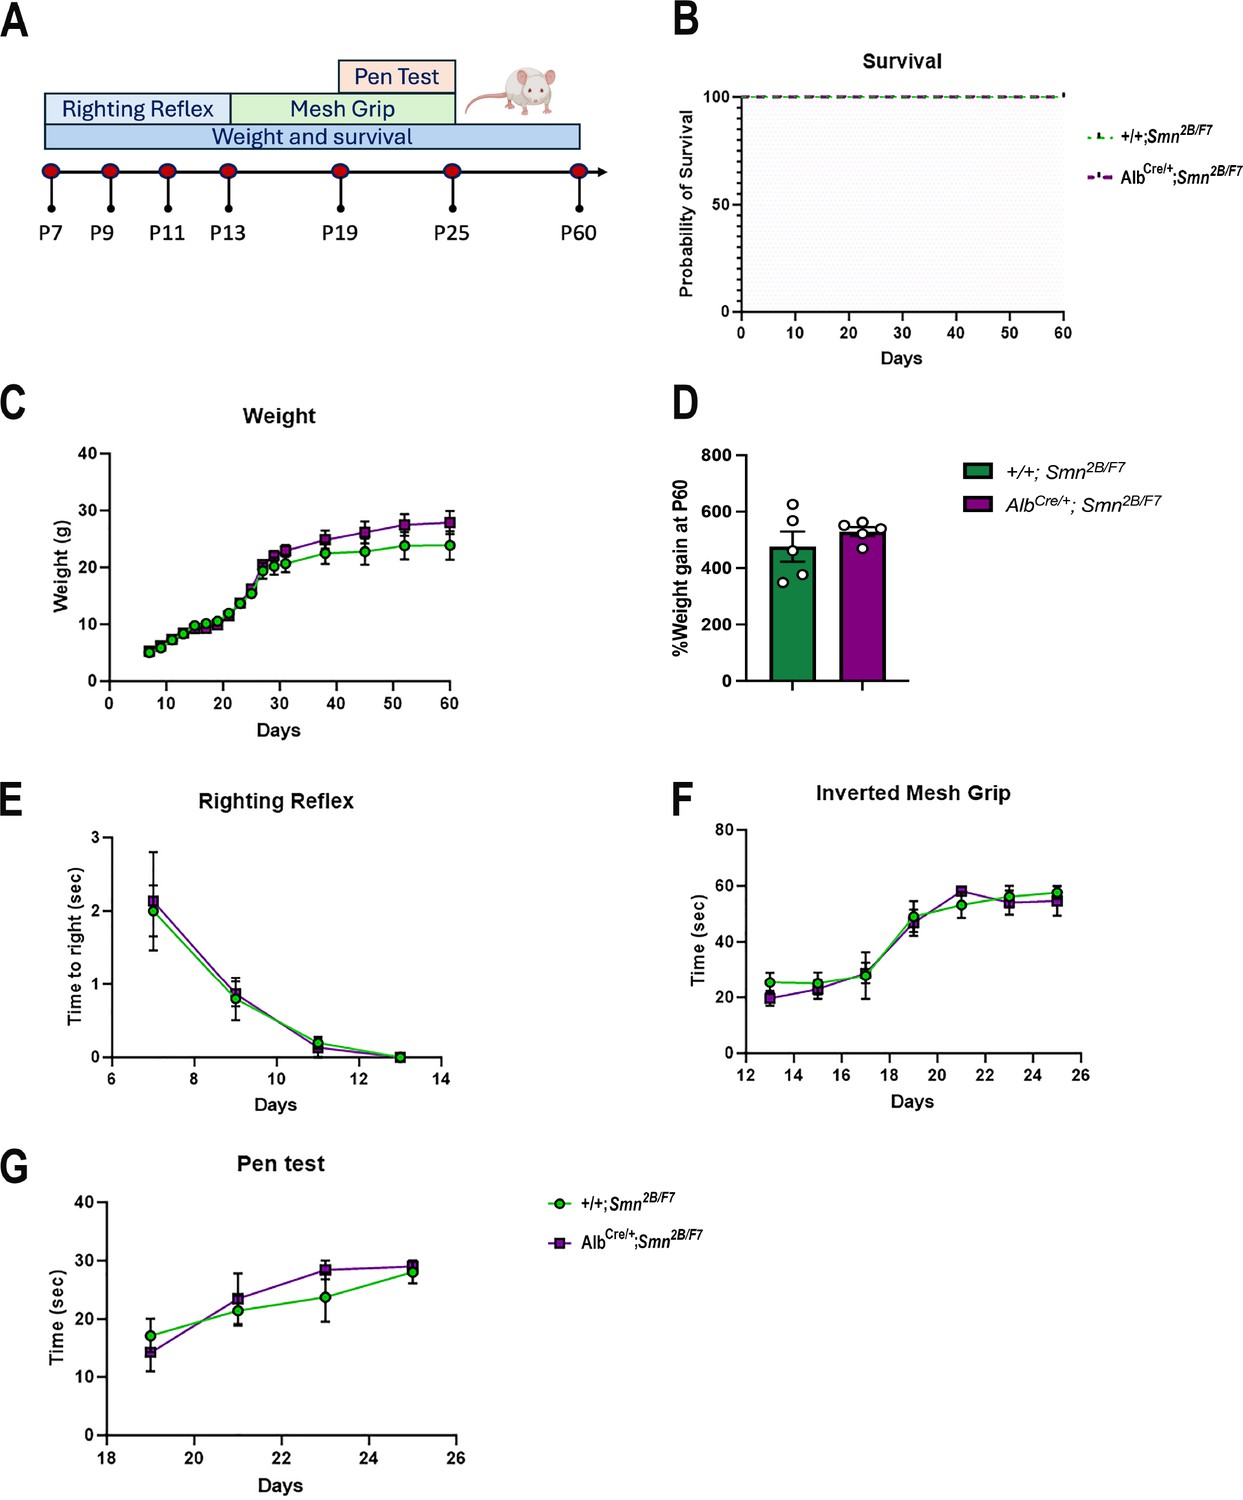
Impact of liver-specific SMN depletion on motor function.
(A) Schematic representation of experimental design. The righting reflex test was conducted from P7 to P13, the inverted mesh grip test from P13 to P25, and the pen test from P19 to P25. Assessments were performed every 2 days. Weight was measured every 2 days until day 30, and then weekly until day 60. Animal welfare was monitored throughout the 60-day period during weight measurements. (B) Kaplan–Meier survival curve comparing AlbCre/+;Smn2B/F7 and +/+;Smn2B/F7 mice up to 60 days. (C, E-G) Graphs show weight (C), righting reflex (E), inverted mesh grip (F) and pen test (G). n=5 per genotype, mean ± SEM. (B) Kaplan–Meier survival analysis; (C, E-G) two-way ANOVA, followed by Šídák’s method. (D) Percentage weight gain at P60, normalized to basal weight at P7. n=5 per genotype, mean ± SEM, two-tailed unpaired Student’s t-test.
-
Figure 9—source data 1
Raw data for plots in Figure 9B–G.
- https://cdn.elifesciences.org/articles/99141/elife-99141-fig9-data1-v1.xlsx
Tables
Table 1
List of primers used for genotyping.
| Name | Sequence (5'–3') |
|---|---|
| Alb-Cre | TGCAAACATCACATGCACAC |
| TTGGCCCCTTACCATAACTG | |
| GAAGCAGAAGCTTAGGAAGATGG | |
| SmnF7 | AGAAGGAAAGTGCTCACATACAAATT |
| TGTCTATAATCCTCATGCTATGGAG | |
| Smn2B | GGTTTCAGACAAAATAAAAAAGAATTTAAG |
| TTTGGCAGACTTTAGCAGGGC |
Table 2
List of antibodies used.
| Application | Antibody | Species | Dilution | Company (Catalog #) |
|---|---|---|---|---|
| Western Blot | SMN | Mouse | 1:2 500 | BD Transduction (610647) |
| Western Blot | Alpha-tubulin | Rabbit | 1:10 000 | Abcam (ab4074) |
| Western Blot | Alpha-tubulin | Mouse | 1:10 000 | Sigma-Aldrich (CP06) |
| Western Blot | Heme oxygenase-1 (HO) | Rabbit | 1:10 000 | Abcam (ab68477) |
| Western Blot | P62 | Mouse | 1:1 000 | Abcam (ab56416) |
| Western Blot | Transferrin | Rabbit | 1:1 000 | Abcam (ab82411) |
| Western Blot | Goat anti-mouse IR Dye 800 CW | 1:5 000 | LI-COR (925–32210) | |
| Western Blot | Goat anti-mouse IR Dye 680 R | 1:5 000 | LI-COR (926–68070) | |
| Western Blot | Goat anti-rabbit IR Dye 800 CW | 1:5 000 | LI-COR (925–32211) | |
| Western Blot | Goat anti-rabbit IR Dye 680 R | 1:5 000 | LI-COR (926–68071) | |
| IHC | ChAT | Goat | 1:100 | Millipore (AB144P) |
| IHC | Donkey anti-goat Alexa Fluor 555 | 1:200 | Invitrogen (A21432) | |
| IHC | TRITC conjugated bungarotoxin | N/A | 1:1 000 | Invitrogen (T1175) |
| IHC | Neurofilament (NF-M) | Mouse | 1:100 | (Developmental Studies Hybridoma Bank, P12839) |
| IHC | Synaptic vesicle glycoprotein 2 A (SV2A) | Mouse | 1:250 | (Developmental Studies Hybridoma Bank, Q7L0J3) |
| IHC | Goat anti-mouse Alexa Fluor 488 | 1:250 | Invitrogen (A11001) | |
| IHC | Glucagon | Mouse | 1:200 | Abcam (ab10988) |
| IHC (Parafin) IHC (Frozen) | Cre Recombinase (D7L7L) | Rabbit | 1:500 1:200 | Cell Signaling (15036) |
| IHC | Insulin | Rabbit | 1:50 | Abcam (ab181547) |
| IHC | Goat anti-mouse Alexa Fluor 555 | 1:500 | Invitrogen (A21422) | |
| IHC | Goat anti-rabbit Alexa Fluor 488 | 1:500 | Invitrogen (A11034) |
Additional files
Download links
A two-part list of links to download the article, or parts of the article, in various formats.
Downloads (link to download the article as PDF)
Open citations (links to open the citations from this article in various online reference manager services)
Cite this article (links to download the citations from this article in formats compatible with various reference manager tools)
Impact of liver-specific survival motor neuron (SMN) depletion on central nervous system and peripheral tissue pathology
eLife 13:RP99141.
https://doi.org/10.7554/eLife.99141.3


