Trade-offs in modeling context dependency in complex trait genetics
- Department of Integrative Biology, The University of Texas at Austin, United States
- Department of Population Health, The University of Texas at Austin, United States
- Department of Human Genetics, University of Chicago, United States
- Department of Statistics and Data Sciences, The University of Texas at Austin, United States
Figures
Figure 1
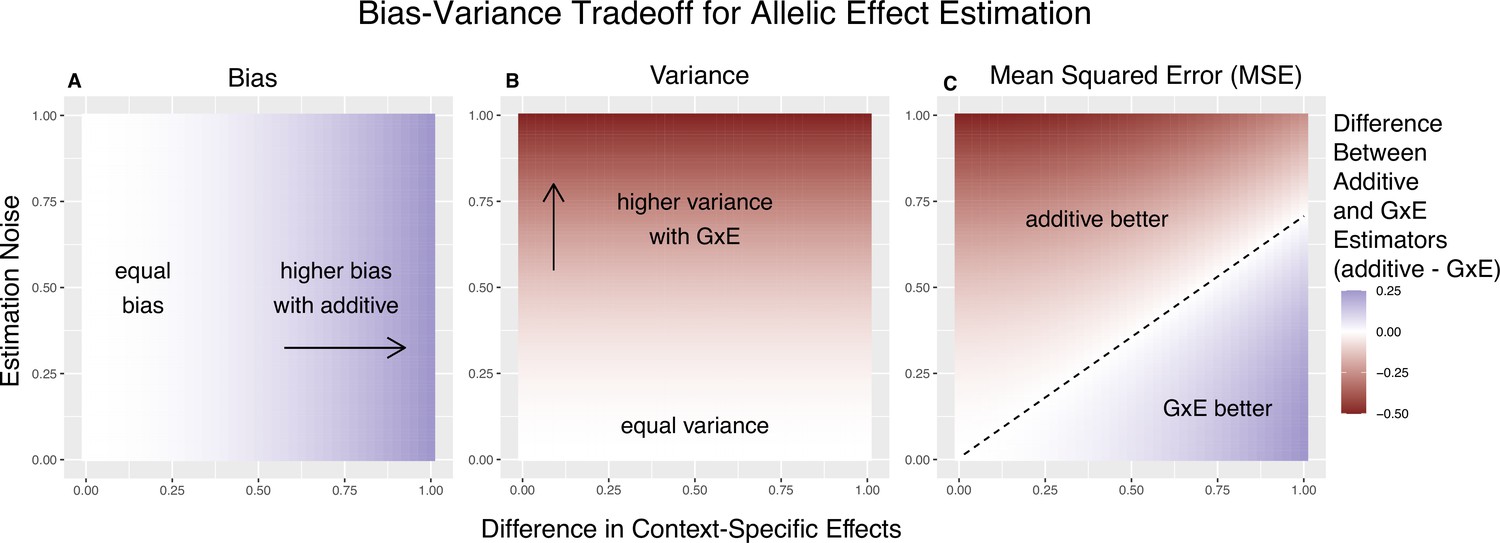
Bias-variance trade-off for single-site estimation with equal estimation noise and equal heterozygosity across contexts.
The x-axis shows the difference in context-specific effects, while the y-axis shows the standard deviation of the context-specific estimators—both in raw measurement units. The color on the plot indicates the difference between the additive and gene-by-environment interaction (GxE) estimators in bias (A), variance (B), or mean squared error (MSE) (C). (A) Only the additive estimator is potentially biased. The bias is proportional to the difference in context-specific effects and independent of the estimation noise. (B) The difference in variance is proportional to context-specific estimation noise and independent of the difference of context-specific effects. (C) The decision boundary is linear in both the estimation noise and the difference between context-specific effects.
Figure 2
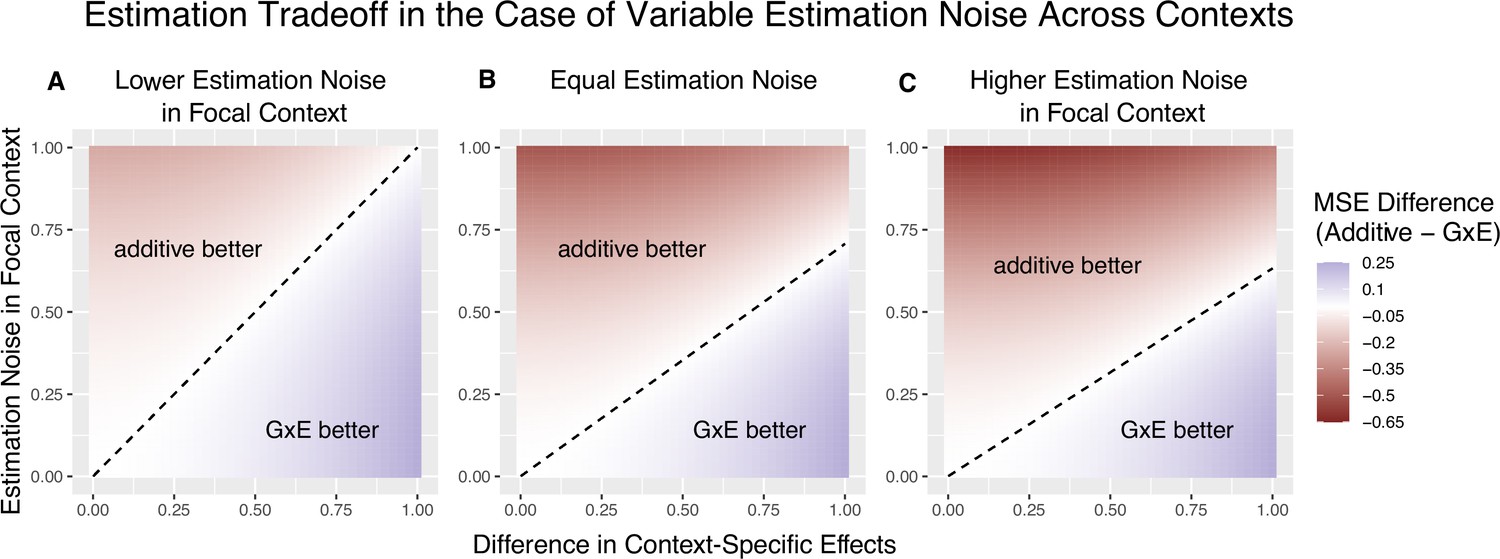
The decision boundary with different ratios of context-specific estimation noises.
In all panels, the heterozygosity of the variant is assumed to be equal across contexts. The x and y axes are the same as in Figure 1. (A) Estimation noise in the focal context, , is half that of the other context, . (B) Estimation noise is equal in both contexts. (C) Estimation noise in focal context is double that of the other context.
Figure 3
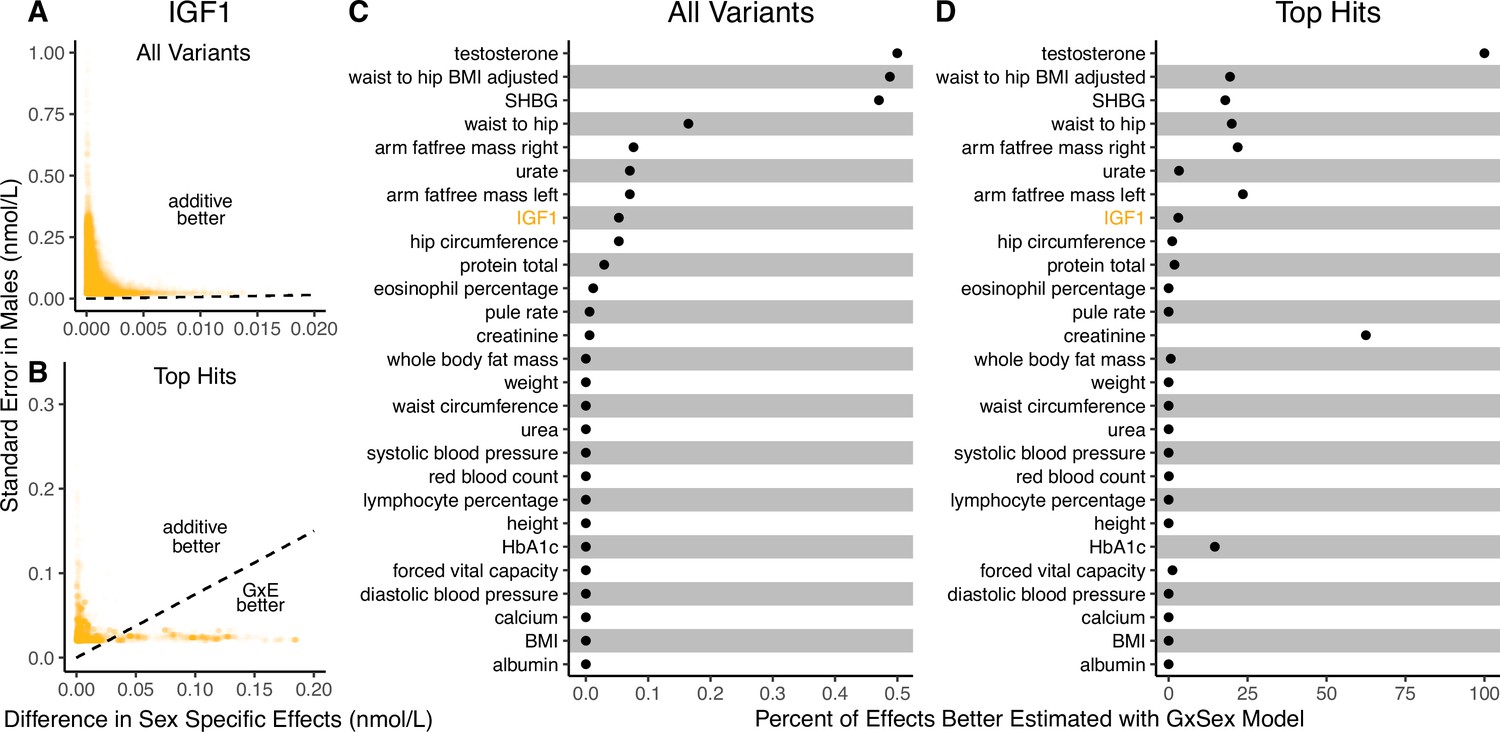
Applying the decision rule to sex-dependent effects on human physiological traits.
(A, B) The x-axis shows the estimated absolute difference between the effect of variants in males and females. The y-axis shows the measured standard error for each variant in males, the focal context here. The dashed line shows the decision boundary for effect estimation in males. The difference in mean squared error (MSE) between estimation methods increases linearly with distance from the dashed line, as in Figure 2. If a variant falls above (below) the line, the additive (gene-by-environment interaction [GxE]) estimator has a lower MSE. (A) shows a random sample of 15K single nucleotide variants whereas (B) shows only variants with a marginal p-value less than in males. (C, D) The percent of effects in males which would be better estimated by the GxE estimator, across continuous physiological traits. (Note the difference in scale between the two panels.) To estimate these percentages, one single nucleotide variant is sampled from each of 1700 approximately independent autosomal linkage blocks, and this procedure is repeated 10 times. Shown are average percentages across the 10 iterations.
Figure 4
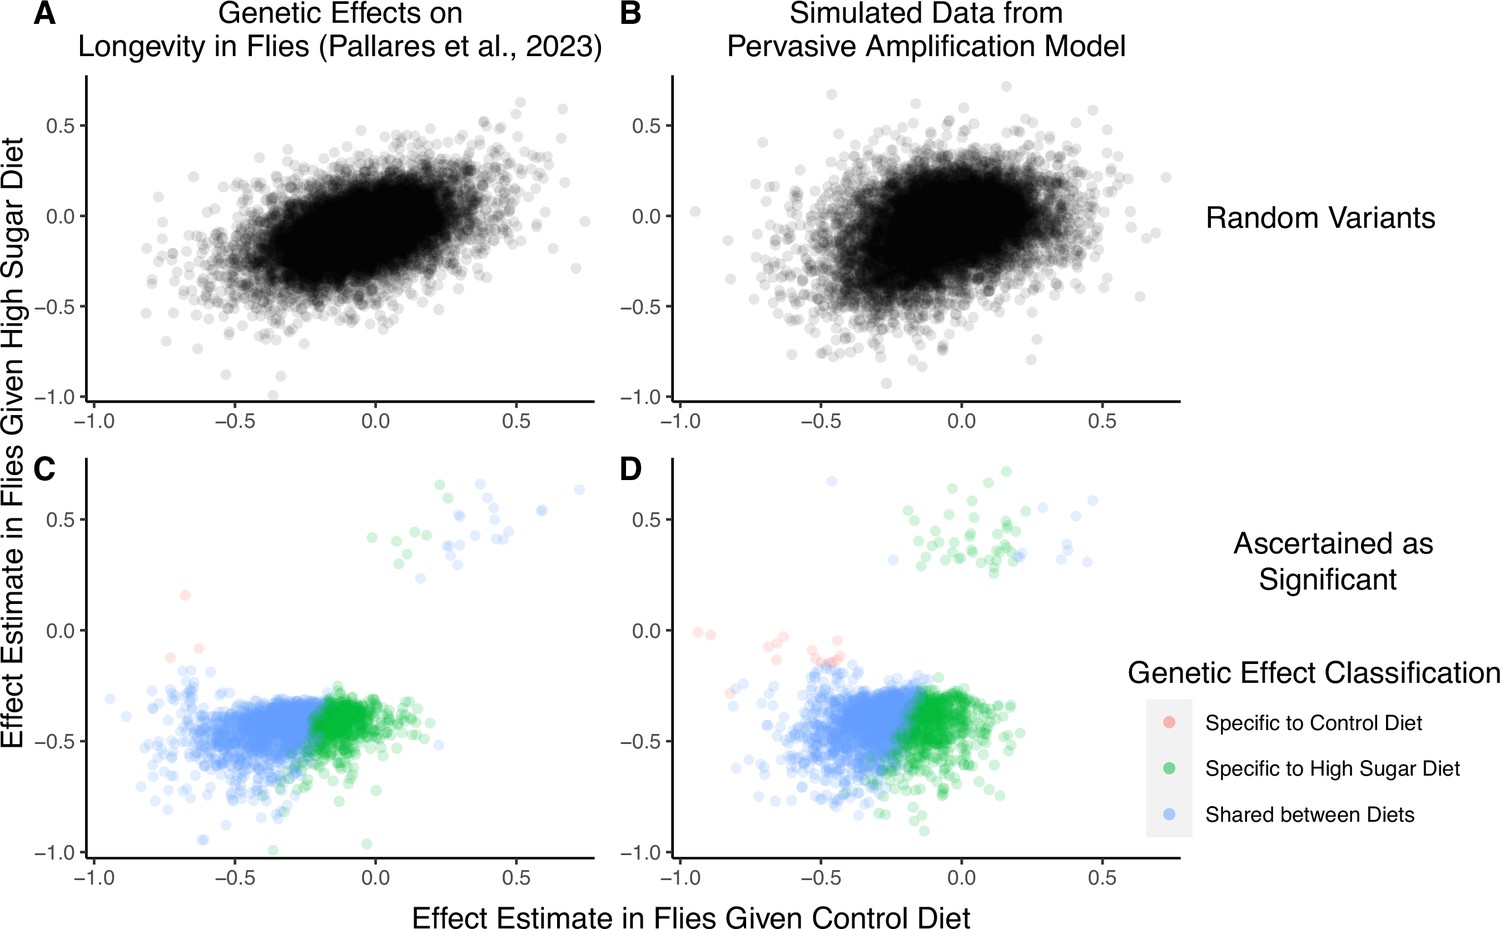
A focus on top hits may be lead to mischaracterization of polygenic gene-by-environment interactions (GxE).
(A) Data from an experiment measuring allelic effects on longevity in caged flies given one of two diets, ‘control’ and ‘high sugar’. Shown are allelic effect estimates under each diet for a random sample of approximately 12K variants. (B) Simulated data where all true allelic effects are exactly 1.4 times larger under a high-sugar diet. The effects are estimated with sampling noise mimicking the Pallares et al. data. (C) Allelic effect estimates of variants ascertained as significant and classified as ‘diet-specific’ or ‘shared’ by Pallares et al. (D) Simulated effects ascertained as significant and classified using a similar procedure to that applied in (C). While the generative mode of GxE we used in our simulations was not considered by Pallares et al., the simulation results (left panels) closely match the patterns observed in their data (right panels) across all effects (top panels) and as reflected via their classification approach (bottom panels).
Figure 5
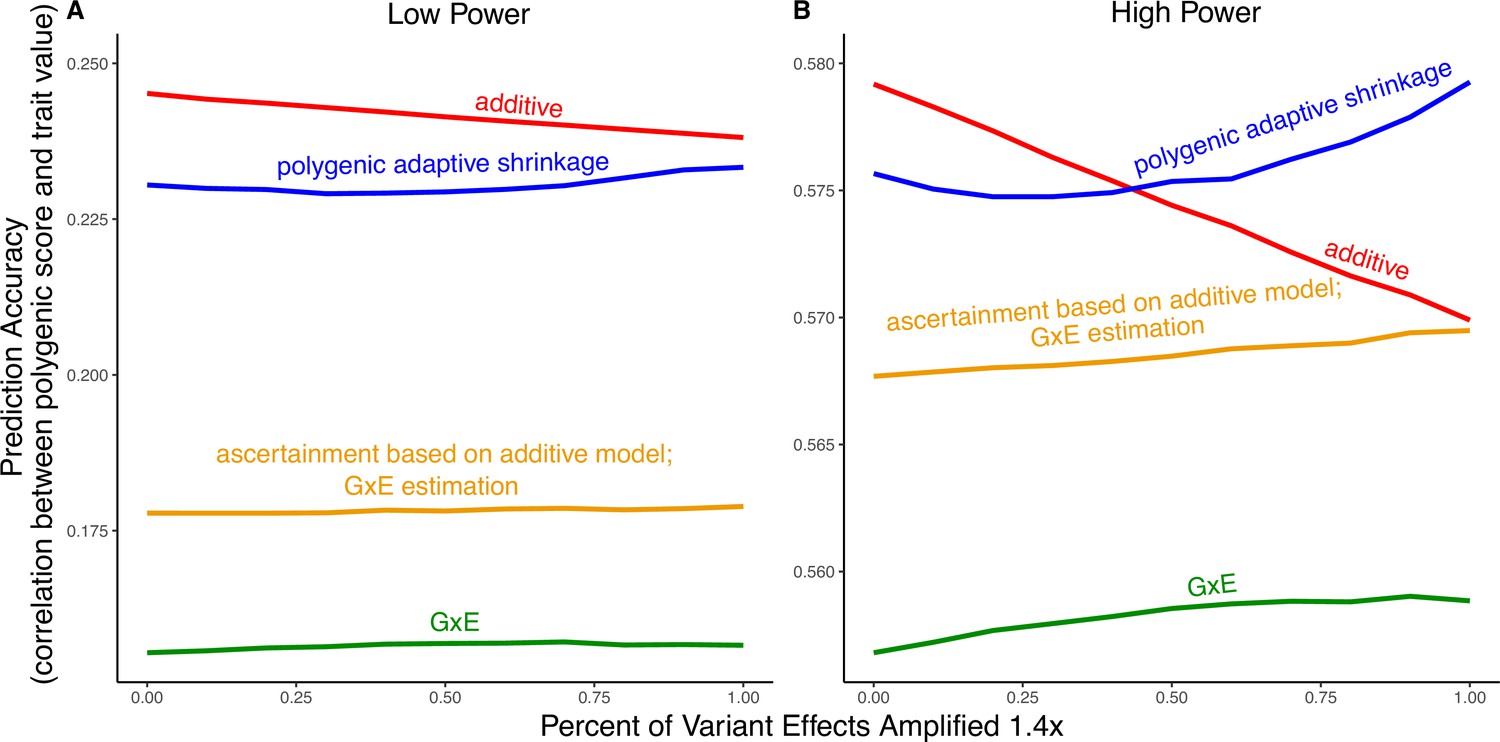
Polygenic score performance for context-dependent prediction models.
In each simulation, a genome-wide association study (GWAS) is performed on 5000 biallelic variants, half of which have no effect in either context. Of the other half, some percent of the variants (indicated on the x-axis) had effects 1.4× larger in one of contexts and the remaining SNPs had equal effects in both contexts. The broad sense heritability was set to in all simulations. The y-axis shows the average, over simulations, of the out-of-sample Pearson correlation between polygenic score and trait value. (A) Results with a GWAS sample size of 1000 individuals. (B) Results with a GWAS size of individuals.
Appendix 1—figure 1
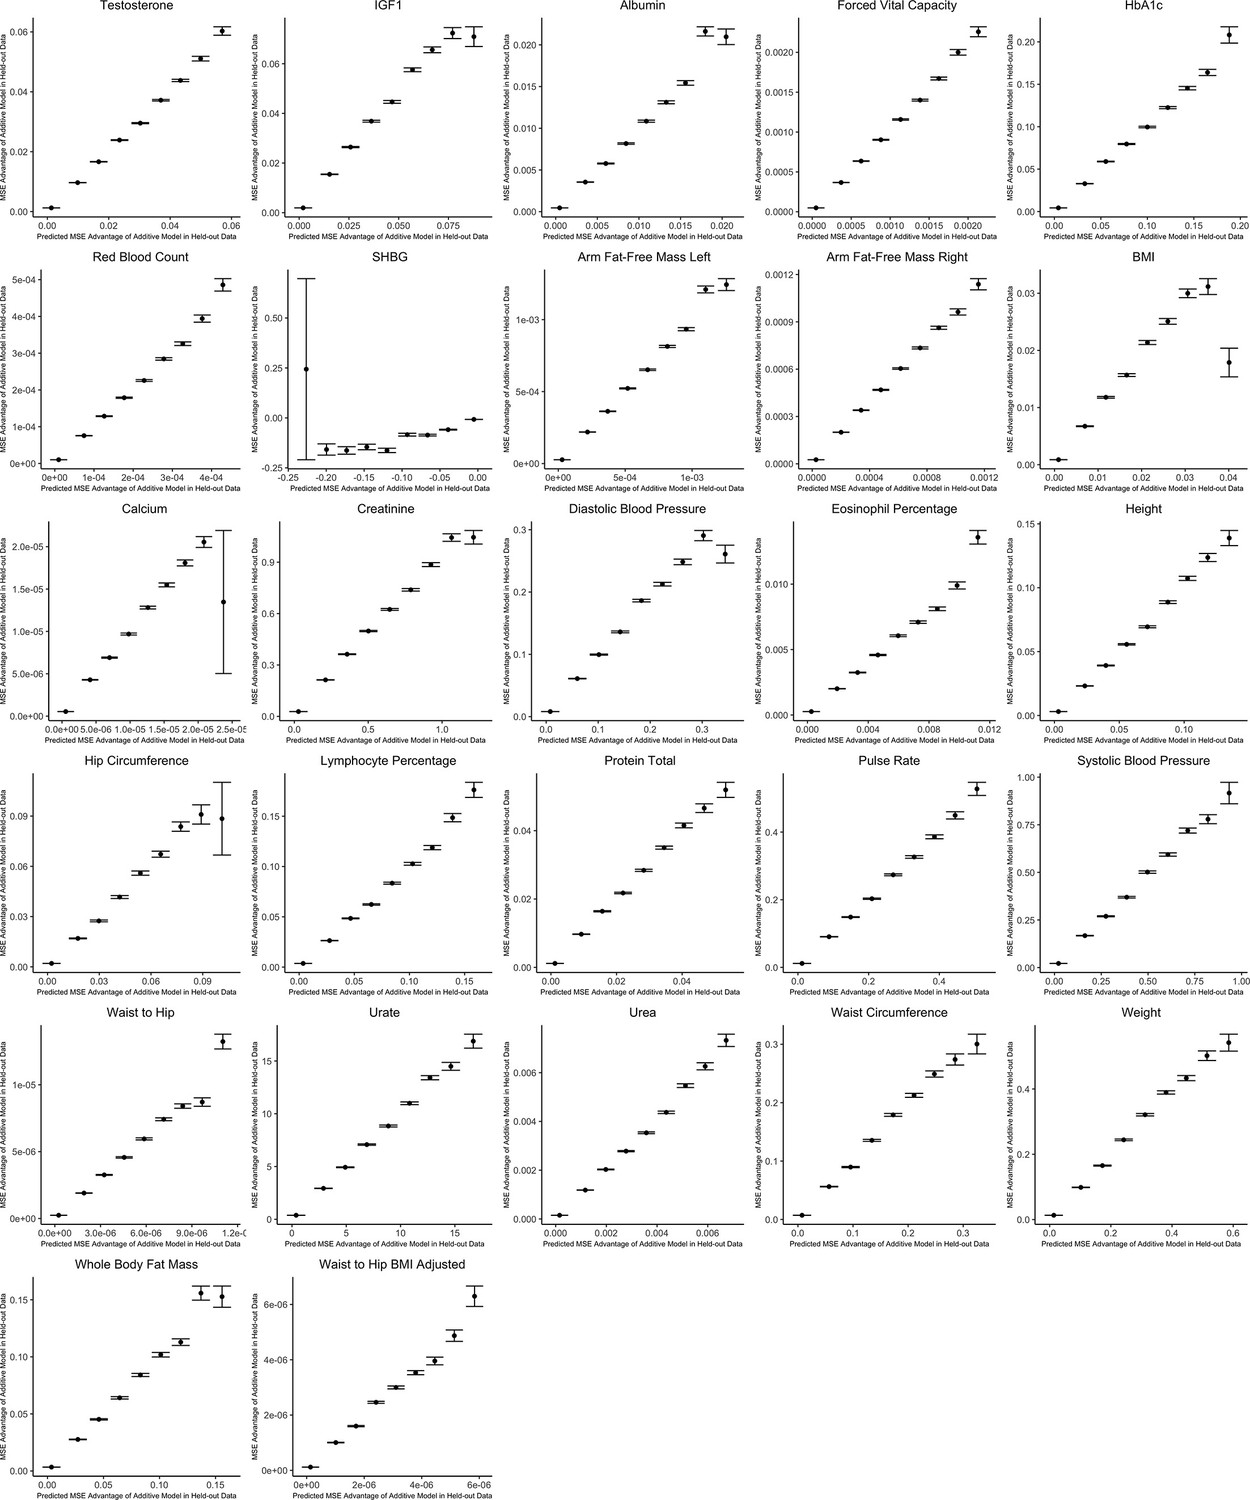
Out-of-sample validation of decision rule for sex-stratified genome-wide association studies (GWAS) for 27 complex traits.
For each trait, we use the procedure specified in the section Validating and applying the decision rule to real data. The x-axis shows the expected mean squared error (MSE) advantage of the additive estimator in predicting the male effect based on the decision rule, where the y-axis shows the actual MSE advantage of the additive model in predicting the male effect calculated using an independent sample. Values on the x-axis are grouped into nine evenly spaced bins, and the y-axis shows bin averages (with error bars indicating 1 standard deviation, where the sample size is equal to the number of SNPs falling into each bin). For ease of viewing, data above the 99th percentile and below the 1st percentile on the x-axis are removed.
Appendix 1—figure 2
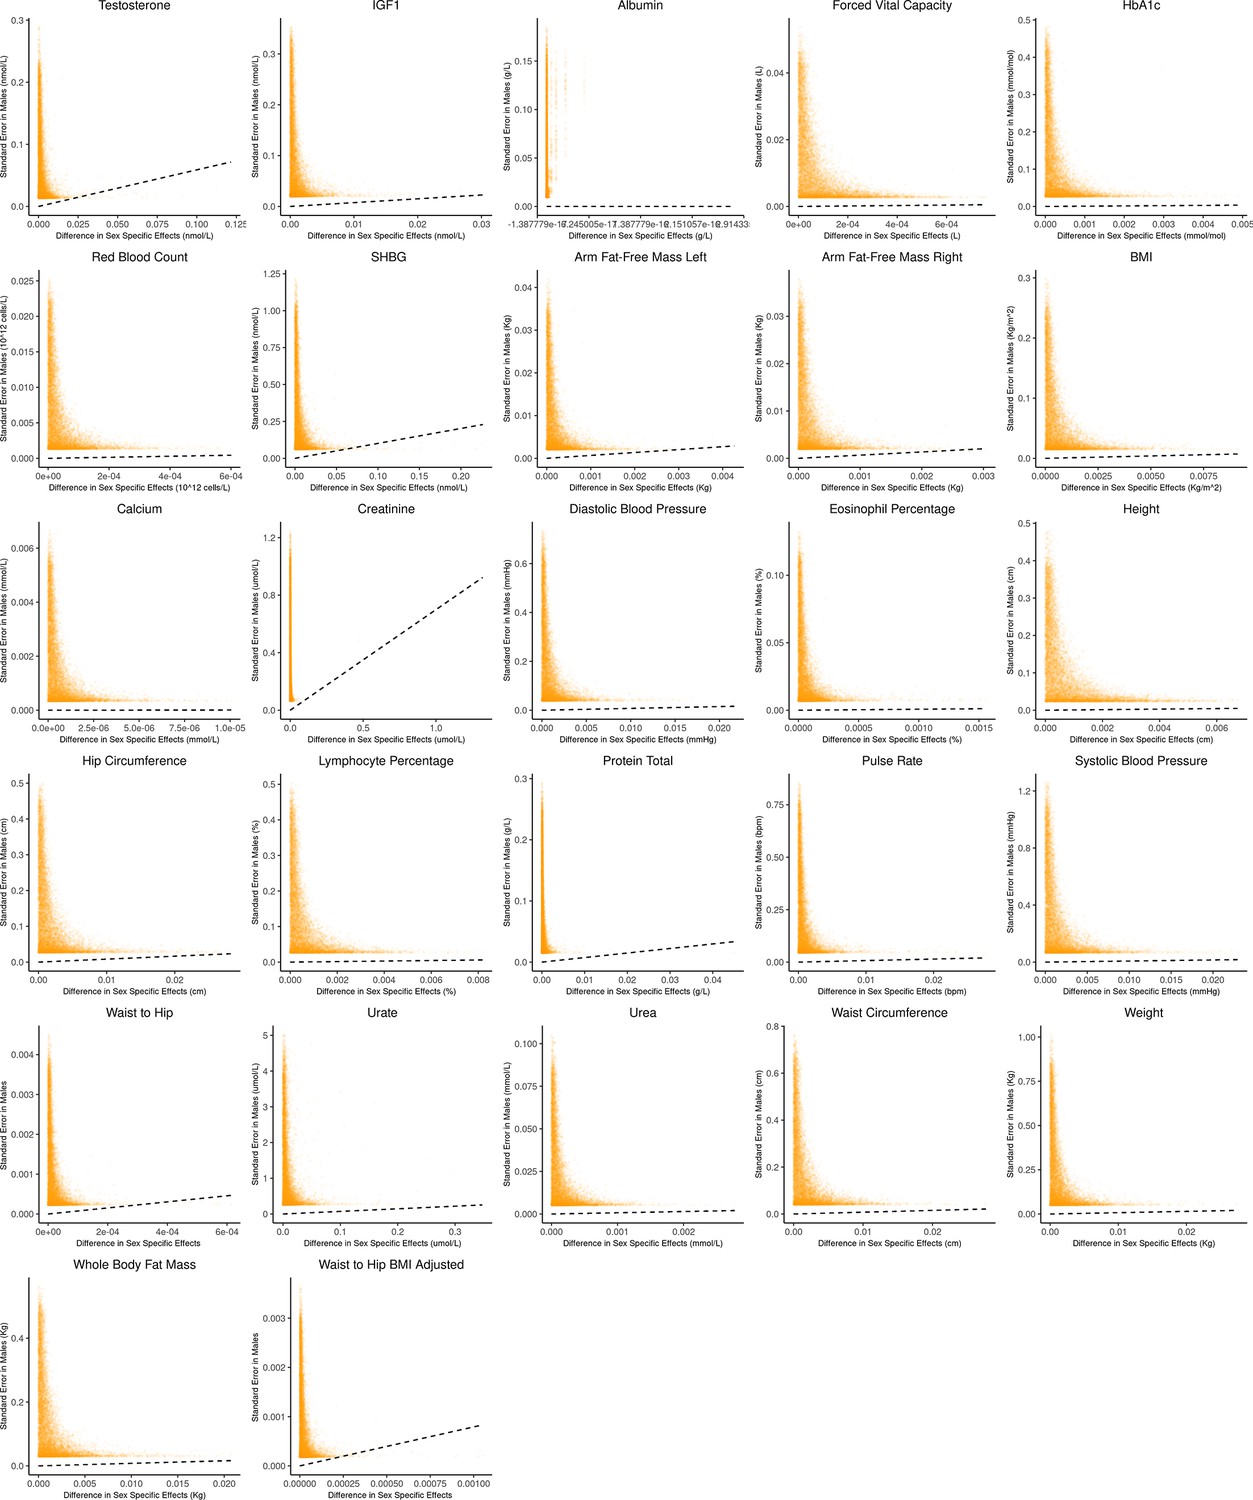
Bias-variance trade-off at random variants in a sex-stratified genome-wide association studies (GWAS).
This figure extends Figure 3A of the main text to all physiological traits analyzed. The x-axis shows the estimated absolute difference between the effect of variants in males and females. The y-axis shows the measured standard error for each variant in males, the focal context here. The dashed line shows the decision boundary for effect estimation in males. The difference in mean squared error (MSE) between estimation methods increases linearly with distance from the dashed line, as in Figure 2. If a variant falls above (below) the line, the additive (gene-by-environment interaction [GxE]) estimator has a lower MSE.
Appendix 1—figure 3
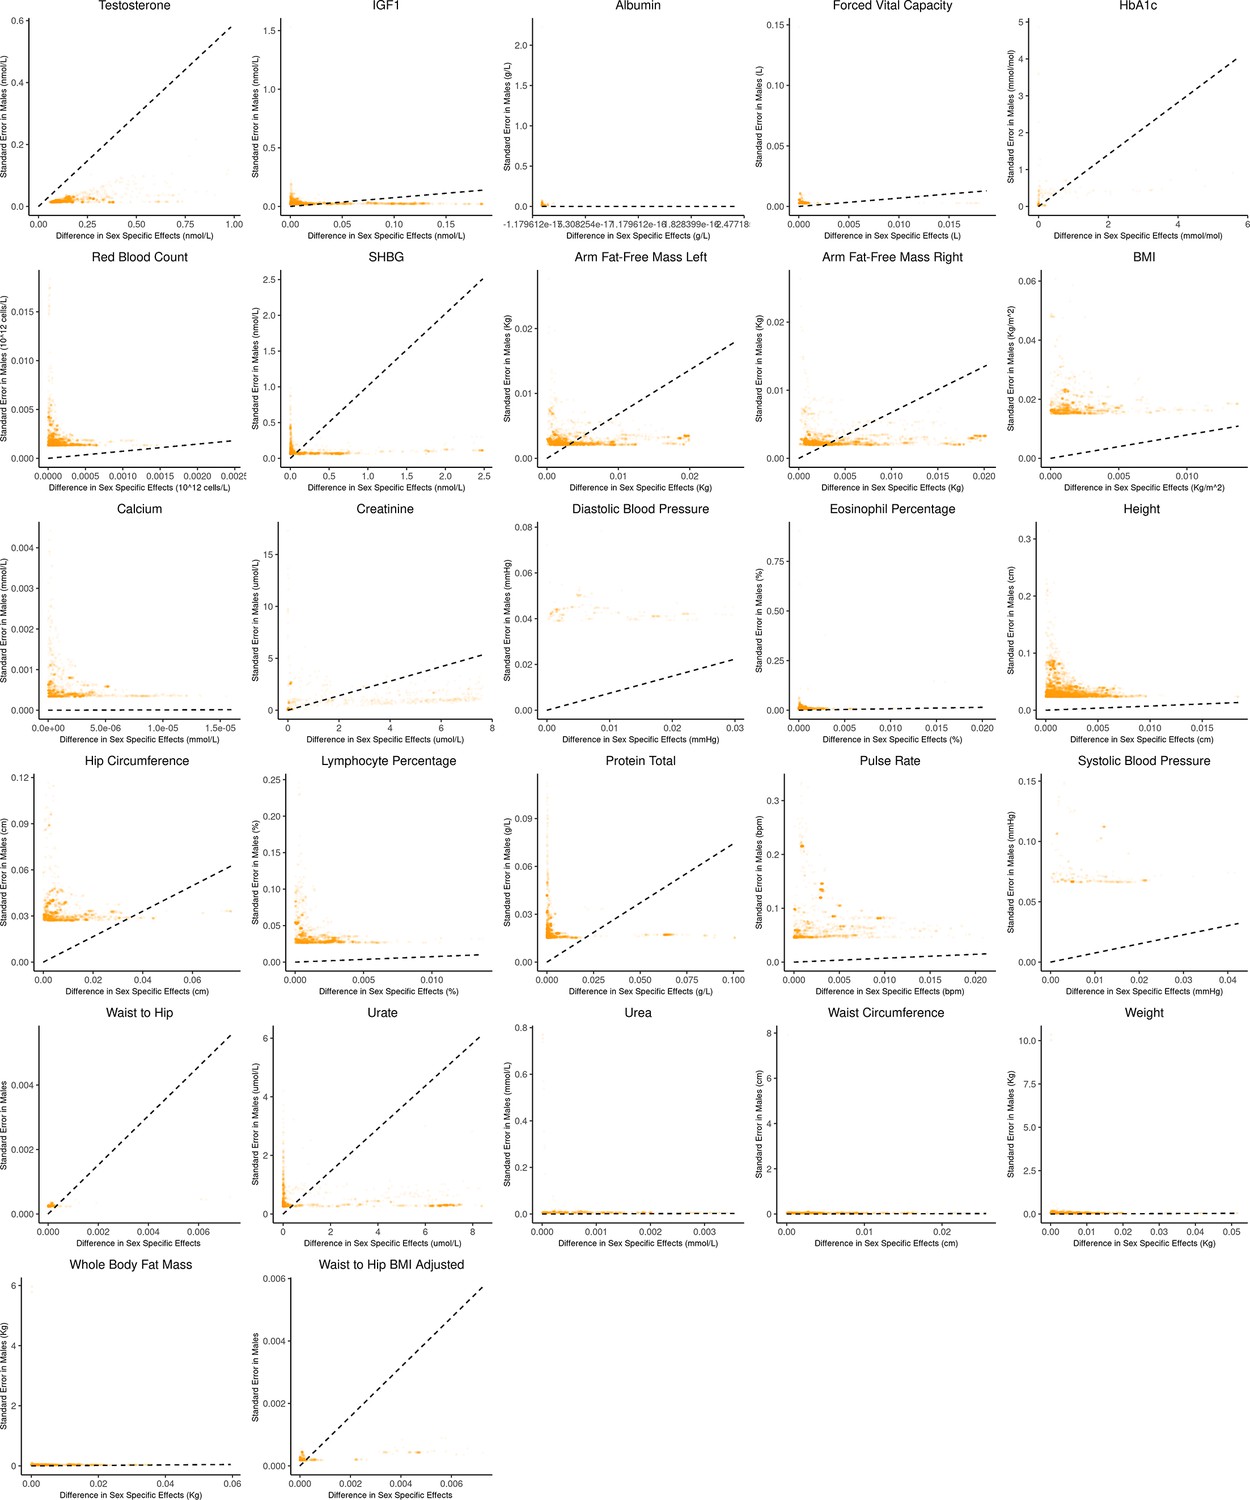
Bias-variance trade-off at genome-wide significant variants (p-value in males) in a sex-stratified genome-wide association studies (GWAS).
This figure extends Figure 3B of the main text to all physiological traits analyzed. The x-axis shows the estimated absolute difference between the effect of variants in males and females. The y-axis shows the measured standard error for each variant in males, the focal context here. The dashed line shows the decision boundary for effect estimation in females. The difference in mean squared error (MSE) between estimation methods increases linearly with distance from the dashed line, as in Figure 2. If a variant falls above (below) the line, the additive (gene-by-environment interaction [GxE]) estimator has a lower MSE.
Appendix 1—figure 4
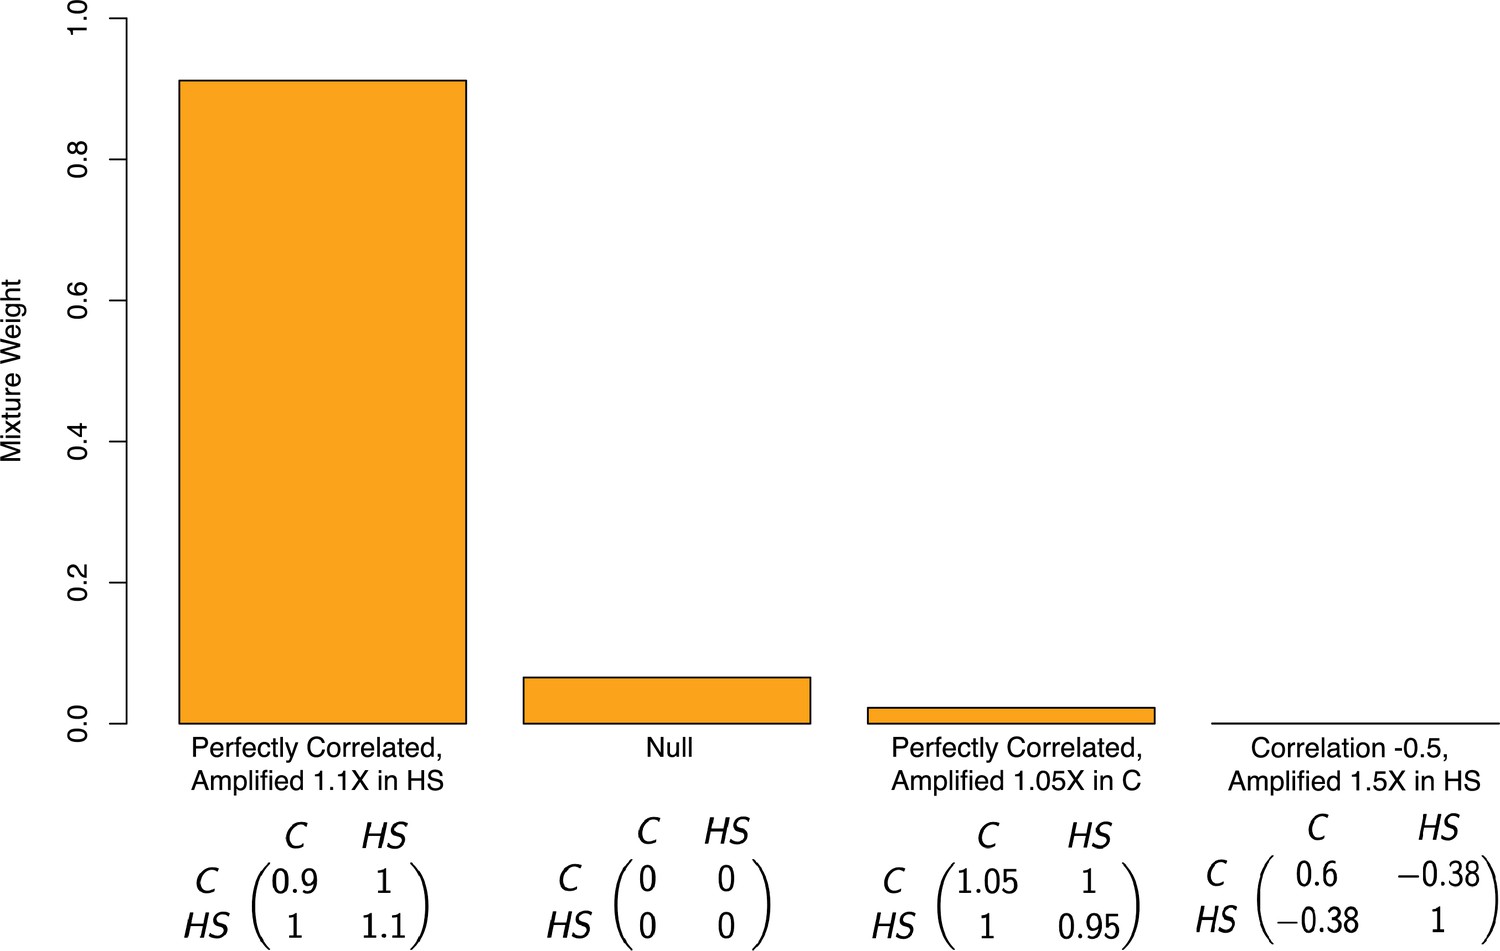
Estimated mixture weights on covariance of true effects in Pallares et al.
The x-axis shows (symmetric) variance-covariance matrices for true effects in the high-sugar and control diets. The variance-covariance matrices displayed are the only matrices to which mash assigned non-zero weight (from a much larger set of possible covariance matrices, following a variable selection procedure). Variance-covariance matrices are scaled by a constant for each of interpretability. Abbreviations: C–control diet; HS–high-sugar diet.
Appendix 1—figure 5
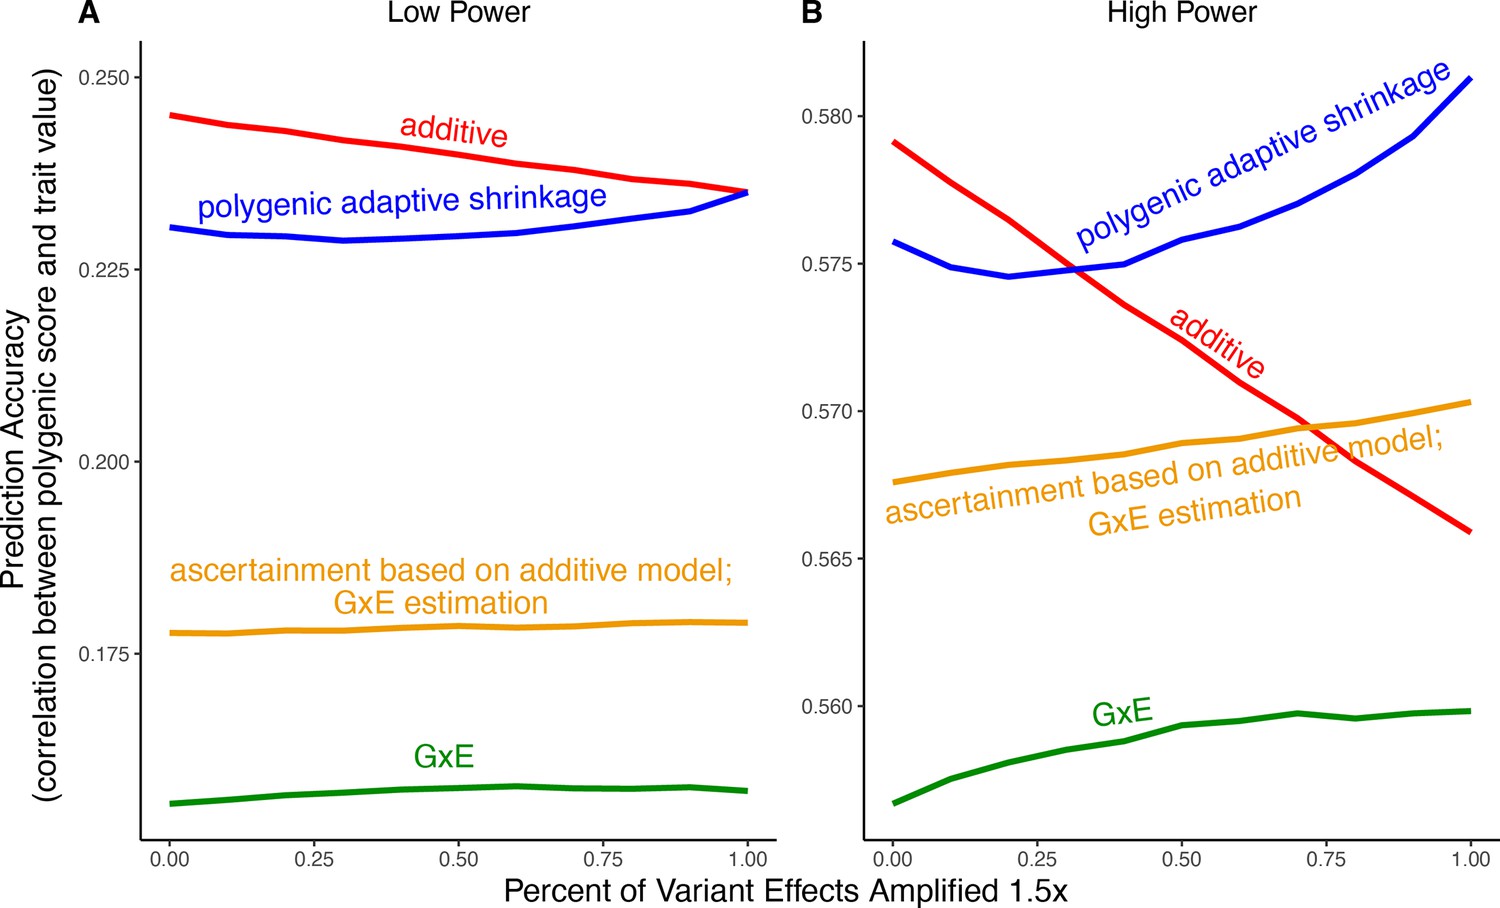
Polygenic score performance for context-aware models with greater amplification than in the main text.
This figure uses the same simulation parameters as Figure 4 of the main text, except that variant effects are amplified instead of . In each simulation, a genome-wide association study (GWAS) is performed on 5000 biallelic variants, half of which have no effect in either context. Of the other half, some percent of the variants (indicated on the x-axis) had effects larger in one of contexts and the remaining SNPs had equal effects in both contexts. The broad sense heritability was set to in all simulations. The y-axis shows the average, over 1000 simulations, of the out-of-sample Pearson correlation between polygenic score and trait value. (A) Results with a GWAS sample size of 1000 individuals. (B) Results with a GWAS size of individuals. We note that unlike in Figure 5, for amplification percentages greater than or equal to 75%, the strategy using ascertainment based on the additive model with gene-by-environment interactions (GxE) effect estimation (orange) outperforms the strategy of using the additive model for both tasks (red).
Appendix 1—figure 6
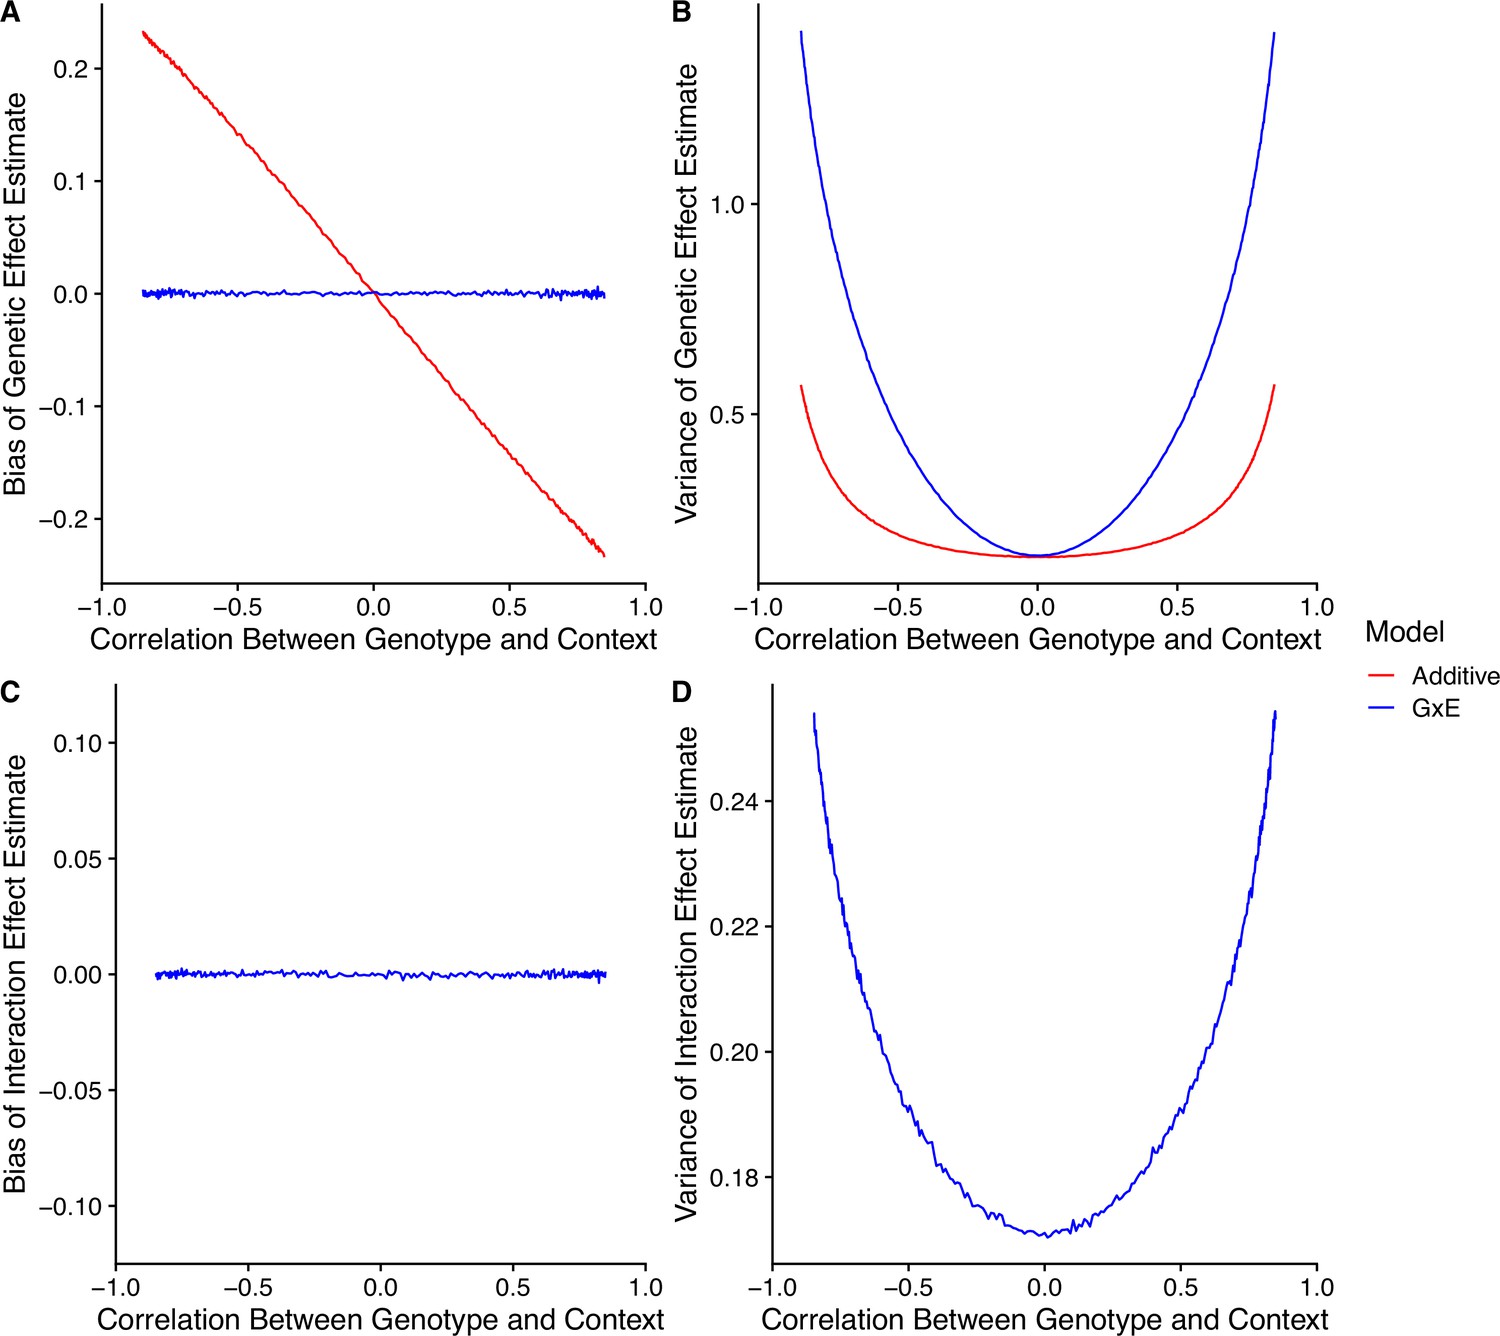
Model performance under correlation between genotype and context.
(A) Bias of genetic effect estimate across different values of correlation. (B) Variance of genetic effect estimate across different values of correlation. (C) Bias of term estimating the interaction between genotype and context in an interaction model. (D) Variance of term estimating the interaction between genotype and context in an interaction model.
Additional files
Download links
A two-part list of links to download the article, or parts of the article, in various formats.
Downloads (link to download the article as PDF)
Open citations (links to open the citations from this article in various online reference manager services)
Cite this article (links to download the citations from this article in formats compatible with various reference manager tools)
Trade-offs in modeling context dependency in complex trait genetics
eLife 13:RP99210.
https://doi.org/10.7554/eLife.99210.3


