TRPγ regulates lipid metabolism through Dh44 neuroendocrine cells
- Department of Bio and Fermentation Convergence Technology, Kookmin University, Republic of Korea
Figures
Figure 1
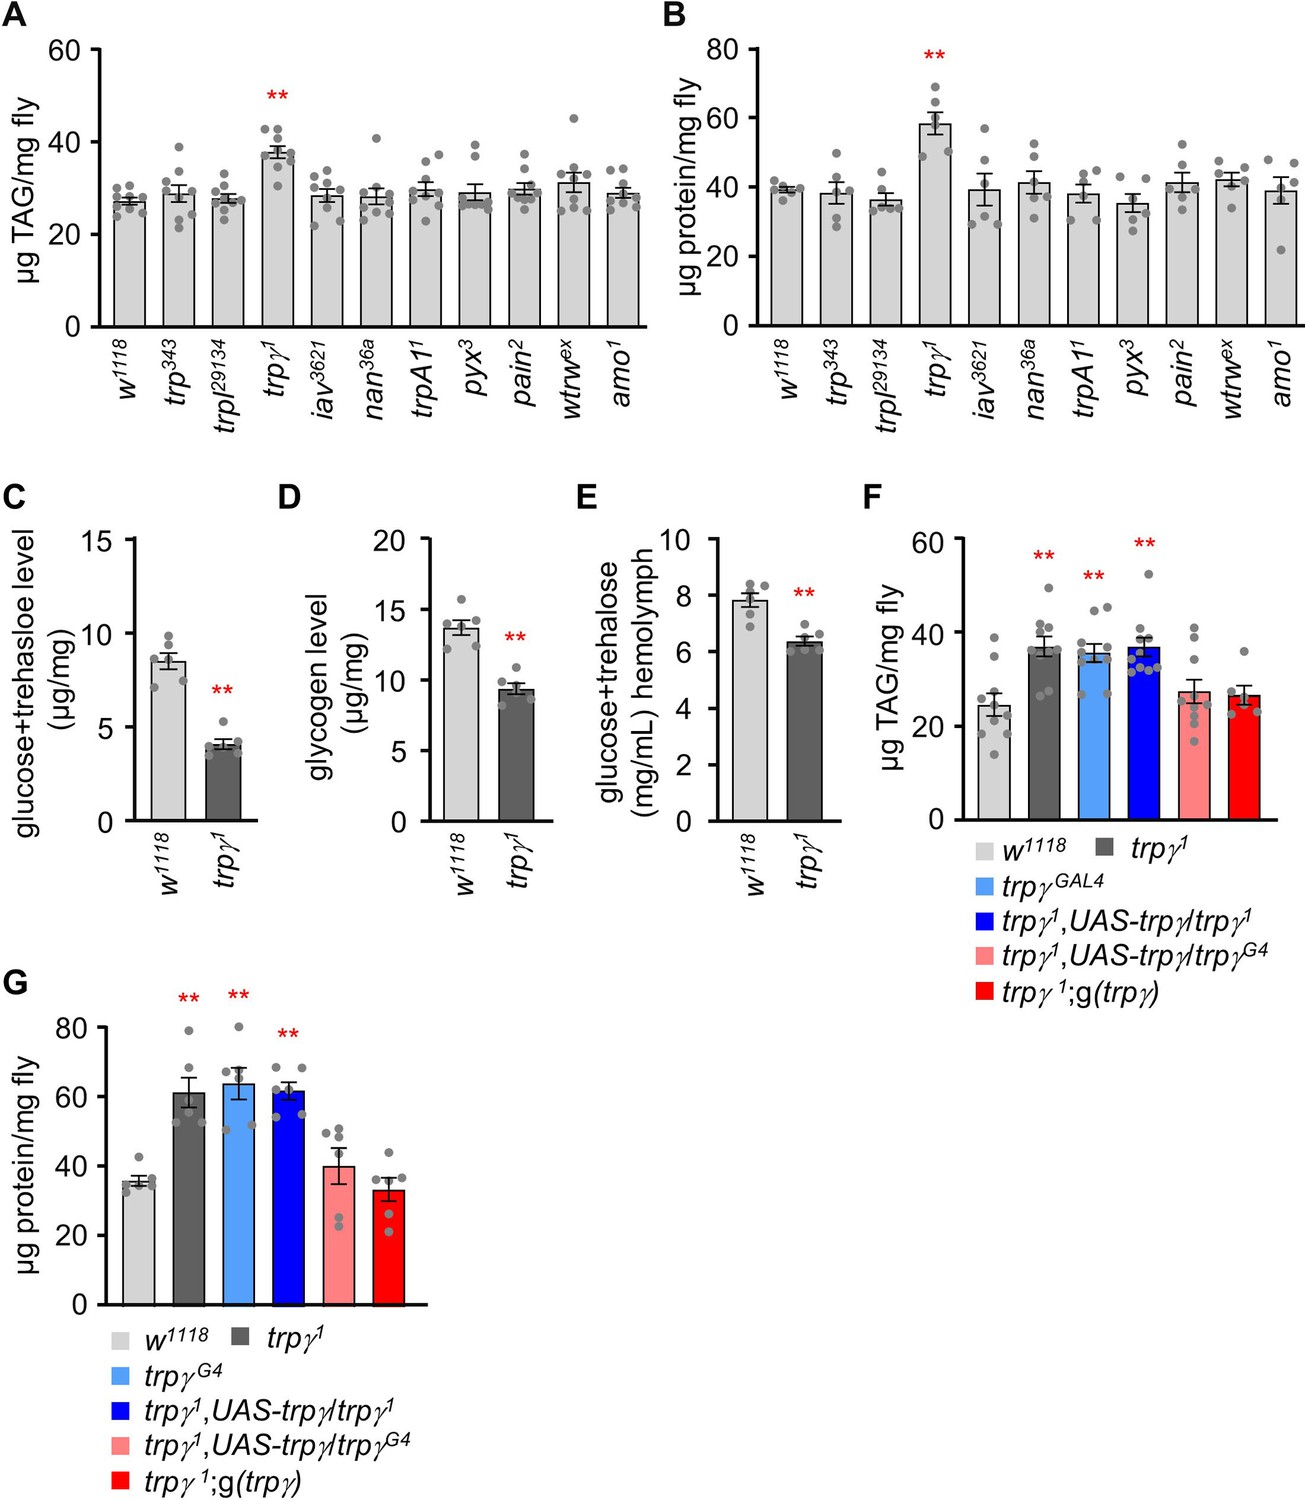
TRPγ mutants exhibit altered carbohydrate, lipid, and protein levels.
(A) Triacylglycerol (TAG) level measurement in the whole-body extract from control (w1118) and transient receptor potential (TRP) channel mutant lines (n=9). (B) Protein level measurement in the whole-body extract from control (w1118) and TRP channel mutant lines (n=6). (C) Measurement of total glucose and trehalose levels (µg/mg) in the whole-body extracts of control (w1118) and trpγ1 adult males (n=6). (D) Measurement of tissue glycogen levels (µg/mg) in adult control (w1118) and trpγ1 males (n=6). (E) Measurement of Hemolymph glucose +trehalose level in the male flies of control (w1118) and trpγ1 (n=6). (F) Measurement of TAG level in adult males to test for rescue of the TAG defect in trpγ flies with the UAS-trpγ and the trpγG4 or with the trpγ genomic transgene (n=6–10). (G) Rescue experiments showing the measurement of protein levels in adult flies with the indicated genotypes (n=6). Comparisons between multiple experimental groups were conducted via single-factor ANOVA coupled with Scheffe’s post hoc test. The asterisks indicate significant differences from the controls (**p<0.01).
Figure 2 with 1 supplement
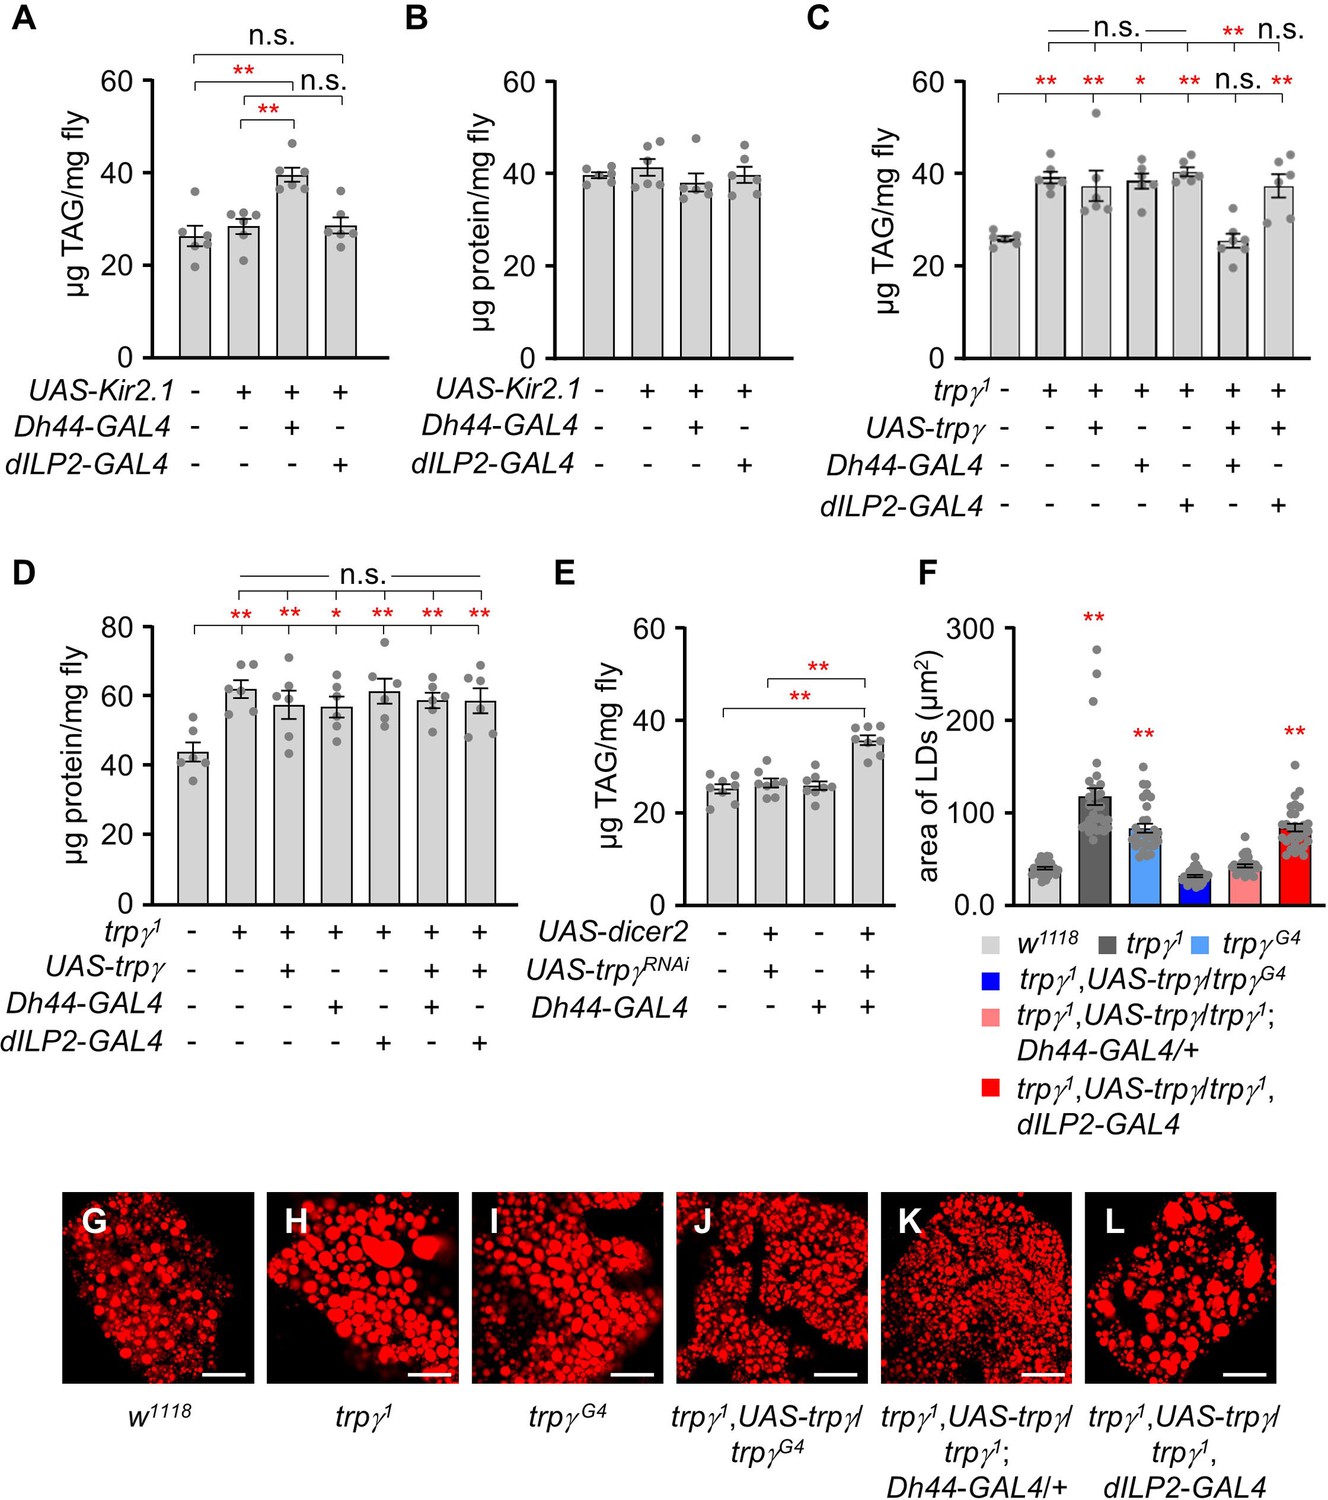
Dh44 neurons are essential for regulating lipid tissue levels.
(A) Tissue triacylglycerol (TAG) level measurement in whole-body extracts of adult male flies after silencing of Dh44-GAL4 and dILP2-GAL4 with UAS-Kir2.1 (n=6). (B) Measurement of tissue protein level in whole-body extracts of adult male flies. Brain-specific Dh44-GAL4 and dILP2-GAL4 neurons were ablated using UAS-Kir2.1 (n=6). (C) Measurement of TAG from whole-body extract of adult male flies in the indicated genotypes (n=6–7). (D) Measurement of tissue protein level from the whole-body extracts of adult males (n=6). (E) TAG levels in whole-body extracts after RNAi knockdown of trpγ mutants under control of the Dh44-GAL4 (n=6). (F) Measurement of area (µm2) of LDs in adult fat body across the indicated genotypes involved the selection of the 30 largest lipid droplets (LDs), choosing the top 10 LDs from each sample for analysis (n=3). (G-L) Nile red stating of fat body from the male of indicated genotypes. Scale bars represent 50 µm. All values are reported as means ± SEM. Comparisons between multiple experimental groups were conducted via single-factor ANOVA coupled with Scheffe’s post hoc test. The asterisks indicate significant differences from the controls (*p<0.05, **p<0.01). Each dot indicates the distribution of individual sample values. (+) and (-) indicate the presence or absence of the indicated transgenes, respectively.
Figure 2—figure supplement 1
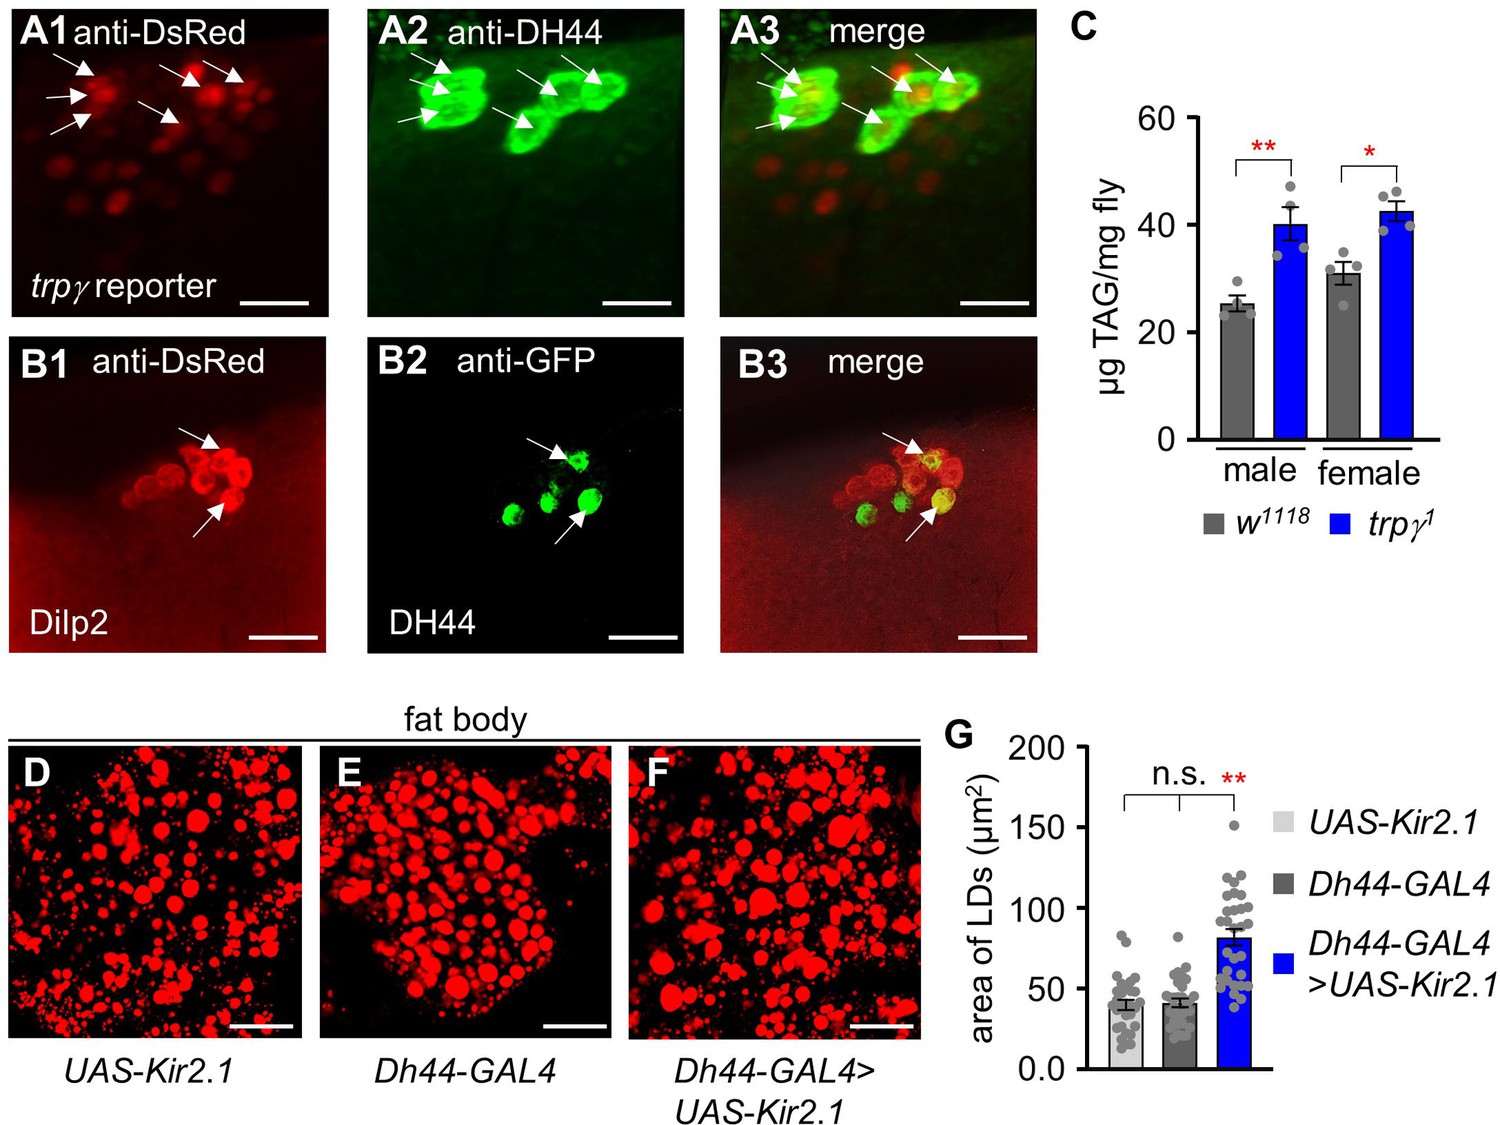
Expression of trpγ, Dh44 and dilp2 in the brain of Drosophila.
(A1-A3) Immunohistochemistry of brain tissue in adult flies. (A1), anti-DsRed staining of trpγ reporter (UAS-dsred;trpγ G4). (A2), anti-DH44 staining of Dh44 cells in the brain. (A3), merged expression of A1 and A2. (B1-B3) Immunohistochemistry of brain tissues (UAS-mCD8::GFP/+;dilp2-mcherry/Dh44-GAL4).(B1), Anti-DsRed staining of dilp2 reporter. (B2), anti-GFP staining of Dh44 cells. (B3), merged expression of B1 and B2. Arrows indicate the co-expression of dilp2 and DH44 in two neurons. (C) Total triacylglycerol (TAG) levels in the whole-body extracts obtained from males and females, separately (n=4). (D-F) Fat body stains with Nile red. (D) is from the fat body of UAS-Kir2.1, (E) is from Dh44-GAL4 flies, and (F) is from flies with Dh44 neurons ablated with UAS-Kir2.1. Scale bars represent 50 µm. (G) Measurement of area of lipid droplets (LDs) in UAS-Kir2.1, Dh44-GAL4, and Dh44-GAL4>UAS- Kir2.1, respectively (n=3). Means ± SEMs. Single factor ANOVA with Scheffe’s analysis was used as a post hoc test to compare multiple sets of data. The asterisks indicate significance from control (*p<0.05, **p<0.01). Each dot indicates distribution of individual sample values.
Figure 3 with 1 supplement
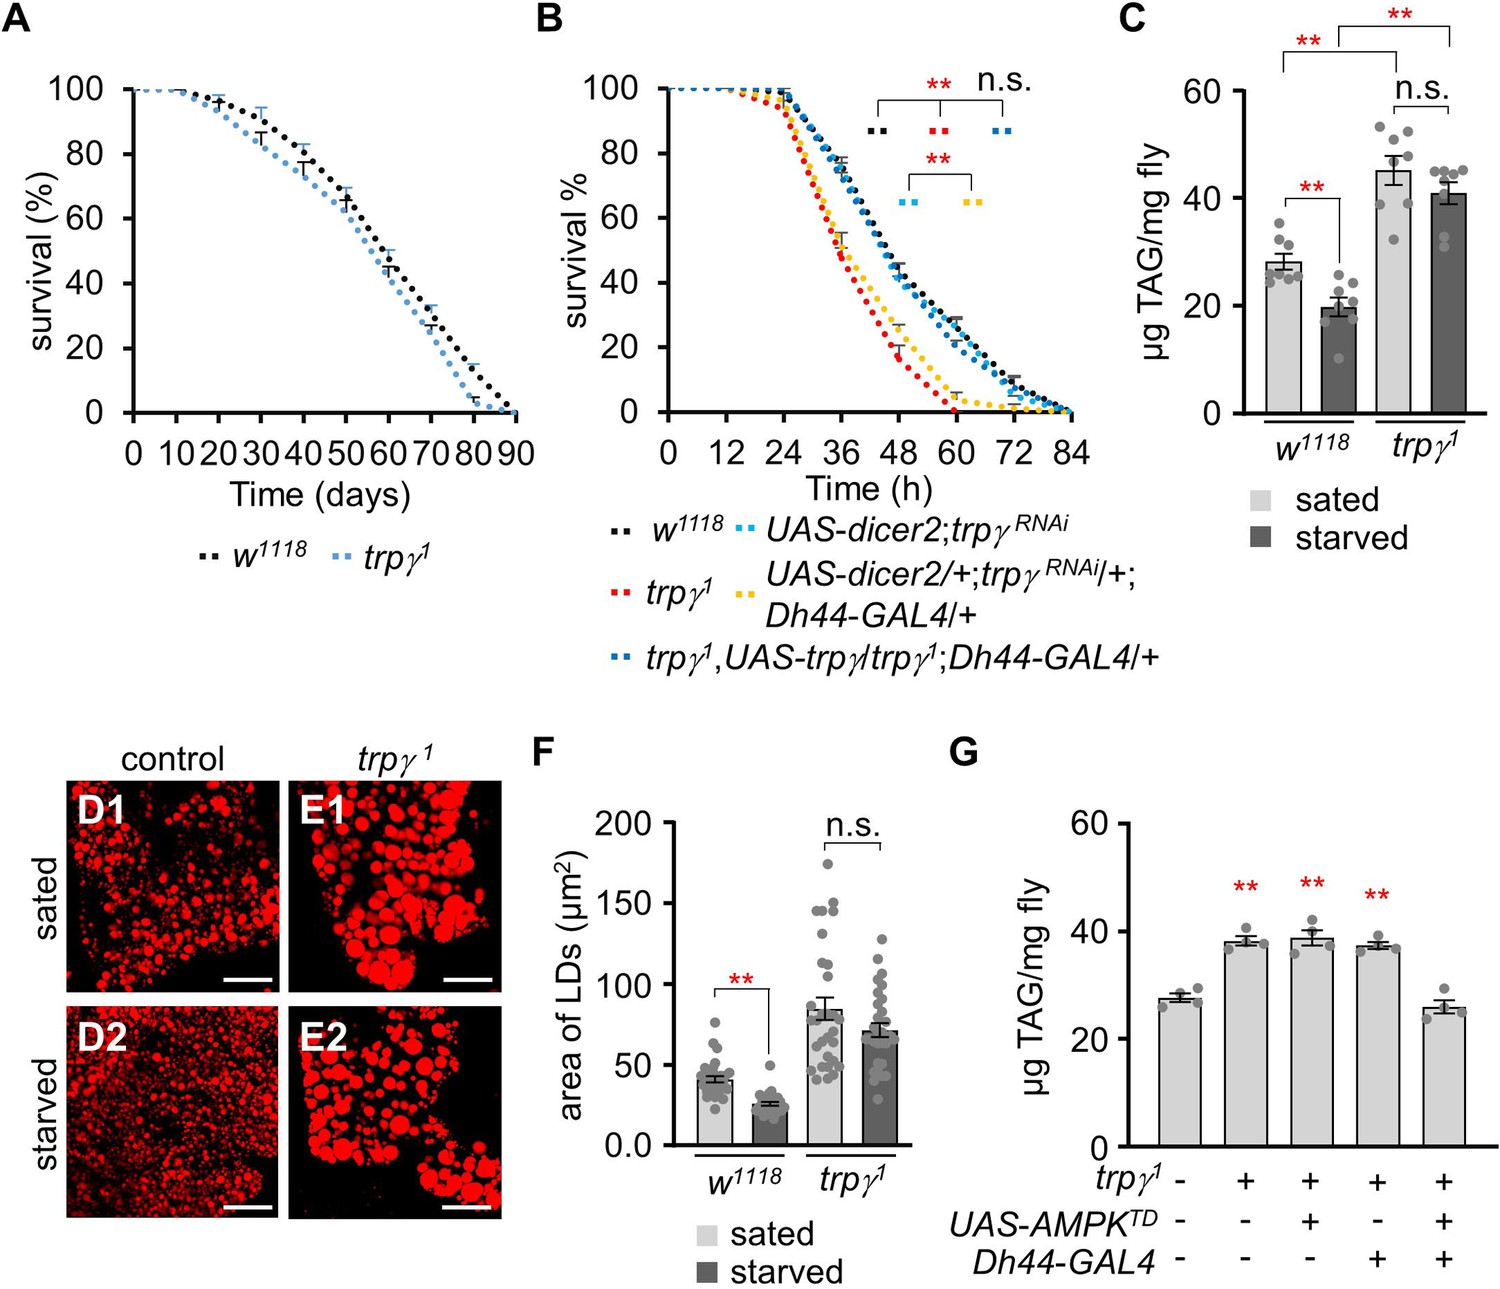
trpγ1 have deficits in the lipolytic pathway under starvation conditions.
(A) Survival assay to measure the total survival time (days) of control (w1118) and trpγ1 male flies fed with a normal corn meal diet (n=7–8). (B) Survival assay to measure the survival time (h) of the indicated genotypes with male flies under starvation conditions (n=4). (C) TAG level measurement in control (w1118) and trpγ1 adult male flies in both sated (0 hr starvation) and starved (24 hr starvation) conditions (n=8). (D, E) Nile red staining of the lipid droplets (LDs) extracted from FB of (D) w1118 and (E) trpγ1 flies under sated (D1, E1) and starved (D2, E2) conditions, respectively. Scale bars represent 50 µm. (F) Measurement of area (µm2) of the LDs extracted from the FBs of w1118 and trpγ1 flies under sated (0 hr starvation) and starved (24 hr starvation) conditions (n=3). (G) Measurement of triacylglycerol (TAG) level with controls and the flies after expressing UAS-AMPKTD under the control of Dh44-GAL4 in the trpγ1 mutant background (n=4). All values are reported as means ± SEM. Survival curves in A and B were estimated for each group, using a Kaplan-Meier method and compared statistically using the log-rank tests. Comparisons between multiple experimental groups in C, F, G, and H were conducted via single-factor ANOVA coupled with Scheffe’s post hoc test. The asterisks indicate significant differences from the controls (**p<0.01).
Figure 3—figure supplement 1
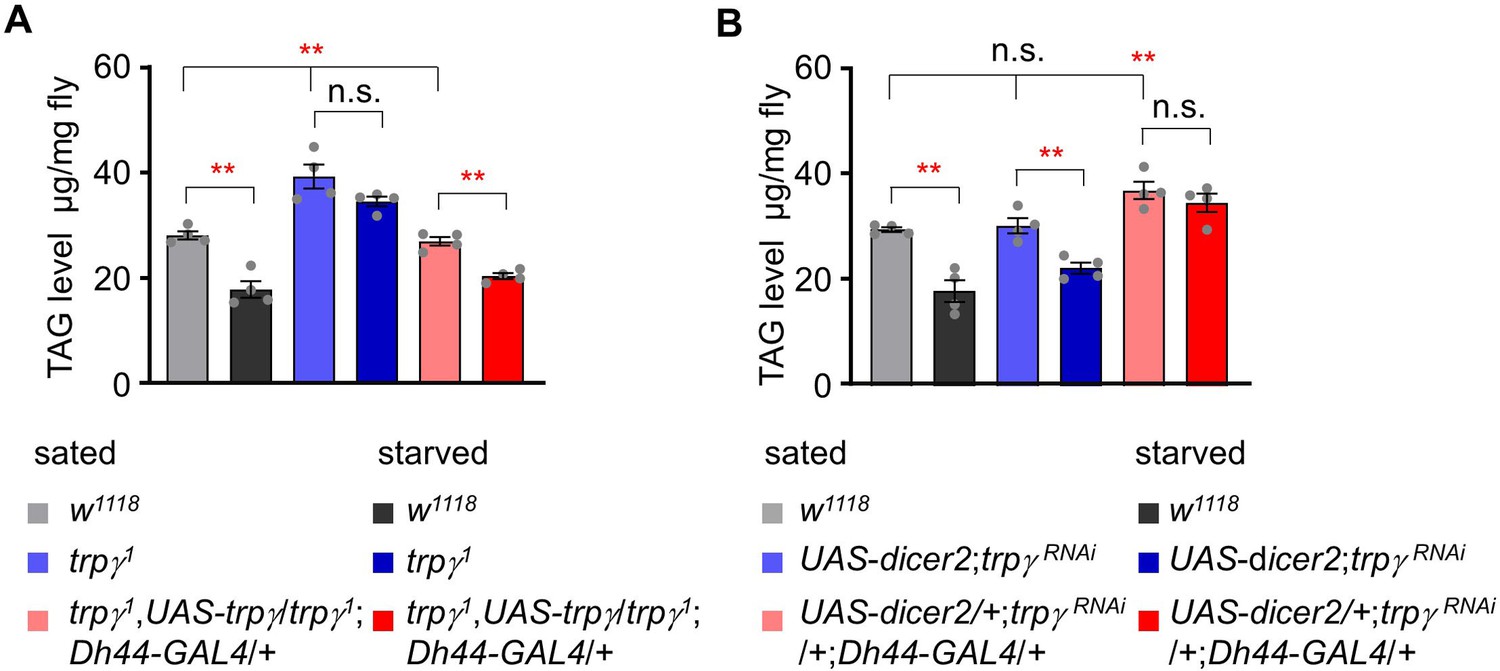
Measurement of triacylglycerol (TAG) levels after overexpressing UAS-trpγ and knock-down of trpγRNAi in Dh44 neurons.
(A) Measurement of total TAG levels in w1118, trpγ 1, and Dh44-GAL4/UAS-trpγ under sated and starved conditions (n=4). (B) Measurement of total TAG level in w1118, UAS-dicer2;trpγ RNAi, and UAS-dicer2/+; trpγ RNAi/+;Dh44-GAL4/+under sated and starved conditions (n=4). Means ± SEMs. Single factor ANOVA with Scheffe’s analysis was used as a post hoc test to compare multiple sets of data. The asterisks indicate significance from control (**p<0.01). Each dot indicates distribution of individual sample values.
Figure 4
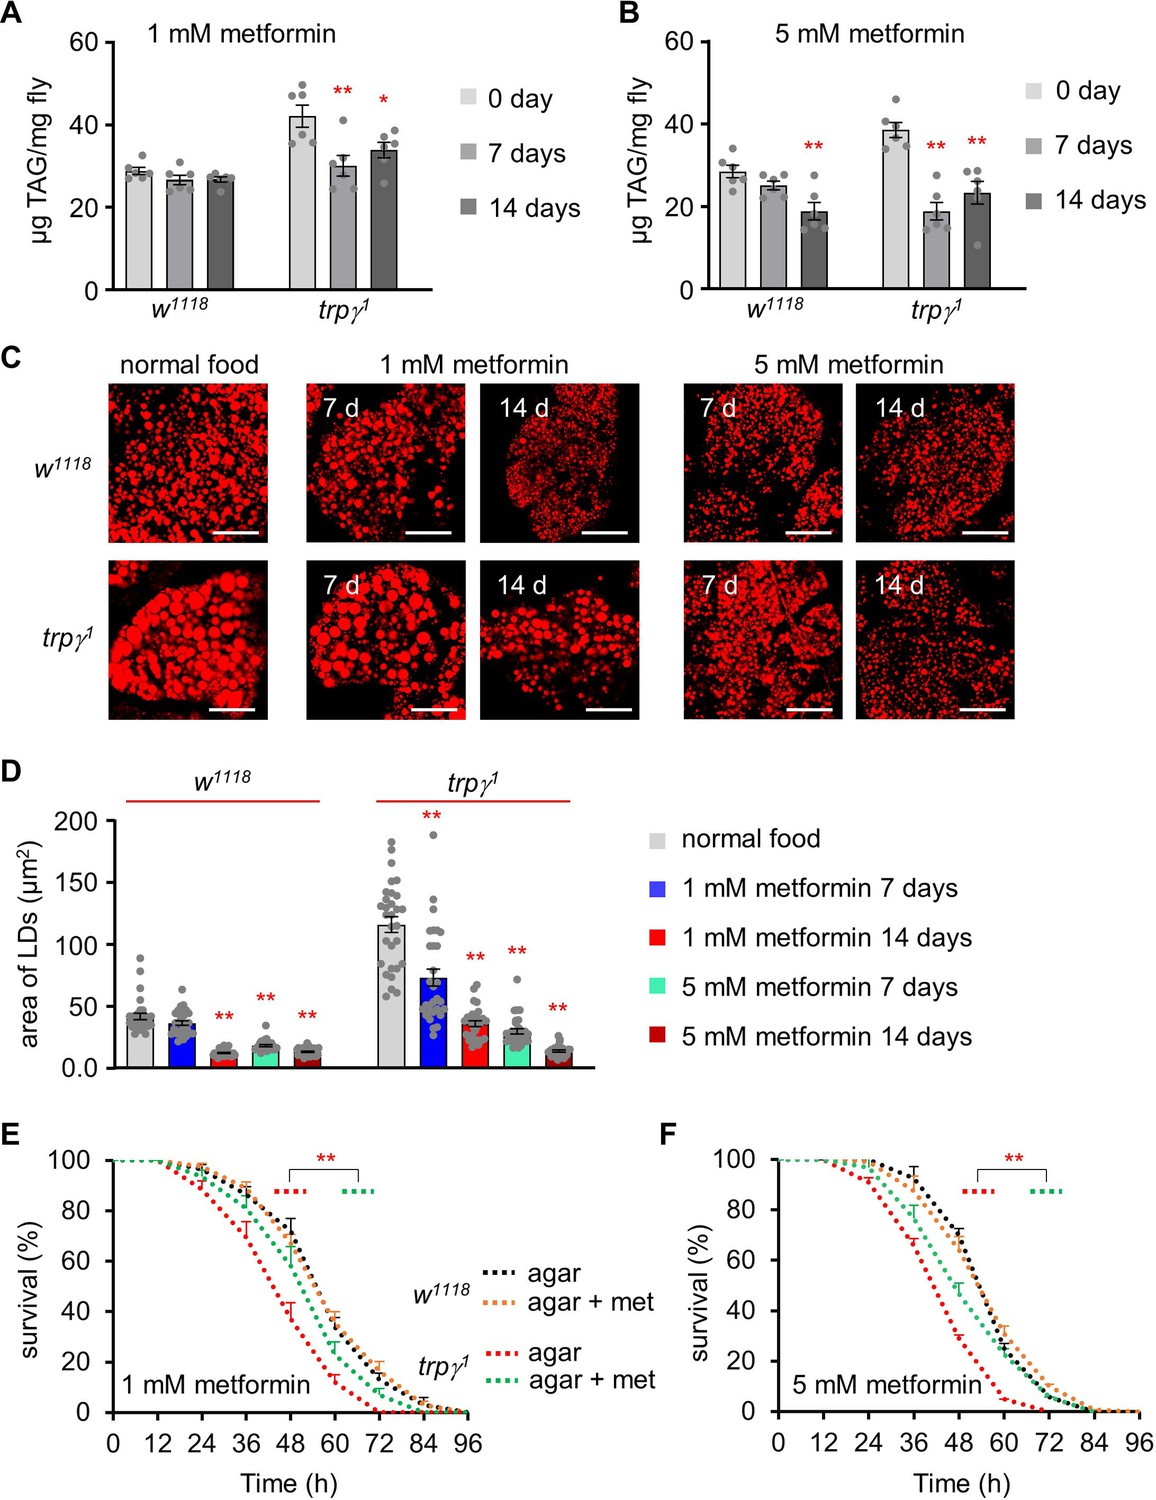
Rescue of starvation susceptibility phenotype using the lipolytic drug metformin.
(A) Triacylglycerol (TAG) level measurement at 0, 7, and 14 d in the control (w1118) and trpγ1 adult male flies after dietary exposure to 1 mM metformin (n=6). (B) TAG measurement at 0, 7, and 14 d in w1118 and trpγ1 adult male flies after dietary exposure to 5 mM metformin (n=6). (C) Pictures of Nile red staining of lipid droplets (LDs) after dietary exposure to 1 mM and 5 mM metformin in standard fly food for 7 and 14 d in w1118 and trpγ1 flies. Scale bars represent 50 µm. (D) Measurement of area (µm2) of LDs extracted from the FB of w1118 and trpγ1 flies after dietary exposure to 1 mM and 5 mM metformin in standard fly food for 7 and 14 d (n=3). (E) Survival assay to measure the survival time (h) of control (w1118) and trpγ1 males after dietary exposure to 1 mM metformin in 1% agar food (n=6–10). (F) Starvation survival assay of control (w1118) and trpγ1 males after dietary exposure to 5 mM metformin in 1% agar food (n=6). All values are reported as means ± SEM. Comparisons between multiple experimental groups were conducted via single-factor ANOVA coupled with Scheffe’s post hoc test. Each dot indicates the distribution of individual sample values. Survival curves in E and F were estimated for each group, using a Kaplan-Meier method and compared statistically using the log-rank tests. The asterisks indicate significant differences from the controls (*p<0.05, **p<0.01).
Figure 5 with 1 supplement

Quantitative analysis of the expression of gluconeogenic, lipogenic, and lipolytic genes and the effect of bmm expression and metformin feeding.
(A) qRT-PCR analysis to measure the expression of gluconeogenic genes (fbp, pepck1), lipogenic genes (acc, desat1), and a lipolytic gene (bmm) under sated (0 hr starvation) and starved (24 hr starvation) conditions in w1118 and trpγ1 flies. The relative fold change in the expression of starvation-induced genes (gluconeogenic genes: fbp and pepck1; lipogenic genes: acc and desat1; and lipolytic gene: bmm) was determined in whole-body samples of male adult w1118 and trpγ1 flies by qRT-PCR. Tubulin was used as an internal control to standardize the samples. Each graph shows the number of evaluated samples (n=3). (B) Fluorescence microscopic imaging of bmm::GFP expression in the FBs of w1118 and trpγ1 under sated (0 hr starvation) and starvation (24 hr starvation) conditions. Scale bars represent 50 µm. (C) Quantification of intensity level of bmm::GFP in the FBs of w1118 and trpγ1 under sated and starvation conditions (n=3). (D-I) Nile red staining of lipids in the FB of flies with the indicated genotypes. Scale bars represent 50 µm. (J) Measurement of area of lipid droplets (LDs) from samples D–I entailed selecting a total of 30 LDs, with the 10 largest LDs chosen from each sample for analysis (n=3). (K) qRT-PCR analysis to measure the expression of acc, desat1, and bmm from the whole body samples of flies after feeding 5 mM metformin for 1 d (n=3). All values are reported as means ± SEM. Comparisons between multiple experimental groups were conducted via single-factor ANOVA coupled with Scheffe’s post hoc test. The asterisks indicate significant differences from the controls (*p<0.05, **p<0.01).
Figure 5—figure supplement 1
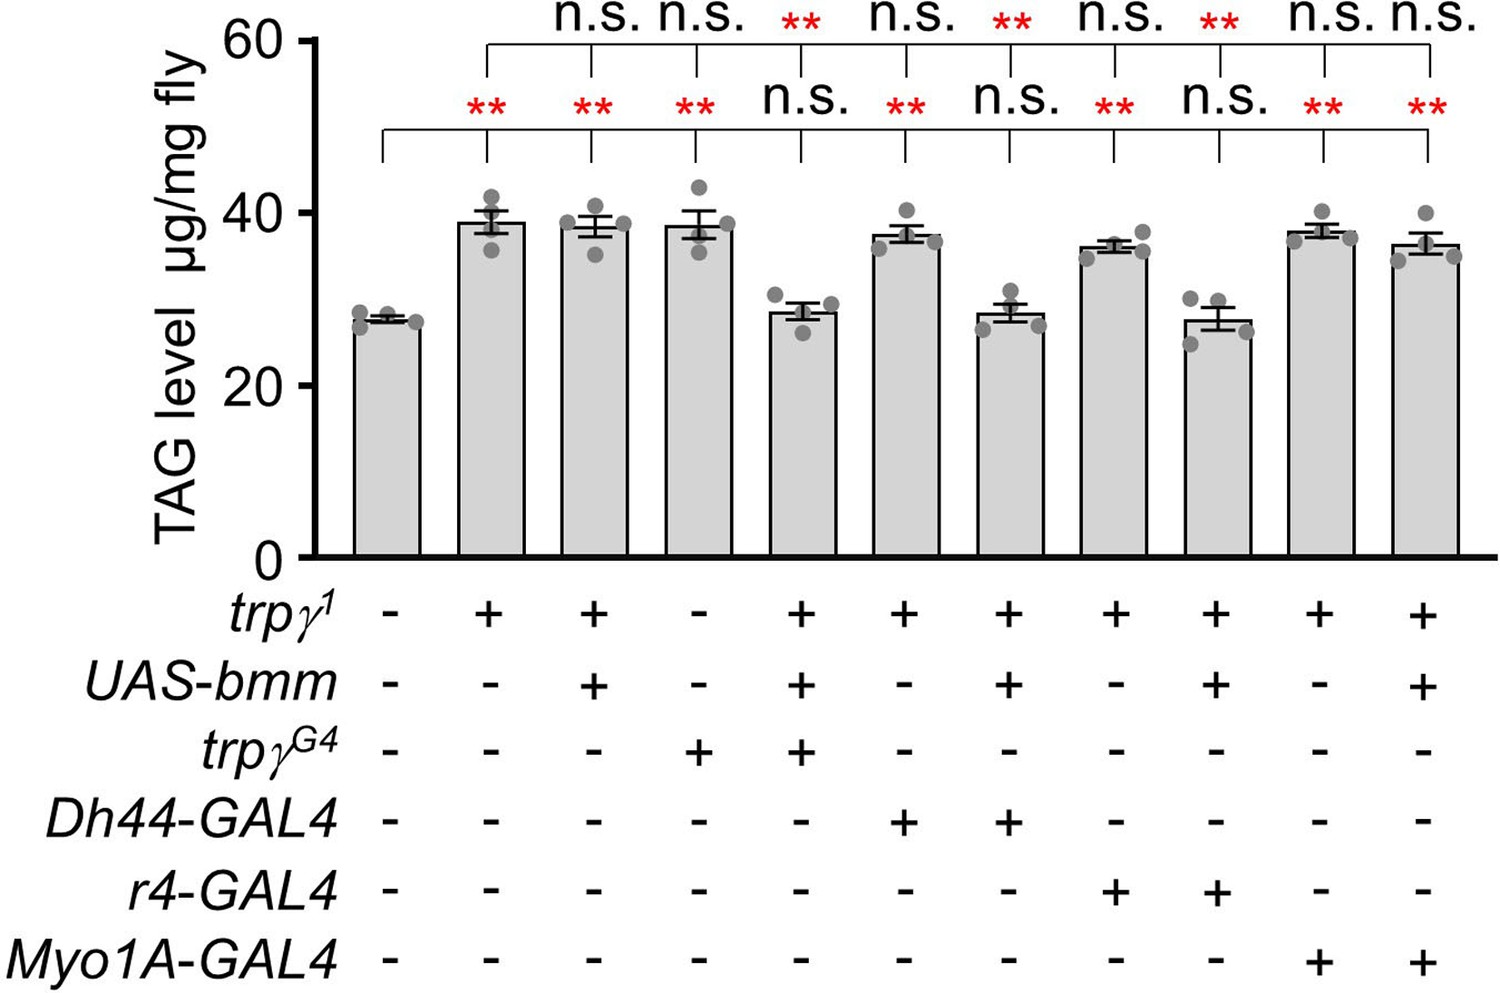
Measurement of triacylglycerol (TAG) levels after expressing UAS-bmm in trpγG4, Dh44-GAl4, r4-GAL4, and Myo1A-GAL4 (n=4).
Means ± SEMs. Single factor ANOVA with Student t-test was used as a post hoc test to compare data. The asterisks indicate significance from the controls (**p<0.01).
Figure 6 with 1 supplement
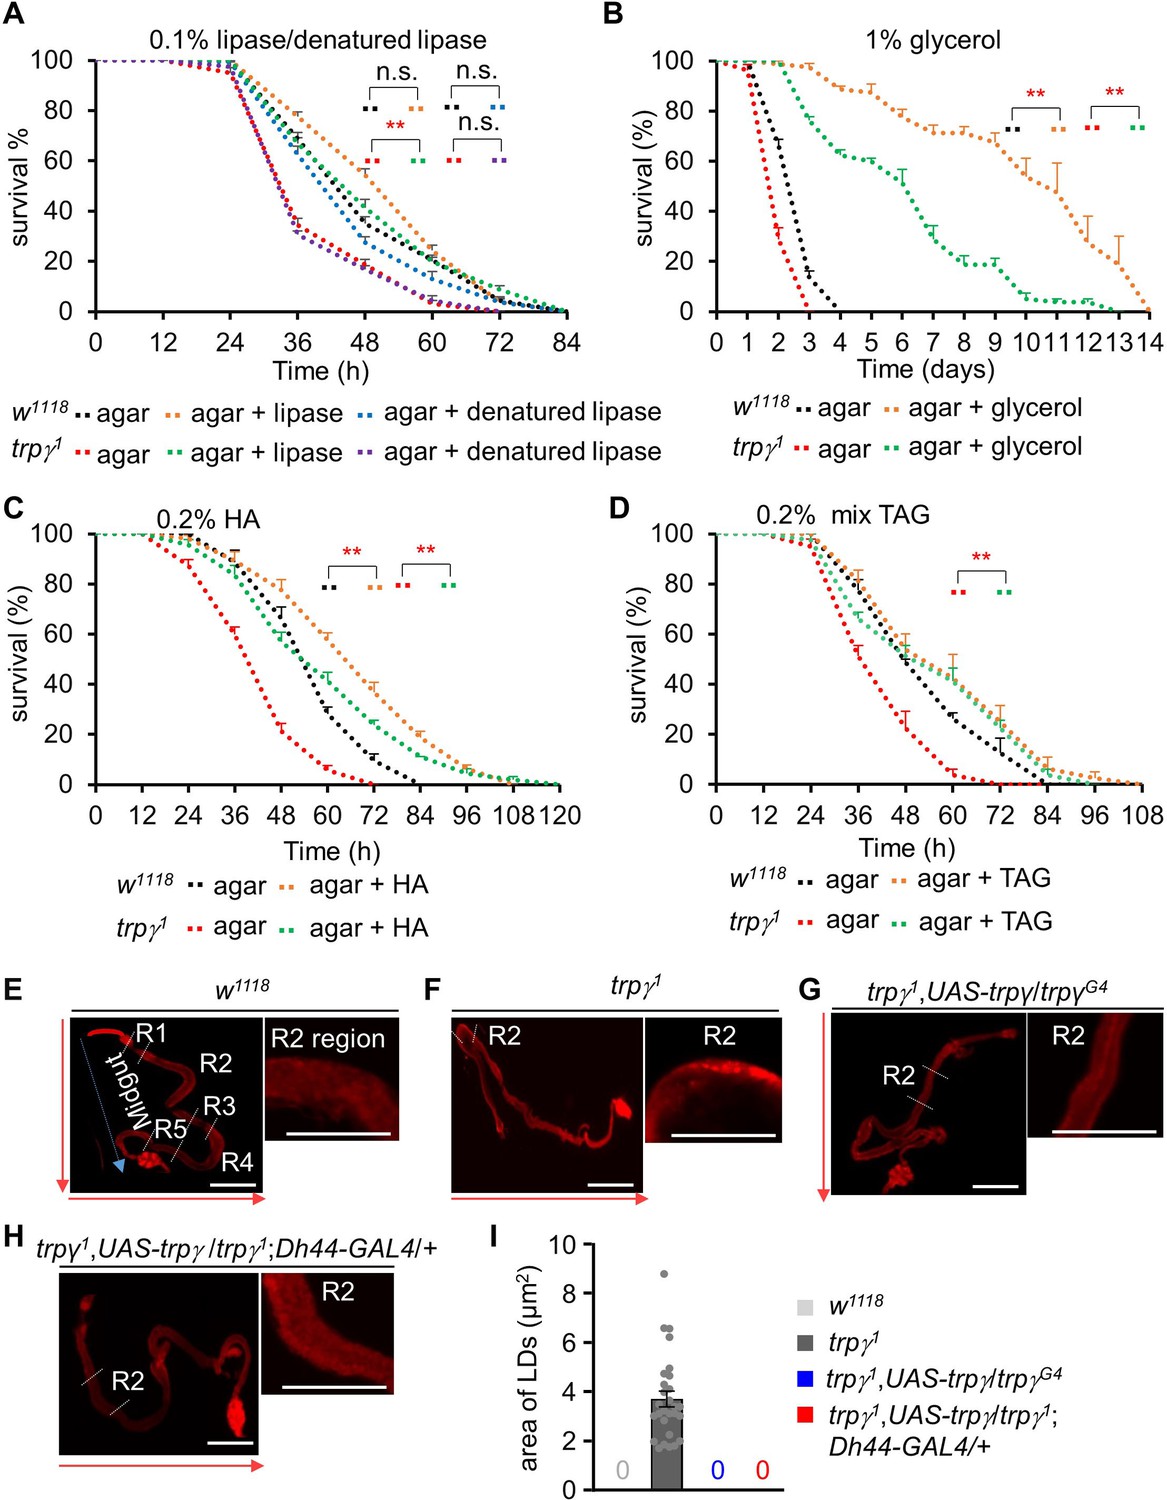
Dietary supply of lipase, glycerol, mixed triacylglycerol (TAG), and free FA to rescue the starvation sensitivity phenotype.
(A) Survival assays of w1118 and trpγ1 flies under starvation condition by feeding 0.1% lipase or 0.1% denatured lipase mixed into 1% agar food (n=8). (B) Starvation survival assay to measure the survival time (h) of w1118 and trpγ1 male flies after feeding 1% glycerol mixed into 1% agar food (n=4). (C) Survival assay to measure the survival time (h) of w1118 and trpγ1 flies after feeding 0.2% hexanoic acid (HA) supplemented into 1% agar food (n=8). (D) Survival assay to measure the survival time (hr) of w1118 and trpγ1 flies after feeding 0.2% mixed (mono-, di-, and tri-) glycerides (n=4). (E-I) Nile red staining of LDs in full gut and the magnified R2 region of adult male flies. (E) w1118, (F) trpγ1, (G) trpγ1,UAS-trpγ/trpγG4, (H) trpγ1,UAS-trpγ/trpγ1;Dh44-GAL4/+. Scale bars represent 50 µm. The arrow indicates the orientation of intestine from anterior to posterior. (I) Measurement of area of lipid droplets (LDs) in the R2 region of trpγ1, area of 28 LDs from 10 samples (n=10). Note that control and rescued flies have no LD. All values are reported as means ± SEM. Survival curves were estimated for each group, using a Kaplan-Meier method and compared statistically using the log-rank tests. (**p<0.01).
Figure 6—figure supplement 1

Measurement of lipase effect in lipid droplets (LDs) and starvation survival assay after feeding hexanoic acid or mixed triacylglycerol (TAG).
(A-D) Nile red staining of full gut of w1118 and trpγ1 under normal and lipase-fed conditions. (A, B) Full gut of w1118 under 1% agar fed and 1% agar with 0.1% lipase fed, respectively. (C, D) Full gut of trpγ1 under 1% agar fed and 1% agar with 0.1% lipase fed, respectively. Scale bars represent 50 μm. Red arrows indicate the orientation of intestine from anterior to posterior. Blue arrow indicates accumulated LDs. (E) Measurement of area of LDs in gut of w1118 and trpγ1 after feeding 1% agar or 1% agar with 0.1% lipase (n=3). (F) Survival assays to measure the survival time (h) of control (w1118) and trpγ1 flies after feeding 0.5% hexanoic acid in 1% agarose food (n=4). (G) Survival assays of w1118 and trpγ1 flies after feeding 0.5% triglyceride mix (mixture of mono-, di-, tri-) in 1% agar food (n=4). Means ± SEMs. Single factor ANOVA with Student t-test was used as a post hoc test to compare data for E. Survival curves were estimated for each group, using a Kaplan-Meier method and compared statistically using the log-rank tests for F and G. The asterisks indicate significance from the controls (**p<0.01).
Figure 7 with 1 supplement
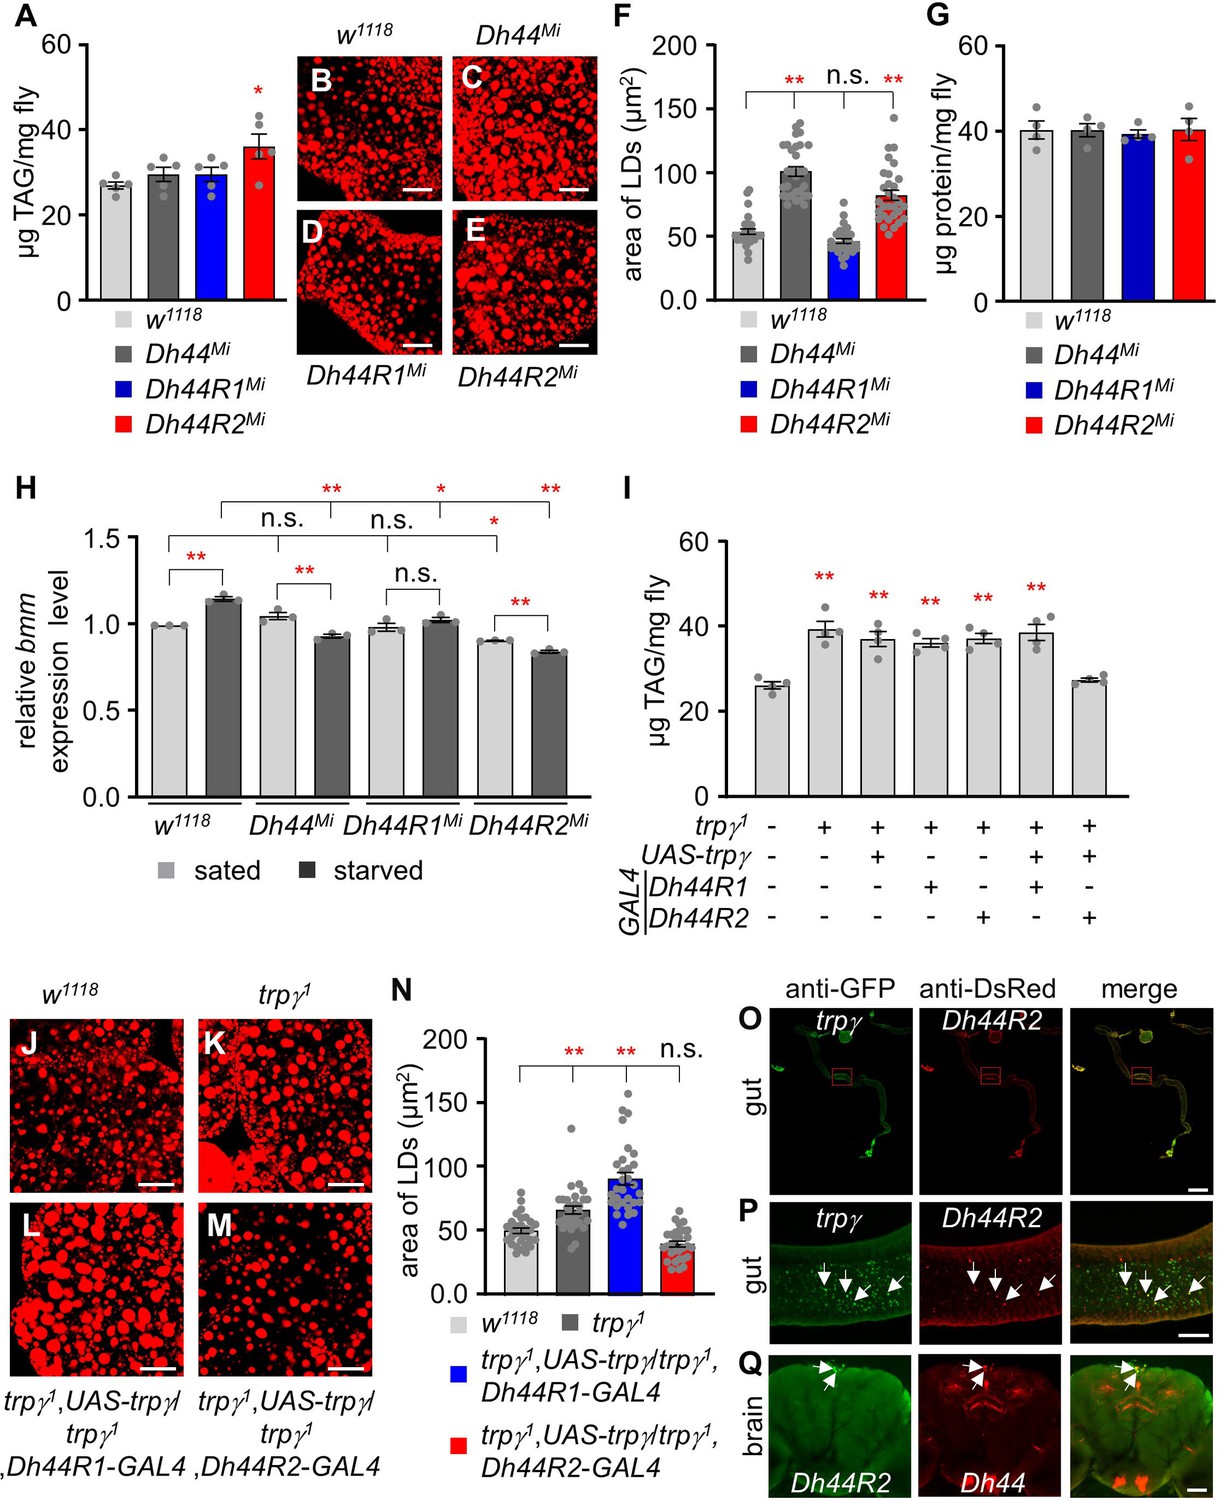
Functional analysis of Dh44, Dh44R1, and Dh44R2 mutants and their roles in lipid accumulation.
(A) Total triacylglycerol (TAG) level (µg TAG/mg fly) measurement in whole body extracts from control (w1118), Dh44Mi, Dh44R1Mi, and Dh44R2Mi mutants (n=5). (B-E) Nile red stains of the fat body from w1118, Dh44Mi, Dh44R1Mi, and Dh44R2Mi, respectively. Scale bars represent 50 µm. (F) Area of lipid droplets (LDs) in each indicated genotype (n=3). (G) The protein (µg protein/mg fly) measurement in the whole-body extracts from control (w1118) and Dh44Mi, Dh44R1Mi, and Dh44R2Mi mutants (n=4). (H) Quantification (qRT-PCR) of lipolytic gene (bmm) expression level in the fat body of w1118, Dh44Mi, Dh44R1Mi, and D44R2Mi flies under sated and starved conditions (n=3). (I) Total TAG level measurement in whole body extracts from the indicated genotypes (n=4). (J-M) Nile red stains of the fat body from (J) w1118, (K) trpγ1 (L) trpγ1,UAS-trpγ1/trpγ1,Dh44R1-GAL4, and (M) trpγ1,UAS-trpγ1/trpγ1,Dh44R2-GAL4. (N) Area of LDs in each indicated genotype (n=3). Scale bars represent 50 µm. (O–Q) Immunohistochemistry with anti-GFP and anti-DsRed. (O, P) Co-expression of trpγ and Dh44R2 (trpγG4/Dh44R2-LexA;UAS-mCD8::GFP/LexAopmCherry) in the R2 region of the intestine. Arrows indicate co-expression of trpγ and Dh44R2 in the gut cell. (O) Full gut image. Scale bar represents 300 µm. (P) Magnified view of boxed R2 region in (O). Scale bar represents 50 µm. (Q) Co-expression of Dh44R2 and Dh44 (Dh44R2-GAL4/Dh44-LexA;UAS-mCD8::GFP/LexAop-mCherry) in the brain. Arrows indicate coexpressed two cells in the PI. Scale bar represents 50 µm. Means ± SEMs. Single-factor ANOVA with Scheffe’s analysis was used as a post hoc test to compare multiple sets of data. The asterisks indicate significance from control (*p<0.05, **p<0.01). Each dot indicates distribution of individual sample value.
Figure 7—figure supplement 1
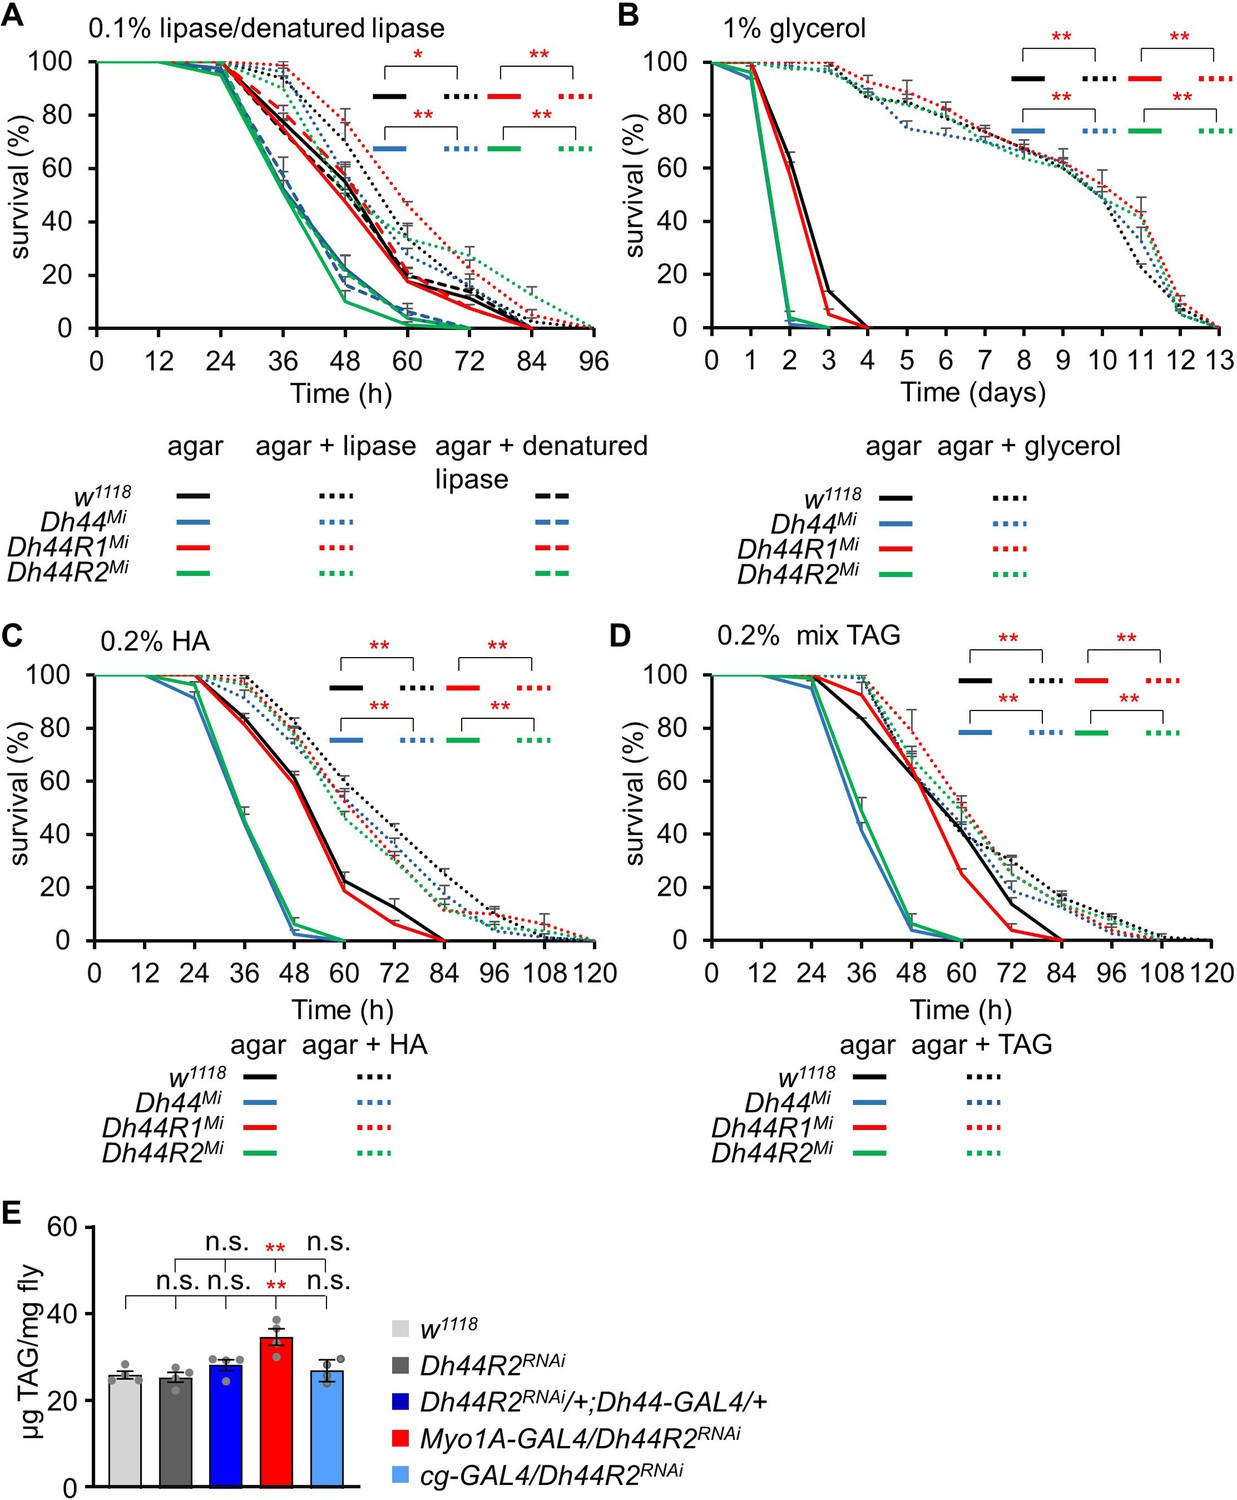
Measurement of starvation survival time with feeding lipase, glycerol, hexanoic acid, and triglyceride mix in 1% agar food.
(A) Survival assay of w1118, Dh44Mi, Dh44R1Mi, and Dh44R2Mi after feeding 0.1% lipase and 0.1% denatured lipase in 1% agar food (n=4). (B) Survival assay of w1118, Dh44Mi, Dh44R1Mi, and Dh44R2Mi after feeding 1% glycerol in 1% agar food (n=4). (C) Survival assay of w1118, Dh44Mi, Dh44R1Mi, and Dh44R2Mi after feeding 0.2% hexanoic acid in 1% agar food (n=4). (D) Survival assay of w1118, Dh44Mi, Dh44R1Mi, and Dh44R2Mi after feeding 0.2% triglyceride mix (mixture of mono-, di-, tri-) in 1% agar food (n=4). (E) Measurement of TAG level after knockdown of Dh44R2RNAi in Dh44-GAL4, Myo1A-GAL4, and cg-GAL4 (n=4). Means ± SEMs. Survival curves were estimated for each group, using a Kaplan-Meier method and compared statistically using the log-rank tests. Single factor ANOVA with Scheffe’s analysis was used as a post hoc test to compare multiple sets of data in (E). The asterisks indicate significance from the controls (*p<0.05, **<0.01).
Figure 8
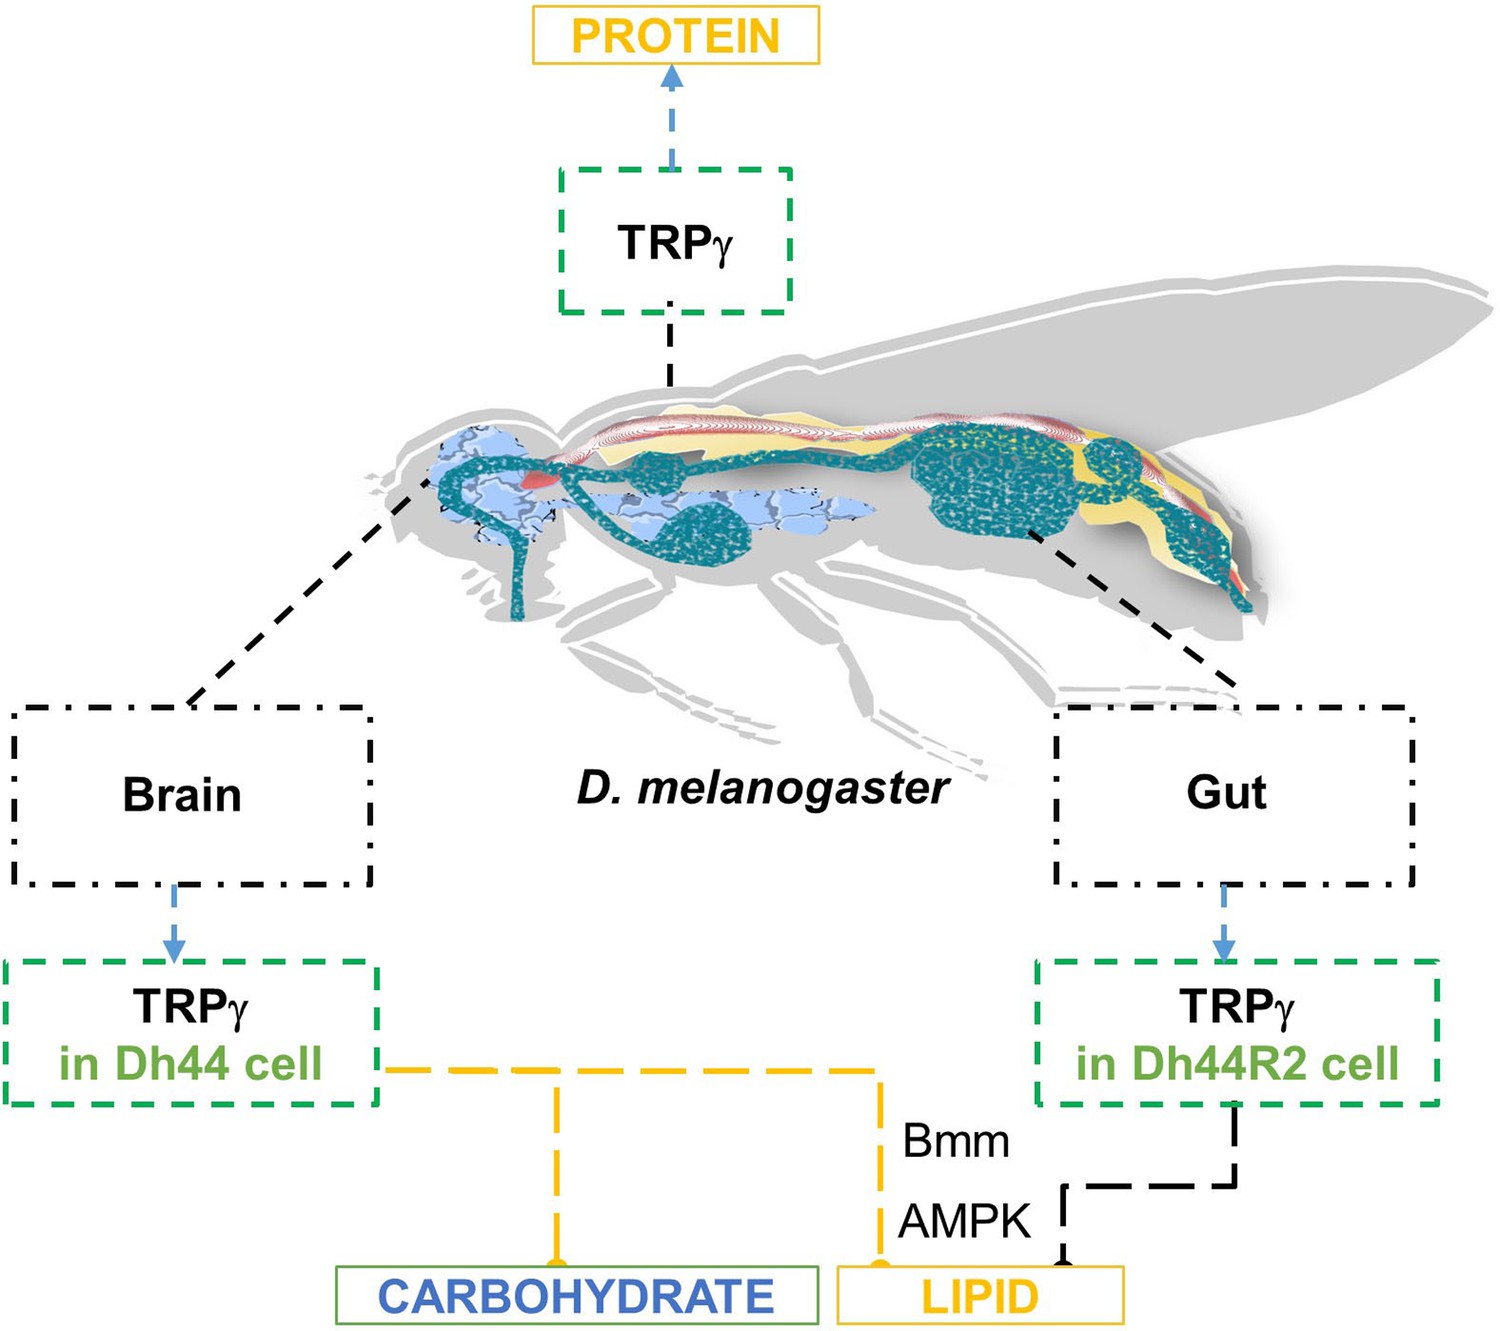
Schematic model representing the roles of trpγ in metabolic regualtion of carbohydrate, lipid, and protein.
Tables
Key resources table
| Reagent type (species) or resource | Designation | Source or reference | Identifiers | Additional information |
|---|---|---|---|---|
| Genetic reagent (Drosophila melanogaster) | trpγ1 | Bloomington Drosophila Stock Center | BDSC:64311 | Provided by Dr. C. Montel |
| Genetic reagent (D. melanogaster) | trpγG4 | Bloomington Drosophila Stock Center | BDSC:64313 | Provided by Dr. C. Montel |
| Genetic reagent (D. melanogaster) | trpγ1,UAStrpγ/CyO | Akitake et al., 2015 | Provided by Dr. C. Montel | |
| Genetic reagent (D. melanogaster) | trpγ1;g(trpγ) | Akitake et al., 2015 | Provided by Dr. C. Montel | |
| Genetic reagent (D. melanogaster) | trpA11 | Bloomington Drosophila Stock Center | BDSC:26504 | Provided by Dr. C. Montel |
| Genetic reagent (D. melanogaster) | amo1 | Watnick et al., 2003 | Provided by Dr. C. Montel | |
| Genetic reagent (D. melanogaster) | trpml2 | Bloomington Drosophila Stock Center | BDSC:42230 | Provided by Dr. C. Montel |
| Genetic reagent (D. melanogaster) | trp343 | Bloomington Drosophila Stock Center | BDSC:25082 | Provided by Dr. C. Montel |
| Genetic reagent (D. melanogaster) | pyx3 | Lee et al., 2005 | Dr. Y. Lee | |
| Genetic reagent (D. melanogaster) | wtrwex | Bloomington Drosophila Stock Center | BDSC:59038 | Provided by Dr. C. Montel |
| Genetic reagent (D. melanogaster) | trpl29134 | Bloomington Drosophila Stock center | BDSC:29134 | |
| Genetic reagent (D. melanogaster) | iav3621 | Bloomington Drosophila Stock center | BDSC:24768 | |
| Genetic reagent (D. melanogaster) | pain2 | Tracey et al., 2003 | Provided by Dr. S. Benzer | |
| Genetic reagent (D. melanogaster) | nan36a | Kim et al., 2003 | Provided by Dr. C. Kim | |
| Genetic reagent (D. melanogaster) | diLP2-GAL4 | Korea Drosophila Resource Center | KDRC: 200 | |
| Genetic reagent (D. melanogaster) | Dh44-GAL4 | Korea Drosophila Resource Center | KDRC: 2543 | Provided by Dr. Y. Kim |
| Genetic reagent (D. melanogaster) | UAS-mCD8::GFP | Bloomington Drosophila Stock Center | BDSC: 5130 | |
| Genetic reagent (D. melanogaster) | UAS-Kir2.1 | Bloomington Drosophila Stock Center | BDSC: 6596 | |
| Genetic reagent (D. melanogaster) | UAS-trpγRNAi | Vienna Drosophila Resource center | Transformant ID107656 | |
| Genetic reagent (D. melanogaster) | r4-GAL4 | Korea Drosophila Resource Center | KDRC: 2166 | |
| Genetic reagent (D. melanogaster) | cg-GAL4 | Bloomington Drosophila Stock Center | BDSC: 7011 | Provided by Dr. S. Hyun |
| Genetic reagent (D. melanogaster) | Myo1A-GAL4 | Bloomington Drosophila Stock Center | BDSC: 67057 | Provided by Dr. S. Hyun |
| Genetic reagent (D. melanogaster) | UAS-AMPKTD | Korea Drosophila Resource Center | KDRC:10099 | |
| Genetic reagent (D. melanogaster) | UAS-bmm | Bloomington Drosophila Stock Center | BDSC: 76600 | |
| Genetic reagent (D. melanogaster) | Dh44Mi | Bloomington Drosophila Stock Center | BDSC: 24345 | Provided by Dr. Y. Kim |
| Genetic reagent (D. melanogaster) | Dh44R1Mi | Bloomington Drosophila Stock Center | BDSC: 23517 | Provided by Dr. Y. Kim |
| Genetic reagent (D. melanogaster) | Dh44R2Mi | Bloomington Drosophila Stock Center | BDSC: 29129 | Provided by Dr. Y. Kim |
| Genetic reagent (D. melanogaster) | Dh44R1-GAL4 | Korea Drosophila Resource Center | KDRC: 2734 | Provided by Dr. Y. Kim |
| Genetic reagent (D. melanogaster) | Dh44R2-GAL4 | Bloomington Drosophila Stock Center | BDSC: 66865 | Provided by Dr. Y. Kim |
| Genetic reagent (D. melanogaster) | Dh44R2RNAi | Korea Drosophila resource center | KDRC: 5121 | |
| Genetic reagent (D. melanogaster) | yw;+;bmm::GFP | Men et al., 2016 | Provided by Dr. Kaeko Kamei | |
| Genetic reagent (D. melanogaster) | Dh44-LexA | Korea Drosophila Resource Center | KDRC: 2776 | |
| Genetic reagent (D. melanogaster) | Dh44R2-LexA | Korea Drosophila Resource Center | KDRC: 6616 | |
| Genetic reagent (D. melanogaster) | LexAop-mCherry | Korea Drosophila Resource Center | KDRC: 1247 | |
| Antibody | Mouse anti-GFP (mouse monoclonal) | Molecular probe | Cat # A11120 RRID:AB_221568 | 1:1000 (1 µL) |
| Antibody | Rabbit anti-DsRed(rabbit polyclonal) | Takara | Cat # 632496 RRID:AB_ 10013483 | 1:1000 (1 µL) |
| Antibody | Goat anti-mouse Alexa Fluor 488 | Thermo Fisher/ Invitrogen | Cat # A11029 RRID:AB_2534088 | 1:200 (1 µL) |
| Antibody | Goat anti-mouse Alexa Fluor 568 | Thermo Fisher/ Invitrogen | Cat # A11004 RRID:AB_2534072 | 1:200 (1 µL) |
| Antibody | Goat anti-rabbit Alexa Fluor 488 | Thermo Fisher/ Invitrogen | Cat # A11034 RRID:AB_2576217 | 1:200 (1 µL) |
| Antibody | Goat anti-rabbit Alexa Fluor 568 | Thermo Fisher/ Invitrogen | Cat # A11036 RRID:AB_10563566 | 1:200 (1 µL) |
| Antibody | Rabbit anti-Dh44 (rabbit polyclonal) | 1:500 Provided by Dr.J.A. Veenstra | ||
| Commercial assay or kit | Glucose (HK) Assay Kit | Sigma-Aldrich | Cat # GAHK-20 | |
| Commercial assay or kit | Glucose (HK) Assay reagent | Sigma-Aldrich | Cat # G3293 | |
| Commercial assay or kit | The Pierce BCA protein assay kit | Thermo Fischer Scientific | Cat # 23225 | |
| Commercial assay or kit | LiquiColor triglyceride test kit | Stanbio Laboratory | Cat # 2100–225 | |
| Chemical compounds or drug | Trehalase from porcine kidney | Sigma-Aldrich | Cat # 9025-52-9 | |
| Chemical compound or drug | Amyloglucosidase from Aspergillus | Sigma-Aldrich | Cat # 9032-08-0 | |
| Chemical compound or drug | Triglyceride mix | Sigma-Aldrich | Cat #17810-1AMP-S | |
| Chemical compound or drug | Lipase from Candida rugosa | Sigma-Aldrich | Cat # L1754 | |
| Chemical compound or drug | Metformin | Sigma-Aldrich | Cat # D150959 | |
| Chemical compound or drug | Hexanoic acid | Sigma-Aldric | Cat # W255912 | |
| Chemical compound or drug | Sucrose | Sigma-Aldrich | Cat # 57-50-1 | |
| Chemical compound or drug | Glycerol | Sigma-Aldrich | Cat # G5516 | |
| Chemical compound or drug | Nile red | Sigma-Aldrich | Cat # N3013 | |
| Software, algorithm | Origin Pro Version | OriginLab corporation | RRID:SCR_002815 | https://www.originlab.com/ |
| Software, algorithm | Graphpad Prism | GraphPad | RRID:SCR_002798 | https://www.graphpd.com/ |
| Software, algorithm | Fiji(ImageJ-win64) | Fiji | RRID:SCR_002285 | https://fiji.sc |
Additional files
Download links
A two-part list of links to download the article, or parts of the article, in various formats.
Downloads (link to download the article as PDF)
Open citations (links to open the citations from this article in various online reference manager services)
Cite this article (links to download the citations from this article in formats compatible with various reference manager tools)
TRPγ regulates lipid metabolism through Dh44 neuroendocrine cells
eLife 13:RP99258.
https://doi.org/10.7554/eLife.99258.3


