Follicular helper- and peripheral helper-like T cells drive autoimmune disease in human immune system mice
- Columbia Center for Translational Immunology, Department of Medicine, Columbia University Medical Center, Columbia University, United States
- Department of Immunology, Department of Biochemistry and Molecular Biology, Mayo Clinic, United States
- San Raffaele Hospital, Italy
- Department of Microbiology and Immunology, Columbia University Medical Center, Columbia University, United States
- Department of Surgery, Columbia University Medical Center, Columbia University, United States
Figures
Figure 1
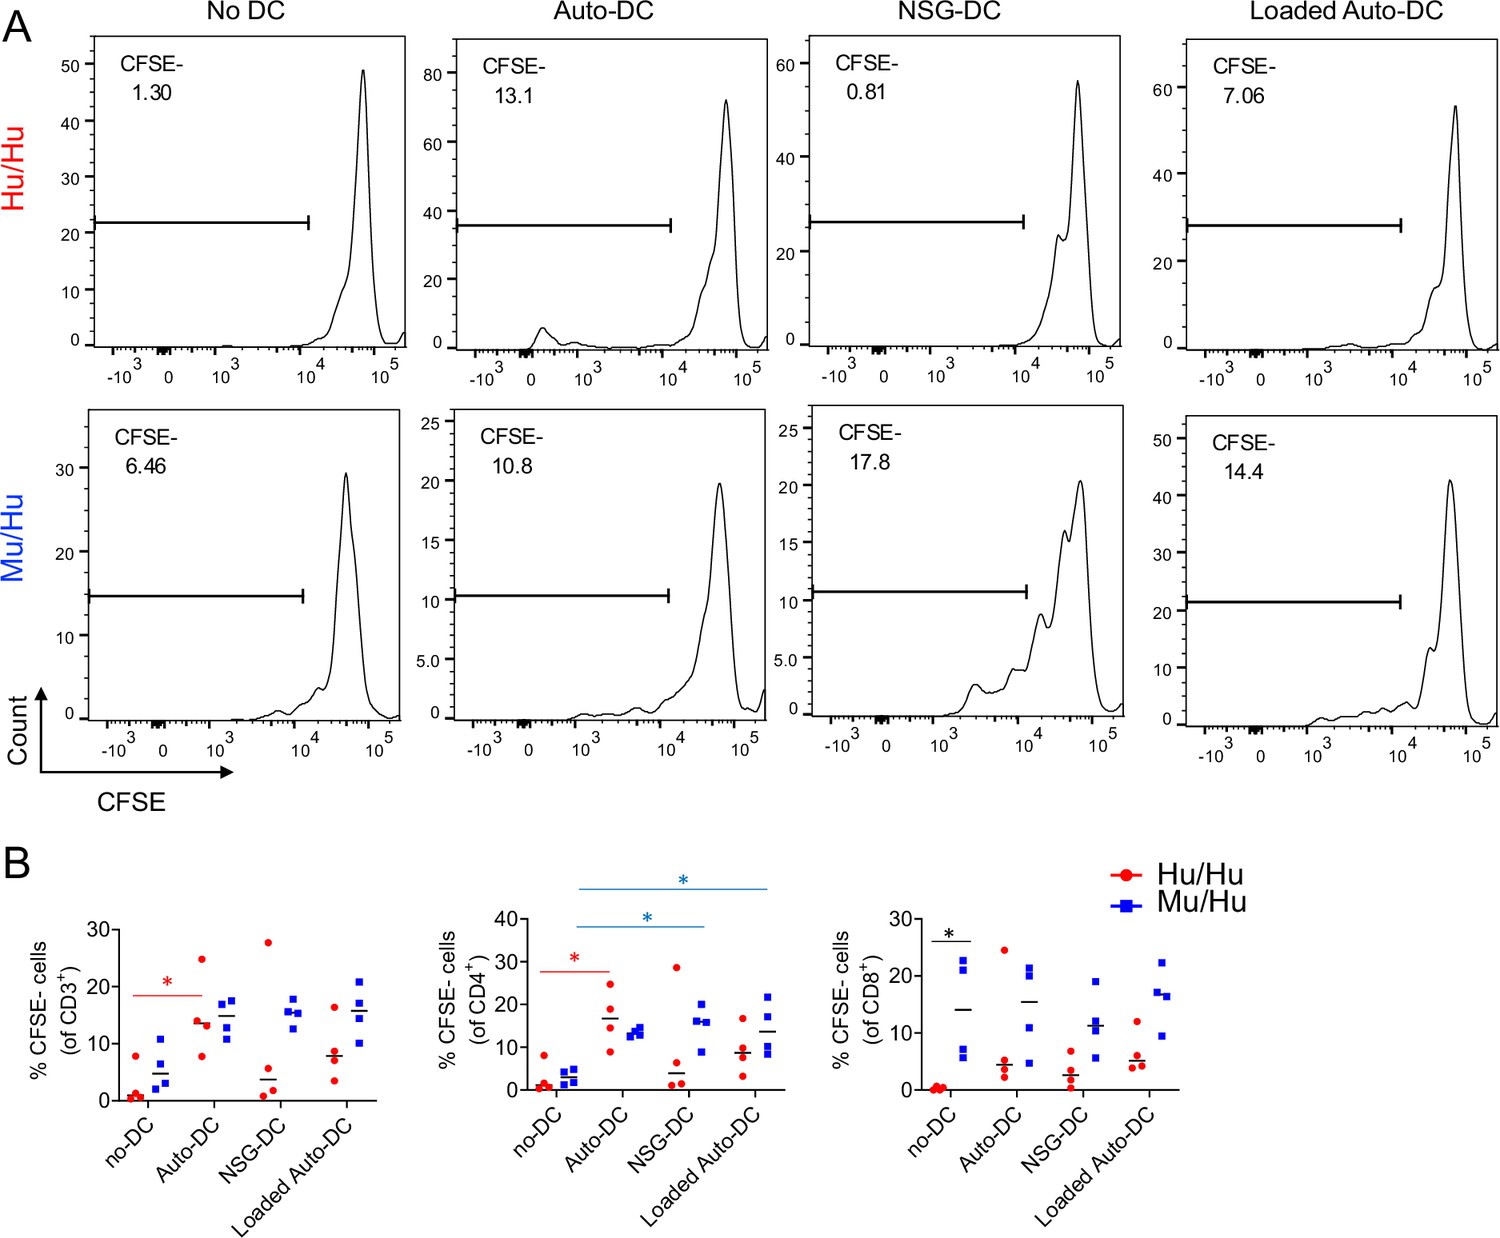
Lack of tolerance to murine recipient antigens of CD4 T cells developing in mouse thymus compared to those developing in human thymus.
Mu/Hu (n=4) and Hu/Hu (n=4) mice were sacrificed 20 weeks after transplantation and their splenocytes were CFSE-labeled and tested for reactivity to various antigen-presenting cells. To test direct reactivity to autologous human dendritic cells (DCs), fetal liver (FL) CD34+ cells used to generate both Hu/Hu and Mu/Hu mice were differentiated into DCs. NSG DCs were generated from bone marrow progenitors. Proliferation of T cells was measured after 6 days of co-culture based on CFSE dilution. (A) Representative plots showing proliferation of HuHu (top) and MuHu (bottom) T cells following co-culture with autologous human DCs, NSG mouse DCs, autologous human DCs loaded with murine antigens or with no DC. (B) Frequencies of proliferating CD3+ T cells and CD4+ and CD8+ T cells from splenocytes of HuHu (red) and MuHu (blue) mice in response to the indicated DCs. Differences between proliferation rate of Hu/Hu and Mu/Hu T cells were analyzed with unpaired t-test. In all graphs, each point represents an individual mouse with the mean indicated by a black line. Asterisks indicate statistical significance. **p<0.01, *p<0.05 . Statistically significant differences in responses between Hu/Hu or Mu/Hu T cells compared to the same group of T cells stimulated with other DCs are indicated by red and blue asterisks, respectively, while differences between Hu/Hu and Mu/Hu T cells are marked with black asterisks.
Figure 2 with 1 supplement
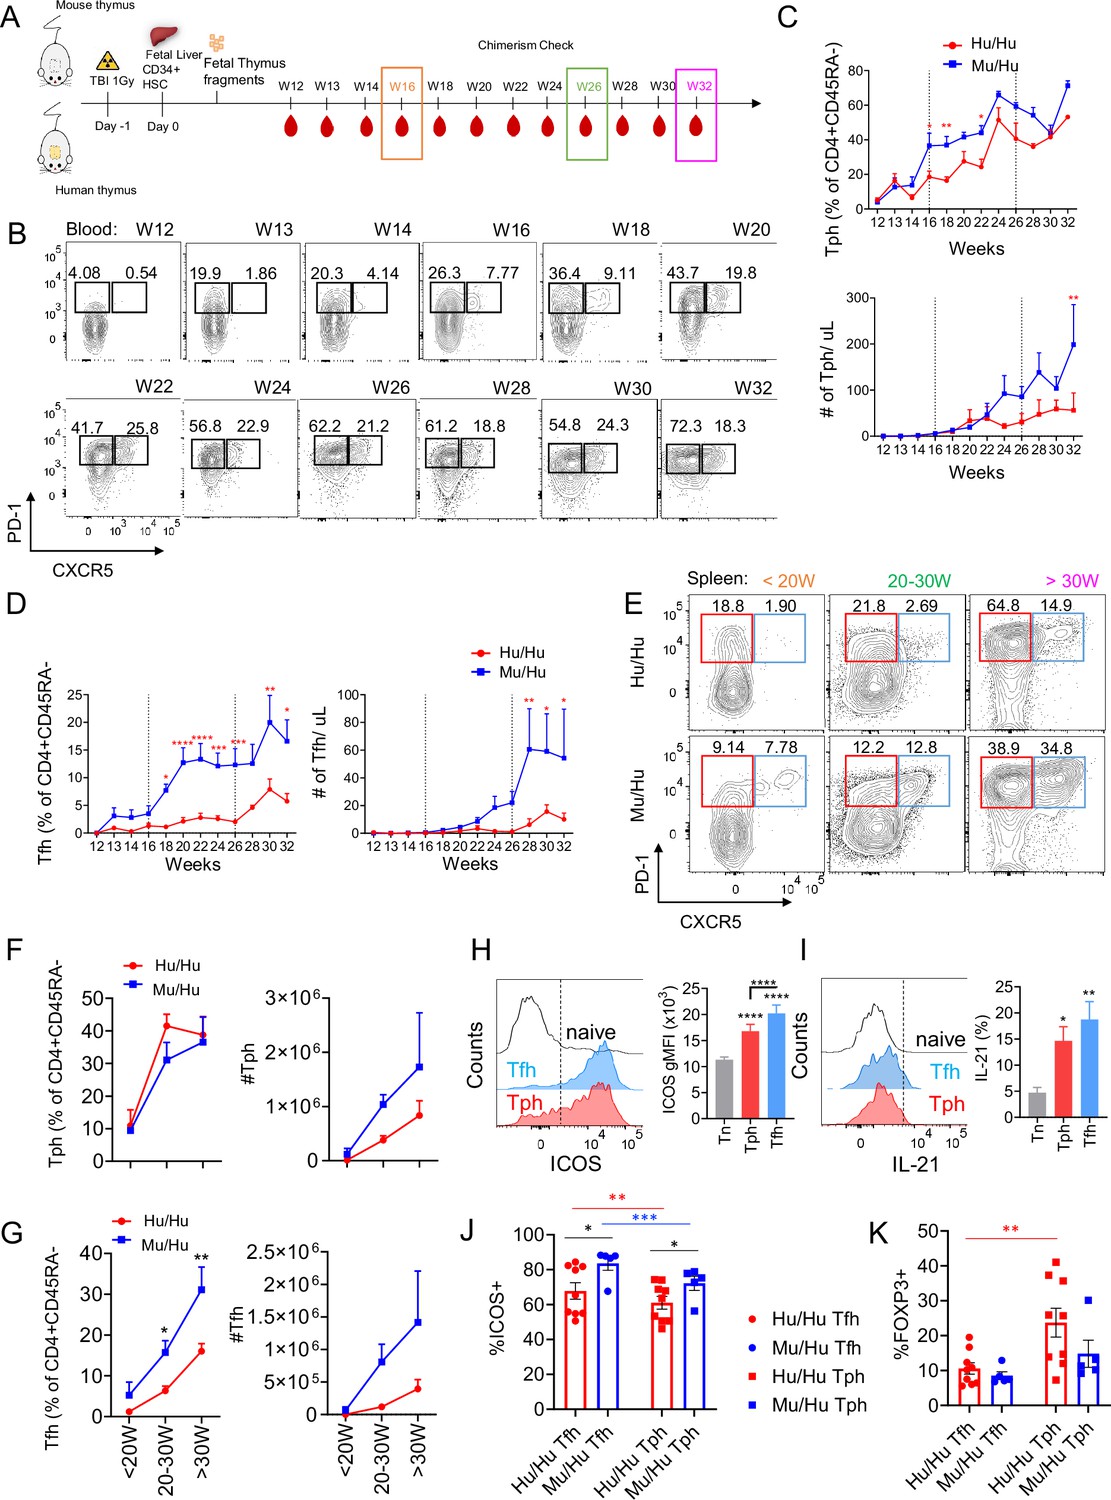
Tfh and Tph cell reconstitution in human immune system (HIS) mice.
(A) Schematic of experimental design; (B) representative staining; (C,D) percentage of CXCR5-PD-1+ Tph and CXCR5+PD-1+ Tfh cells among CD4+CD45RA- T cells and absolute counts per microliter in peripheral blood of HIS mice with mouse thymus (n=19) or human thymus (n=29) from week 12 to week 32 post-transplantation, analyzed every 2 weeks; (E) representative staining and (F,G) percentage of CXCR5-PD-1+ Tph and CXCR5+PD-1+ Tfh cells among CD4 T cells and absolute counts in spleens of HIS mice with mouse thymus or human thymus at <20W, 20–30W, and >30W post-transplantation. (H) Expression of ICOS in Tph and Tfh from Mu/Hu (n=16) and Hu/Hu (n=8) mice (combined results) and (I) IL-21 cytokine production after PMA/ionomycin stimulation of Tph (CXCR5-PD-1+) and Tfh cells (CXCR5+PD-1+) compared to naive CD4+ T cells (gray) from Mu/Hu (n=11) and Hu/Hu (n=4) mice (combined results). The results are expressed as mean ± SEM geometric mean fluorescence intensity (MFI) values; (J,K) percentage of ICOS+ and FOXP3+ cells among splenic Hu/Hu and Mu/Hu Tfh and Tph cells. All data are shown as means ± SEM. Asterisks indicate statistical significance between Hu/Hu and Mu/Hu groups as calculated by Bonferroni multiple comparison test. *p<0.05,. **p<0.01, ***p<0.001, and ****p<0.0001.
Figure 2—figure supplement 1

Ki67 expression in splenic Tph and Tfh cells at 30 weeks post-transplantation.
Data are summarized for Mu/Hu (n=3) and Hu/Hu (n=2) mice.
Figure 3
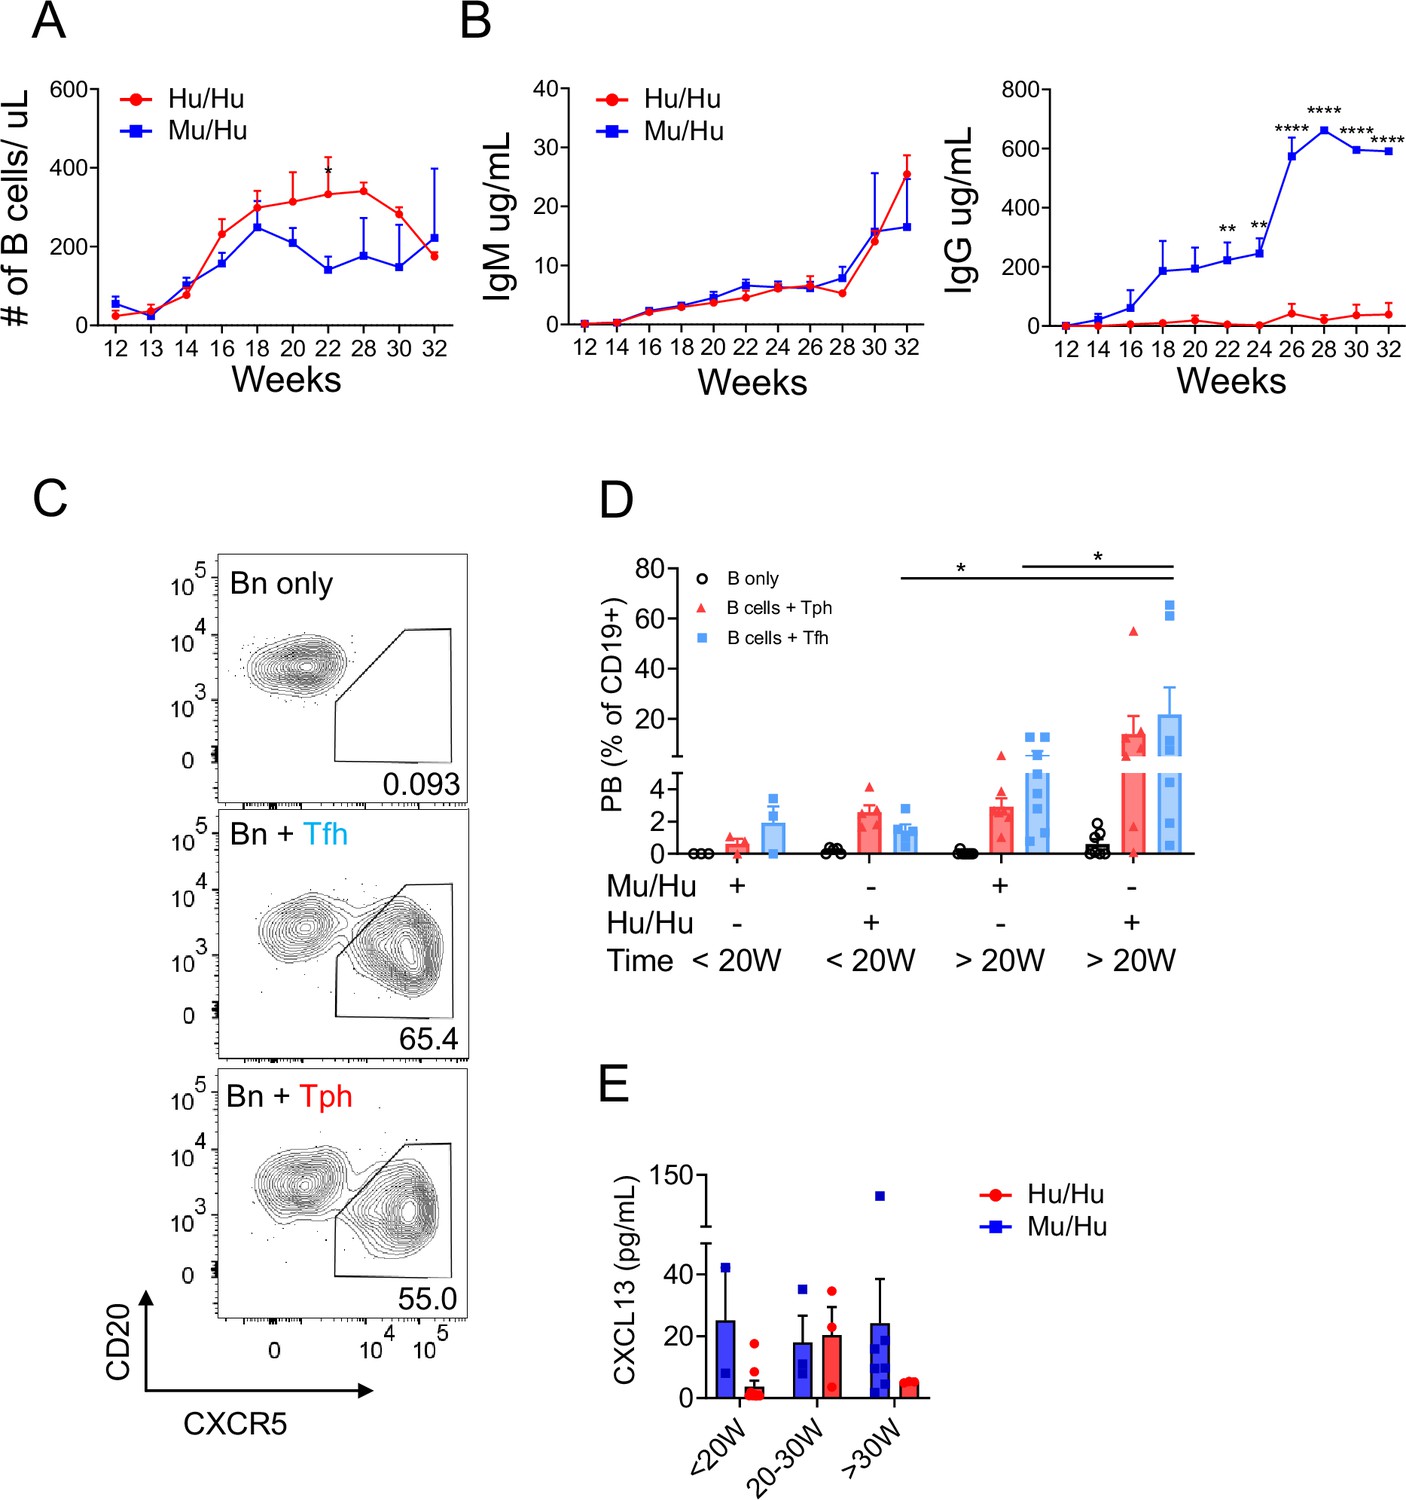
IgG and IgM antibodies, Tfh and Tph cell phenotypes, and B helper function of T cells from Mu/Hu vs Hu/Hu mice.
(A) Absolute concentrations of CD19+ B cells in peripheral blood of human immune system (HIS) mice with mouse thymus (n=19) or human thymus (n=29) from week 12 to week 32 post-transplantation, analyzed every 2 weeks; and their (B) plasma IgM and IgG concentrations; (C) FACS-sorted Tfh (CD4+CD19-CD45RA-CXCR5+CD25-) and Tph (CD4+CD19-CD45RA-CXCR5-CD25-) cells from spleens of HIS mice with mouse vs human thymus were co-cultured with naïve B cells (CD4-CD19+CD38-IgD+CD27-) and staphylococcal enterotoxin B (SEB) as described in Materials and methods and plasmablast differentiation was assessed. (D) Percentage of naïve splenic B cells that differentiated into plasmablasts (CD4-CD19+CD20-CD38+) following co-culture with Tfh or Tph cells from HIS mice with mouse thymus (n=11) or human thymus (n=12) sacrificed at <20 weeks or >20 weeks post-transplantation. Splenocytes were obtained in the indicated time ranges. (E) Concentration of CXCL13 chemokine from plasma of HIS mice with mouse thymus (n=12) or human thymus (n=13). For (A–B–G), Bonferroni multiple comparison test was used. For (C–D) Friedman test was performed and corrected using Dunn’s multiple comparisons test. For (F), Wilcoxon matched pairs signed rank test was used. Data are represented as mean ± SEM. *p<0.05, **p<0.01, and ****p<0.0001.
Figure 4
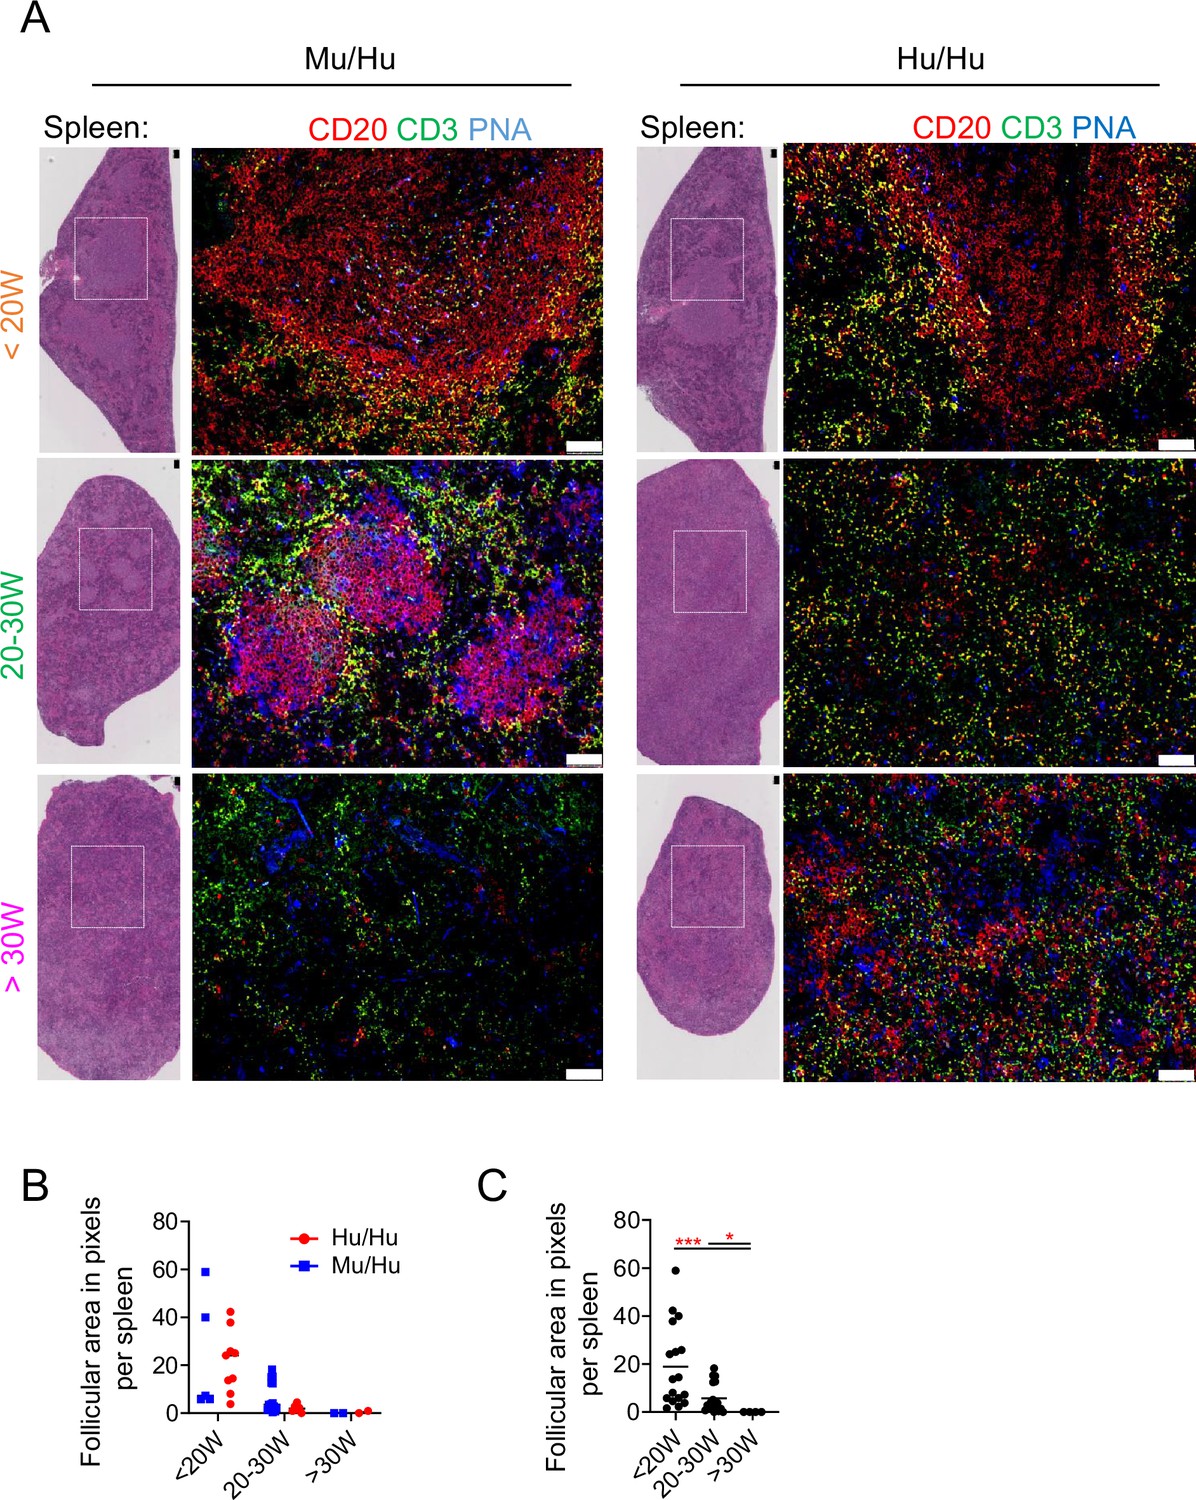
B cell follicles in human immune system (HIS) mice.
(A) Hematoxylin and eosin (H&E) staining and immunofluorescence performed for CD20, CD3, and peanut agglutinin (PNA) in serial tissue sections of spleen from HIS mice with mouse vs human thymus at <20W, 20–30W, and >30W post-transplantation. Confocal images (10×) showing follicles (CD20+) and T cell zones (CD20-). (B) Quantification of follicular area in pixels between HIS mice with mouse vs human thymus. (C) Quantification of the numbers of follicles and follicular area in pixels over time, combining both groups of mice. Asterisks indicate statistical significance as calculated by Kruskal-Wallis. *p<0.05 and ***p<0.001. White squares in the H&E images indicate the area represented on the right side. White bar = 100 µm. An average of three different slides was examined per sample.
Figure 5
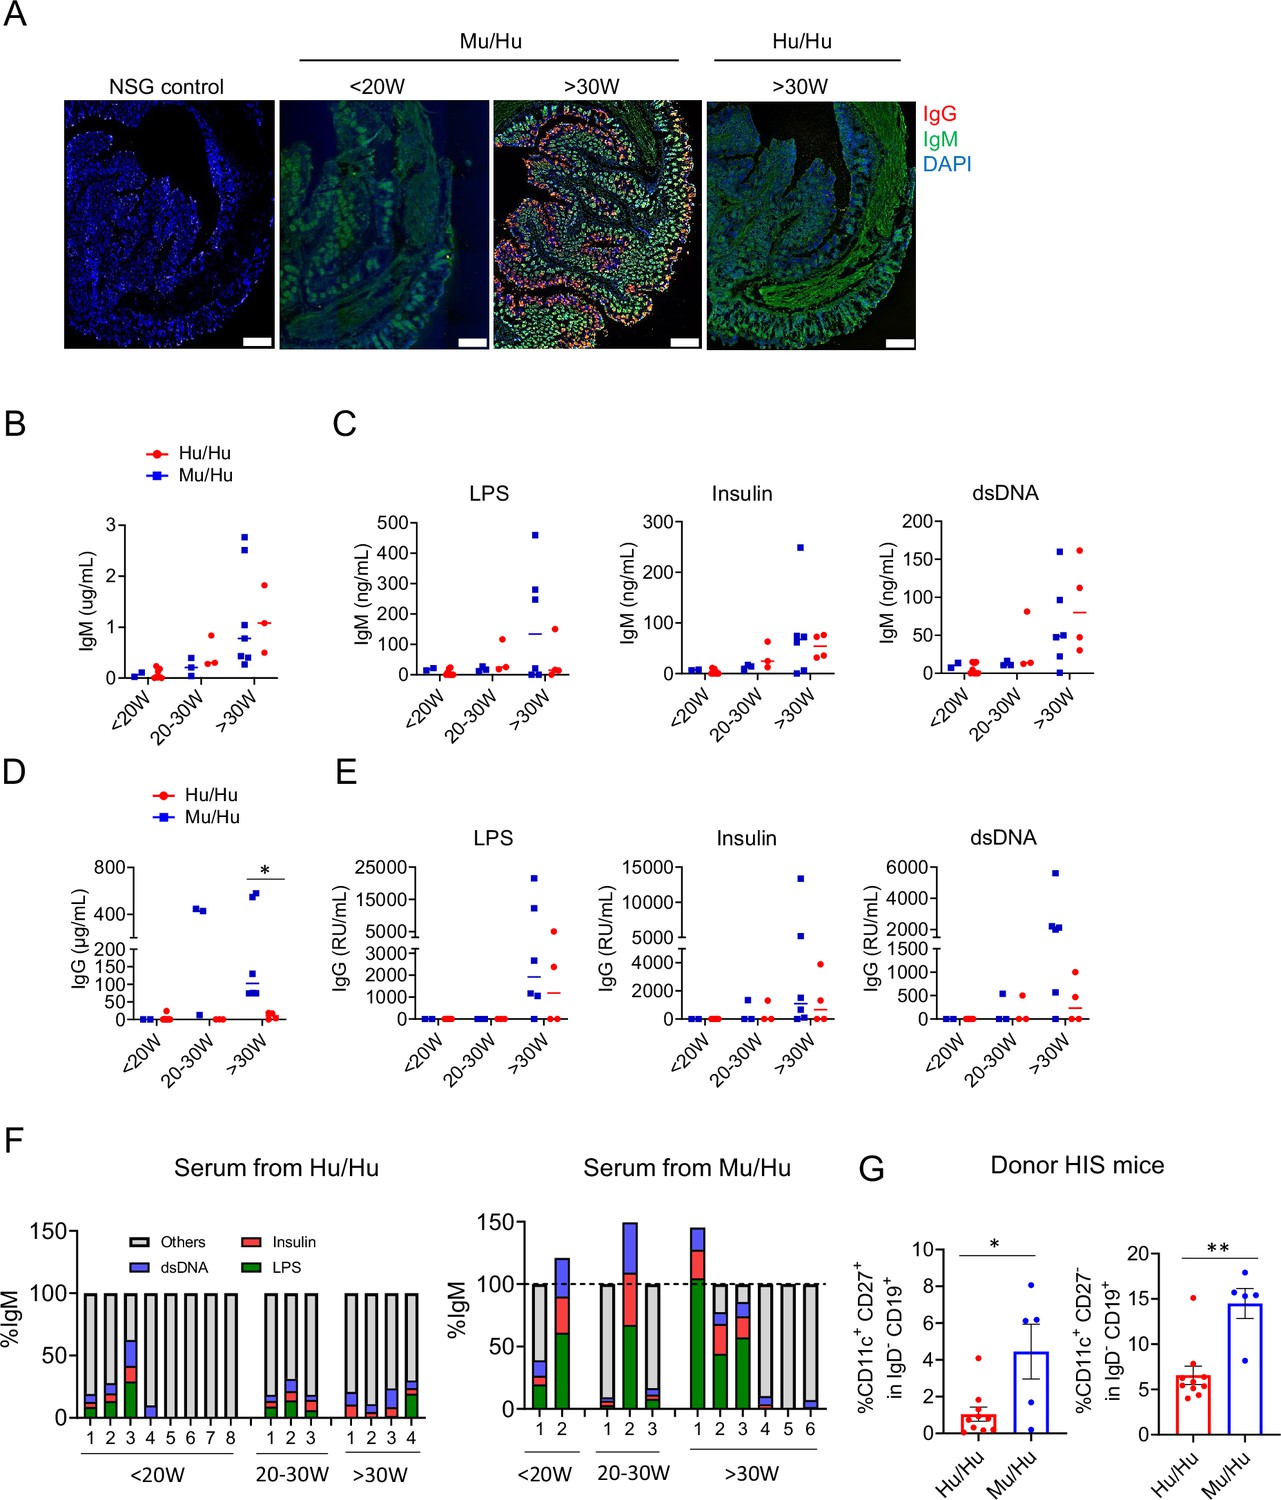
IgM and IgG antibodies from human immune system (HIS) mice are self-reactive.
(A) NSG intestine stained with serum from HIS mice with mouse or human thymus or with naïve NSG mouse serum and secondary antibodies against human IgM and IgG. DAPI was used for nucleic acid staining. (B–C) Total concentration of serum IgM antibody and concentration of IgM antibody reactive to LPS, insulin, and dsDNA. (D) Total concentration of serum IgG antibody; (E) concentrations of IgG antibody reactive to LPS, insulin, and dsDNA. RU were defined as relative units compared to control supernatants from monoclonal polyreactive IgG-producing cell cultures. (F) Percentage of total serum IgM antibody that was reactive to LPS, insulin, and dsDNA from total IgM of HIS mice with mouse (n=11) vs human thymus (n=15) at <20W, 20–30W, and 30W post-transplantation. (G) Percentage of CD11c+ CD27+ and CD11c+ CD27+ in IgG- CD19+ B cells in the spleens of donor Hu/Hu and Mu/Hu mice. Asterisks indicate statistical significance as calculated by t-test *p<0.05. Means ± SEMs are shown.
Figure 6
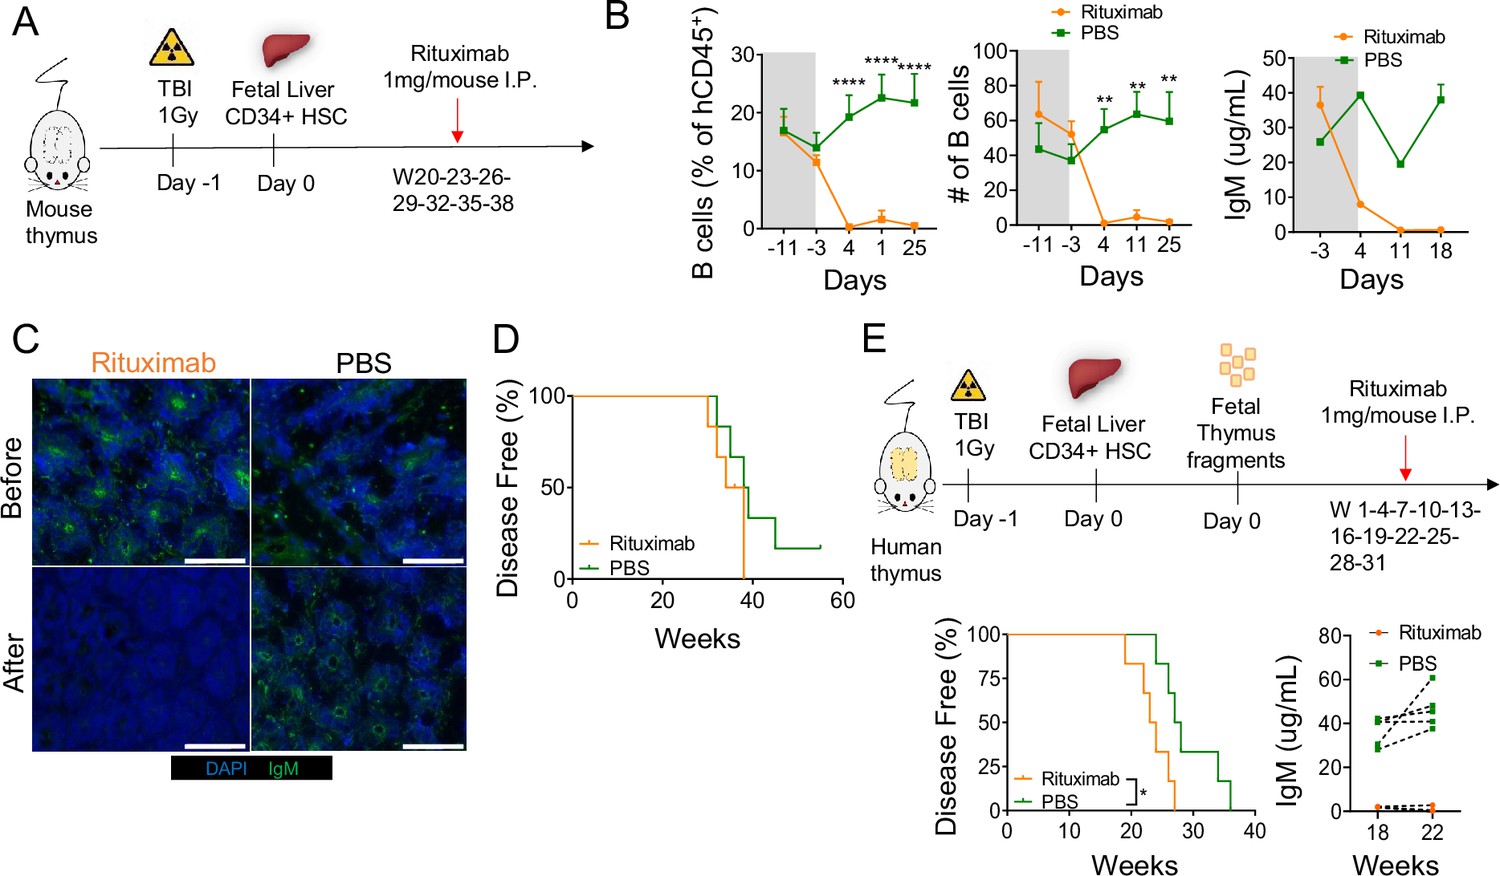
B cell depletion does not prevent disease development.
(A) Human immune system (HIS) mice with mouse thymus were generated as described in Materials and methods and were injected intraperitoneally with 1 mg of rituximab (anti-CD20) or PBS every 3 weeks from W20 to W38. (B) Frequency and absolute number of CD19+ B cells and serum IgM concentration before (gray) and after (white) treatment in HIS mice treated with rituximab or PBS (control). (C) NSG tissue stained with (primary) serum from HIS mice with mouse thymus and secondary antibodies against human IgM. DAPI was used for nucleic acid staining. (D) Kaplan-Meier curves for disease-free survival in relation to rituximab treatment in HIS mice with mouse thymus (n=6 per group). (E) Schema for early rituximab treatment initiation, Kaplan-Meier curves showing disease-free survival of each group, and serum IgM levels in rituximab-treated and PBS-treated control group (n=6 per group). All data are shown as means ± SEM. Asterisks indicate statistical significance as calculated by Bonferroni multiple comparison test. **p<0.01 and ****p<0.0001.
Figure 7 with 1 supplement
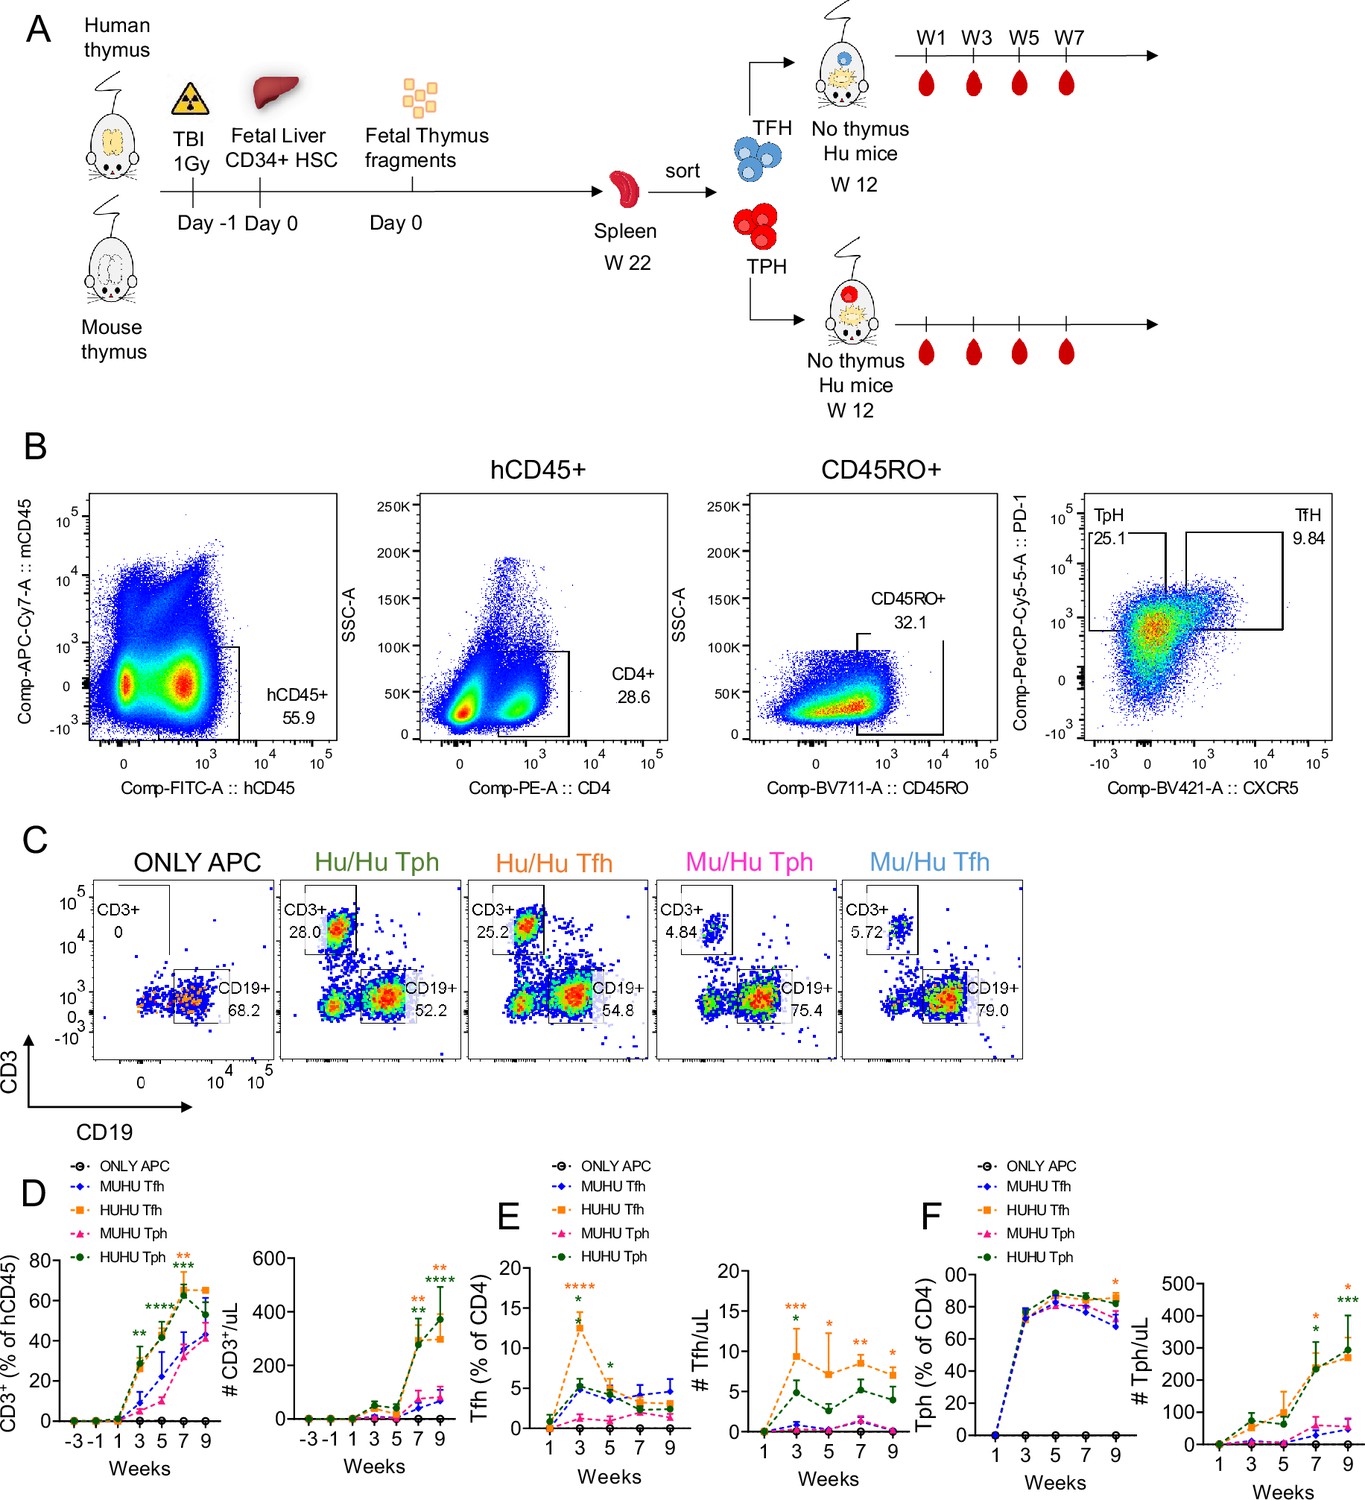
Expansion of donor T cells in thymecomized recipient human immune system (HIS) mice.
(A) Schema for adoptive transfer experiment. Purified Tph or Tfh cells from reconstituted mice with mouse vs human thymus were adoptively transferred to thymectomized NSG mice that had received HSCs 12 weeks earlier from the same fetal liver CD34+ cell donor but did not receive a thymus graft. These mice therefore had B cells and other APCs but not T cells at the time of adoptive transfer. (B) The gating strategy used to isolate Tfh and Tph cells from donor spleens. (C) Representative plot of CD3+ T cells and CD19+ B cells in APC-only mice (n=3), adoptive recipients of Tph cells (n=5) or Tfh cells (n=3) from HIS mice with human thymus (Hu/Hu), or adoptive recipients of Tph cells (n=5) or Tfh cells (n=3) from HIS mice with mouse thymus (Mu/Hu). (D) Frequency and absolute number of CD3+ T cells. (E–F) Frequencies and absolute numbers of CXCR5+PD-1+ Tfh and CXCR5-PD-1- Tph cells, respectively, in indicated groups. Asterisks indicate statistical significance as calculated by Bonferroni multiple comparison test. *p<0.05, **p<0.01, ***p<0.001, and ****p<0.0001. The green asterisks show significant differences between the Tph in Hu/Hu vs Mu/Hu mice, while the orange asterisks show significant differences between the Tfh in Hu/Hu vs Mu/Hu mice. Means ± SEMs are shown in panels D-F.
Figure 7—figure supplement 1
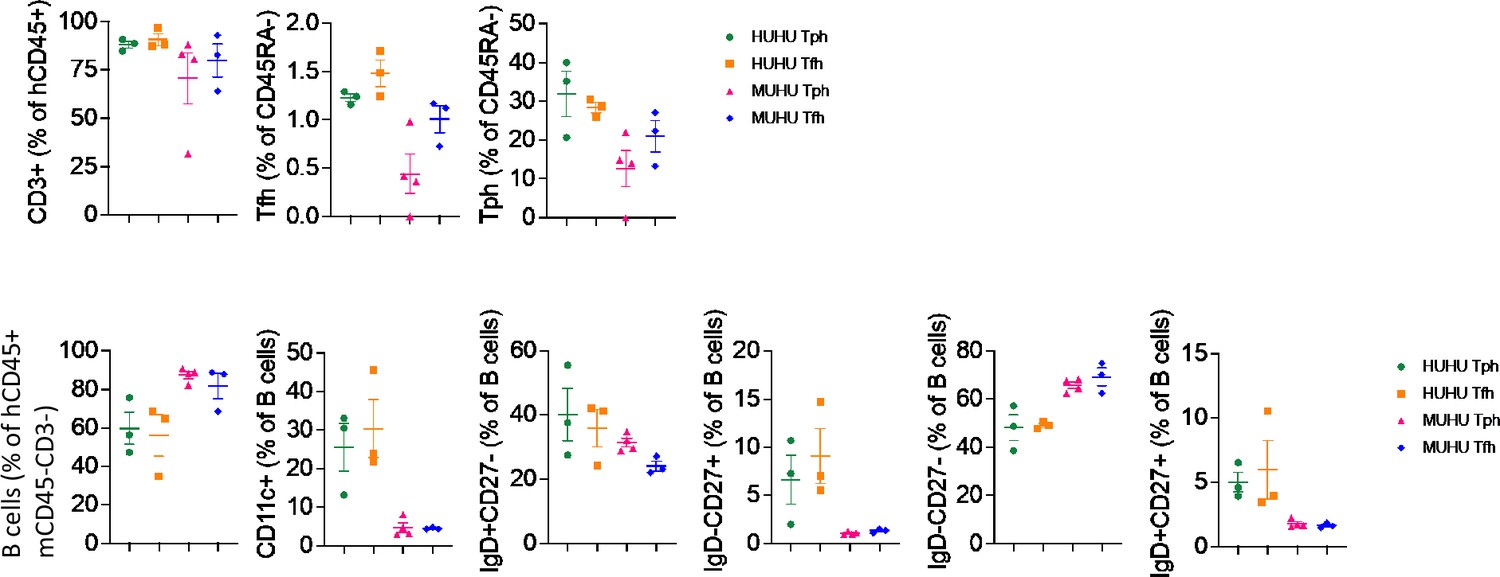
Frequencies of human T and B cell subsets in spleens of adoptive recipients of T cell subsets from Hu/Hu and Mu/Hu mice.
Figure 8

Effects of transferring Tfh and Tph from Mu/Hu and Hu/Hu mice to recipient human immune system (HIS) mice containing human APCs but not T cells.
(A) Frequencies and absolute numbers of B cells, (B) percentages of IgD+CD27-, IgD+CD27+, IgD-CD27+, IgD-CD27-, IgM+IgD+, and IgG+ B cells among CD19+ B cells, (C) percentages of CD11c+ B cells among CD19+ B cells in the blood of APC-only mice (n=3), recipients of Tph cells (n=5) or Tfh cells (n=3) from HIS mice with human thymus (Hu/Hu), and recipients of Tph cells (n=5) or Tfh cells (n=3) from HIS mice with mouse thymus (Mu/Hu). Percentage of CD11c+ CD27+ and CD11c+ CD27- in IgD- CD19+ B cells in the spleen and blood (W9 of adoptive transfer) of adoptive recipient mice. (D) IgM (left) and IgG (right) concentrations in sera of recipient mice before and after adoptive transfer. Means ± SEMs are shown in panels A-D. (E) Average weights over 16 weeks following adoptive transfer. (F) Kaplan-Meier curves for disease-free survival following injection of Hu/Hu Tph or Tfh or Mu/Hu Tph or Tfh cells. Animals were scored for autoimmune disease appearance every 2 weeks using a modification of published graft-vs-host disease (GVHD) scales (Lai et al., 2012; Verlaat et al., 2022) and considered to have disease if their score was >3 or if they showed >20% weight loss. Asterisks indicate statistical significance as calculated by Bonferroni multiple comparison test between Hu/Hu Tph and Mu/Hu Tph, or Hu/Hu Tfh and Mu/Hu Tfh cells. *p<0.05, **p<0.01, and ***p<0.001. Mantel-Cox test was used to analyze statistical significance in survival curve experiment.
Tables
Table 1
Mouse tissue-reactive human IgM and IgG in serum of Mu/Hu and Hu/Hu mice.
| Pancreas | Liver | Spleen | Kidney | Thymus | SI | SG | Skin | AG | LI | Bone | Lung | |||
|---|---|---|---|---|---|---|---|---|---|---|---|---|---|---|
| Control mouse | NSG | IgM | − | − | − | − | − | − | − | − | − | − | − | − |
| IgG | − | − | − | − | − | − | − | − | − | − | − | − | ||
| Humanized, nothymus <20 W | Mouse #1 | IgM | + | + | + | + | + | + | + | + | + | + | + | + |
| IgG | − | − | − | − | − | − | − | − | − | − | − | − | ||
| Mouse #2 | IgM | + | + | + | + | + | + | + | + | + | + | + | + | |
| IgG | − | − | − | − | − | − | − | − | − | − | − | − | ||
| Mouse thymus <20 W | Mouse #3 | IgM | + | + | + | + | + | + | + | + | + | + | + | + |
| IgG | − | − | − | − | − | − | − | − | − | − | − | − | ||
| Mouse#4 | IgM | + | + | + | + | + | + | + | + | + | + | + | + | |
| IgG | − | − | − | − | − | − | − | − | − | − | − | − | ||
| Mouse #5 | IgM | + | + | + | + | + | + | + | + | + | + | + | + | |
| IgG | + | + | + | + | + | + | + | + | + | + | + | + | ||
| Mouse thymus >30 W | Mouse #6 | IgM | + | + | + | + | + | + | + | + | + | + | + | + |
| IgG | + | − | − | + | + | + | − | + | − | + | + | + | ||
| Mouse #7 | IgM | + | + | + | + | + | + | + | + | + | + | + | + | |
| IgG | − | − | − | − | − | − | − | − | − | − | − | − | ||
| Mouse #8 | IgM | + | + | + | + | + | + | + | + | + | + | + | + | |
| IgG | − | − | − | − | − | − | − | − | − | − | − | − | ||
| Human thymus >30 W | Mouse#9 | IgM | + | + | + | + | + | + | + | + | + | + | + | + |
| IgG | − | − | − | − | − | − | − | − | − | − | + | − | ||
| Mouse #10 | IgM | + | + | + | + | + | + | + | + | + | + | + | + | |
| IgG | − | − | − | − | − | − | − | − | − | − | − | − | ||
| Mouse #11 | IgM | + | + | + | + | + | + | + | + | + | + | + | + | |
| IgG | − | − | − | − | − | − | − | − | − | − | − | − | ||
-
SI, small intestine; SG, salivary gland; AG, adrenal gland; LI, large intestine.
Table 2
Graft-vs-host disease (GVHD) scoring system to assess disease severity based on five parameters: weight loss, posture, activity, fur condition, and skin condition.
| Parameter | Criteria | Score |
|---|---|---|
| Weight loss | 10–25% weight loss compared to baseline | 1 |
| >25% weight loss compared to baseline | 2 | |
| Posture | Slight kyphosis | 0.5 |
| Obvious kyphosis | 1 | |
| Kyphosis | 1.5 | |
| Severe kyphosis | 2 | |
| Activity | Decreased activity | 0.5 |
| Stationary >50% of the time | 1 | |
| Moves when stimulated | 1.5 | |
| No movement | 2 | |
| Fur condition | Ventral ruffling | 0.5 |
| Ventral line and slight back ruffling | 1 | |
| Ruffling >50% of the body | 1.5 | |
| Ruffling entire body and denuded skin | 2 | |
| Skin condition | Flaking of ears, tail, or paws | 0.5 |
| Erythema in tail or anus, ear shriveling | 1 | |
| Open lesions | 1.5 | |
| Multiple open lesions | 2 |
Additional files
Download links
A two-part list of links to download the article, or parts of the article, in various formats.
Downloads (link to download the article as PDF)
Open citations (links to open the citations from this article in various online reference manager services)
Cite this article (links to download the citations from this article in formats compatible with various reference manager tools)
Follicular helper- and peripheral helper-like T cells drive autoimmune disease in human immune system mice
eLife 13:RP99389.
https://doi.org/10.7554/eLife.99389.3


