A genome-to-genome analysis of associations between human genetic variation, HIV-1 sequence diversity, and viral control
- École Polytechnique Fédérale de Lausanne, Switzerland
- University Hospital and University of Lausanne, Switzerland
- Eötvös Loránd University and the Hungarian Academy of Sciences, Hungary
- Swiss Institute of Bioinformatics, Switzerland
- Microsoft Research, United States
- BC Centre for Excellence in HIV/AIDS, Canada
- Simon Fraser University, Canada
- Murdoch University, Australia
- Vanderbilt University Medical Center, United States
- Universitat Autònoma de Barcelona, Spain
- Institució Catalana de Recerca i Estudis Avançats (ICREA), Spain
- Instituto de Salud Carlos III, Spain
- University of Bern & Inselspital, Switzerland
- University Hospital and University of Zürich, Switzerland
- Regional Hospital of Lugano, Switzerland
- Cantonal Hospital, Switzerland
- University of Basel, Switzerland
- Geneva University Hospitals, Switzerland
- St. Petersburg State University, Russia
- Massachusetts General Hospital, United States
- University of British Columbia, Canada
Figures
Figure 1
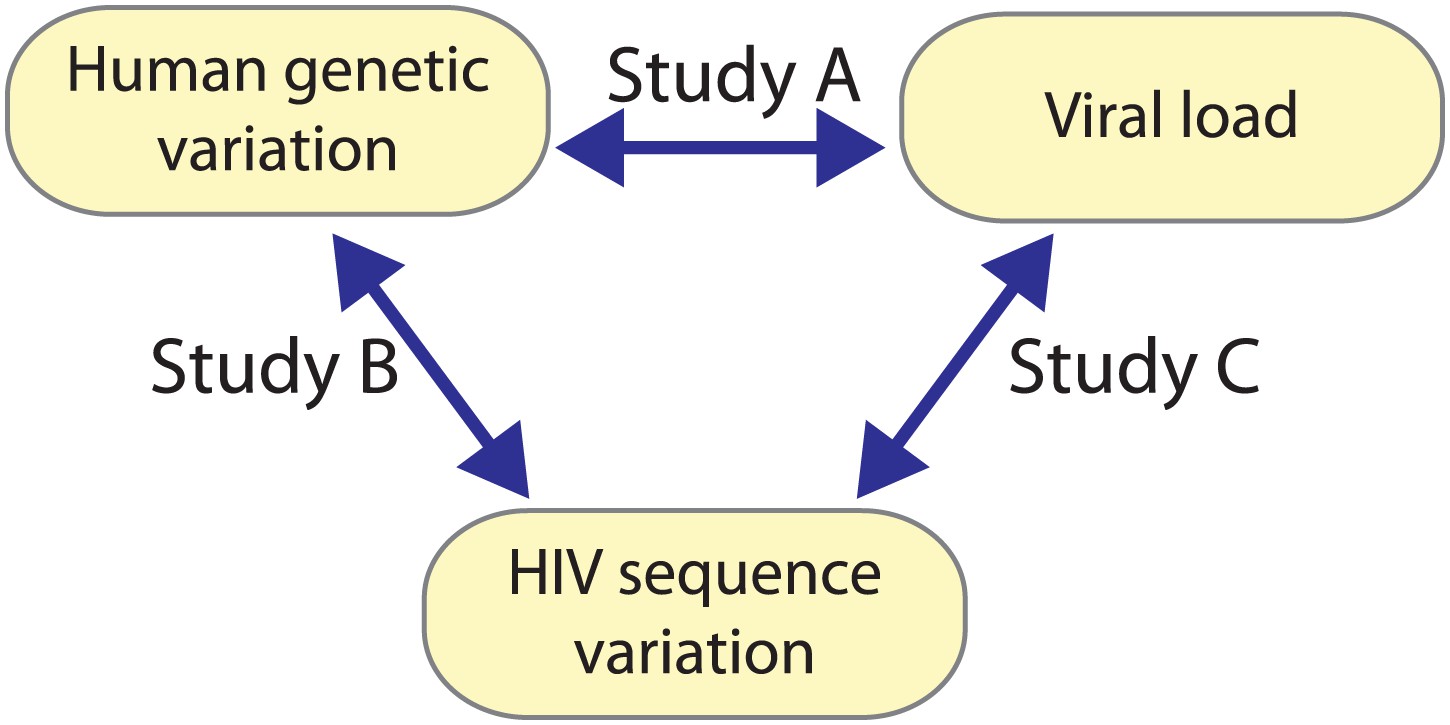
A triangle of association testing.
The following association analyses were performed: [Study A] human SNPs vs plasma viral load (1 GWAS); [Study B] human SNPs vs variable HIV-1 amino acids (3007 GWAS); and [Study C] variable HIV-1 amino acids vs plasma viral load (1 proteome-wide association study).
Figure 2
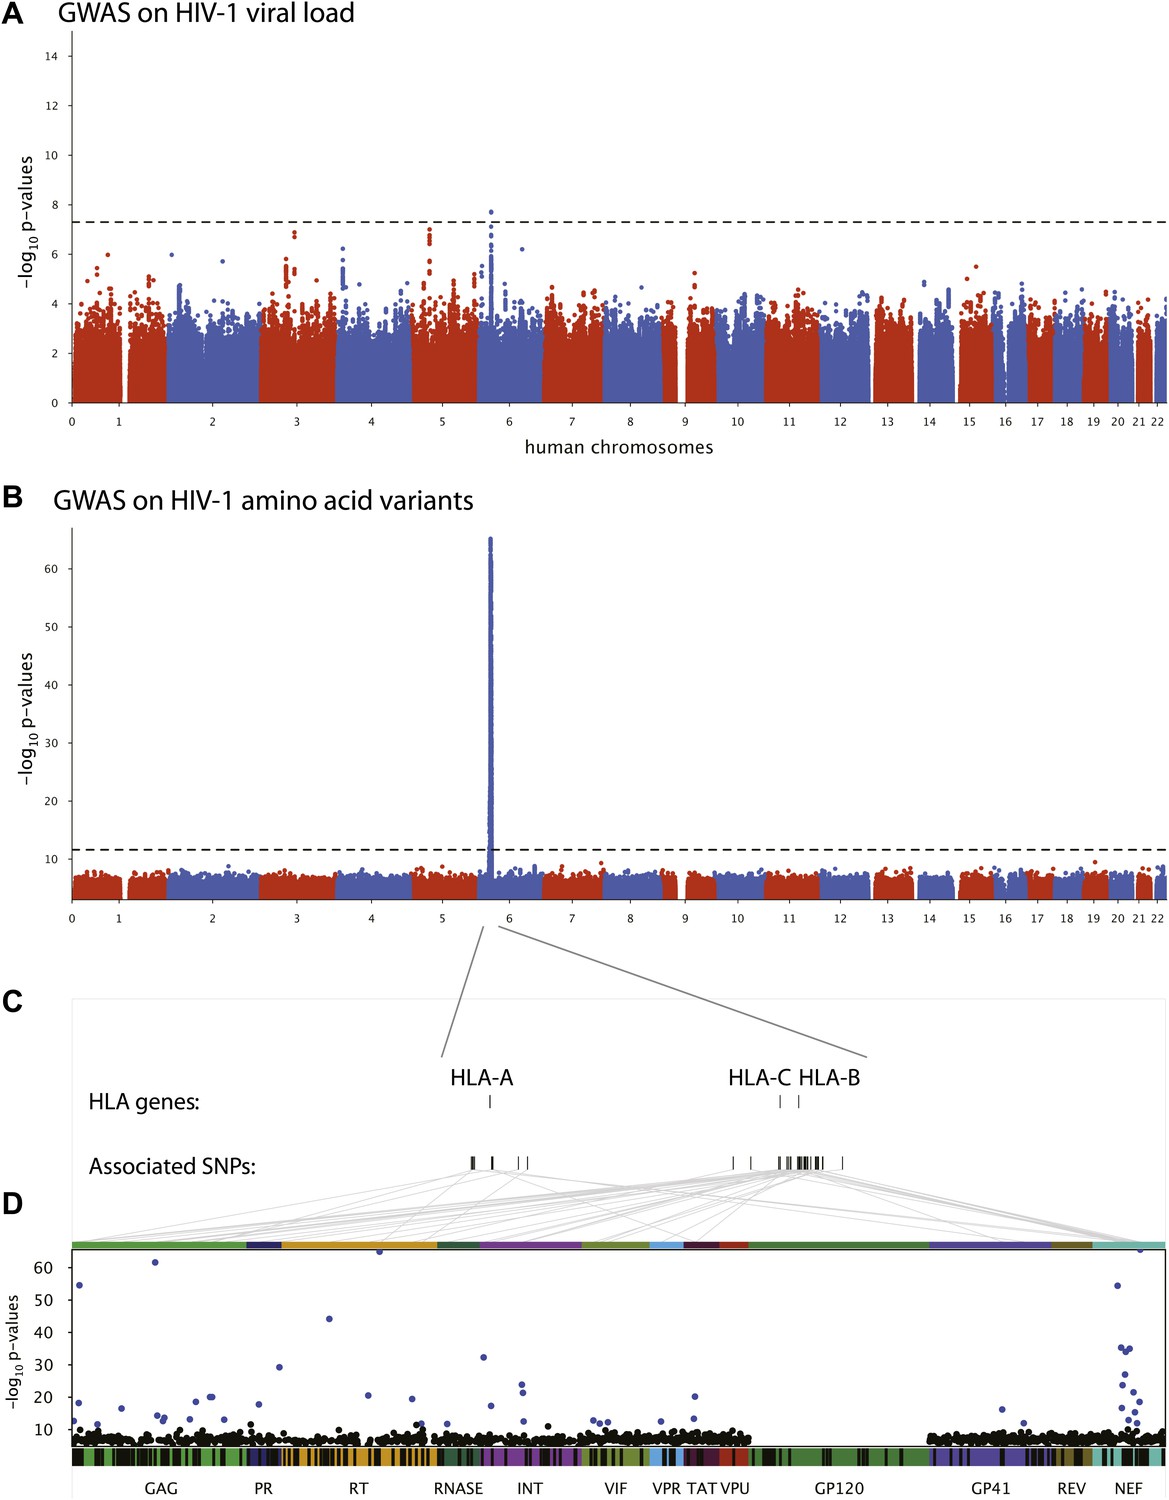
Results of the genome-wide association analyses.
(A) Associations between human SNPs and HIV-1 plasma viral load. The dotted line shows the Bonferroni-corrected significance threshold (p-value < 7.25 × 10⁻⁹). (B) Associations between human SNPs and HIV-1 amino acid variants, with 3007 GWAS collapsed in a single Manhattan plot. The dotted line shows the Bonferroni-corrected significance threshold (p-value < 2.4 × 10⁻¹²). (C) Schematic representation of the HLA class I genes and of the SNPs associated with HIV-1 amino acid variants in the region. (D) Same association results as in panel B, projected on the HIV-1 proteome. Only the strongest association is shown for each amino acid. Significant associations are indicated by a blue dot. The gp120 part of the HIV-1 proteome was not tested. The colored bar below the plot area shows the positions of the optimally defined CD8+ T cell epitopes. An interactive version of this figure can be found at http://g2g.labtelenti.org (which is also available to download from Zenodo, http://dx.doi.org/10.5281/zenodo.7138).
Figure 3

Association of HIV-1 amino acid variants with plasma viral load.
(A) Changes in VL (slope coefficients from the univariate regression model and standard error, log10 copies/ml) for the 48 HIV-1 amino acids that are associated with host SNPs in the genome-to-genome analysis. (B) rs2395029, a marker of HLA-B*57:01 is associated with a 0.38 log10 copies/ml lower VL (black bar) in comparison to the population mean. Gray bars represent changes in VL for amino acid variants associated with rs2395029 (p<0.001). In case of multiallelic positions, the change in VL is shown for all minor amino acids combined vs the major amino acid (e.g., GAG147 not I).
Tables
Table 1
Associations between HIV-1 amino acid variants and human polymorphisms
| HIV gene | HIV position | SNP | CTL epitope (codons) | Tagging HLA (D’/r2) | SNP vs aa (p) | SNP vs VL (p) | aa vs VL (p) |
|---|---|---|---|---|---|---|---|
| GAG | 12 | chr6:31285512 | – | B*49:01 (1.00/1.00) | 2.20E-13 | 6.70E-01 | 5.60E-01 |
| GAG | 26 | rs12524487 | – | B*15:01 (1.00/0.82) | 6.10E-19 | 2.10E-01 | 1.40E-01 |
| GAG | 28 | rs1655912 | RLRPGGKKK (20–28) | A*03:01 (1.00/0.81) | 2.70E-55 | 5.60E-01 | 2.00E-02 |
| GAG | 79 | chr6:31267544 | LYNTVATL (78-85) | C*14:02 (1.00/0.96) | 2.40E-12 | 3.50E-01 | 2.80E-01 |
| GAG | 147 | rs1055821 | – | C*06:02 (0.95/0.71) | 3.10E-17 | 3.30E-07 | 2.90E-05 |
| GAG | 242 | rs73392116 | TSTLQEQIGW (240–249) | B*57:01 (1.00/0.98) | 2.40E-62 | 1.90E-06 | 1.70E-05 |
| GAG | 248 | rs41557213 | TSTLQEQIGW (240-249) | B*57:01 (1.00/0.97) | 4.80E-15 | 2.00E-06 | 5.30E-03 |
| GAG | 264 | chr6:31376564 | KRWIILGLNK (263–272) | B*27:05 (1.00/0.92) | 2.30E-13 | 5.50E-02 | 3.50E-01 |
| GAG | 268 | rs2249935 | GEIYKRWIIL (259–268) | B*08:01 (1.00/0.43) | 2.20E-14 | 5.10E-01 | 1.90E-01 |
| GAG | 340 | rs11966319 | – | B*15:01 (0.94/0.42) | 6.70E-14 | 4.60E-01 | 7.70E-01 |
| – | C*03:04 (0.99/0.59) | ||||||
| GAG | 357 | rs2523612 | GPGHKARVL (355-363) | B*07:02 (0.99/0.95) | 2.70E-19 | 2.20E-01 | 1.20E-01 |
| – | C*07:02 (0.99/0.84) | ||||||
| GAG | 397 | rs61754472 | – | A*31:01 (0.97/0.83) | 8.80E-21 | 3.50E-01 | 8.30E-01 |
| GAG | 403 | rs28896571 | – | – | 8.90E-21 | 7.90E-01 | 8.60E-01 |
| GAG | 437 | rs34268928 | RQANFLGKI (429-437) | B*13:02 (1.00/0.96) | 8.70E-14 | 1.80E-02 | 6.80E-02 |
| GP41 | 206 | rs17881210 | – | B*15:01 (1.00/0.88) | 6.10E-17 | 6.10E-01 | 3.00E-01 |
| GP41 | 267 | rs9278477 | RLRDLLLIVTR (259–269) | A*03:01 (1.00/0.01) | 1.00E-12 | 7.80E-01 | 2.60E-01 |
| INT | 11 | rs2596477 | – | B*44:02 (1.00/0.64) | 5.10E-33 | 1.50E-01 | 1.80E-01 |
| INT | 32 | rs1050502 | – | B*51:01 (0.97/0.92) | 4.80E-18 | 7.20E-01 | 4.00E-01 |
| INT | 119 | rs9264954 | – | C*05:01 (1.00/1.00) | 1.30E-24 | 7.90E-01 | 1.10E-01 |
| INT | 122 | rs9264419 | – | C*05:01 (1.00/0.95) | 4.50E-22 | 8.30E-01 | 7.80E-01 |
| INT | 124 | chr6:31345421 | STTVKAACWW (123–132) | B*57:01 (1.00/1.00) | 3.00E-13 | 1.10E-06 | 9.70E-03 |
| NEF | 71 | rs2596488 | FPVTPQVPLR (68–77) | B*07:02 (1.00/0.98) | 3.80E-55 | 2.50E-01 | 8.10E-02 |
| – | C*07:02 (0.95/0.83) | ||||||
| NEF | 81 | rs9295987 | RPMTYKAAL (77–85) | B*07:02 (1.00/0.01) | 4.80E-36 | 2.50E-01 | 9.50E-02 |
| – | C*04:01 (0.90/0.63) | ||||||
| NEF | 83 | rs34768512 | – | B*15:01 (1.00/0.47) | 2.20E-17 | 2.80E-01 | 1.50E-02 |
| – | C*03:04 (0.96/0.54) | ||||||
| NEF | 85 | rs2395475 | RPMTYKAAL (77–85) | B*07:02 (1.00/0.29) | 1.90E-24 | 8.10E-01 | 1.30E-03 |
| – | B*08:01 (1.00/0.22) | ||||||
| – | C*07:02 (0.97/0.30) | ||||||
| NEF | 92 | rs16896166 | AVDLSHFLK (84–92) | A*11:01 (1.00/0.99) | 1.00E-27 | 5.30E-01 | 1.50E-01 |
| NEF | 94 | rs9265972 | FLKEKGGL (90–97) | B*08:01 (1.00/0.97) | 9.60E-35 | 9.80E-01 | 1.20E-01 |
| NEF | 102 | rs2524277 | – | B*44:03 (0.98/0.96) | 1.10E-13 | 4.40E-01 | 2.40E-01 |
| NEF | 105 | rs1049709 | – | C*07:01 (1.00/0.98) | 1.10E-35 | 9.00E-01 | 2.70E-01 |
| NEF | 116 | chr6:31402358 | HTQGYFPDW (116–124) | B*57:01 (1.00/1.00) | 3.00E-22 | 1.90E-06 | 3.30E-01 |
| NEF | 120 | chr6:31236168 | - | C*14:02 (1.00/1.00) | 4.40E-16 | 3.60E-01 | 1.20E-02 |
| NEF | 126 | chr6:31102273 | – | B*51:01 (1.00/0.18) | 1.10E-12 | 1.80E-01 | 4.90E-02 |
| NEF | 133 | chr6:31397689 | – | B*35:01 (0.95/0.89) | 2.80E-19 | 2.50E-01 | 3.40E-01 |
| NEF | 135 | rs72845950 | RYPLTFGW (134–141) | A*24:02 (1.00/0.88) | 2.70E-66 | 9.10E-02 | 5.50E-03 |
| PR | 35 | rs2523577 | EEMNLPGRW (34-42) | B*44:02 (1.00/0.64) | 1.70E-18 | 1.60E-01 | 5.70E-01 |
| PR | 93 | rs2263323 | – | B*15:01 (0.98/0.92) | 5.60E-30 | 4.70E-01 | 9.50E-01 |
| RNASE | 28 | rs2428481 | – | B*08:01 (1.00/1.00) | 1.80E-12 | 8.10E-01 | 6.20E-01 |
| RT | 135 | rs1050502 | TAFTIPSI (128–135) | B*51:01 (0.97/0.92) | 6.70E-45 | 7.20E-01 | 3.00E-01 |
| RT | 245 | chr6:31411714 | IVLPEKDSW (244–252) | B*57:01 (1.00/0.98) | 2.90E-21 | 1.20E-06 | 5.40E-02 |
| RT | 277 | rs3128902 | QIYPGIKVR (269–277) | A*03:01 (1.00/0.99) | 1.20E-65 | 8.20E-01 | 2.70E-01 |
| RT | 369 | rs17190134 | – | B*13:02 (0.93/0.86) | 3.50E-20 | 6.40E-02 | 1.40E-01 |
| RT | 395 | rs17194293 | – | - | 1.50E-12 | 1.20E-01 | 7.70E-02 |
| TAT | 29 | rs9260615 | – | A*32:01 (0.98/0.95) | 4.40E-14 | 3.90E-01 | 1.40E-01 |
| TAT | 32 | rs16899214 | CCFHCQVC (30–37) | C*12:03 (0.98/0.96) | 6.40E-21 | 3.40E-01 | 4.90E-01 |
| VIF | 33 | chr6:31430060 | ISKKAKGWF (31–39) | B*57:01 (1.00/0.98) | 1.50E-13 | 9.90E-07 | 9.30E-03 |
| VIF | 51 | rs7767850 | – | B*49:01 (1.00/1.00) | 1.40E-12 | 5.20E-01 | 2.10E-01 |
| VIF | 74 | rs2395029 | – | B*57:01 (1.00/0.98) | 5.40E-13 | 9.70E-07 | 2.80E-01 |
| VPR | 32 | chr6:31362941 | VRHFPRIWL (31–39) | B*27:05 (1.00/0.94) | 3.10E-13 | 5.40E-02 | 6.50E-01 |
-
Significant associations (p < 2.4 × 10⁻¹²) were observed for 48 HIV-1 amino acid variants. The table shows the major amino acid variants present at each specific HIV-1 position, the strongest associated SNP and its linked HLA class I allele(s), if applicable. The column ‘CTL Epitope (codons)’ lists published, optimally described CTL epitopes (available at http://www.hiv.lanl.gov/content/immunology/tables/optimal_ctl_summary.html and in [Carlson et al., 2012]) restricted by the tagged HLA class I allele(s) specified, and their positions within the protein. Where multiple overlapping epitopes restricted by the same HLA class I allele have been described, only one is shown. Associations where no relevant CTL epitope has been described are indicated with a dash. The last three columns give association p-values for comparisons between human SNPs and viral amino acids, human SNPs and plasma VL and viral amino acids and plasma VL, respectively. For tests involving viral amino acids accommodating more than 1 alternate allele, the smallest association p-value observed at that position is reported.
Table 2
Distribution of samples across genotyping platforms and cohorts
| N | Genotyping platform | Cohort |
|---|---|---|
| 140 | Illumina 1M | ACTG |
| 6 | Illumina OmniExpress 12v1H | CARLOS III |
| 518 | Affymetrix 6.0 | HOMER |
| 136 | Illumina OmniExpress12v1H | HOMER |
| 47 | Illumina 650k | IHCS |
| 6 | Illumina 660W-Quad | IRSICAIXA |
| 2 | Illumina 1M | SHCS |
| 79 | Illumina 550k | SHCS |
| 122 | Illumina OmniExpress12v1H | SHCS |
| 15 | Illumina 550k | WAHCS |
-
ACTG = AIDS Clinical Trials Group Network; CARLOS III = Instituto de Salud Carlos III; HOMER = HAART Observational Medical Evaluation and Research Study; IHCS = International HIV Controllers Study; IRSICAIXA = AIDS Research Institute IrsiCaixa; SHCS = Swiss HIV Cohort Study; WAHCS = Western Australian HIV Cohort Study.
Download links
A two-part list of links to download the article, or parts of the article, in various formats.
Downloads (link to download the article as PDF)
Open citations (links to open the citations from this article in various online reference manager services)
Cite this article (links to download the citations from this article in formats compatible with various reference manager tools)
A genome-to-genome analysis of associations between human genetic variation, HIV-1 sequence diversity, and viral control
eLife 2:e01123.
https://doi.org/10.7554/eLife.01123


