Establishing the role of ATP for the function of the RIG-I innate immune sensor
- Yale University, United States
- Howard Hughes Medical Institute, Yale University, United States
Figures
Figure 1
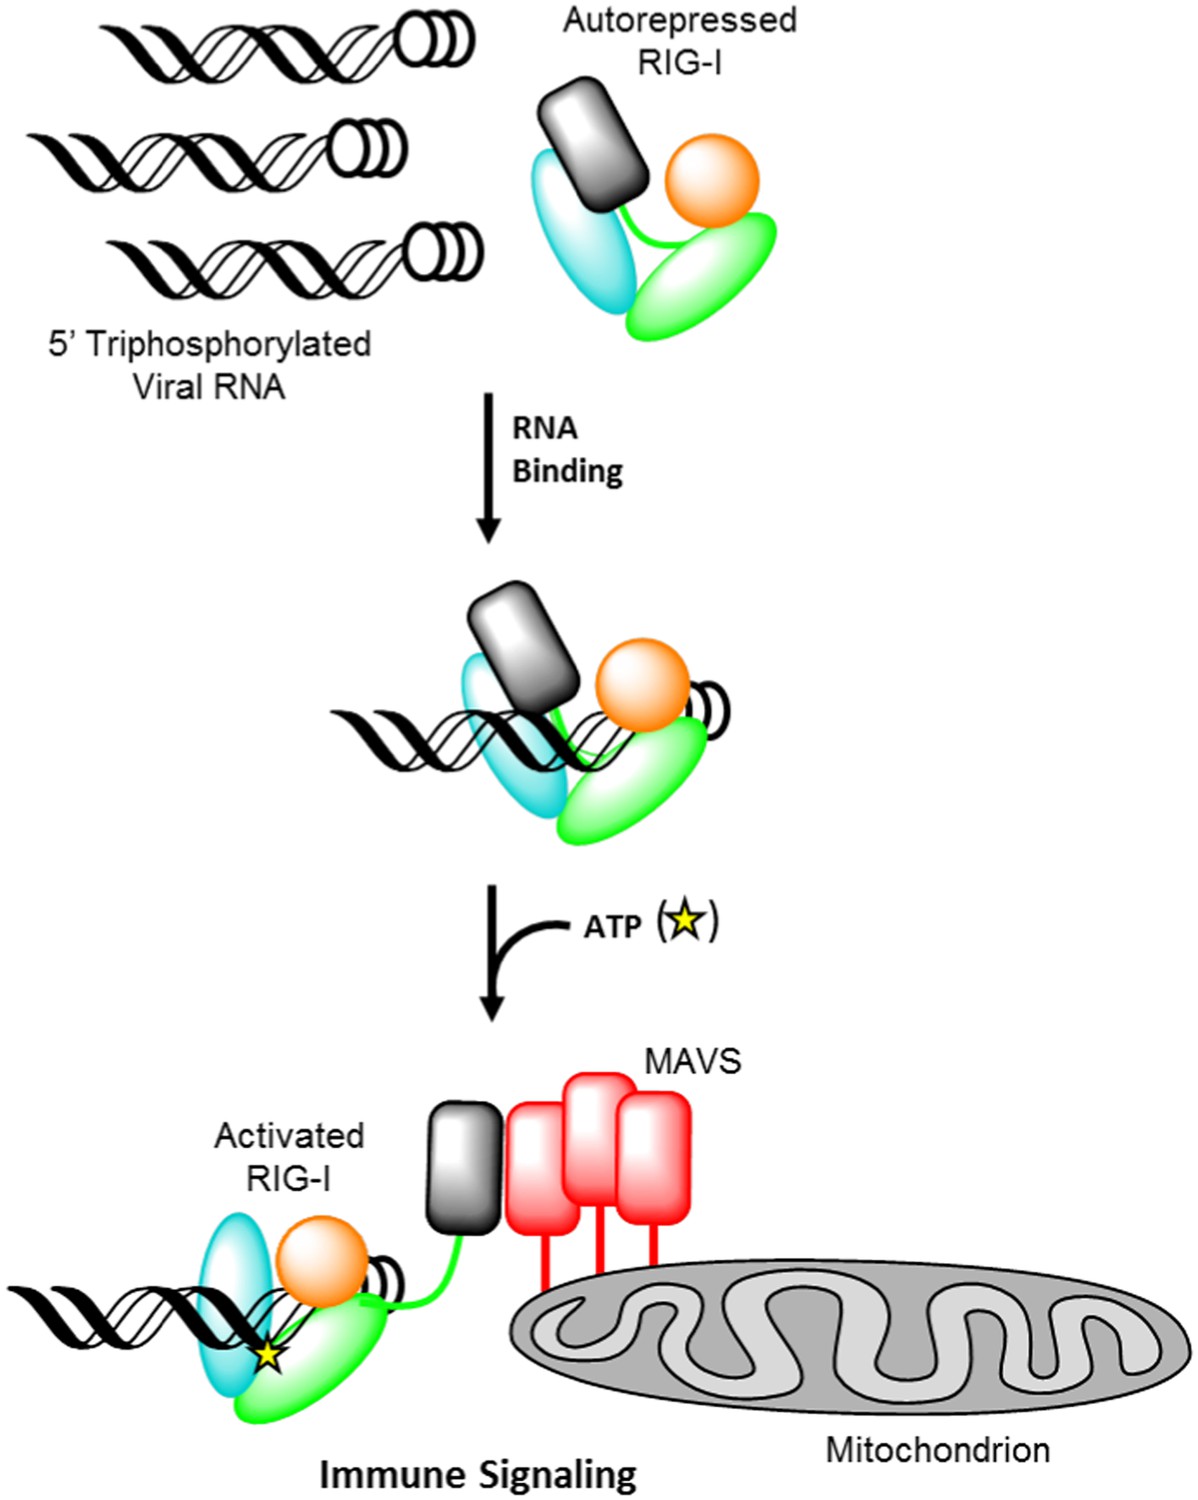
Retinoic acid-inducible gene I (RIG-I) signaling activation by viral ribonucleic acid (RNA).
The RIG-I protein is comprised of four major domain groups including the caspase activation and recruitment domains (CARDs) (black), and RNA-stimulated ATPase core (green), a helical regulatory and binding domain inserted into the second lobe of the ATPase called HEL2i (cyan), and a triphosphate recognition and RNA binding domain at the c-terminus annotated the C-terminal domain (CTD) (orange). RIG-I is normally present in cells in an autorepressed conformation with the CARDs stacked against the HEL2i domain. Upon infection by a subset of RNA and DNA viruses, RIG-I binds 5′ triphosphorylated duplex termini of viral RNA (black helix with three white circles) deposited or transcribed in the cytoplasm. RNA binding stimulates ATP (yellow star) binding and hydrolysis by RIG-I to ADP (yellow triangle). At some point in this process, RIG-I becomes competent to engage an immune signaling response through an interaction with the adaptor protein MAVS (red), however the determinant step for signaling has not been conclusively demonstrated. Thus, the transition of RIG-I from autorepressed to signaling competent may occur at the stage of RNA binding, ATP binding, or ATP hydrolysis, and this is denoted here with aroows bearing question markes leading from each stage in RNA-stimulated ATPase activity to the immune signaling interaction.
Figure 2 with 1 supplement
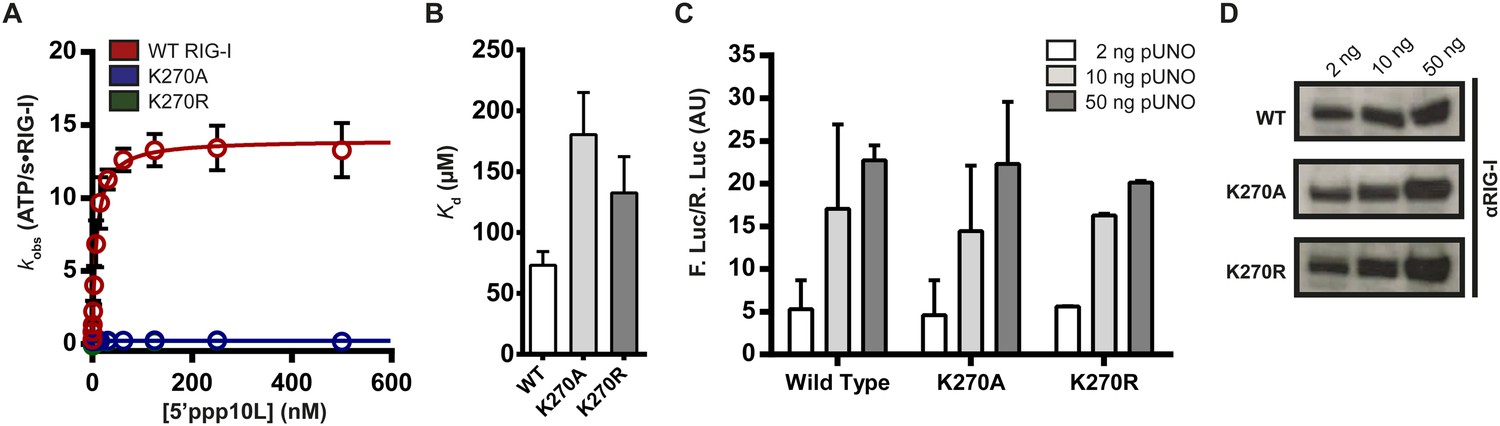
Walker A mutant RIG-I can induce IFN-β production in cells.
(A) Steady state ATP hydrolysis by wild type, K270A and K270R RIG-I proteins stimulated with varying concentrations of the RNA hairpin 5′ppp10L. (B) Extrapolated dissociation constants for MANT-ATP binding by wild type and mutant RIG-I proteins bound to 5′ppp10L. (C) IFN-β induction in HEK 293T cells transfected with the indicated amount of the constitutive expression plasmid pUNO-hRIG-I containing either wild type or mutant RIG-I constructs. Cells expressing the indicated construct were challenged by transfection of 5′ppp10L. (D) Anti-RIG-I Western blot from HEK cell lysates. Plotted values are mean ± SD (n = 3).
Figure 2—figure supplement 1

Determining association rate constants for MANT-ATP binding by Wild Type and Lysine 270 mutant RIG-I.
(A–C) An average of four traces monitoring the association of (A) 1 μM WT RIG-I/5′ppp10L (red) or 1 μM WT RIG-I/5′ppp30L (black) (B) 1 μM K270A/5′ppp10L (blue) and (C) 1 μM K270R/5′ppp10L (green) and 160 μM MANT-ATP. Data were fit to a double exponential equation to obtain an association rate constant kobs, with kobs = k1, as this corresponds to the initial binding event between the protein and MANT-ATP. (D–F) Average linear fit of (MANT-ATP) vs kobs for (D) WT RIG-I bound to 5′ppp10L (red) or 5′ppp30L (black), (E) K270A RIG-I bound to 5′ppp10L (blue) and (C) K270R bound to 5′ppp10L showing the (MANT-ATP) dependence of the observed rate constants. Plotted kobs values are mean ± SD (n = 3). The kon (slope) and koff (intercept) values were derived from three independent trials and averaged. Using these values (koff/kon), a Kd was calculated for each protein/RNA combination. WT RIG-I/5′ppp10L: koff = 110.0 ± 6, kon = 1.5 ± 0.2, Kd(calc.) = 72 ± 4 μM. WT RIG-I/5′ppp30L: koff = 154.0 ± 7, kon = 1.1 ± 0.2, Kd(calc.) = 136 ± 6 μM. K270A/5′ppp10L: koff = 140.2 ± 6, kon = 0.77 ± 0.1, Kd(calc.) = 183 ± 8 μM. K270R/5′ppp10L: koff = 129.9 ± 31, kon = 1.0 ± 0.2, Kd(calc.) = 130 ± 30 μM. (G) Steady state ATP hydrolysis by wild type RIG-I bound to 5′ppp10L stimulated with varying concentrations of MANT-ATP. kcat = 3.9 ± 0.2 s−1, KM, ATP = 115 ± 25 μM.
Figure 3 with 2 supplements
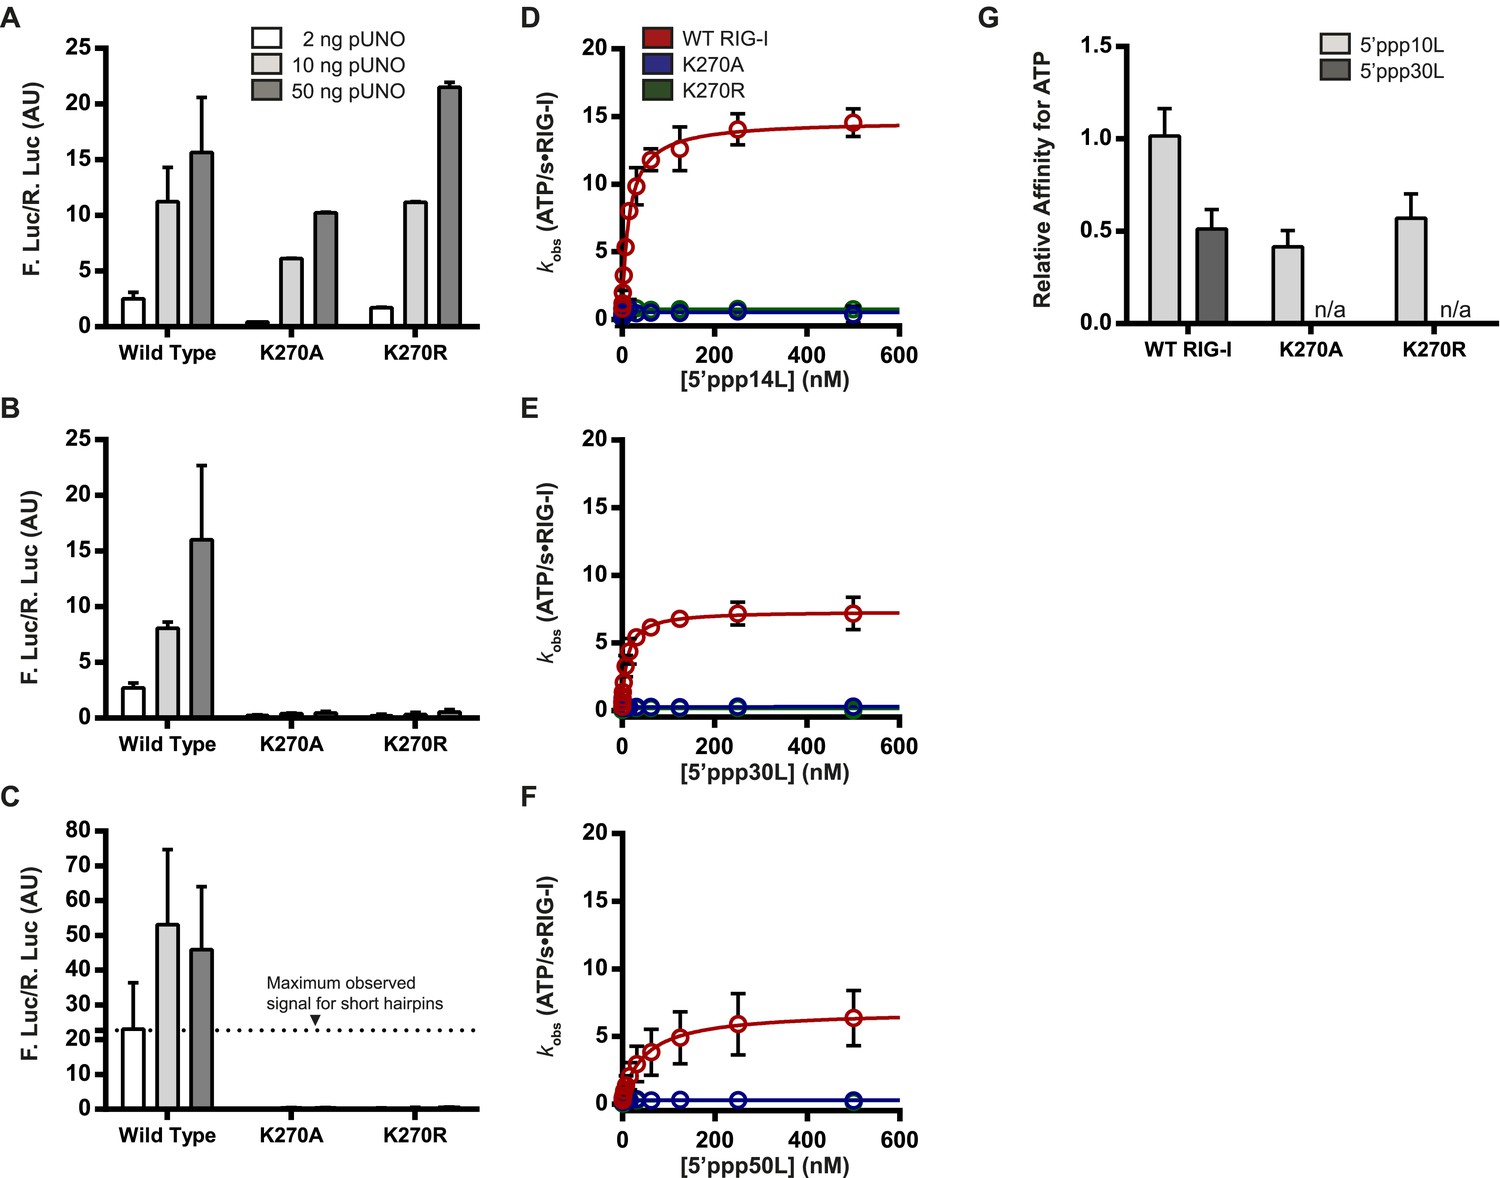
The requirement for ATP in IFN-β promoter induction is ligand dependent.
(A–C) IFN-β induction in HEK 293T cells transfected with the indicated amount of the constitutive expression plasmid pUNO-hRIG-I containing either WT or mutant RIG-I constructs. Cells expressing the indicated construct were challenged by transfection of (A) 5′ppp14L, (B) 5′ppp30L, or (C) 5′ppp50L. (D–F) Steady state ATP hydrolysis by wild type and mutant RIG-I proteins stimulated with varying concentrations of the RNA hairpin (D) 5′ppp14L, (E) 5′ppp30L, or (F) 5′ppp50L. (G) Relative affinities for MANT-ATP binding by wild type and mutant RIG-I proteins bound in the context of 5′ppp10L, 5′ppp30L normalized to WT RIG-I bound to 5′ppp10L (Figure 1B). Plotted values are mean ± SD (n = 3).
Figure 3—figure supplement 1

RIG-I forms multimers on 5′ppp50L at high protein concentrations.
An EMSA showing RIG-I binding to 5′ppp50L. Lane 1 contains 100 nM RNA, and lanes 2–5 contain wild type RIG-I incubated with 100 nM RNA at concentrations ranging from 100 nM to 1 μM. Multimer formation is demonstrated by the slower mobility bands (denoted 2:1 and 3:1) that evolve at higher protein concentrations.
Figure 3—figure supplement 2
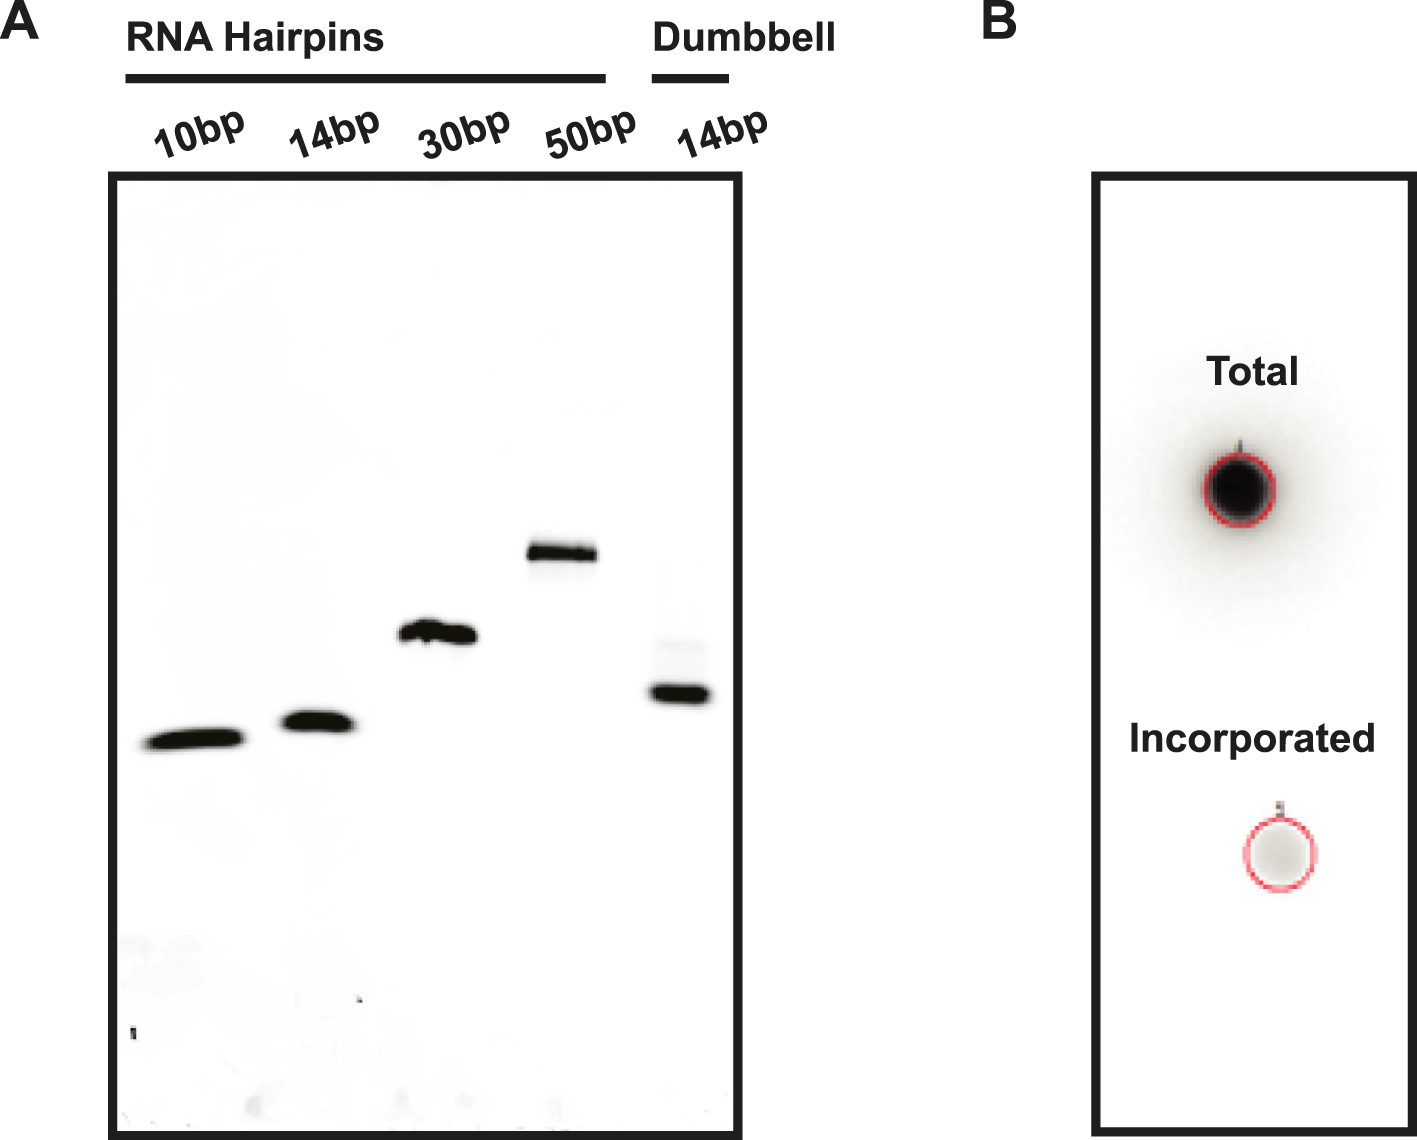
Assessment of RNA quality.
(A) RNA hairpins and the RNA dumbbell were run on a native polyacrylamide gel to visualize sample purity. (B) A 5′ end labeling reaction was performed on the RNA dumbbell in order to demonstrate complete ligation (see ‘Materials and methods’). A total of 2–5% incorporation of [32P-γ] ATP was observed (lower spot) based on radioactive signal retention normalized to an unwashed control (upper spot). This indicates that the ligation reaction and subsequent purification yielded 95–98% pure RNA dumbbell.
Figure 4
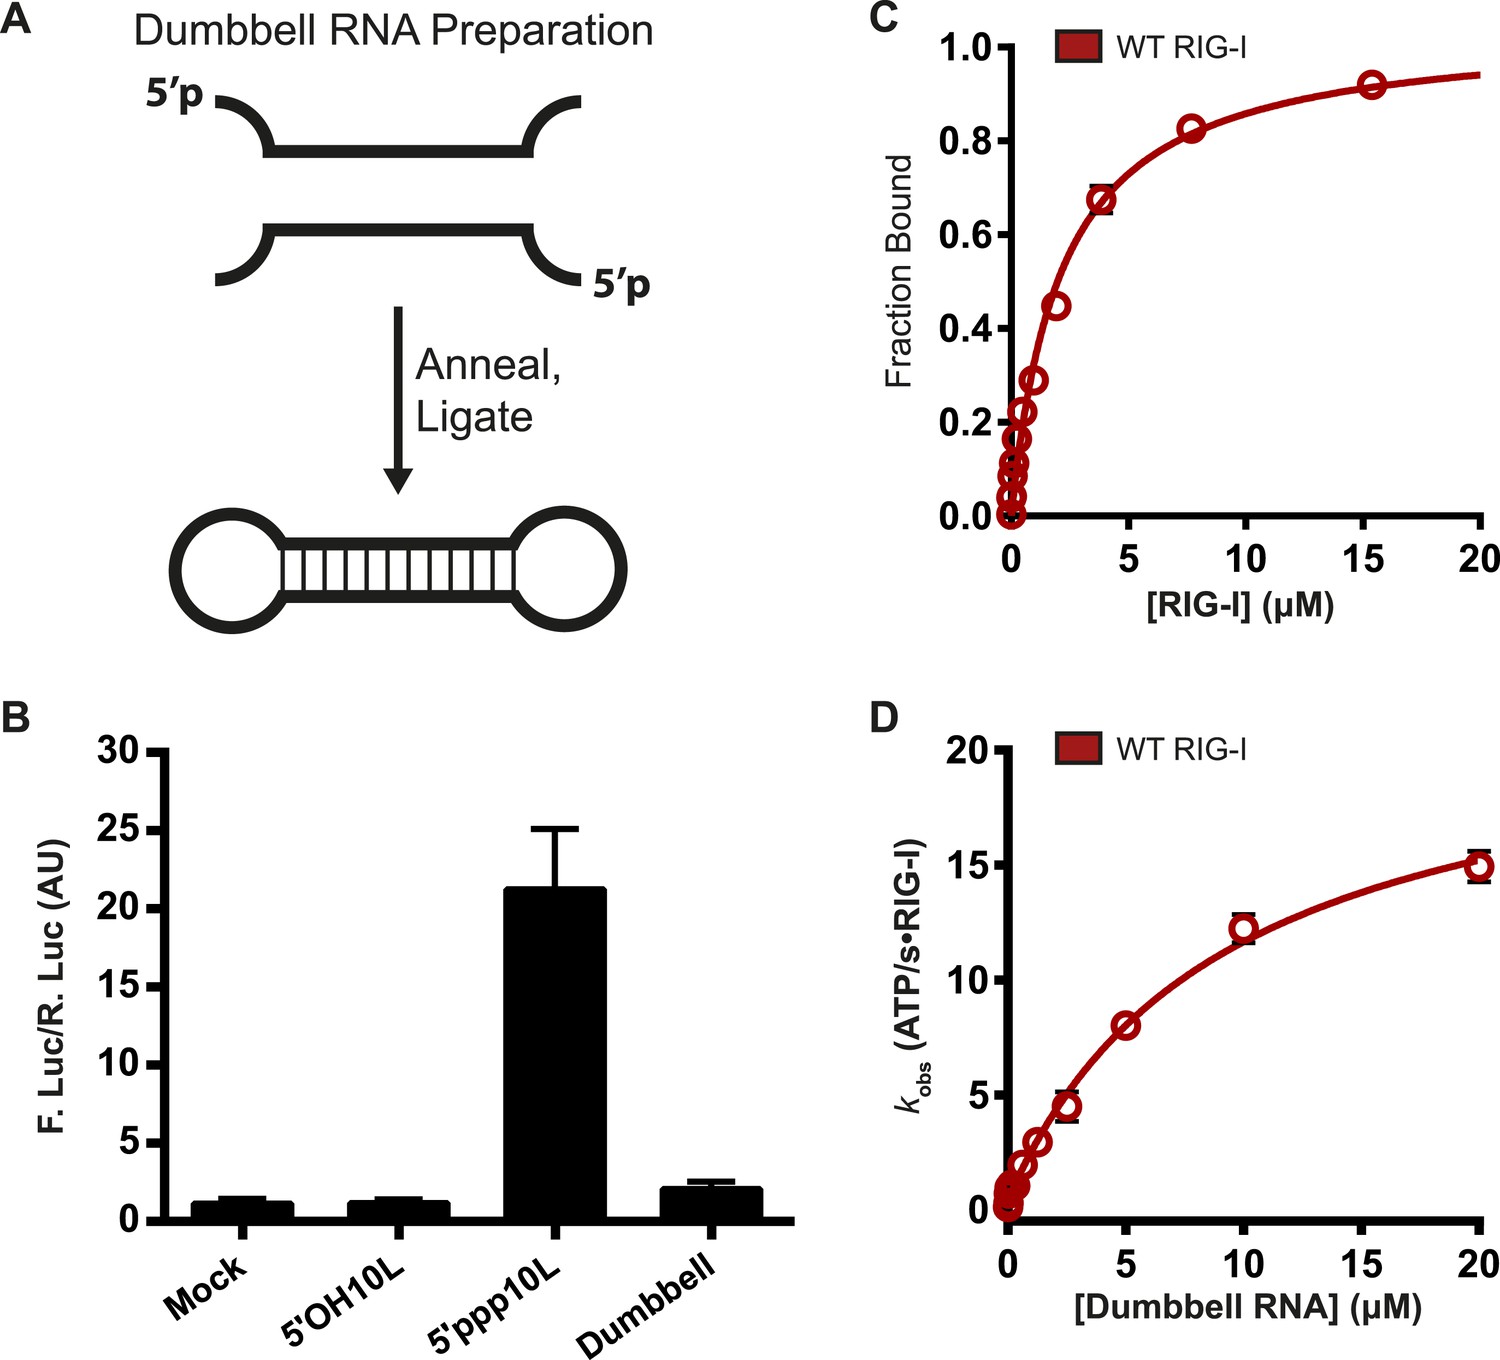
RIG-I cannot signal from internal sites.
(A) Schematic representation of RNA dumbbell synthesis. (B) IFN-β induction of WT RIG-I in HEK-293T cells challenged with 5′OH10L, 5′ppp10L, and the RNA dumbbell. (C) Equilibrium binding of RIG-I to the RNA dumbbell. The fraction bound RNA dumbbell is plotted agaings protein concentration. Values are mean ± SD (n = 3). (D) Steady state ATP hydrolysis by wild type RIG-I stimulated with varying concentrations of the RNA dumbbell. Data were fit to the Brigg–Haldane equation yielding values of kcat = 21.6 ± 1.4 s−1, KM, RNA dumbell = 9.3 ± 1.4 μM. Plotted values are mean ± SD (n = 3).
Figure 5 with 1 supplement
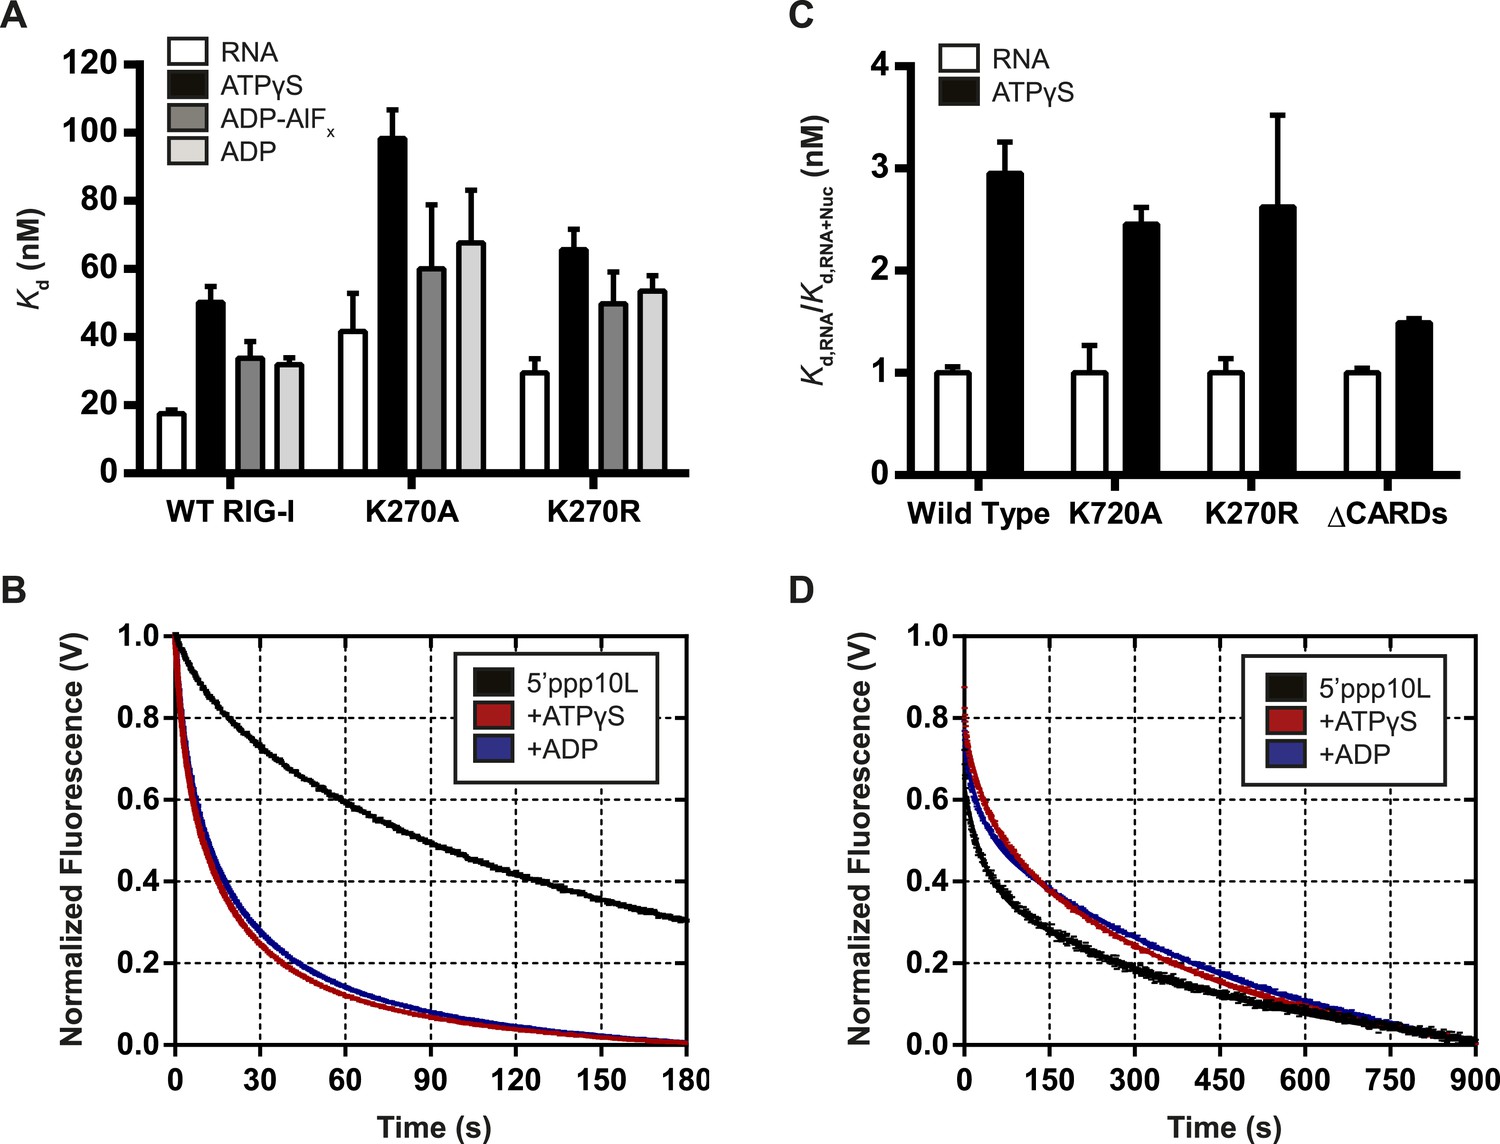
Nucleotide binding stimulates ligand dissociation in a CARDs-dependent manner.
(A) Equilibrium dissociation constants for WT and mutant RIG-I binding to the fluorescent RNA hairpin 5′OH10L measured in the absence of nucleotide (denoted RNA), or in the presence of saturating ATPγS, ADP-AlF4, or ADP. (B) koff traces for WT RIG-I. Four traces monitoring displacement of RIG-I from 5′ppp10L (black) were averaged and fit to a double exponential equation. Also shown are koff traces in the presence of 3 mM ATPγS (blue) and 3 mM ADP (red). (C) Relative dissociation constants for 5′OH10L binding by WT K270A, K270R, and ΔCARDs RIG-I proteins in the absence (RNA) or presence of saturating ATPγS normalized to RNA. (D) koff traces for RIG-I ΔCARDs performed as in (B) in the absence of nucleotide (black) or in the presence of ATPγS (red) or ADP (blue). Plotted values are mean ± SD (n = 3).
Figure 5—figure supplement 1
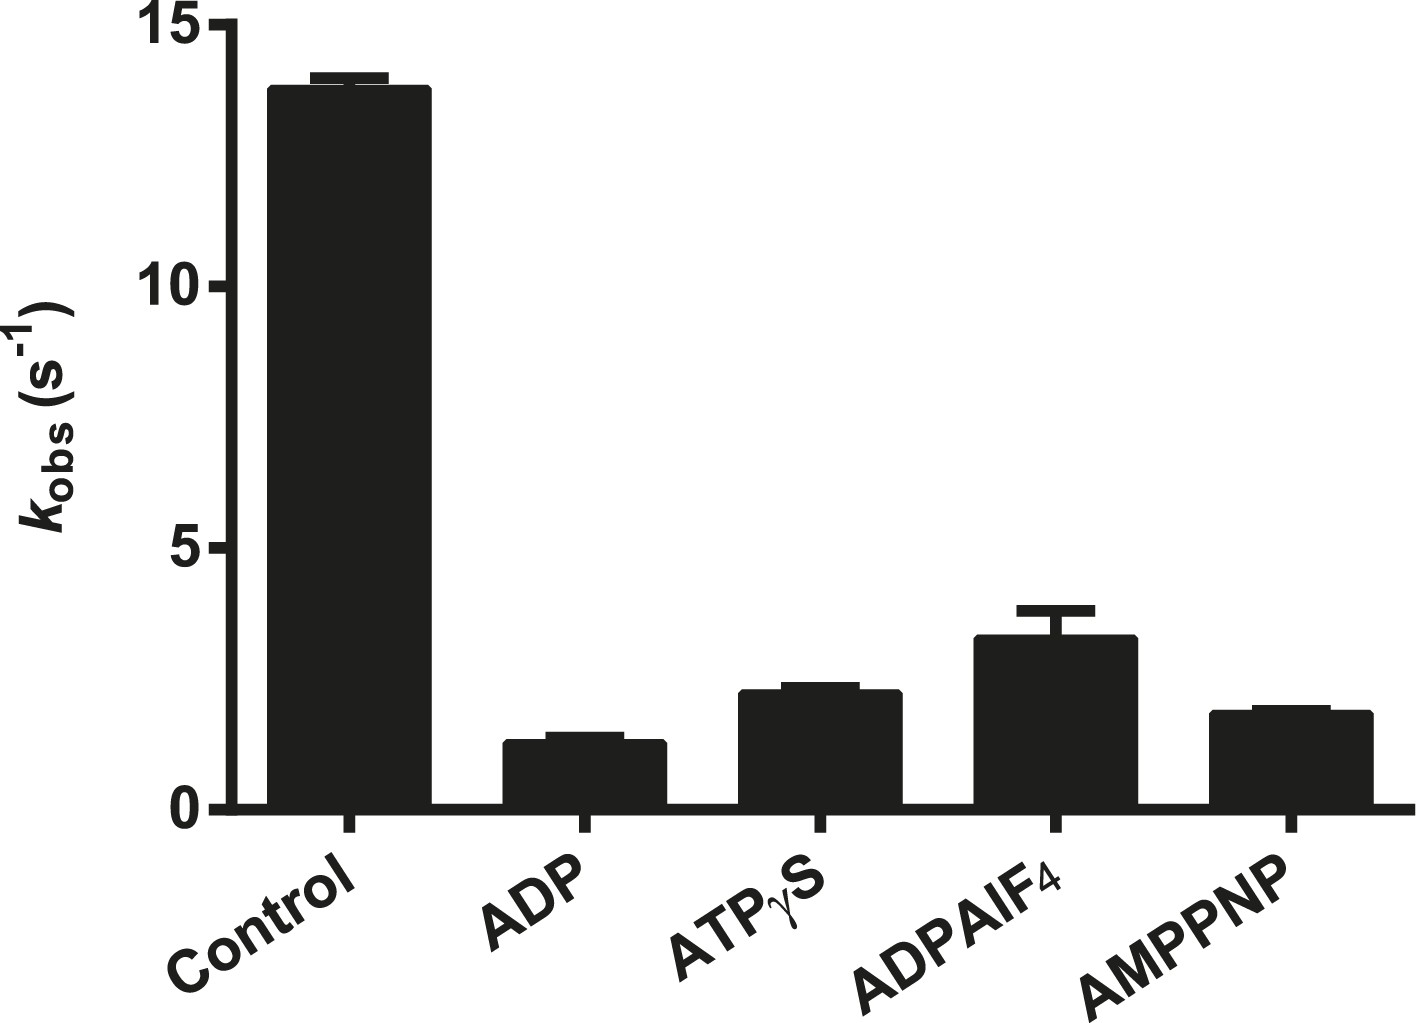
Effect of nucleotide analogs on the ATPase activity of RIG-I.
The relative rates of ATP hydrolysis (kobs [with nucleotide]/kobs [without nucleotide]) by RIG-I in the presence of ADP, ATPγS, ADP-AlF4, and AMP-PNP determined using saturating RNA and ATP concentrations. Plotted values are mean ± SD (n = 2).
Figure 6
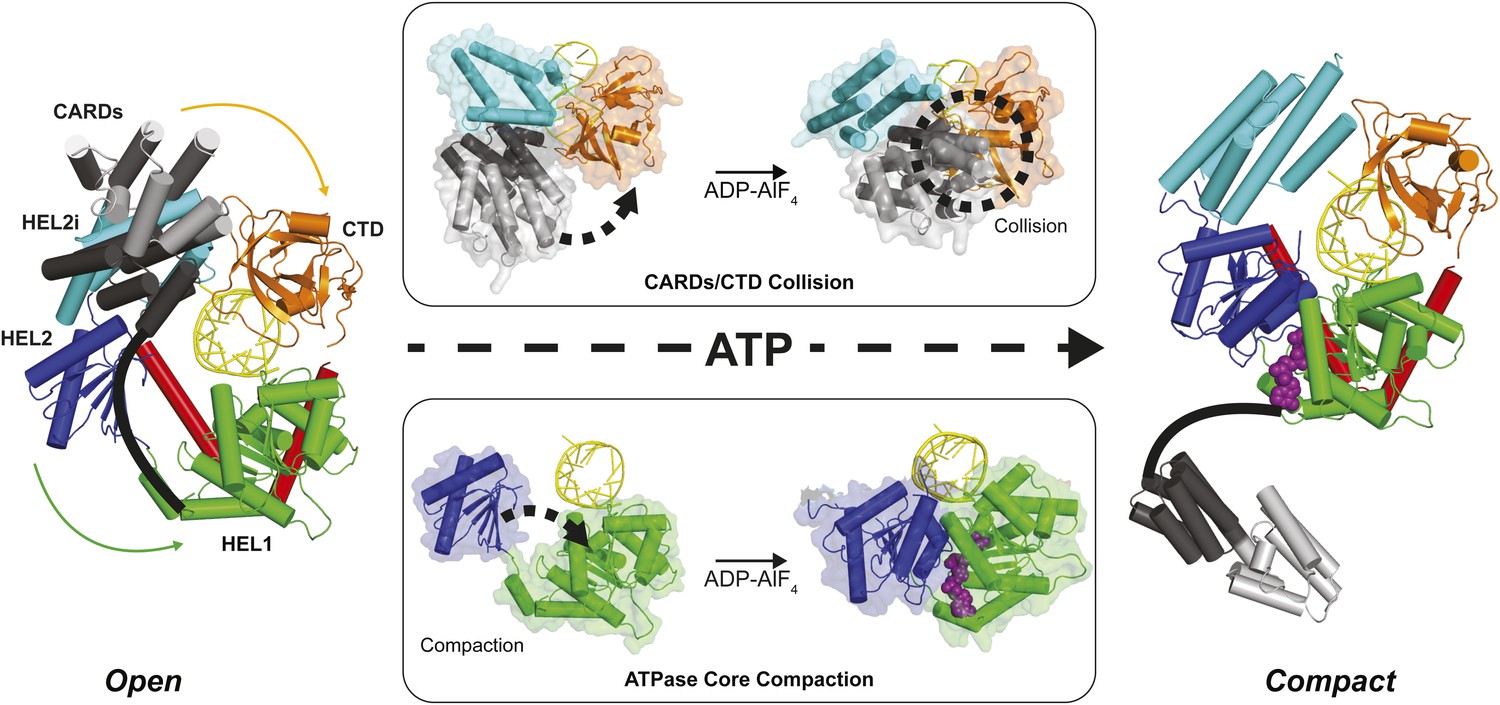
Structural description of a nucleotide-mediated collision between the CARDs and CTD of RIG-I.
(Left) Structural model of RIG-I in an ‘Open’ conformation produced by docking the CARDs of full-length duck RIG-I (PDB: 4A2W) to human RIG-I bound to the hairpin 5′ppp8L (PDB: 4AY2) by alignment of the HEL2i domains. (Right) Structural model of RIG-I in a ‘Compact’ conformation produced by alignment of the CARDs, CTD and RNA from the ‘Open’ model to the HEL1, HEL2, HEL2i and Pincer domains of RIG-I bound to ADP-AlF4 (PDB: 4A36). The middle panels show van der Waals surface representations demonstrating motions in the HEL2i/CARDs relative to the CTD that result in a steric collision (Top) and motions in the HEL1 and HEL2 domains of the ATPase core (Bottom) that take place upon nucleotide-mediated compaction. CARDs are shown black/gray; HEL1, green; HEL2, blue; HEL2i, cyan; Pincer, red; CTD, orange; RNA, yellow; and ADP-AlF4 as purple spheres.
Figure 7
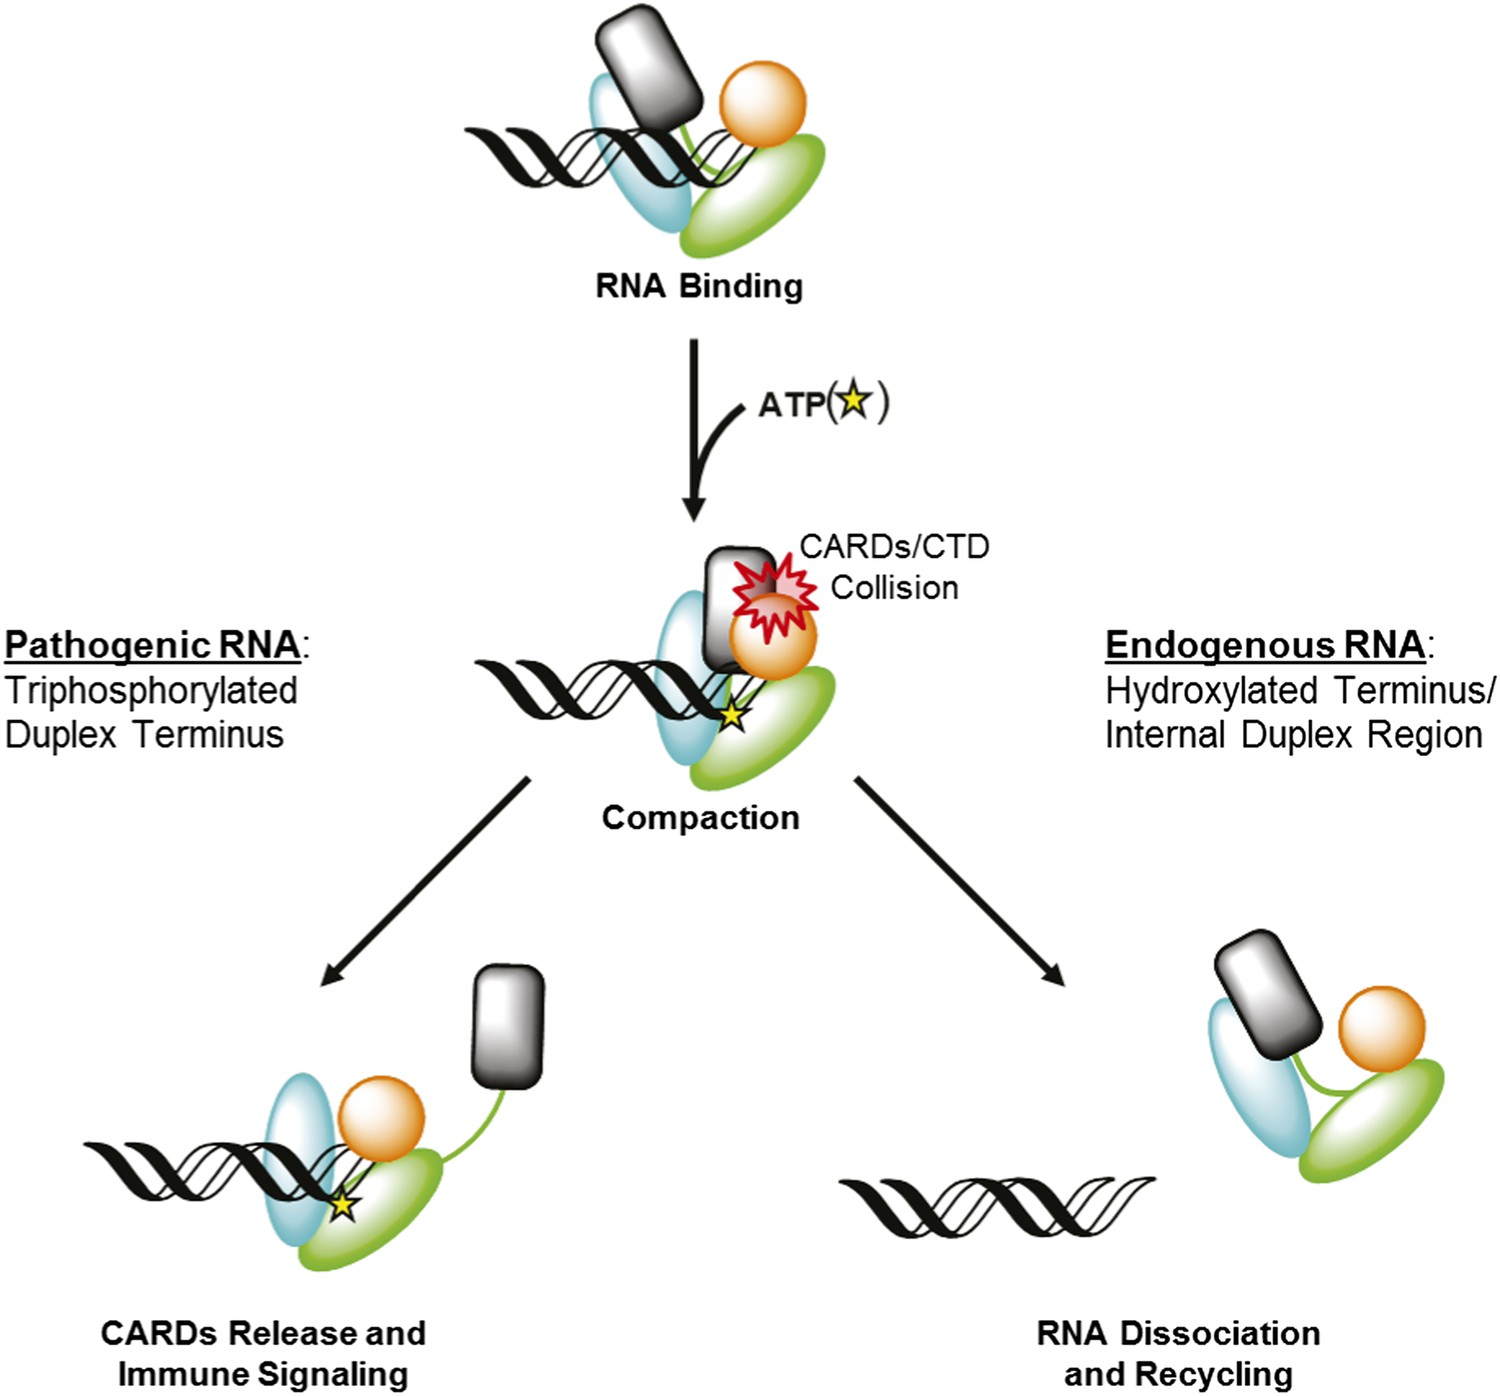
RIG-I uses ATP-mediated compaction as signaling trigger and a proofreading mechanism.
RIG-I surveys the cytoplasm in an auto-repressed conformation, with the signaling CARDs (black) sequestered through an interaction with the HEL2i domain (cyan). Duplex RNA binding by RIG-I induces the formation of an active site pocket in the helicase core (green), which allows the protein to bind ATP (yellow star). ATP binding causes the domains of RIG-I to compact, bringing the CARDs into a steric collision with the CTD (orange). If the CTD is engaged in a high-affinity interaction with a triphosphorylated duplex terminus (as in viral RNA), this collision disengages the CARDS from the HEL2i domain, making them available for immune signaling (left). If the CTD is engaged in a low-affinity interaction with a hydroxylated terminus or internal duplex binding site, the CARDs/CTD collision destabilizes RNA binding by RIG-I, resulting in dissociation and recycling (right).
Author response image 1
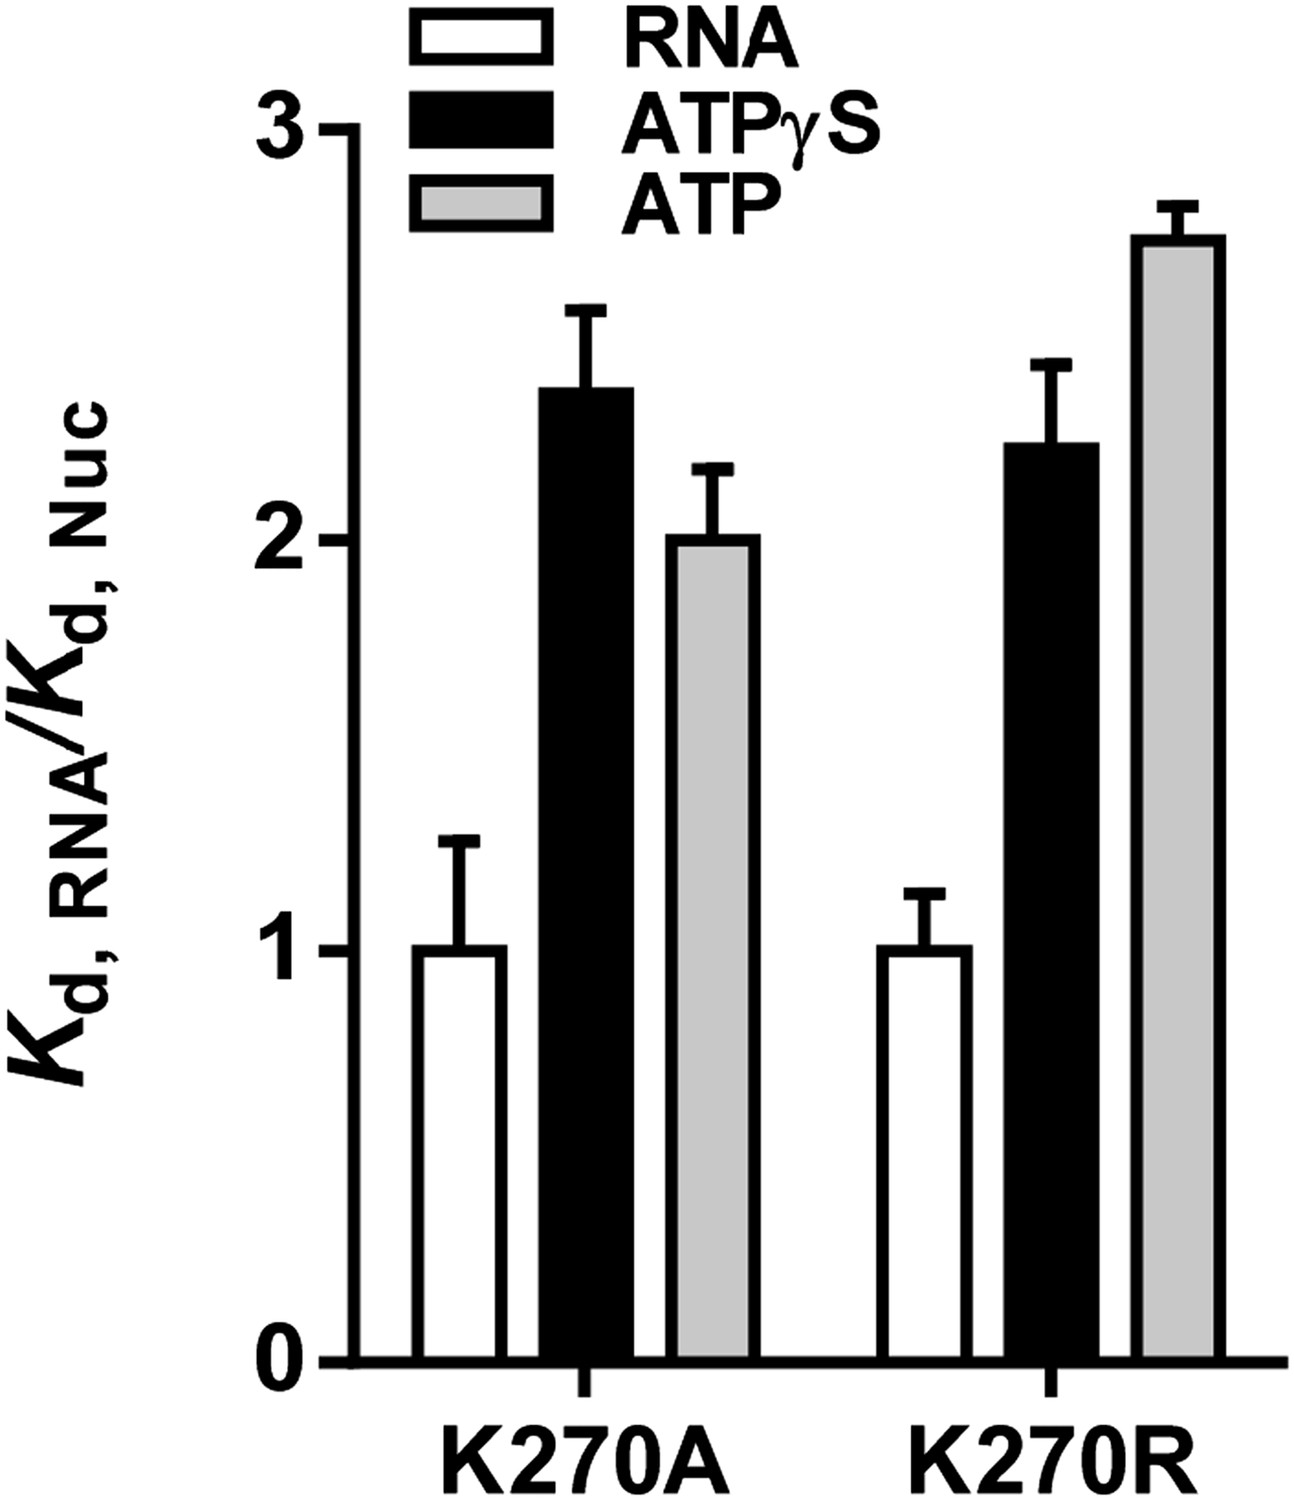
Relative equilibrium binding affinities of Walker A mutant RIG-I for 5’OH10L in the absence of nucleotide (RNA), or with ATP or ATPγS. All affinities are normalized to mean RNA-only affinity. Error bars represent standard deviation (n=3).
Author response image 2
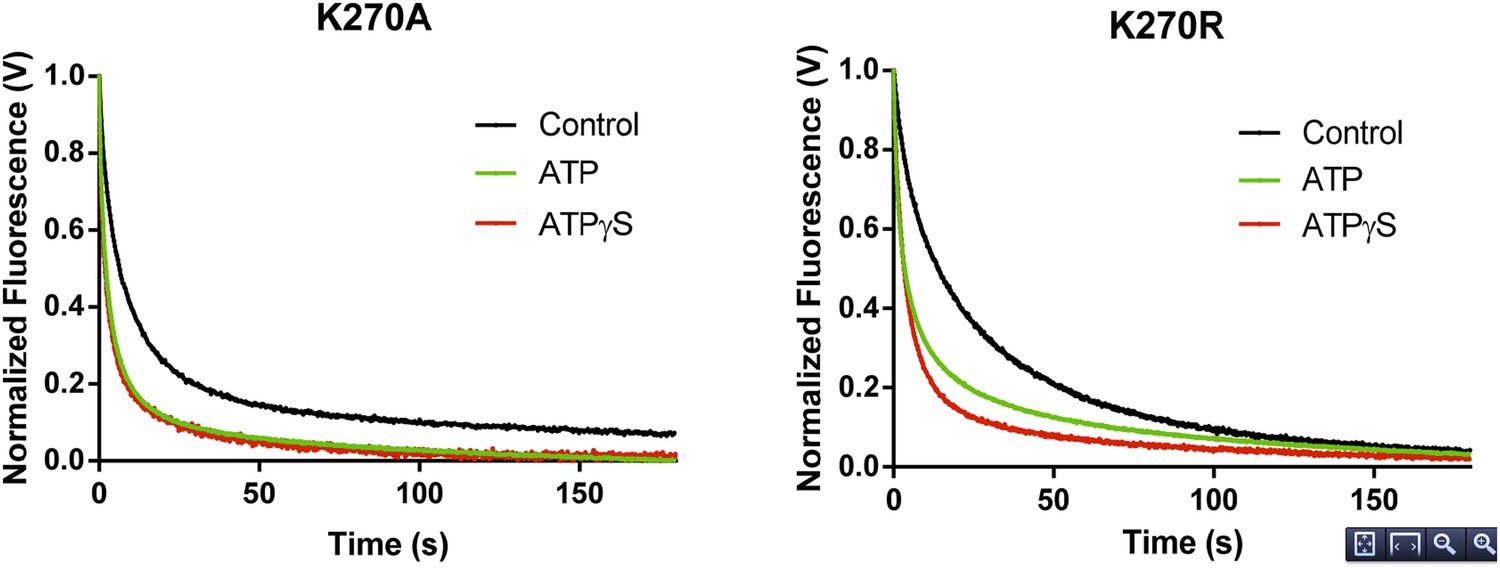
RNA dissociation rate constant determination of Walker A mutant RIG-I from 5’ppp10L in the absence (Control, black) or presence of ATP (green) or ATPγS (red). Traces represent an average over 4-6 trials.
Tables
Table 1
Measured physical and biochemical constants
| Construct | WT RIG-I | K270A | K270R | ΔCARDs |
|---|---|---|---|---|
| Steady-state ATPase activity | ||||
| 5′ppp10L | ||||
| kcat (ATP/RIG-I•s) | 14.1 ± 0.4 | inactive | inactive | – |
| KM, RNA (nM) | 8.0 ± 1.0 | inactive | inactive | – |
| 5′ppp14L | ||||
| kcat (ATP/RIG-I•s) | 14 ± 0.3 | inactive | inactive | – |
| KM, RNA (nM) | 15 ± 1.4 | inactive | inactive | – |
| 5′ppp30L | ||||
| kcat (ATP/RIG-I•s) | 7.0 ± 0.2 | inactive | inactive | – |
| KM, RNA (nM) | 11 ± 1.4 | inactive | inactive | – |
| 5′ppp50L | ||||
| kcat (ATP/RIG-I•s) | 6.5 ± 0.5 | inactive | inactive | – |
| KM, RNA (nM) | 50 ± 16 | inactive | inactive | – |
| Dumbbell | ||||
| kcat (ATP/RIG-I•s) | 21 ± 1.0 | – | – | – |
| KM, RNA (μM) | 9.3 ± 1.4 | – | – | – |
| Maximum IFN-β production | ||||
| 5′ppp10L (Firefly Luc/Renilla Luc) | 23 ± 1.8 | 22 ± 7.3 | 20 ± 0.2 | – |
| 5′ppp14L (Firefly Luc/Renilla Luc) | 16 ± 5 | 10 ± 0.1 | 21 ± 0.5 | – |
| 5′ppp30L (Firefly Luc/Renilla Luc) | 16 ± 7 | 0.5 ± 0.2 | 0.5 ± 0.2 | – |
| 5′ppp50L (Firefly Luc/Renilla Luc) | 46 ± 18 | 0.4 ± 0.1 | 0.6 ± 0.1 | – |
| 5′OH10L (Firefly Luc/Renilla Luc) | 3.7 ± 1.1 | 3.2 ± 0.1 | 8.9 ± 0.4 | – |
| Dumbbell (Firefly Luc/Renilla Luc) | 2.1 ± 0.5 | – | – | – |
| MANT-ATP binding | ||||
| 5′ppp10L (μM) | 72 ± 4 | 183 ± 8 | 130 ± 30 | – |
| 5′ppp30L (μM) | 136 ± 6 | – | – | – |
| Equilibrium RNA binding | ||||
| 5′OH10L (nM) | ||||
| no nucleotide | 17 ± 1.0 | 42 ± 11 | 30 ± 4 | 19 ± 1.0 |
| with ATP | – | 83 ± 7 | 82 ± 2 | – |
| with ATPγS | 50 ± 5.0 | 98 ± 8.4 | 66 ± 6.1 | 28 ± 0.7 |
| with ADP-AlF4 | 34 ± 4.9 | 60 ± 19 | 50 ± 9.0 | 21 ± 3.3 |
| with ADP | 32 ± 2.0 | 68 ± 16 | 53 ± 4.6 | 24 ± 2.3 |
| Dumbbell (μM) | 2.1 ± 0.2 | – | – | – |
-
Physical and biochemical constants for binding, catalysis, and cell-based signaling assays performed for wild type, Walker A-mutant, and ΔCARDs truncation constructs of RIG-I. Values represent mean ± SD (n = 3). See ‘Materials and methods’ for details of the experimental setups and data analysis used in each assay.
-
CARDs, caspase activation and recruitment domains; RNA, ribonucleic acid.
Table 2
RNA dissociation rate constants for WT and mutant RIG-I
| Protein | Nucleotide | k1 (× 10−3 s−1) | Amplitude | k2 (× 10−3 s−1) | Amplitude |
|---|---|---|---|---|---|
| WT RIG-I | None | 28 ± 13 | 25% | 4 ± 0.2 | 75% |
| ATPγS | 187 ± 3 | 45% | 26 ± 0.4 | 55% | |
| ADP | 187 ± 3 | 40% | 25 ± 0.3 | 60% | |
| K270A | None | 108 ± 1 | 80% | 5.3 ± 0.1 | 20% |
| ATP | 327 ± 2 | 79% | 25 ± 0.3 | 21% | |
| ATPγS | 390 ± 3 | 75% | 35 ± 0.4 | 25% | |
| K270R | None | 92.9 ± 1 | 53% | 16 ± 0.1 | 47% |
| ATP | 227 ± 2 | 70% | 14 ± 0.1 | 30% | |
| ATPγS | 224 ± 1 | 81% | 16 ± 0.2 | 19% | |
| ΔCARDs | None | 30.5 ± 0.5 | 34% | 2.1 ± 0.02 | 66% |
| ATPγS | 24.0 ± 0.3 | 27% | 2.2 ± 0.01 | 73% | |
| ADP | 35.3 ± 0.5 | 23% | 1.7 ± 0.01 | 77% |
-
Rate constants for the dissociation of RIG-I proteins measured using stopped-flow fluorescence spectroscopy as described in ‘Materials and methods’. Dissociation was measured from a 5′ppp10L hairpin RNA in all cases. The data were fit to a biphasic exponential decay equation and. Values represent mean ± SD (n = 3).
Author response table 1
RNA dissociation rate constants and equilibrium RNA binding affinities for WT and mutant RIG-I constructs.
| RNA Binding Interference Data | ||||||
|---|---|---|---|---|---|---|
| Protein | Nucleotide | k1 (x 10-3 sec-1) | Amp. | k2 (x 10-3 sec-1) | Amp. | Kd, 5’OH10L |
| WT RIG-I | None | 28 ± 13 | 25% | 4.0 ± 0.2 | 75% | 17 ± 1.0 |
| ATP | 244 ± 3 | 97% | 42 ± 8 | 3% | -- | |
| ADP-AlF4 | 206 ± 3 | 72% | 32 ± 0.6 | 28% | 34 ± 4.9 | |
| ATPγS | 187 ± 3 | 45% | 26 ± 0.4 | 55% | 50 ± 5.0 | |
| ADP | 187 ± 3 | 40% | 25 ± 0.3 | 60% | 32 ± 2.0 | |
| K270A | None | 108 ± 1 | 80% | 5.3 ± 0.1 | 20% | 42 ± 11 |
| ATP | 327 ± 2 | 79% | 25 ± 0.3 | 21% | 83 ±7 | |
| ATPγS | 390 ± 3 | 75% | 35 ± 0.4 | 25% | 98 ± 8.4 | |
| K270R | None | 92.9 ± 1 | 53% | 16 ± 0.1 | 47% | 30 ± 4 |
| ATP | 227 ± 2 | 70% | 14 ± 0.1 | 30% | 82 ± 2 | |
| ATPγS | 224 ± 1 | 81% | 16 ± 0.2 | 19% | 66 ± 6.1 | |
| ΔCARDs | None | 31 ± 0.5 | 34% | 2.1 ± 0.02 | 66% | 19 ± 1.0 |
| ATP | 27 ± 0.2 | 30% | 1.2 ± 0.01 | 70% | -- | |
| ATPγS | 24 ± 0.3 | 27% | 2.2 ± 0.01 | 73% | 28 ± 0.7 | |
| ADP | 35 ± 0.5 | 23% | 1.7 ± 0.01 | 77% | 24 ± 2.3 | |
Additional files
-
Supplementary file 1
Sequences of RNA ligands used in this study. All RNA ligands and the sites of pertinent modifications are shown with the corresponding shorthand designation for each RNA.
- https://doi.org/10.7554/eLife.09391.021
Download links
A two-part list of links to download the article, or parts of the article, in various formats.
Downloads (link to download the article as PDF)
Open citations (links to open the citations from this article in various online reference manager services)
Cite this article (links to download the citations from this article in formats compatible with various reference manager tools)
Establishing the role of ATP for the function of the RIG-I innate immune sensor
eLife 4:e09391.
https://doi.org/10.7554/eLife.09391


