Cell crowding activates pro-invasive mechanotransduction pathway in high-grade DCIS via TRPV4 inhibition and cell volume reduction
- Department of Anatomy and Cell Biology, School of Medicine and Health Sciences, George Washington University, United States
- Thomas Jefferson High School for Science and Technology, United States
- Department of Pathology, George Washington Medical Faculty Associates, United States
- Department of Surgery, George Washington Medical Faculty Associates, United States
- Department of Biomedical Engineering, GW School of Engineering and Applied Science, George Washington University, United States
Figures
Figure 1 with 3 supplements
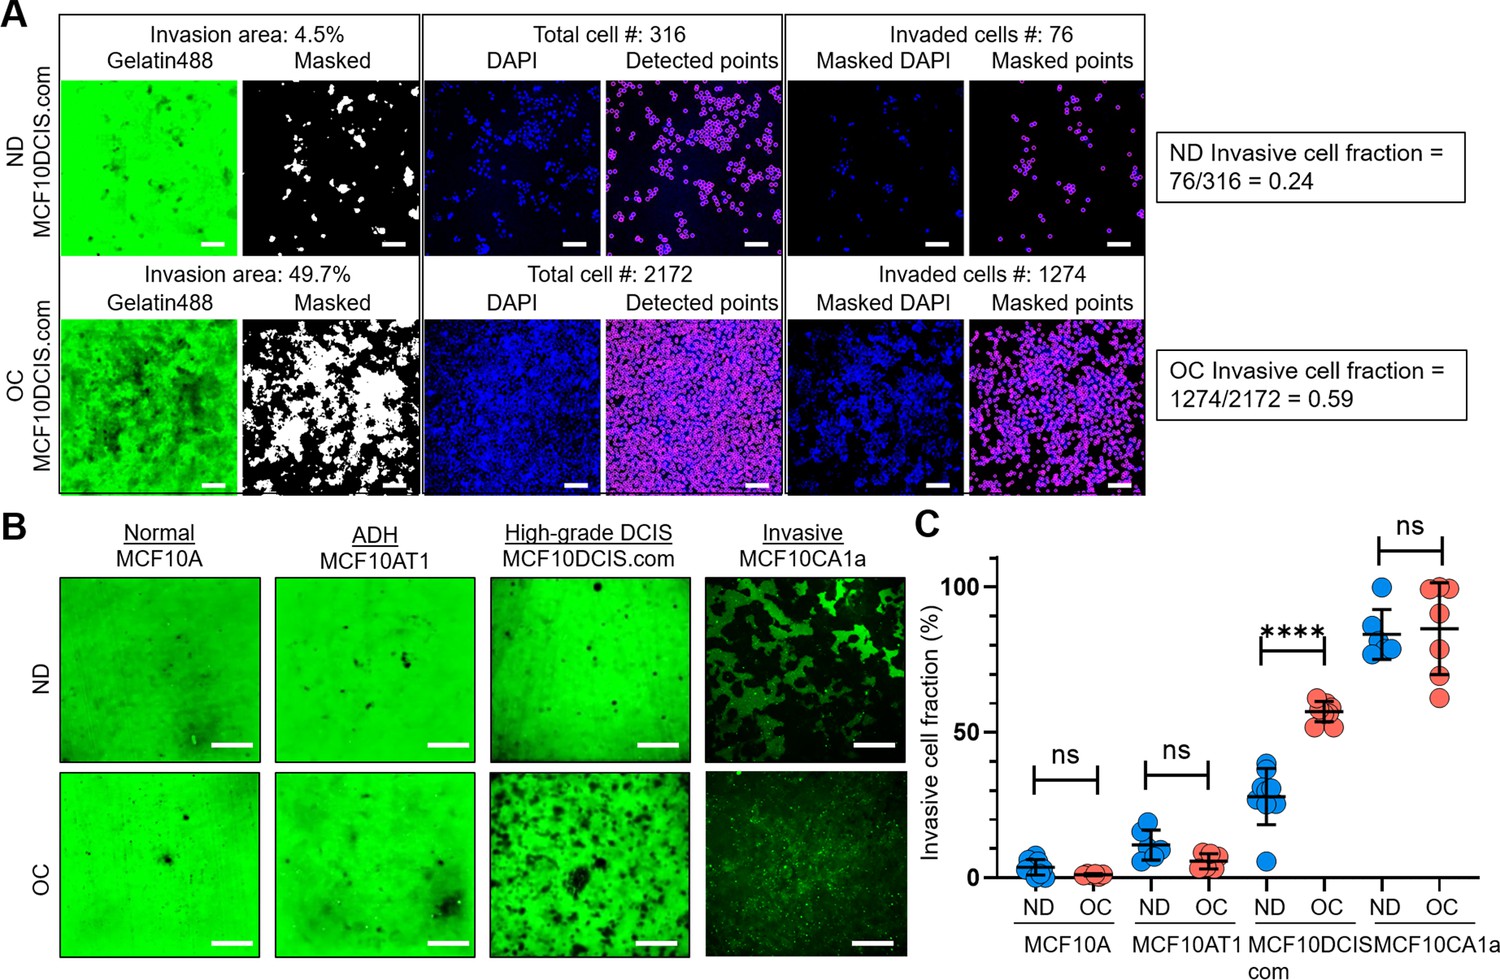
Cell crowding selectively increases invasiveness in high-grade ductal carcinoma in situ (DCIS) cells.
(A) We used a collagen-crosslinked polyacrylamide hydrogel matrix-based invasion assay to assess the effect of cell crowding on cell invasiveness. Representative images show gelatin-Alexa488 conjugates, where dark areas in the green (Gelatin488) background indicate cell invasion through degradation, and DAPI staining marks cell locations (blue; DAPI) in a 2 d invasion assay of MCF10DCIS.com cells under normal density (ND; upper panel) and overconfluent (OC; lower panel) conditions. ‘Masked’ images are thresholded to produce positive masks applied to the ‘DAPI’ images. Individual cell locations detected in ‘DAPI’ images are marked with purple circles in ‘Detected points’ images. The total number of cells within the field of view is counted from these points. By overlaying the mask and DAPI images, ‘Masked DAPI’ images are obtained, and invaded cells are detected and represented by purple circles in ‘Masked points’ images. The invasive cell fraction is calculated by the ratio of the number of invaded cells to the total number of cells (0.24 for ND and 0.59 for OC MCF10DCIS.com cells). These data show that cell invasiveness is enhanced by cell crowding. Scale bar = 100 μm. (B) Comparison of ‘Gelatin488’ images of MCF10A (normal breast epithelial cells), MCF10AT1 (ADH-mimicking cells), MCF10DCIS.com (high-grade DCIS mimic), and MCF10CA1a (invasive breast cancer cells) between ND and OC conditions. MCF10DCIS.com cell invasion is significantly higher under cell crowding than under ND conditions. (C) Invasive cell fractions of these cells between ND (blue circles) and OC (red circles) conditions are compared, showing that cell crowding-induced increases in invasiveness are notable only in MCF10DCIS.com cells. The number of cell invasion analyses was as follows: MCF10A (ND: 10; OC: 7), MCF10AT1 (ND: 6; OC: 6), MCF10DCIS.com (ND: 9; OC: 9), and MCF10CA1a (ND: 6; OC: 7). We used the two-tailed Mann-Whitney U test, a nonparametric and unpaired statistical method, to compare differences between groups. ****p<0.0001, ***p<0.001, **p<0.01, *p<0.05, ns: p>0.05, throughout the manuscript.
-
Figure 1—source data 1
Original data corresponding to panels A and C.
- https://cdn.elifesciences.org/articles/100490/elife-100490-fig1-data1-v1.xlsx
Figure 1—figure supplement 1
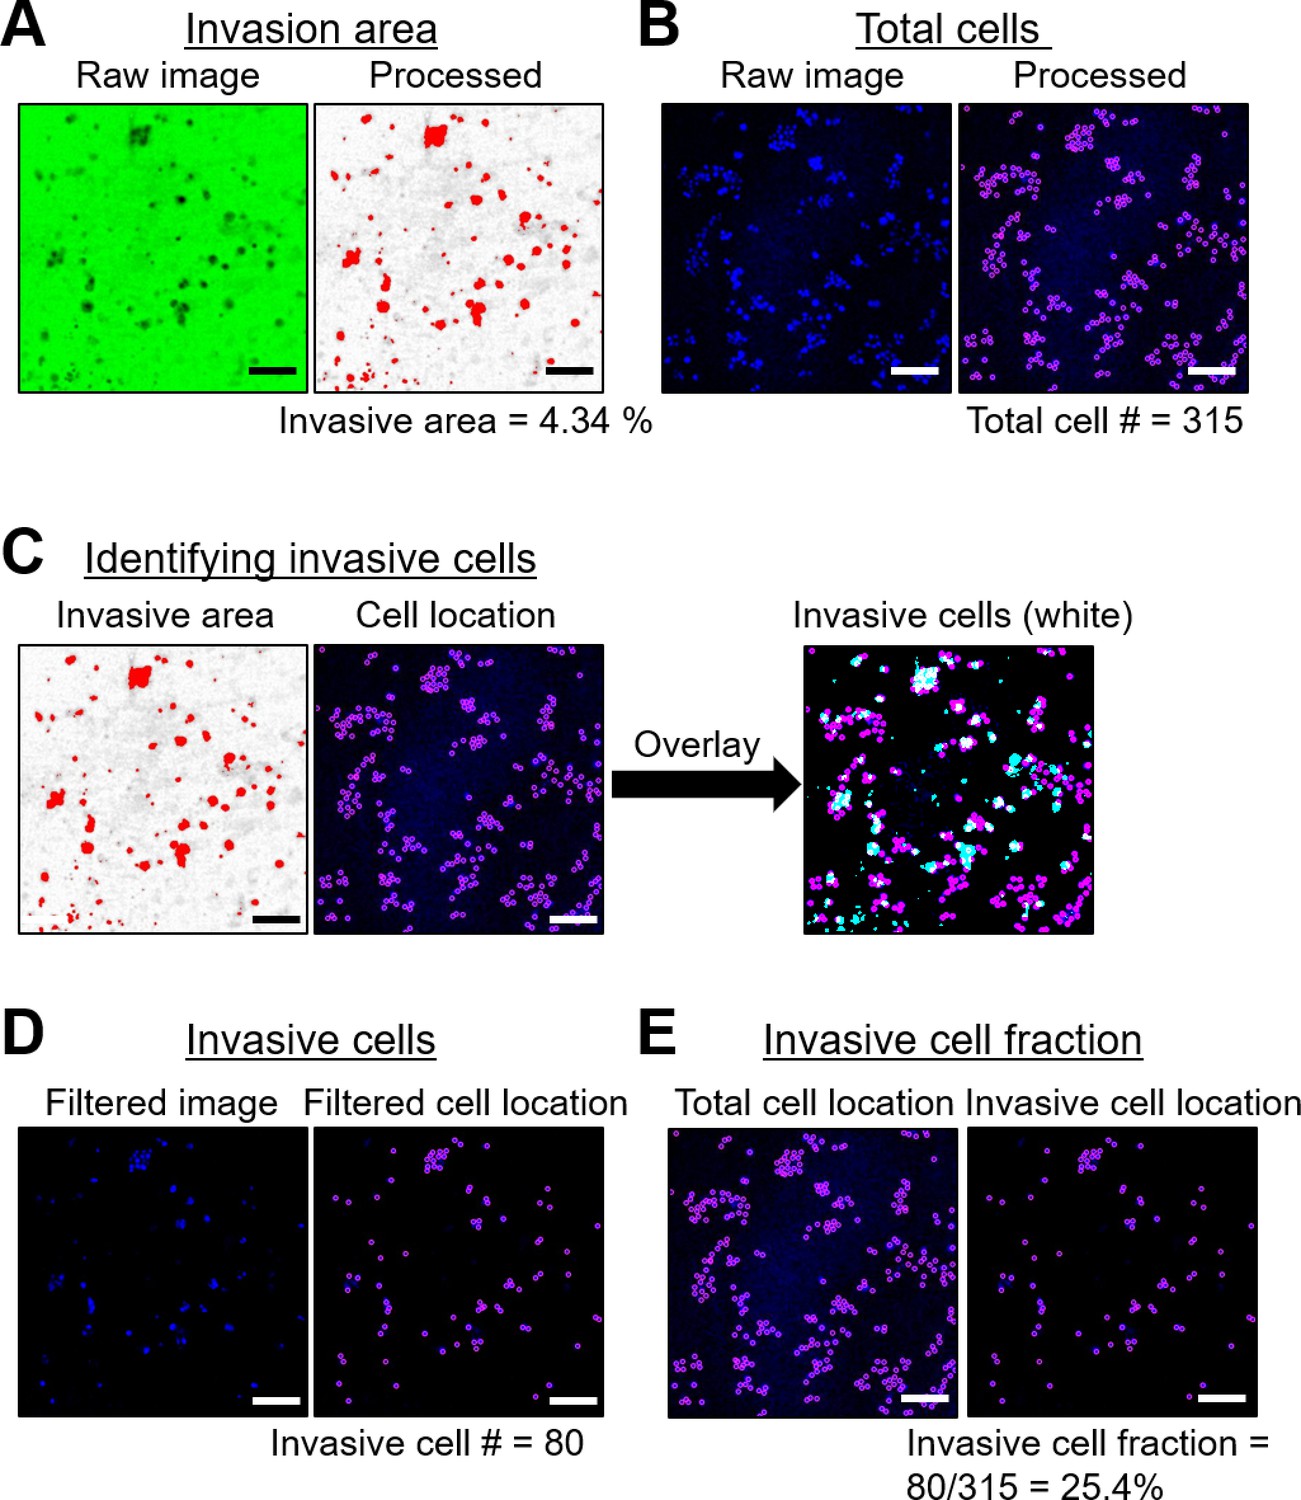
Quantifying the Invasive cell fraction using a 2D polyacrylamide hydrogel-based invasion assay.
(A) Green fluorescent gelatin images were thresholded to highlight invasion areas (in red) due to degradation (visible as dark regions in the original image). Here, 4.34% of the total area indicated cell invasion. (B) DAPI images (in blue, showing nuclei locations) were processed with the Trackmate plugin in Image J to detect individual DAPI spots (displayed in purple). The total cell count in this instance was estimated at 315. (C) The highlighted invasive areas from (A) served as masks for the DAPI locations, selecting only the invasive cells (those in the white regions resulting from the overlay between cell positions in purple and invasive zones in cyan). (D) The resultant images display the locations of invasive cells in purple. The invasive cell count from this image was 80. (E) The fraction of invasive cells was determined by comparing the number of invasive cells (from D) with the overall cell count (from B). Thus, the invasive cell fraction was 25.4% (80 out of 315). Scale bar = 100 μm.
Figure 1—figure supplement 2
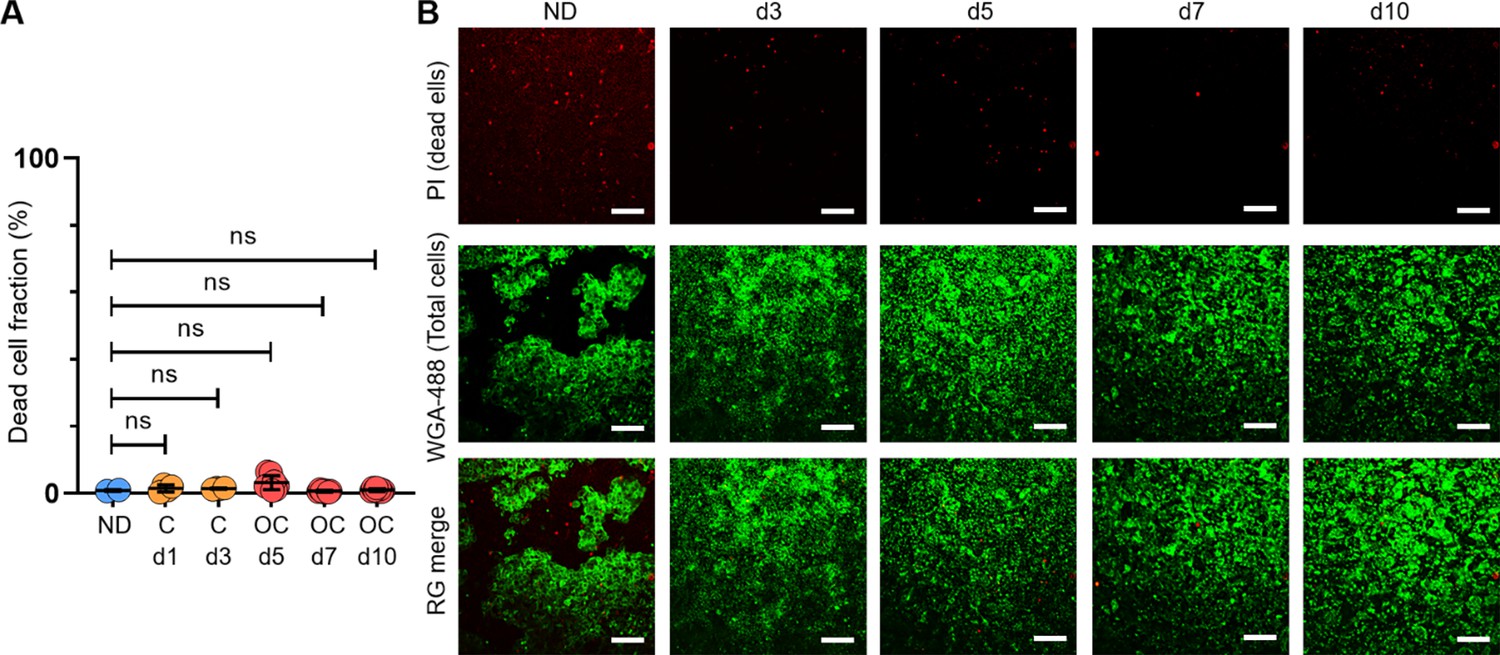
MCF10DCIS.com cells exhibited comparable viability under overconfluence (OC) conditions to those under normal density (ND) conditions.
(A-B) Live cells seeded at ND (~70%) (n=2) were cultured for 1 (n=4), 3 (n=4), 5 (n=8), 7 (n=8), and 10 (n=8) d post-confluence (denoted as ‘d’). Cells were stained with propidium iodide (PI, red) to mark dead cells, followed by WGA-488 (green) to label nuclei. After staining, cells were fixed and imaged using confocal microscopy (4 X), with red and green signals quantified via the TrackMate plugin in ImageJ. The percentage of dead cells, based on PI-positive signals, is presented in A. Both confluent (day 3) and OC (day 5–10) MCF10DCIS.com cells showed similar viability to ND cells, with less than 1% cell death (0.85±0.25%). On average, the fraction of dead cells was 1.58±0.98%, confirming that cell crowding does not additionally induce cell death. Representative PI/WGA-488/merged images from days 1, 3, 5, 7, and 10 are shown in B. Scale bar = 100 μm. For the t-test, we employed a nonparametric approach using the Mann-Whitney test with a two-tailed p-value, which was used throughout the manuscript. The statistical significance levels are denoted as follows: ****p<0.0001, ***p<0.001, **p<0.01, *p<0.05, ns: p>0.05.
-
Figure 1—figure supplement 2—source data 1
Original data for panel A.
- https://cdn.elifesciences.org/articles/100490/elife-100490-fig1-figsupp2-data1-v1.xlsx
Figure 1—figure supplement 3
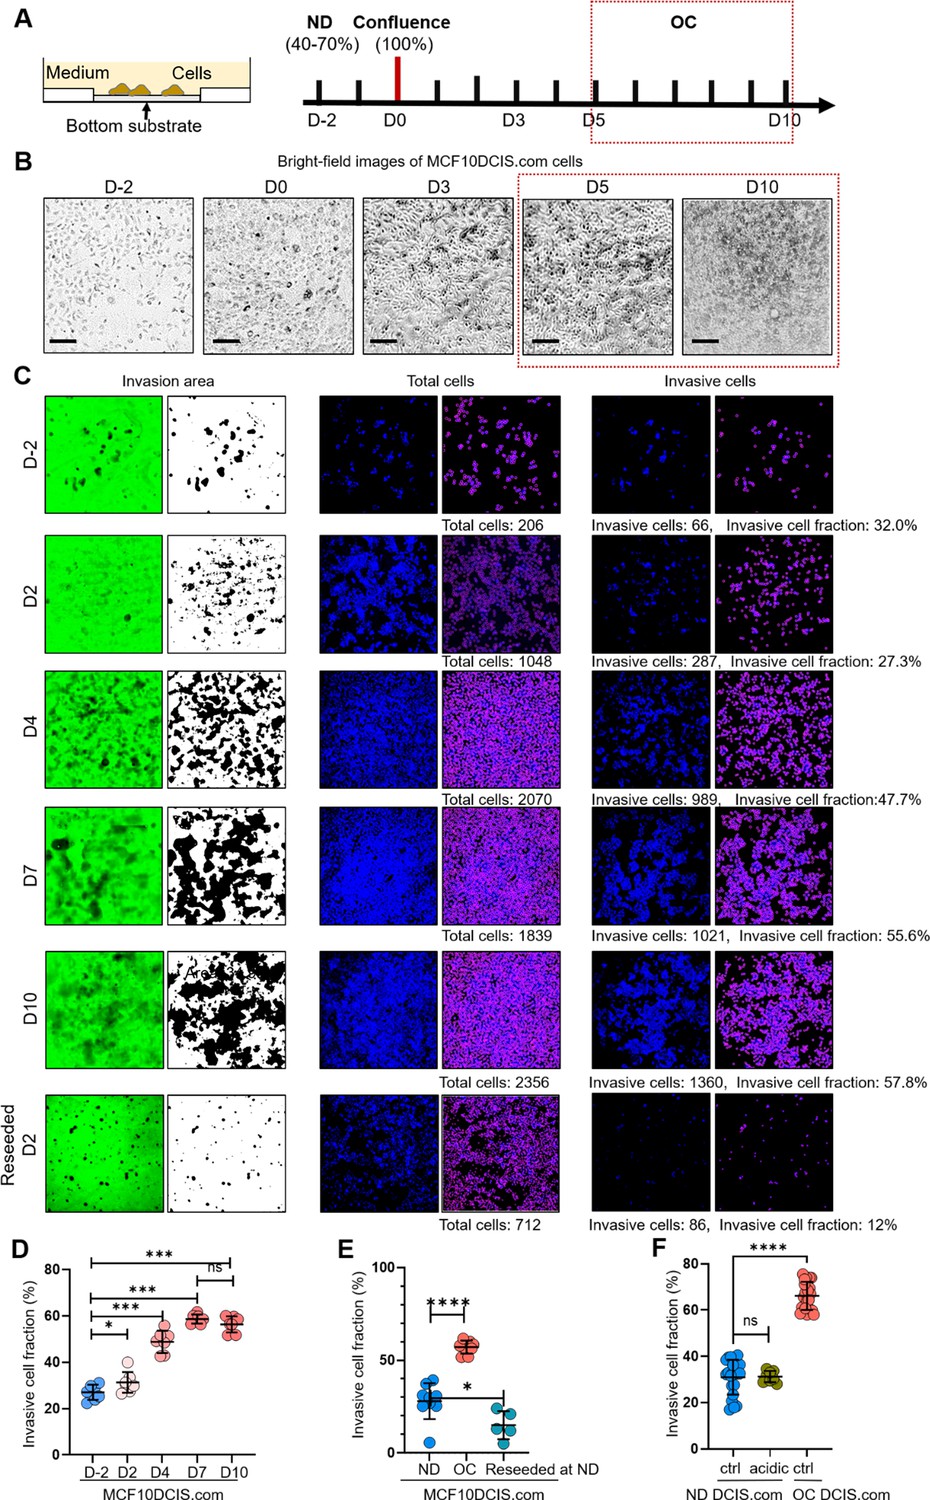
Time window for cell crowding conditions in vitro.
(A) MCF10DCIS.com cells were grown to: normal density (ND; 40–70%), confluence (100%), and overconfluence (OC). The time points for these growth stages were 2 d before confluence (D-2) for ND, day 0 (D0) for confluence, and days 5–10 after confluence (D5) for OC. We selected the cell crowding condition (OC conditions) during days 5–10 as cell morphology (B) and invasiveness (C) reached equilibrium after day 5. (B) Brightfield microscopy images of MCF10DCIS.com cells on the indicated days. Cells exhibited significant compaction starting from day 5. Scale bar = 100 μm. (C-D) Time-dependent invasiveness of MCF10DCIS.com cells as they progressed to OC. The cell invasiveness increased until day 5 and plateaued between days 5 and 10. When these cells were reseeded at normal density on day 2 (reseeded D2), their invasiveness decreased to levels similar to the original ND cells. (E) Formerly OC cells reseeded at ND showed a slight reduction in the fraction of invasive cells (light teal circles) to approximately 15%, comparable to ND cells (blue circles) before exposure to OC conditions. These results suggest that the OC-induced increase in invasiveness is largely reversible. (F) To test if acidity of OC cell media, despite frequent changing, contributed to increased invasiveness of DCIS.com cells, we used acidic OC media (day 7) to treat ND DCIS.com cells for 2 d. Conditioned media did not alter invasiveness of ND DCIS.com cells. For the t-test, we employed a nonparametric approach using the Mann-Whitney test with a two-tailed p-value, which was used throughout the manuscript. The statistical significance levels are denoted as follows: ****p<0.0001, ***p<0.001, **p<0.01, *p<0.05, ns: p>0.05.
-
Figure 1—figure supplement 3—source data 1
Original data corresponding to panel D.
- https://cdn.elifesciences.org/articles/100490/elife-100490-fig1-figsupp3-data1-v1.xlsx
-
Figure 1—figure supplement 3—source data 2
Original data corresponding to panel E.
- https://cdn.elifesciences.org/articles/100490/elife-100490-fig1-figsupp3-data2-v1.xlsx
-
Figure 1—figure supplement 3—source data 3
Original data corresponding to panel F.
- https://cdn.elifesciences.org/articles/100490/elife-100490-fig1-figsupp3-data3-v1.xlsx
Figure 2 with 1 supplement
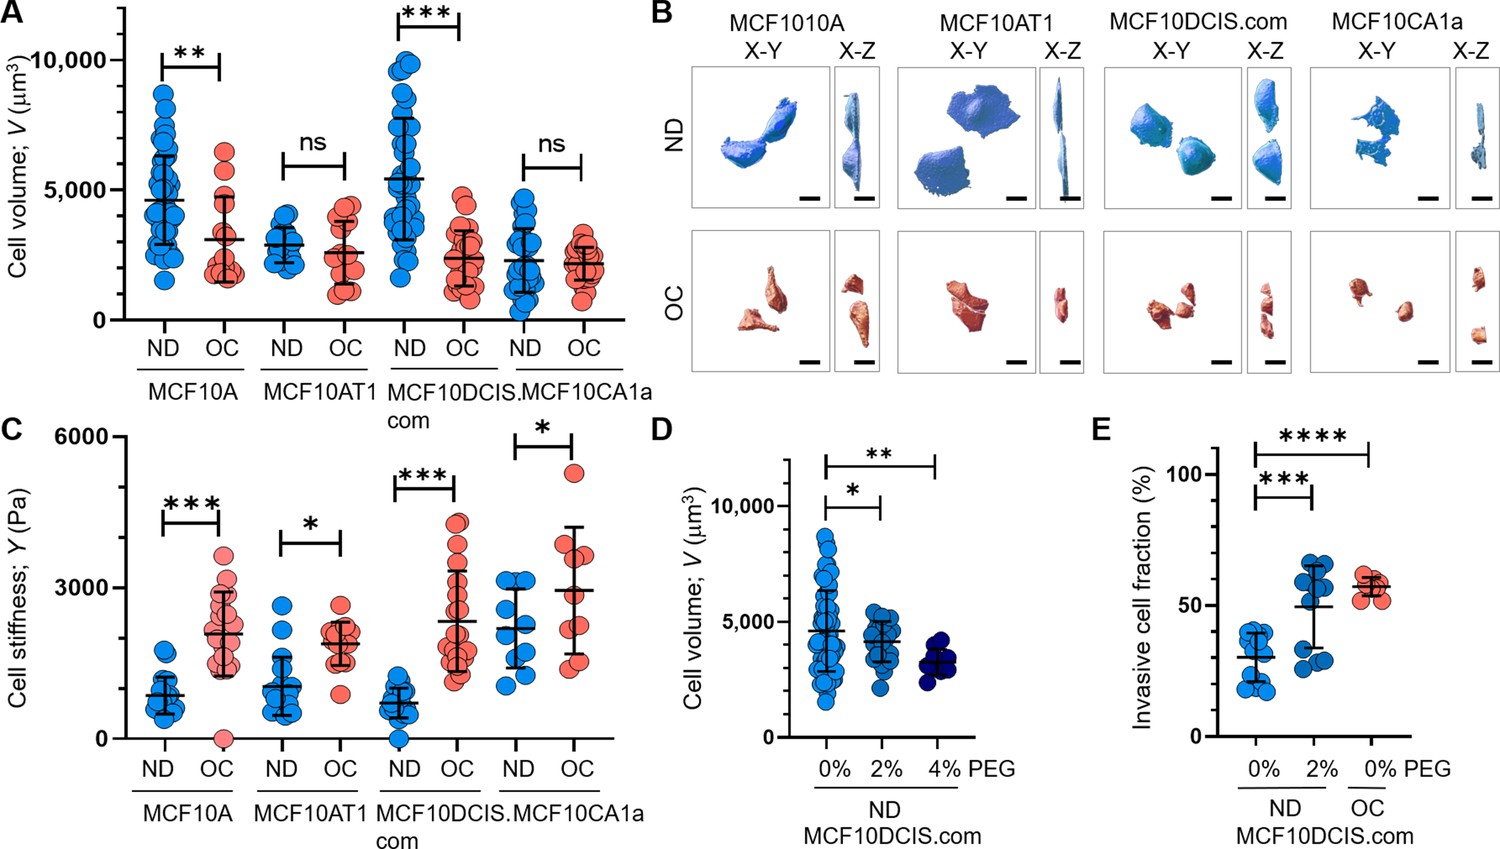
Cell crowding induces significant cell volume reduction and stiffening in high-grade ductal carcinoma in situ (DCIS) cells.
Cell volume (V; mean and SD) differences between normal density (ND) (blue circles) and overconfluence (OC) (red circles) conditions of MCF10A, MCF10AT1, MCF10DCIS.com, and MCF10CA1a cells are plotted. The high-grade DCIS cell mimic, MCF10DCIS.com, shows a large volume reduction due to cell crowding. The number of single-cell volume analyses (technical replicates merged from three independent experimental repeats) was as follows: MCF10A (ND: 44; OC: 14), MCF10AT1 (ND: 16; OC: 16), MCF10DCIS.com (ND: 38; OC: 24), and MCF10CA1a (ND: 29; OC: 31). (B) Representative confocal microscopy images of RFP-coexpressing cells of the four cell types in ND and OC conditions. The images include x-y (left) and x-z (right) views, with scale bar = 10 μm. The large volume reduction of MCF10DCIS.com cells is evident. (C) Plots showing changes in cortical stiffness (mean and SD) measured by Young’s modulus (Y) using a nanoindenter, displaying significant cell stiffening of MCF10DCIS.com cells due to cell crowding. The number of single-cell stiffness measurements (technical replicates merged from two independent experimental repeats) was as follows: MCF10A (ND: 21; OC: 19), MCF10AT1 (ND: 19; OC: 14), MCF10DCIS.com (ND: 19; OC: 21), and MCF10CA1a (ND: 11; OC: 10). (D) Hyperosmotic conditions induced by PEG 300 treatment (light blue and darker blue circles for untreated and 2% PEG 300=74.4 mOsm/Kg, respectively; navy circles for 4% PEG 300=148.8 mOsm/kg) lead to dose-dependent cell volume reduction. The number of single-cell volume analyses (technical replicates merged from three independent experimental repeats) was as follows: MCF10DCIS.com (ND control: 62; ND +2% PEG: 23; ND +4% PEG: 10). (E) Treatment with 2% PEG 300 (darker blue circles) for 2 d significantly increased the invasiveness (mean and SD) of MCF10DCIS.com cells, similar to the OC case (red circles). The number of cell invasion analyses (technical replicates merged from two independent experimental repeats) was as follows: MCF10DCIS.com (ND control: 13; ND +4% PEG: 12; OC: 10). ****p<0.0001, ***p<0.001, **p<0.01, *p<0.05, ns: p>0.05.
-
Figure 2—source data 1
Original data corresponding to panel A.
- https://cdn.elifesciences.org/articles/100490/elife-100490-fig2-data1-v1.xlsx
-
Figure 2—source data 2
Original data corresponding to panel C.
- https://cdn.elifesciences.org/articles/100490/elife-100490-fig2-data2-v1.xlsx
-
Figure 2—source data 3
Original data corresponding to panel D.
- https://cdn.elifesciences.org/articles/100490/elife-100490-fig2-data3-v1.xlsx
-
Figure 2—source data 4
Original data corresponding to panel E.
- https://cdn.elifesciences.org/articles/100490/elife-100490-fig2-data4-v1.xlsx
Figure 2—figure supplement 1
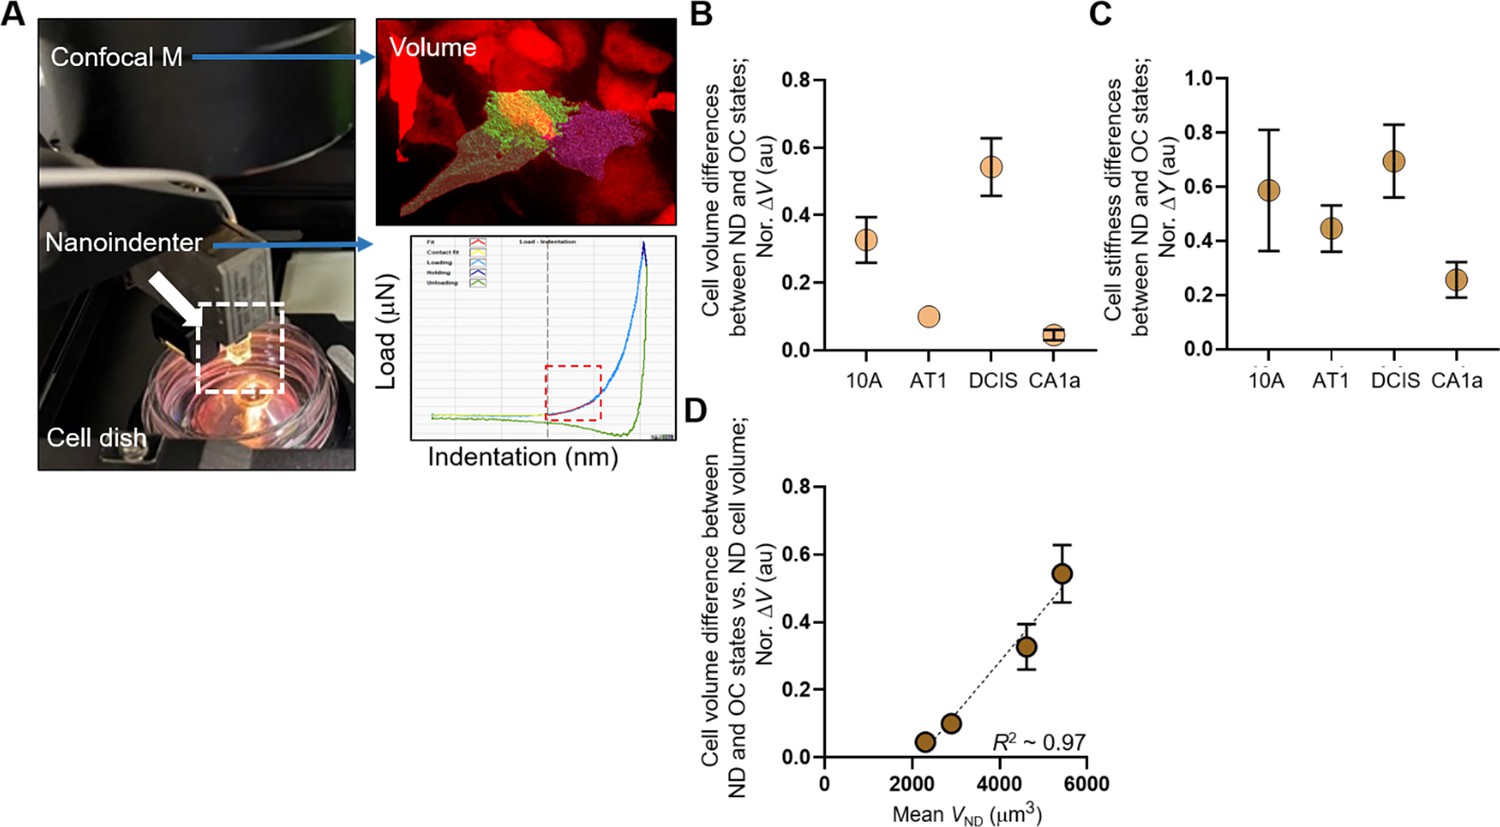
Increased invasiveness of MCF10DCIS.com cells correlates with cell volume plasticity.
(A) Cell crowding-induced cell volume and stiffness changes assessed by our confocal microscope, which captures 3D volume of single RFP-expressing cells (right image) and includes a nanoindenter device (Chiaro, Optics11life) that can indent a single-cell (load vs indentation curve) to extract Young’s modulus in the elastic regime (red dashed box) using a Hertzian model. The indentation probe has a spring constant and tip diameter of ~0.24 N/m and 10 μm, respectively. We confirmed that RFP expression did not alter cell volume. (B-C) Cell volume and stiffness differences between normal density (ND) and overconfluence (OC) conditions calculated using the cell volume and stiffness data in Figure 2A and C were normalized to the ND cell volume (B) or stiffness (C), with the highest changes observed in high-grade MCF10DCIS.com cells. (D) Normalized volume change (Nor. ΔV) linearly scaled with ND cell volume (mean VND), with an R² value of approximately 0.97, signifying a highly linear relationship. ****p<0.0001, ***p<0.001, **p<0.01, *p<0.05, ns: p>0.05.
-
Figure 2—figure supplement 1—source data 1
Original data corresponding to panel B.
- https://cdn.elifesciences.org/articles/100490/elife-100490-fig2-figsupp1-data1-v1.xlsx
-
Figure 2—figure supplement 1—source data 2
Original data corresponding to panel C.
- https://cdn.elifesciences.org/articles/100490/elife-100490-fig2-figsupp1-data2-v1.xlsx
-
Figure 2—figure supplement 1—source data 3
Original data corresponding to panel D.
- https://cdn.elifesciences.org/articles/100490/elife-100490-fig2-figsupp1-data3-v1.xlsx
Figure 3 with 6 supplements
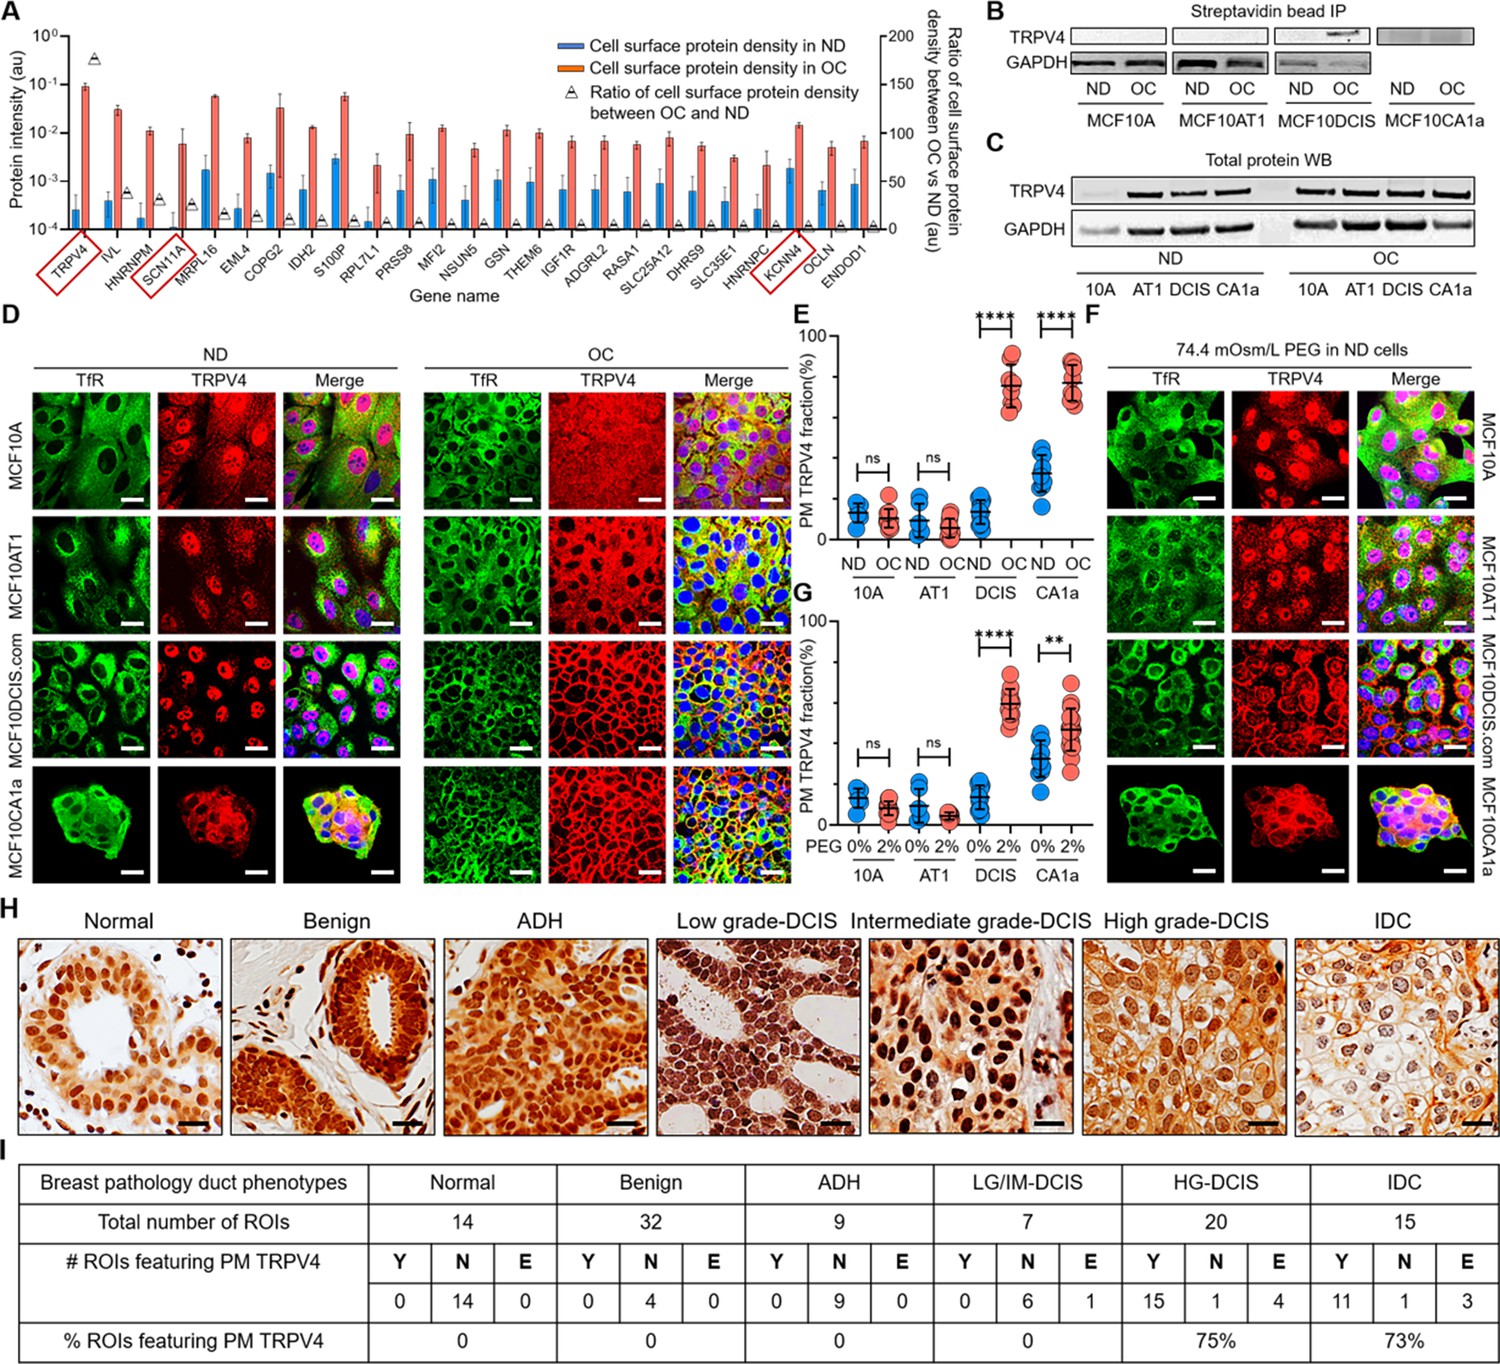
Cell crowding induces TRPV4 relocation to plasma membrane in MCF10DCIS.com cells.
(A) Mass spectrometry data showing proteins enriched in the plasma membrane (PM) > fivefold (fold changes represented using triangle plots; OC/ND ratio on the right axis) when cells are under overconfluence (OC) (red bars) relative to normal density (ND) conditions (blue bars). Ion channels are marked with red boxes, where TRPV4 shows about a 160-fold increased association with the plasma membrane under OC conditions. (B) Proteins near and on the plasma membrane were pulled down after cell surface biotinylation with streptavidin beads and immunoblotted for TRPV4. TRPV4 is significantly associated with the plasma membrane in OC MCF10DCIS.com cells. In MCF10CA1a cells, TRPV4 appears to be associated with the plasma membrane under both ND and OC conditions, with a slight increase under OC conditions. (C) Immunoblots of whole-protein lysates demonstrate similar overall TRPV4 protein levels across MCF10A cell derivatives, regardless of cell density. This indicates that the differing plasma membrane association of TRPV4 is due to trafficking changes, not expression level changes. GAPDH is used as a loading control. (D) Representative immunofluorescence (IF) images by confocal microscopy show TRPV4 (red) localization compared to the control protein transferrin receptor (TfR; green) in MCF10A, MCF10AT1, MCF10DCIS.com, and MCF10CA1a cells under ND and OC conditions. DAPI (blue) staining was used for visualizing the nuclei. As observed in the biochemical data in (B-C), cell crowding induces the relocation of TRPV4 to the plasma membrane in MCF10DCIS.com cells. TRPV4 is associated with the plasma membrane in ND MCF10CA1a cells, with a clear elevated association in OC cells. Scale bar = 10 μm. (E) Plasma membrane-associated TRPV4 (%) is quantified for the four cell lines under ND and OC conditions by line analysis, showing a significant increase in both MCF10DCIS.com cells and MCF10CA1a cells due to cell crowding. The number of cells used for line analyses (technical replicates merged from three independent experimental repeats) was as follows: MCF10A (ND: 6; OC: 12), MCF10AT1 (ND: 6; OC: 11), MCF10DCIS.com (ND: 12; OC: 8), and MCF10CA1a (ND: 10; OC: 10). (F) IF images show that hyperosmotic conditions induced by PEG 300 (74.4 mOsm/Kg) treatment also relocate TRPV4 (red) to the plasma membrane in MCF10DCIS.com cells. TfR localization remains consistent under hyperosmotic conditions. Increased relocation is also observed in MCF10CA1a cells. Scale bar = 10 μm. (G) The increased plasma membrane association of TRPV4 due to hyperosmotic stress is quantified by line analysis. The number of cells used for line analyses (technical replicates merged from two independent experimental repeats) was as follows: MCF10A (ND control: 6; ND +4% PEG: 15), MCF10AT1 (ND control: 6; ND +4% PEG: 9), MCF10DCIS.com (ND control: 12; ND +4% PEG: 8), and MCF10CA1a (ND control: 10; ND +4% PEG: 21). Scale bar = 10 μm. (H) Representative regions of interest (ROIs) of TRPV4-stained immunohistochemistry (IHC) images in different pathology phenotypes. High-grade ductal carcinoma in situ (DCIS) and invasive ductal cancer (IDC) ROIs clearly exhibit plasma membrane association of TRPV4. Two high-grade DCIS IHC images were acquired by two different people and both show plasma membrane-associated TRPV4. Scale bar = 20 μm. (I) Statistical results from independent histological evaluations of pathologies and TRPV4 distributions of 97 ROIs from 39 patient specimens indicate a high correlation (>70%) of plasma membrane association of TRPV4 with high-grade DCIS or IDC pathologies. Y/N: Yes/no, indicating both pathologists agreed that PM ion channels were present/absent. E: Equivocal, indicating the pathologists disagreed. Significantly high proportions of high-grade DCIS (75%) and IDC (73%) ROIs exhibited plasma membrane TRPV4 association, which was not observed in lower-risk cases. ****p<0.0001, ***p<0.001, **p<0.01, *p<0.05, ns: p>0.05.
-
Figure 3—source data 1
Original data corresponding to panel A.
- https://cdn.elifesciences.org/articles/100490/elife-100490-fig3-data1-v1.xlsx
-
Figure 3—source data 2
Original data corresponding to panel B.
- https://cdn.elifesciences.org/articles/100490/elife-100490-fig3-data2-v1.zip
-
Figure 3—source data 3
Original data corresponding to panel B.
- https://cdn.elifesciences.org/articles/100490/elife-100490-fig3-data3-v1.zip
-
Figure 3—source data 4
Original data corresponding to panel C.
- https://cdn.elifesciences.org/articles/100490/elife-100490-fig3-data4-v1.zip
-
Figure 3—source data 5
Original data corresponding to panel C.
- https://cdn.elifesciences.org/articles/100490/elife-100490-fig3-data5-v1.zip
-
Figure 3—source data 6
Original data corresponding to panels E and G.
- https://cdn.elifesciences.org/articles/100490/elife-100490-fig3-data6-v1.xlsx
-
Figure 3—source data 7
Gene and protein names that showed more than a fivefold increase in plasma membrane association under overconfluence (OC) conditions relative to normal density (ND) conditions in MCF10DCIS.com cells were identified by mass spectrometry.
Ion channels among these are highlighted in bold.
- https://cdn.elifesciences.org/articles/100490/elife-100490-fig3-data7-v1.pdf
-
Figure 3—source data 8
Top 25 genes and corresponding proteins that exhibited more than a 100-fold increase in plasma membrane association under OC conditions compared to ND conditions in MCF10A cells (left), and more than a fivefold increase in MCF10AT1 (middle) and MCF10CA1a (right) cells, as identified by mass spectrometry.
One ion transporter showing plasma membrane relocation under OC conditions in MCF10CA1a cells is highlighted in bold.
- https://cdn.elifesciences.org/articles/100490/elife-100490-fig3-data8-v1.pdf
Figure 3—figure supplement 1
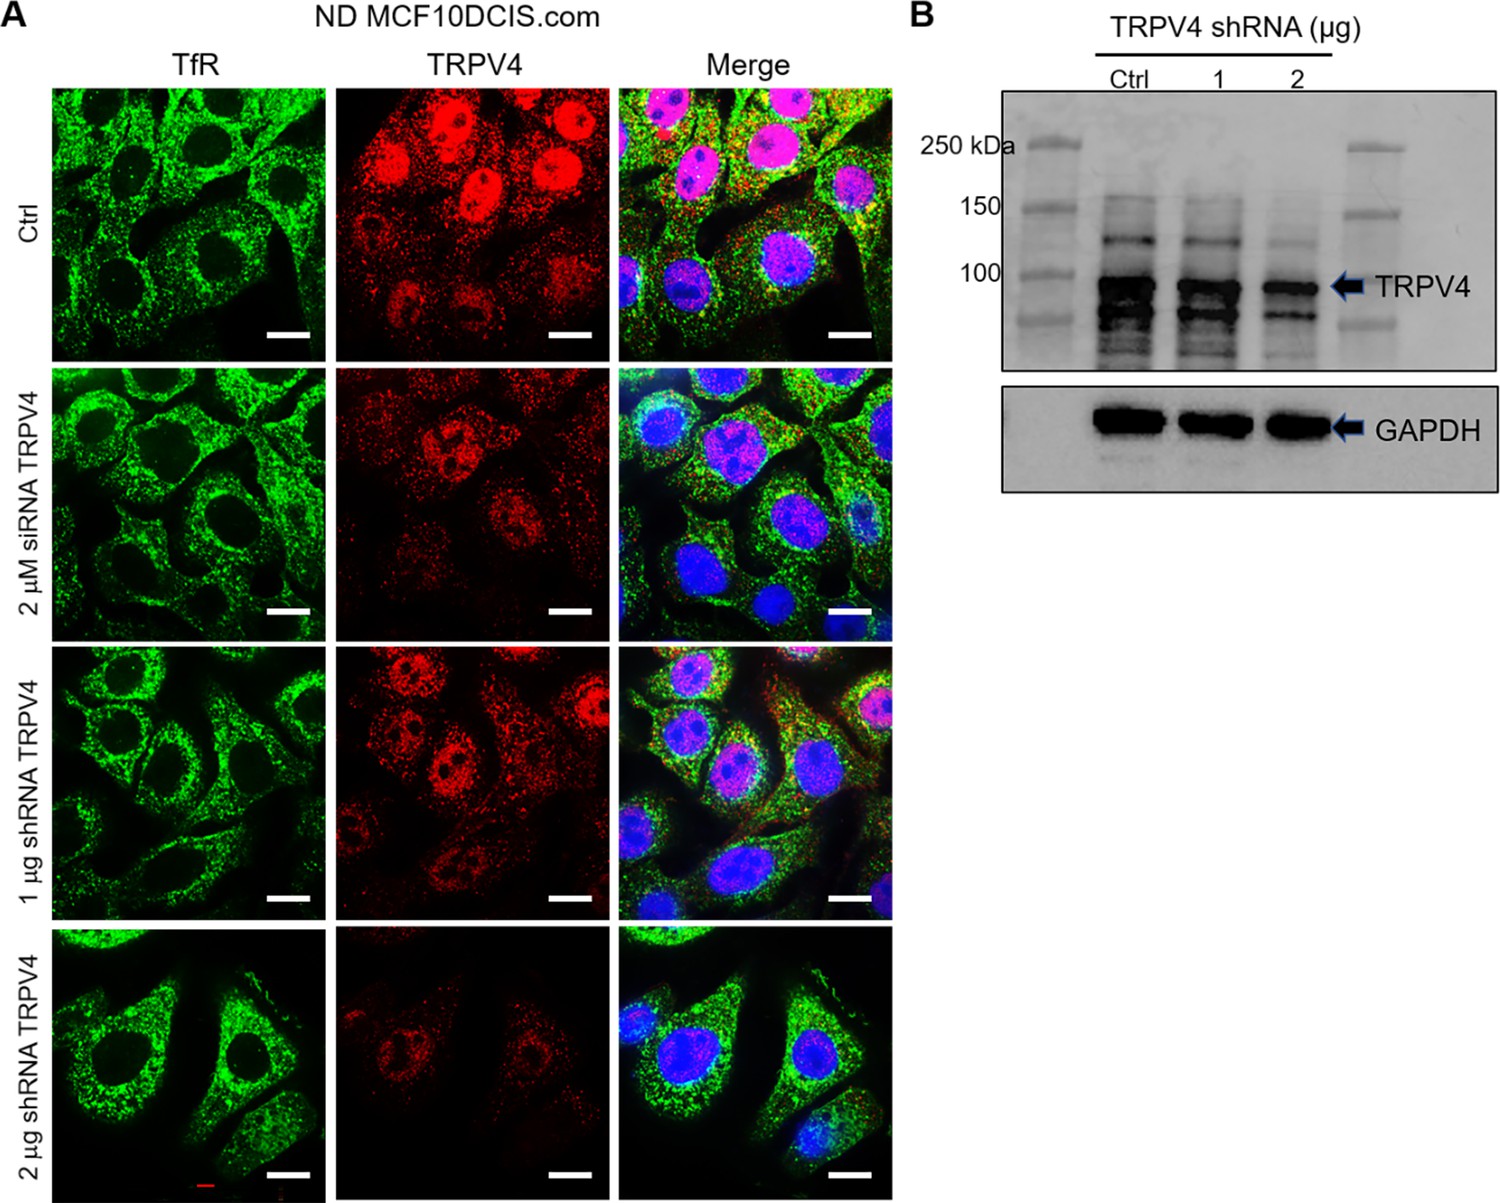
Binding specificity of TRPV4 antibody.
Immunofluorescence images (A) and immunoblots (B) verified the binding specificity of TRPV4 antibodies in control normal density (ND) DCIS.com cells and TRPV4-depleted cells treated with either 2 μM siRNA (Dharmacon On Target Plus SMART Pool L-004195-00-0005) or 1 and 2 μg shRNA (shRNA pool, Santa Cruz sc-61726-SH) for 36 hr. (A) Compared to invariant transferrin receptor (TfR) staining (green), TRPV4 (red) depletion was 40% with 1 µg shRNA and 80% with 2 µg shRNA, as quantified by intensity measurements. DAPI (blue) is also shown in the merged images. All images were visualized using the same intensity settings. Scale bar = 20 µm. (B) Immunoblot results confirmed this dose-responsive depletion of TRPV4, with 33% reduction observed at 1 µg shRNA and 51% at 2 µg.
-
Figure 3—figure supplement 1—source data 1
Original data for panel B.
- https://cdn.elifesciences.org/articles/100490/elife-100490-fig3-figsupp1-data1-v1.zip
-
Figure 3—figure supplement 1—source data 2
Raw gel image for the immunoblot data.
- https://cdn.elifesciences.org/articles/100490/elife-100490-fig3-figsupp1-data2-v1.zip
Figure 3—figure supplement 2

Various ion channels are relocated to the plasma membrane under cell crowding conditions.
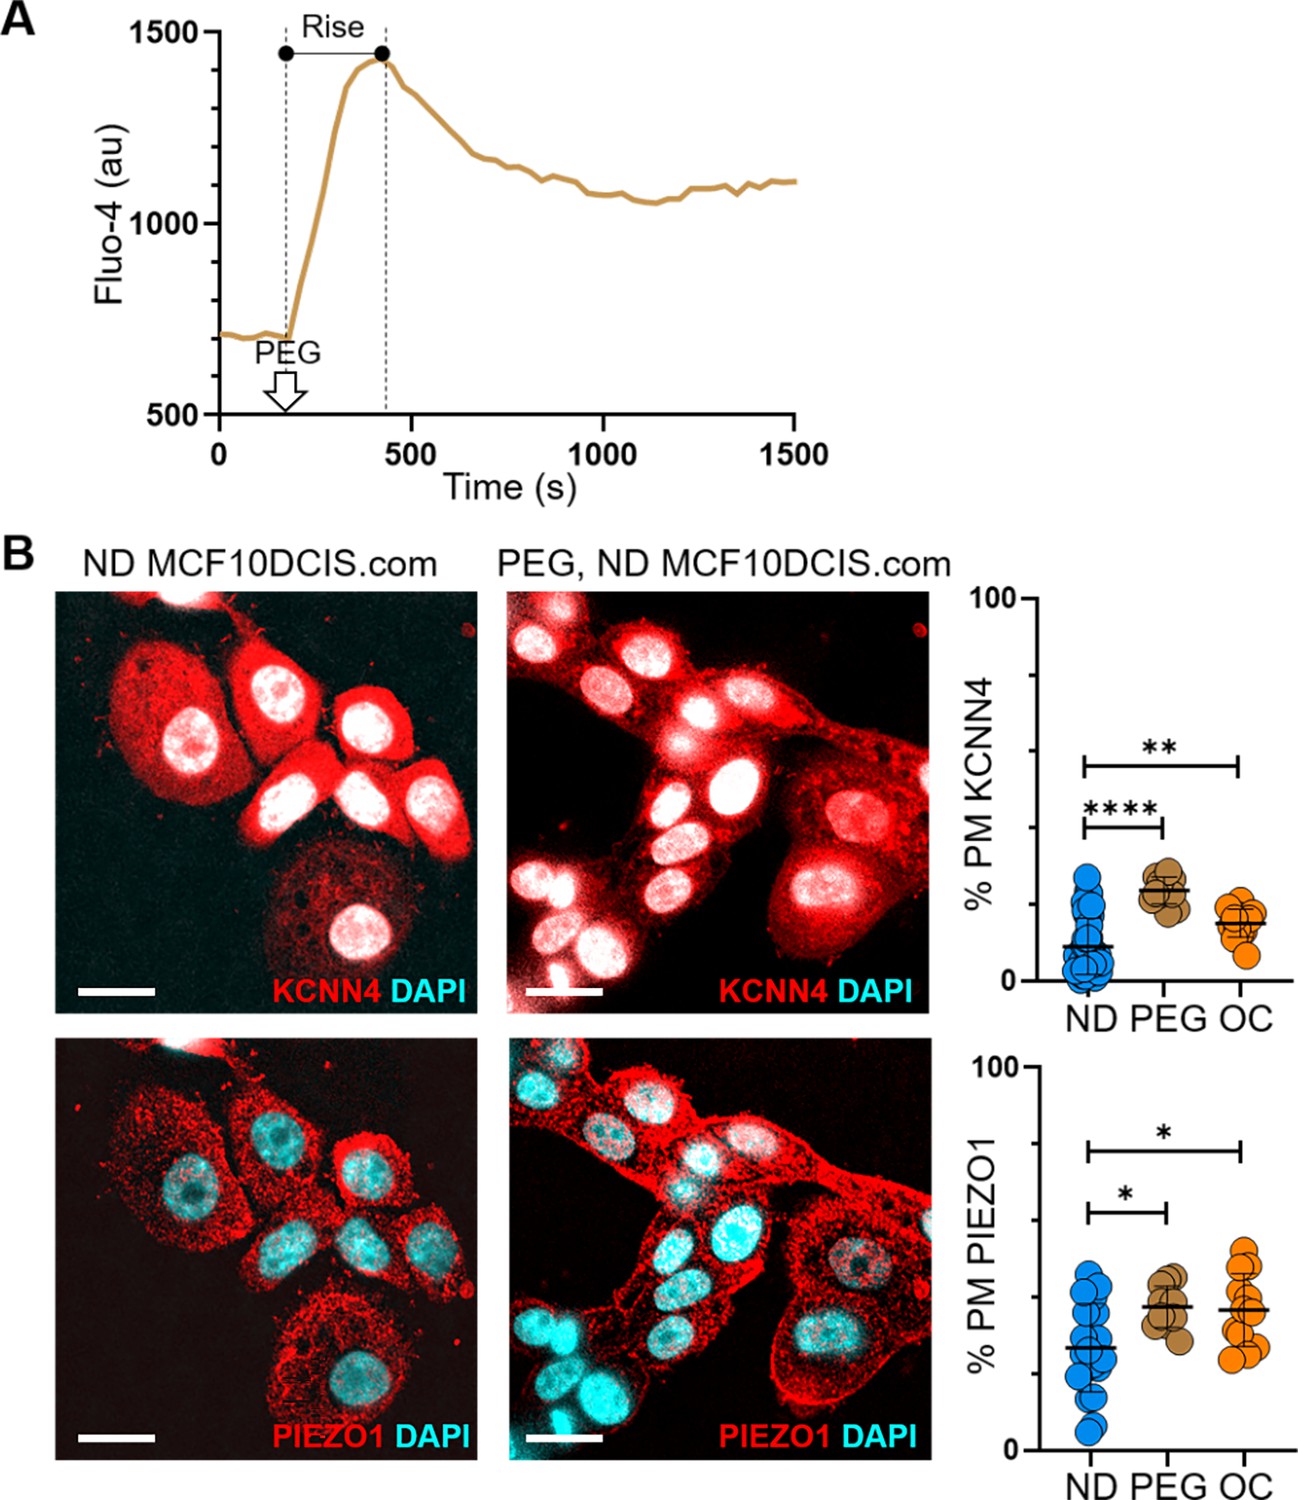
(A) We used the plasma membrane marker DiIC18(3) to confirm the association of TRPV4 with the plasma membrane in MCF10DCIS.com and MCF10CA1a cells under overconfluence (OC) conditions. As described in the Methods section, we stained DiIC18(3) in live cells and co-stained TRPV4 and DAPI in fixed and permeabilized cells. The immunofluorescence (IF) images show TRPV4 (red), DiIC18(3) (DiI, green), and DAPI (blue). The line profile plots on the right demonstrate colocalization of TRPV4 with DiIC18(3) at the plasma membrane (PM), marked by the green DiIC18(3) signal, which overlaps with the red TRPV4 signal. The nucleus location (NUC) is indicated by the blue DAPI signal. Scale bar = 20 μm. (B) We examined the relocation of KCNN4 and PIEZO1 to the plasma membrane in response to cell crowding. Mass spectrometry showed a slight increase in KCNN4 at the plasma membrane under OC conditions. In ND MCF10DCIS.com cells, KCNN4 was predominantly cytosolic, whereas PIEZO1 showed some plasma membrane association. Under OC conditions, both KCNN4 and PIEZO1 showed a modest relocation to the plasma membrane. (C) Line analysis confirmed a slight increase in plasma membrane association for both KCNN4 and PIEZO1 under OC conditions compared to ND conditions. Scale bar = 20 μm. For the statistical analysis, we employed a nonparametric approach using the Mann-Whitney test with a two-tailed p-value. The levels of statistical significance are denoted as follows: **** indicates p<0.0001, *** indicates p<0.001, * indicates p<0.1, and ‘ns’ indicates p>0.05.
-
Figure 3—figure supplement 2—source data 1
Original data corresponding to panel A.
- https://cdn.elifesciences.org/articles/100490/elife-100490-fig3-figsupp2-data1-v1.xlsx
-
Figure 3—figure supplement 2—source data 2
Original data corresponding to panel C.
- https://cdn.elifesciences.org/articles/100490/elife-100490-fig3-figsupp2-data2-v1.xlsx
-
Figure 3—figure supplement 2—source data 3
Original data corresponding to panel C.
- https://cdn.elifesciences.org/articles/100490/elife-100490-fig3-figsupp2-data3-v1.xlsx
Figure 3—figure supplement 3
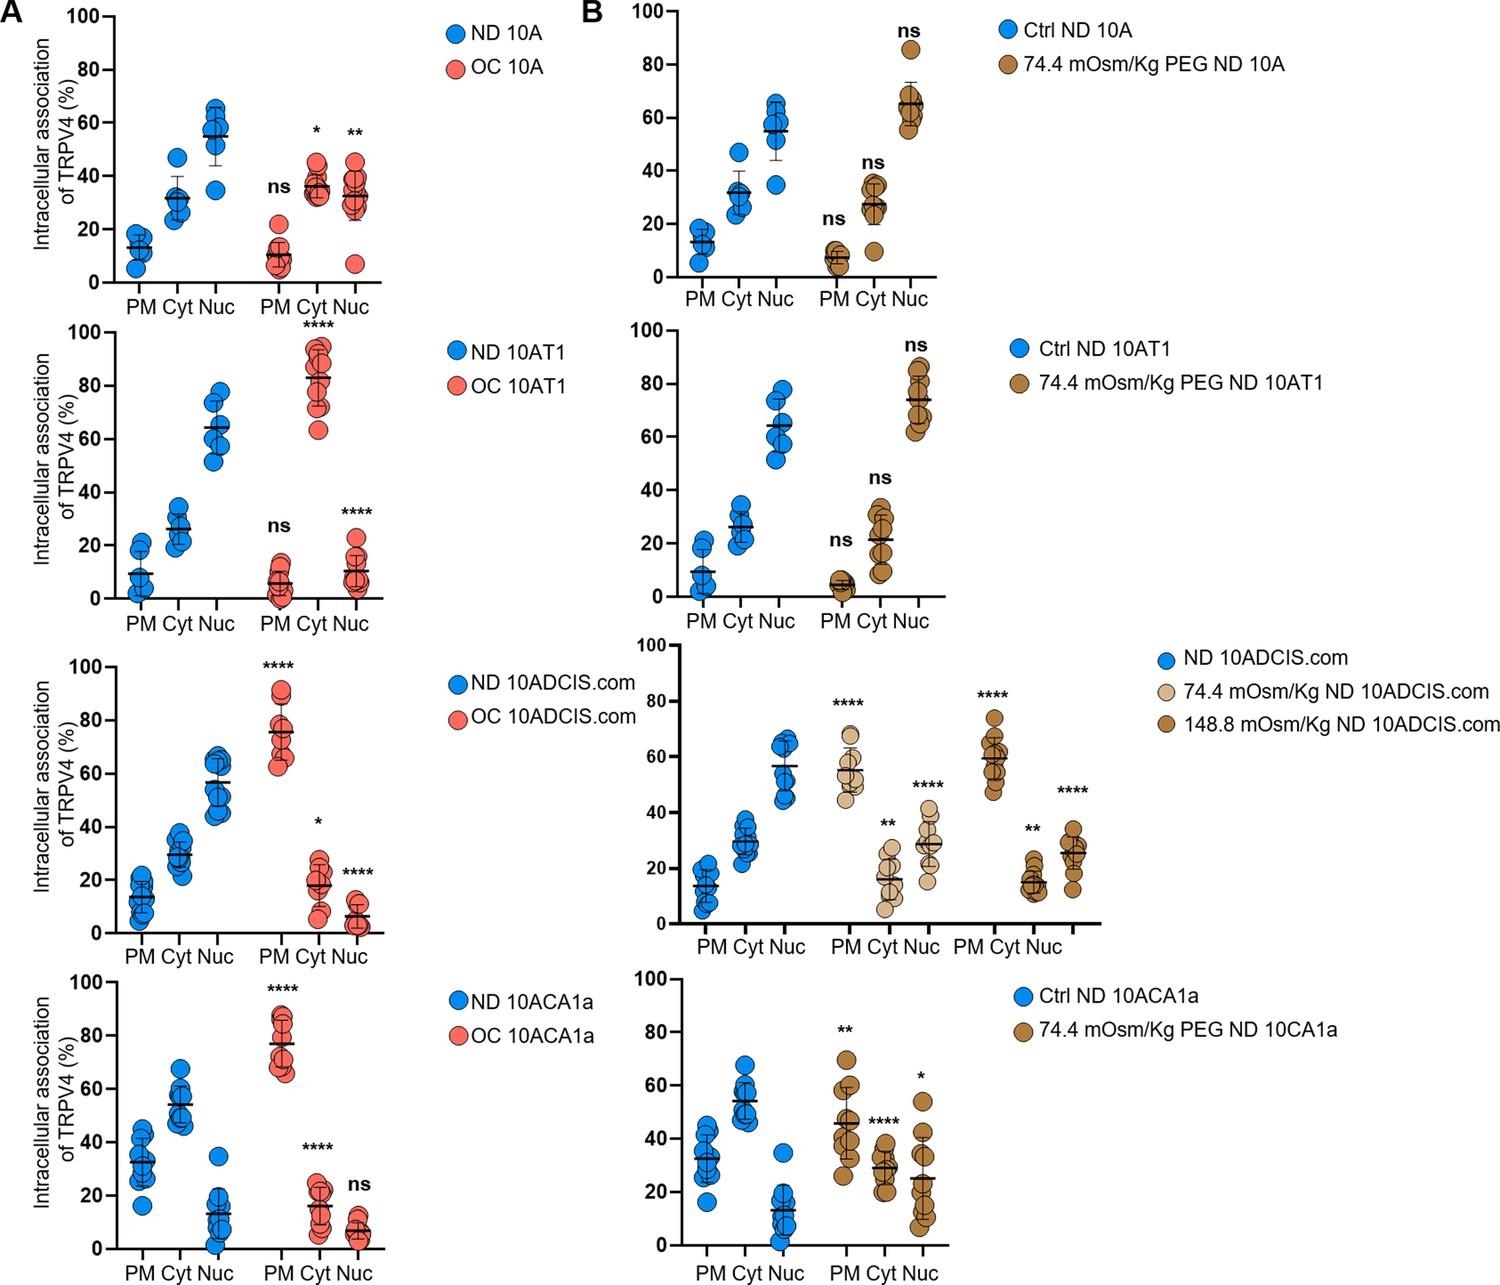
Plots of the relative intracellular TRPV4 associations between normal density (ND) and overconfluence (OC) or hyperosmotic conditions in all four cell types.
(A) Relative TRPV4 associations with the plasma membrane (PM), cytoplasm (Cyt), and nucleus (Nuc) are plotted for ND versus OC conditions in MCF10A (10 A), MCF10AT1 (10AT1), MCF10DCIS.com (10DCIS.com), and MCF10CA1a (10CA1a) cells. (B) Similar analyses were performed to compare the intracellular TRPV4 associations in PM, Cyt, and Nuc between control ND and 74.4 or 148.8 mOsm/kg PEG 300 treatment groups. We employed a nonparametric approach using the Mann-Whitney test with a two-tailed p-value for the statistical analysis. The levels of statistical significance are denoted as follows: **** indicates p<0.0001, *** indicates p<0.001, * indicates p<0.1, and ‘ns’ indicates p>0.05.
-
Figure 3—figure supplement 3—source data 1
Original data corresponding to panel A and B.
- https://cdn.elifesciences.org/articles/100490/elife-100490-fig3-figsupp3-data1-v1.xlsx
Figure 3—figure supplement 4
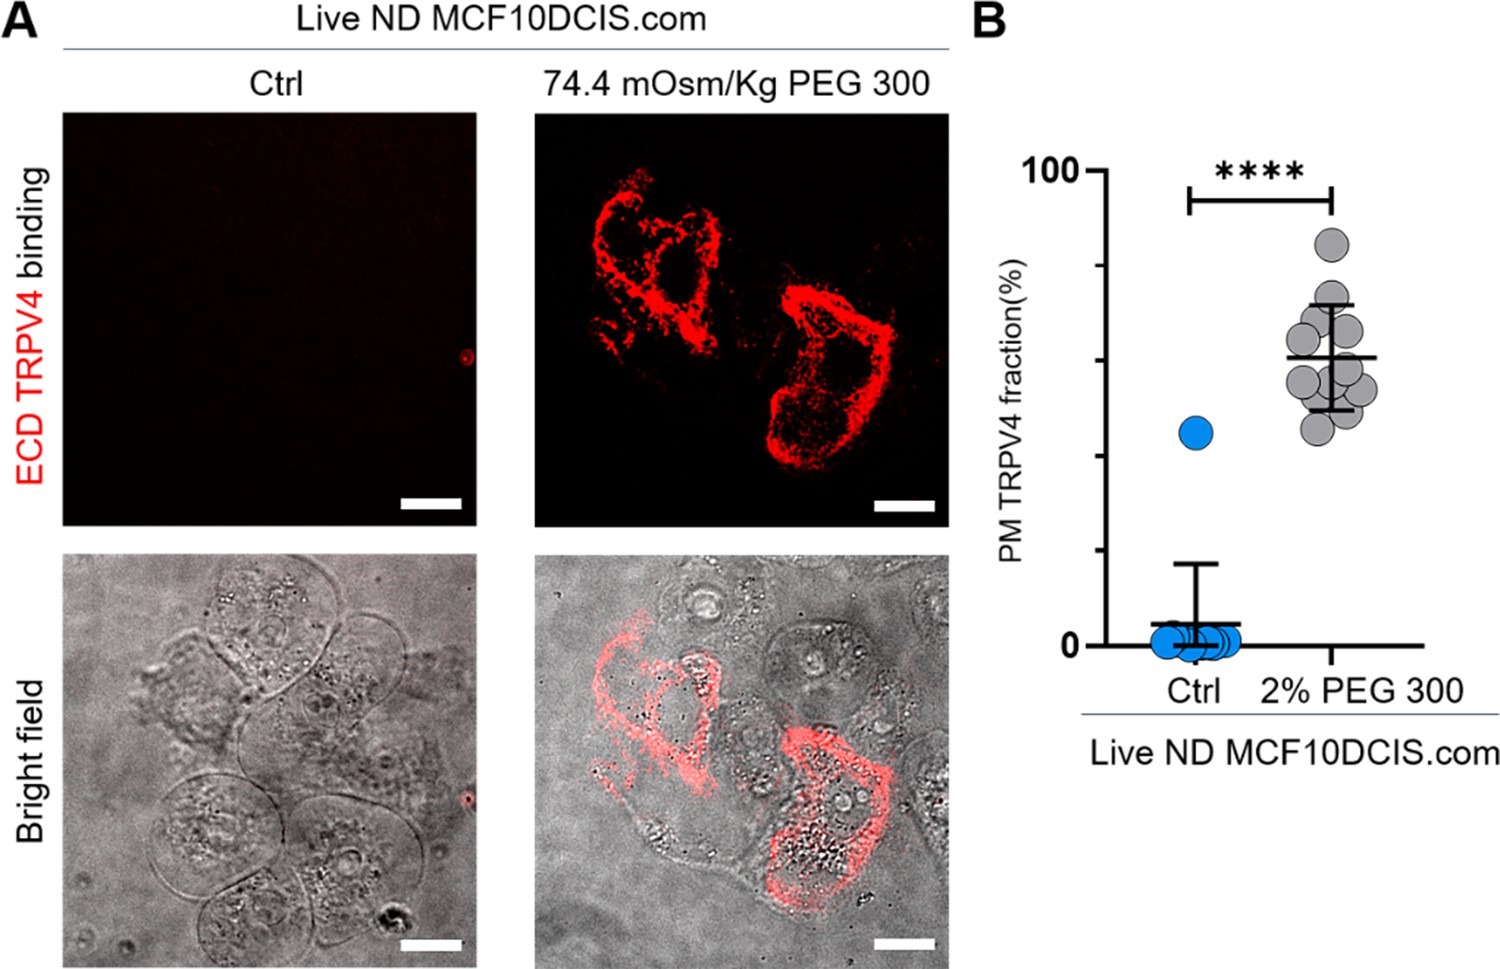
Validation of mechanosensitive relocation of TRPV4 to the plasma membrane in MCF10DCIS.com cells.
(A) To determine whether the seemingly plasma membrane-associated TRPV4 under hyperosmotic conditions was indeed localized at the plasma membrane of live cells, we used an extracellular domain (ECD) TRPV4 antibody. See the Methods section for sample preparation details. Live-cell imaging with 60 X confocal microscopy revealed distinct binding of the ECD TRPV4 antibodies (red) exclusively in MCF10DCIS.com cells treated with 74.4 mOsm/kg PEG 300 for 15 min. No binding was observed in the untreated control group. Brightfield images are shown below the fluorescence images. (B) Line analysis demonstrated that ~60% of TRPV4 was plasma membrane-associated under 2% (74.4 mOsm/kg) PEG 300 conditions, compared to ~0% in untreated cells. Statistical analysis was conducted using a nonparametric Mann-Whitney test with two-tailed p-values. Statistical significance levels are indicated as follows: ****p<0.0001, ***p<0.001, *p<0.1, and ‘ns’ denotes p>0.05.
-
Figure 3—figure supplement 4—source data 1
Original data corresponding to panel B.
- https://cdn.elifesciences.org/articles/100490/elife-100490-fig3-figsupp4-data1-v1.xlsx
Figure 3—figure supplement 5
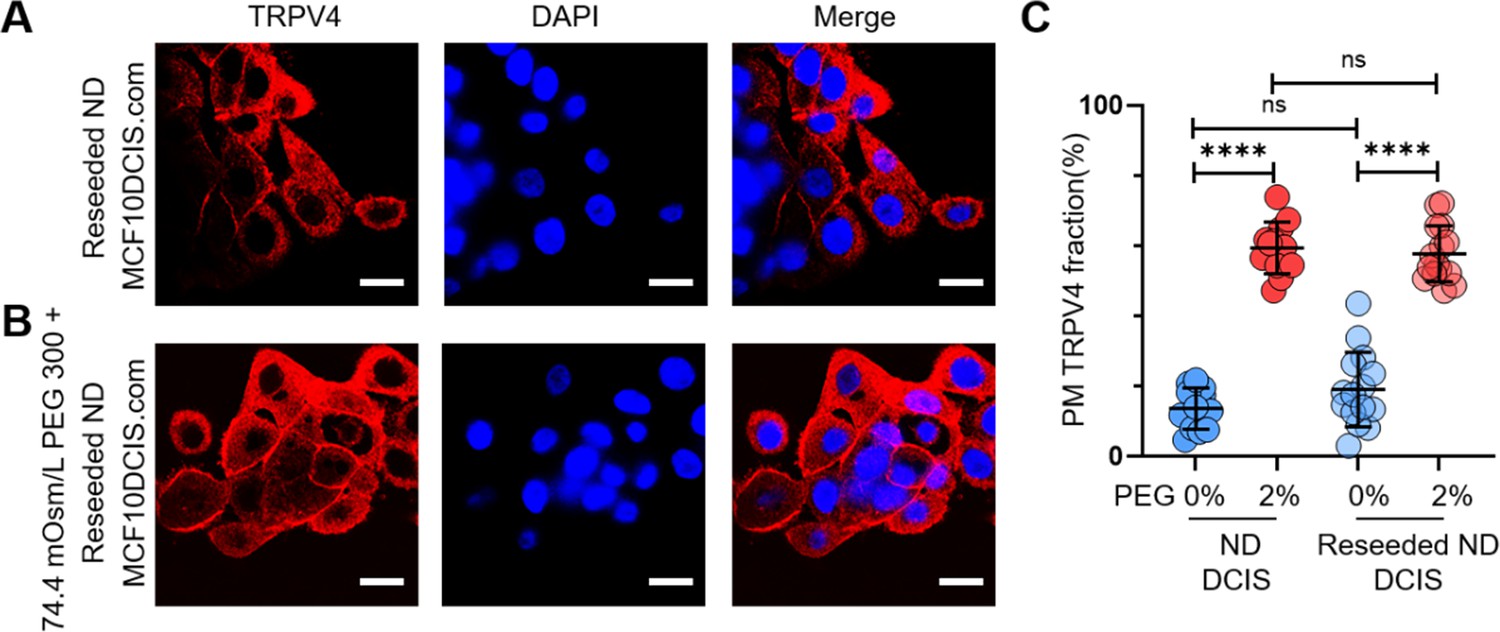
Reversibility of cell-crowding-driven mechanosensing effects in MCF10DCIS.com cells.
(A) Previously overconfluence (OC) MCF10DCIS.com cells were trypsinized and reseeded under normal density (ND) conditions. These cells were fixed and stained for TRPV4 (red) and DAPI (blue) for immunofluorescence (IF) imaging. While TRPV4 was elevated at the plasma membrane under OC conditions, it redistributed to the cytoplasm after the cells were reseeded under ND conditions. (B) The reseeded ND cells responded similarly to hyperosmotic stress (74.4 mOsm/Kg PEG 300 for 15 min), with TRPV4 relocating to the plasma membrane. (C) Line analysis demonstrated that the reseeded ND cells exhibited a TRPV4 distribution pattern comparable to their initial ND counterparts without (blue circles) and with (red circles) hyperosmotic conditions. Statistical analysis was performed using a nonparametric Mann-Whitney test with two-tailed p-values. Statistical significance levels are denoted as follows: ****p<0.0001, ***p<0.001, *p<0.1, and ‘ns’ indicates p>0.05.
-
Figure 3—figure supplement 5—source data 1
Original data corresponding to panel C.
- https://cdn.elifesciences.org/articles/100490/elife-100490-fig3-figsupp5-data1-v1.xlsx
Figure 3—figure supplement 6
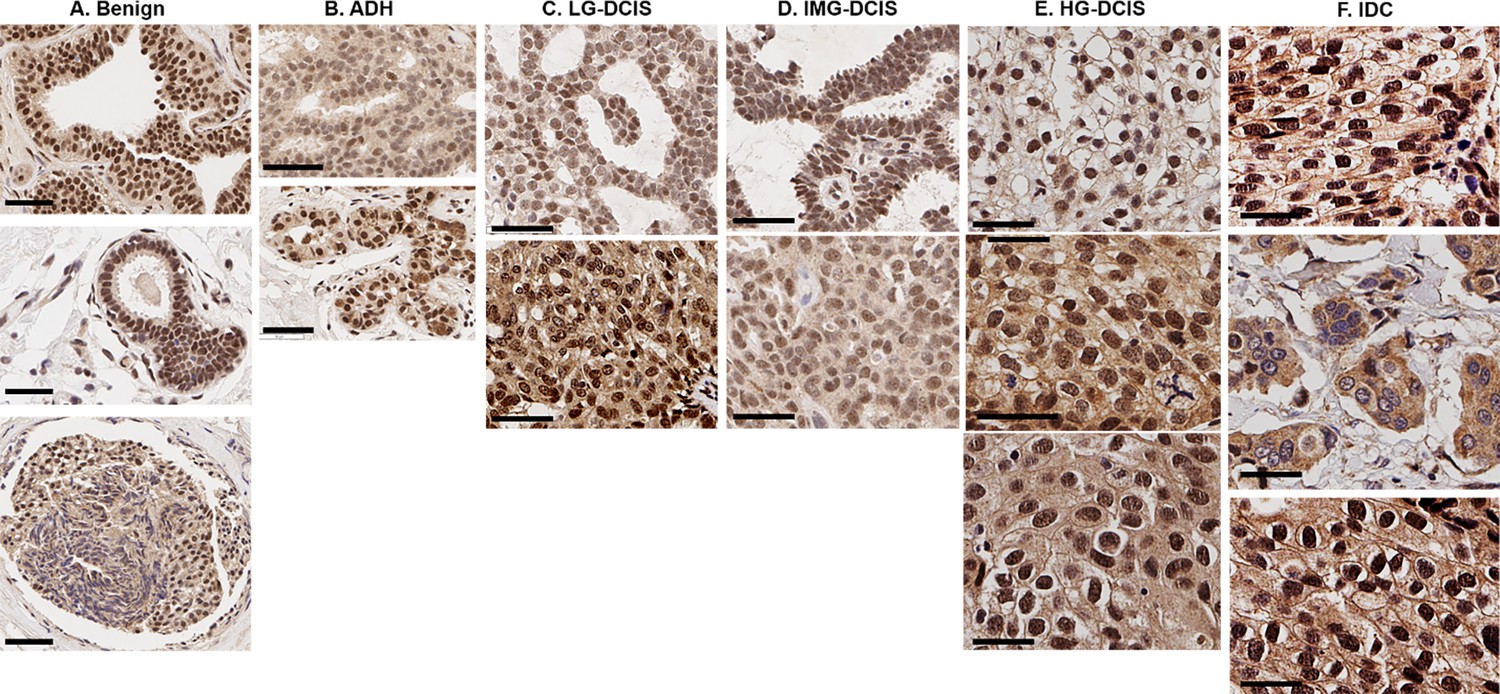
Pathology-dependent differential TRPV4 distributions in patients’ immunohistochemistry (IHC) images.
Representative IHC images for each pathology from different patients are displayed. A selective presence of TRPV4 pools in the plasma membrane was mainly observed in high-grade ductal carcinoma in situ (DCIS) and invasive ductal carcinoma (IDC) lesions. Two pathologists independently conducted annotations. When a consensus was not reached, the case was labeled ‘equivocal.’ The cases were categorized according to the subsequent criteria: Case 1: Absence of TRPV4. Case 2: Intracellular TRPV4 localization. Case 3: Presence of TRPV4 in the plasma membrane, with or without intracellular TRPV4. (A) Benign cases. IHC images - (Top): Pathology: UDH: usual ductal hyperplasia; protein distribution: case 2; (Middle): Pathology: benign (columna); protein distribution: case 2; (Bottom): Pathology: benign (papilloma); protein distribution: case 2. Scale bars = 30 μm. (B) Atypical ductal hyperplasia (ADH) cases. IHC images - (Top): Pathology: ADH: atypical ductal hyperplasia; protein distribution: case 2; (Bottom): Pathology: ADH: atypical ductal hyperplasia; protein distribution: case 2. Scale bars = 50 μm. (C) Low-grade (LG) DCIS cases. IHC images - (Top): Pathology: low-grade DCIS; protein distribution: case 2; (Bottom): Pathology: low-grade DCIS; protein distribution: case 2. Scale bars = 50 μm. (D) Intermediate-grade (IMG) DCIS cases. IHC images - (Top): Pathology: intermediate-grade DCIS; protein distribution: case 2; (Bottom): Pathology: intermediate-grade DCIS; protein distribution: case 2. Scale bars = 50 μm. (E) High-grade (HG) DCIS cases. IHC images - (Top): Pathology: high-grade DCIS; protein distribution: case 3; (Middle): Pathology: high-grade DCIS; protein distribution: the distinction between case 2 and case 3 is equivocal; (Bottom): Pathology: high-grade DCIS; protein distribution: case 3. Scale bars = 50 μm. (F) Invasive ductal carcinoma (IDC) cases. IHC images - (Top): Pathology: IDC; protein distribution: case 3; (Middle): Pathology: IDC; protein distribution: case 2. (Bottom): Pathology: IDC; protein distribution: case 3. Scale bars = 50 μm.
-
Figure 3—figure supplement 6—source data 1
ROI Images.
- https://cdn.elifesciences.org/articles/100490/elife-100490-fig3-figsupp6-data1-v1.pdf
Figure 4 with 3 supplements
Cell crowding inhibits ion channels and triggers their plasma membrane relocations.
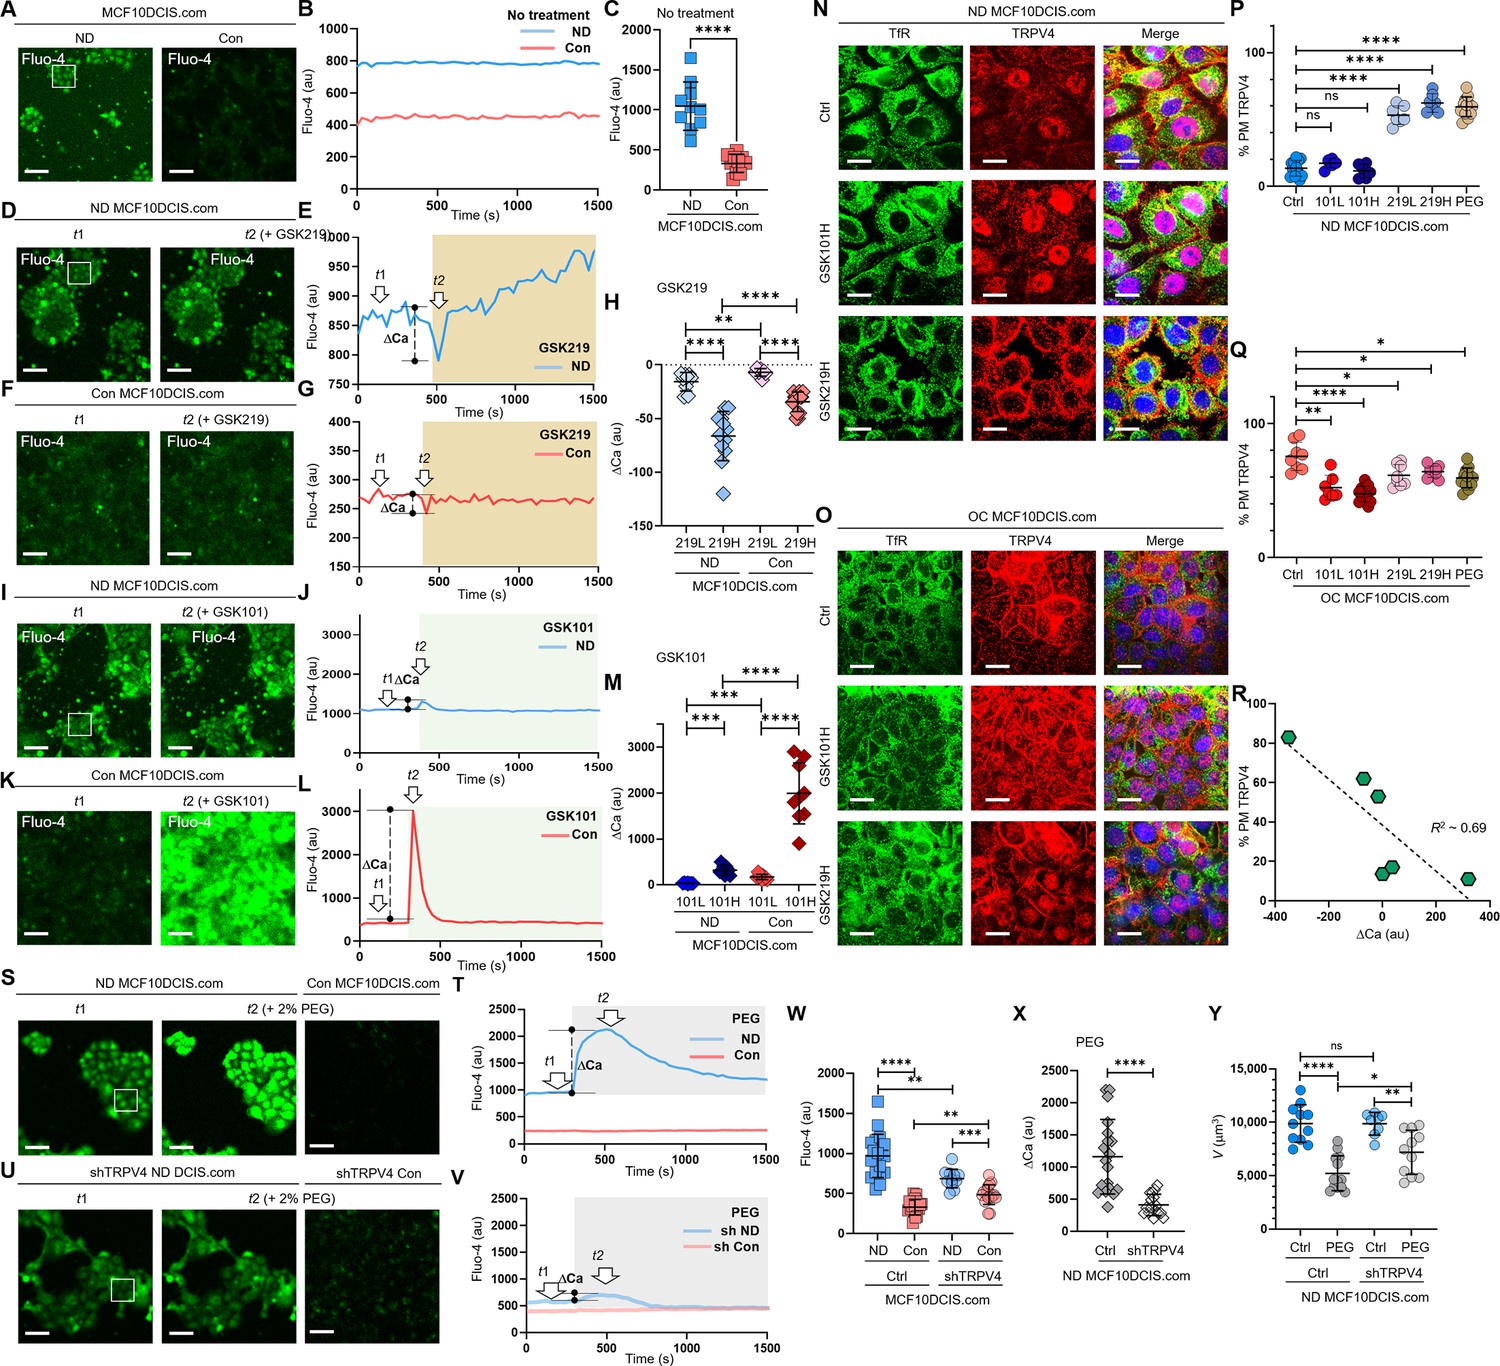
(A) To compare intracellular calcium (Ca²+) levels, we used a Fluo-4 AM assay, where green fluorescence intensity increases with higher intracellular Ca²+ levels. Calcium levels are significantly lower in confluent (Con) MCF10DCIS.com cells. (B) The temporal progression of averaged Fluo-4 intensity in normal density (ND) MCF10DCIS.com cells (blue curve) in the box shown on the left image is compared with that of Con cells (red curve). Fluo-4 intensity is consistently lower in Con cells than in ND cells for approximately 25 min (200 ms acquisition time and 30 s time interval). (C) Fluo-4 intensity reduction due to cell crowding is significant in MCF10DCIS.com cells. 10 images were used for calculating average Fluo-4 intensities for both ND and Con cells. (D-H) Pharmacological inhibition of TRPV4 with 1 nM GSK219 generates dips in the Fluo-4 signal. Fluo-4 images at the baseline (t1) and the dip (t2) post 1 nM GSK219 are compared in MCF10DCIS.com cells between ND (D) and Con (F) conditions. The Fluo-4 intensity time traces are compared between ND (blue; E) and Con (red; G) conditions, showing that the magnitude of the dip (marked as ΔCa) is significantly lower in Con cells, where TRPV4 activity is largely inhibited under cell crowding conditions. Notably, the magnitude of ΔCa increased with higher GSK219 doses (1 nM vs. 0.2 nM), but remained significantly lower in Con MCF10DCIS.com cells, with smaller changes observed under the 0.2 nM GSK219 condition. The number of ΔCa measurements (H) (technical replicates merged from two independent experimental repeats) was as follows: MCF10DCIS.com (ND+ GSK219 Low: 9; ND+ GSK219 High: 12; Con+ GSK219 High: 10; Con+ GSK219 Low: 14). (I-M) TRPV4 activation with 0.2 pM GSK101 leads to a small spike in ND cells (I, J). However, in Con cells, the same GSK101 treatment leads to a notably larger spike in Fluo-4 intensity, indicating that TRPV4 inhibition and subsequent relocation to the plasma membrane by cell crowding primes the ion channels for activation. GSK101 treatment also leads to a dose-dependent increase in the spike magnitude with a higher GSK101 concentration being strikingly high in Con MCF10DCIS.com cells (0.05 pM: 101 L; 0.2 pM: 101 H). The number of ΔCa measurements (M) (technical replicates merged from two independent experimental repeats) was as follows: MCF10DCIS.com (ND+ GSK101 Low: 7; ND+ GSK101 High: 9; Con+ GSK101 Low: 9; Con+ GSK101 High: 9). (N-Q) TRPV4 activation status-dependent intracellular localization changes. (N) IF images of TRPV4 (red) and TfR (green) in ND MCF10DCIS.com cells show that GSK101 does not increase plasma membrane association of TRPV4. However, GSK219 significantly relocates TRPV4 to the plasma membrane in a dose-dependent manner (Figure 4—figure supplement 2B for all dose cases), similar to ND cells treated with 74.4 mOsm/Kg PEG 300. (O) In OC cells, while GSK219 does not significantly alter TRPV4 association with the plasma membrane, GSK101 depletes plasma membrane TRPV4 in a dose-dependent manner (Figure 4—figure supplement 2B for all dose cases), suggesting that TRPV4 activation status affects its trafficking. Relative plasma membrane associations with different treatments are quantified for ND (P) and OC (Q) cells using line analysis. The number of line analyses (P, Q) (technical replicates merged from two independent experimental repeats) was as follows: ND and OC MCF10DCIS.com (control: 12 and 8; GSK219 Low: 6 and 7; GSK219 High: 6 and 13; GSK101 Low: 7 and 8; GSK101 High: 7 and 10; 2% PEG: 12 and 12). (R) The values of Fluo-4 spikes by GSK101 and dips by GSK219 show a linear relationship (R²~0.69) with the plasma membrane TRPV4 association, indicating a negative correlation between them. This reinforces the observation that TRPV4 inhibition increases its association with the plasma membrane, while activation shows the reverse effect. (S-V) Compared to the Fluo-4 intensity in control MCF10DCIS.com cells (S, T), shRNA showed similar baseline Fluo-4 levels (U, V). However, hyperosmotic stress by 74.4 mOsm/Kg PEG 300 (light gray box) led to a noticeable spike only in control ND cells. Additionally, cell crowding conditions (Con) led to a decreased Fluo-4 level (at t1 baseline in the image in S and red time trace in T); but a reduced in Fluo-4 level difference in shRNA-treated MCF10DCIS.com cells (t1; U) compared to control cases (S, T), as shown in the image and time trace (t1; V). (W) Relative Fluo-4 time-averaged intensities are plotted for individual control ND (blue) vs. Con (red) cells, and shRNA-treated ND (semi-transparent blue) vs. Con (semi-transparent red) cells. Intracellular calcium levels in shRNA ND cells are lower than those in control ND cells, reflecting the reduced number of TRPV4 channels. The decrease in calcium levels by crowding (Con) in shRNA cells is clearly lower than in control cells, reflecting the importance of TRPV4 in mechanosensing cell volume reduction. The number of Fluo-4 average measurements (technical replicates merged from two independent experimental repeats) was as follows: MCF10DCIS.com control and TRPV4 shRNA groups (ND: 19 and 18; Con: 11 and 17). (X) PEG 300-induced calcium spikes are significantly lower in shRNA cells (semi-transparent gray) than in control cells (gray), reinforcing TRPV4’s crucial role in MCF10DCIS.com mechanotransduction. The number of ΔCa measurements under 2% PEG 300 condition was as follows: ND MCF10DCIS.com (ND: 19; TRPV4shRNA: 16). (Y) TRPV4 silencing significantly reduced the mechanosensing cell volume reduction effect. Control ND cells underwent a 48% volume reduction in response to 74.4 mOsm/Kg PEG 300, whereas TRPV4-silenced cells reduced their volume by only 27%. The number of single-cell volume measurements (technical replicates merged from two independent experimental repeats) was as follows: ND and TRPV4shRNA treated MCF10DCIS.com (Control: 11 and 13; 2% PEG 8 and 11). ****p<0.0001, ***p<0.001, **p<0.01, *p<0.05, ns: p>0.05.
-
Figure 4—source data 1
Original data corresponding to panel B.
- https://cdn.elifesciences.org/articles/100490/elife-100490-fig4-data1-v1.xlsx
-
Figure 4—source data 2
Original data corresponding to panel C.
- https://cdn.elifesciences.org/articles/100490/elife-100490-fig4-data2-v1.xlsx
-
Figure 4—source data 3
Original data corresponding to panel E.
- https://cdn.elifesciences.org/articles/100490/elife-100490-fig4-data3-v1.xlsx
-
Figure 4—source data 4
Original data corresponding to panel G.
- https://cdn.elifesciences.org/articles/100490/elife-100490-fig4-data4-v1.xlsx
-
Figure 4—source data 5
Original data corresponding to panel H.
- https://cdn.elifesciences.org/articles/100490/elife-100490-fig4-data5-v1.xlsx
-
Figure 4—source data 6
Original data corresponding to panel J.
- https://cdn.elifesciences.org/articles/100490/elife-100490-fig4-data6-v1.xlsx
-
Figure 4—source data 7
Original data corresponding to panel L.
- https://cdn.elifesciences.org/articles/100490/elife-100490-fig4-data7-v1.xlsx
-
Figure 4—source data 8
Original data corresponding to panel M.
- https://cdn.elifesciences.org/articles/100490/elife-100490-fig4-data8-v1.xlsx
-
Figure 4—source data 9
Original data corresponding to panel P.
- https://cdn.elifesciences.org/articles/100490/elife-100490-fig4-data9-v1.xlsx
-
Figure 4—source data 10
Original data corresponding to panel Q.
- https://cdn.elifesciences.org/articles/100490/elife-100490-fig4-data10-v1.xlsx
-
Figure 4—source data 11
Original data corresponding to panel R.
- https://cdn.elifesciences.org/articles/100490/elife-100490-fig4-data11-v1.xlsx
-
Figure 4—source data 12
Original data corresponding to panel T.
- https://cdn.elifesciences.org/articles/100490/elife-100490-fig4-data12-v1.xlsx
-
Figure 4—source data 13
Original data corresponding to panel V.
- https://cdn.elifesciences.org/articles/100490/elife-100490-fig4-data13-v1.xlsx
-
Figure 4—source data 14
Original data corresponding to panel W.
- https://cdn.elifesciences.org/articles/100490/elife-100490-fig4-data14-v1.xlsx
-
Figure 4—source data 15
Original data corresponding to panel X.
- https://cdn.elifesciences.org/articles/100490/elife-100490-fig4-data15-v1.xlsx
-
Figure 4—source data 16
Original data corresponding to panel Y.
- https://cdn.elifesciences.org/articles/100490/elife-100490-fig4-data16-v1.xlsx
Figure 4—figure supplement 1
Peripheral cells within MCF10DCIS.com cell clusters exhibit higher calcium levels due to reduced cell crowding effects.
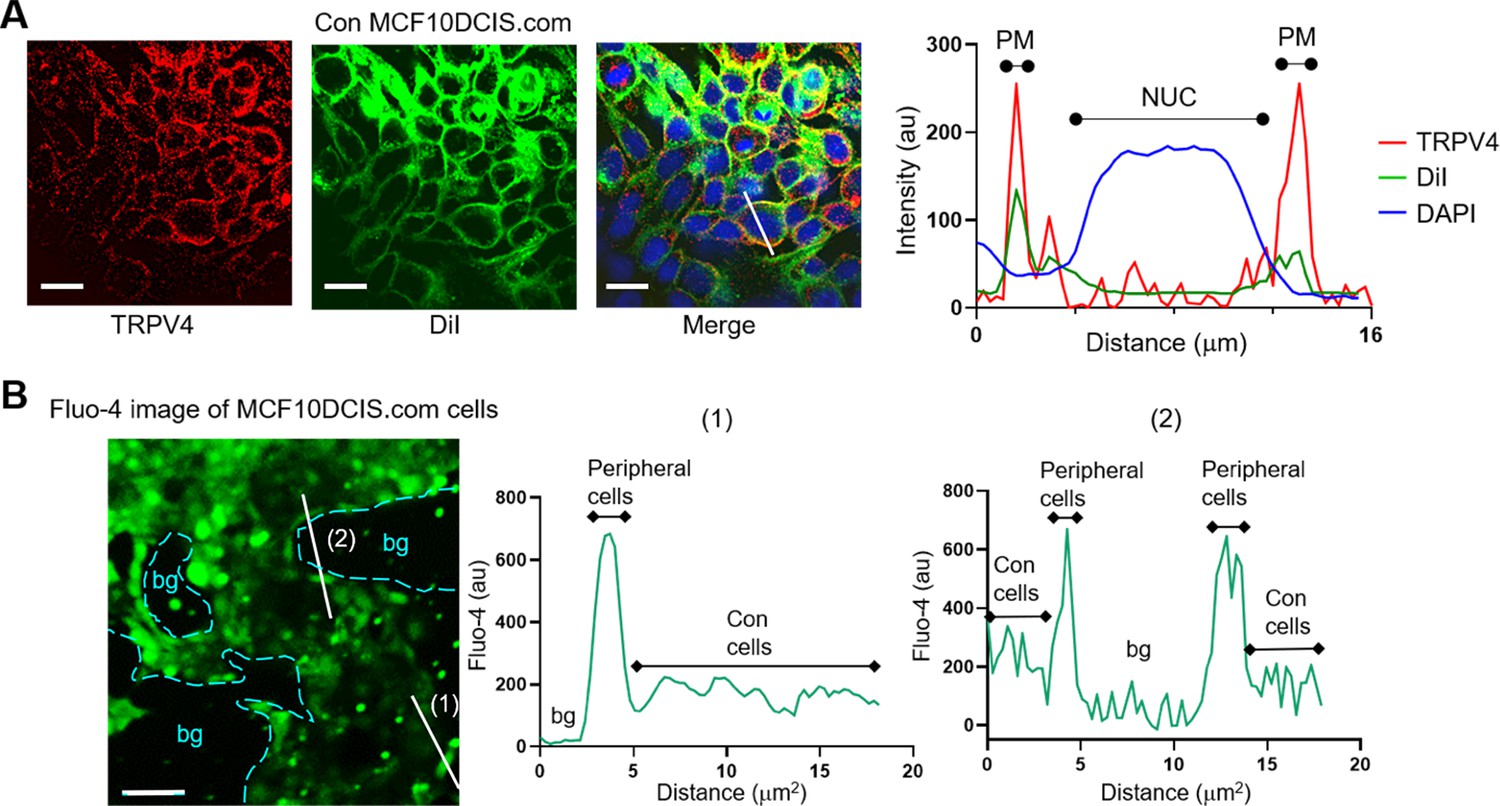
(A) Confluent cell density (Con) also triggered the relocation of TRPV4 (red) to the plasma membrane, similar to OC conditions, as shown in immunofluorescence (IF) image (left). We used DiIC18(3) to indicate the plasma membrane location (green; DiI; middle image), and the merged image (right) of TRPV4 and DiIC18(3) shows excellent overlay at the plasma membrane (PM), as illustrated in the line profile plots from our line analysis. DAPI (blue) staining was used to locate the nucleus (NUC). Scale bar = 20 μm. (B) Confluent cell density resulted in lower intracellular calcium levels compared to less confluent cells. Live MCF10DCIS.com cells stained with Fluo-4 were imaged using confocal microscopy at 488 nm. Two line profiles crossing peripheral cells (less confluent than confluent cells) and adjacent confluent cells within the clusters clearly showed that the peripheral cells have a higher Fluo-4 signal (700 au) compared to the confluent cells within the cluster (200 au), highlighting the crowding-induced intracellular calcium reduction. Background regions (bg) were noted with cyan dashed-lines in the fluorescent image and in the plots. Scale bar = 100 μm.
-
Figure 4—figure supplement 1—source data 1
Original data corresponding to panel A.
- https://cdn.elifesciences.org/articles/100490/elife-100490-fig4-figsupp1-data1-v1.xlsx
-
Figure 4—figure supplement 1—source data 2
Original data corresponding to panel B.
- https://cdn.elifesciences.org/articles/100490/elife-100490-fig4-figsupp1-data2-v1.xlsx
Figure 4—figure supplement 2
Determination of treatment concentration ranges for TRPV4 activator (GSK101) and inhibitor (GSK219).
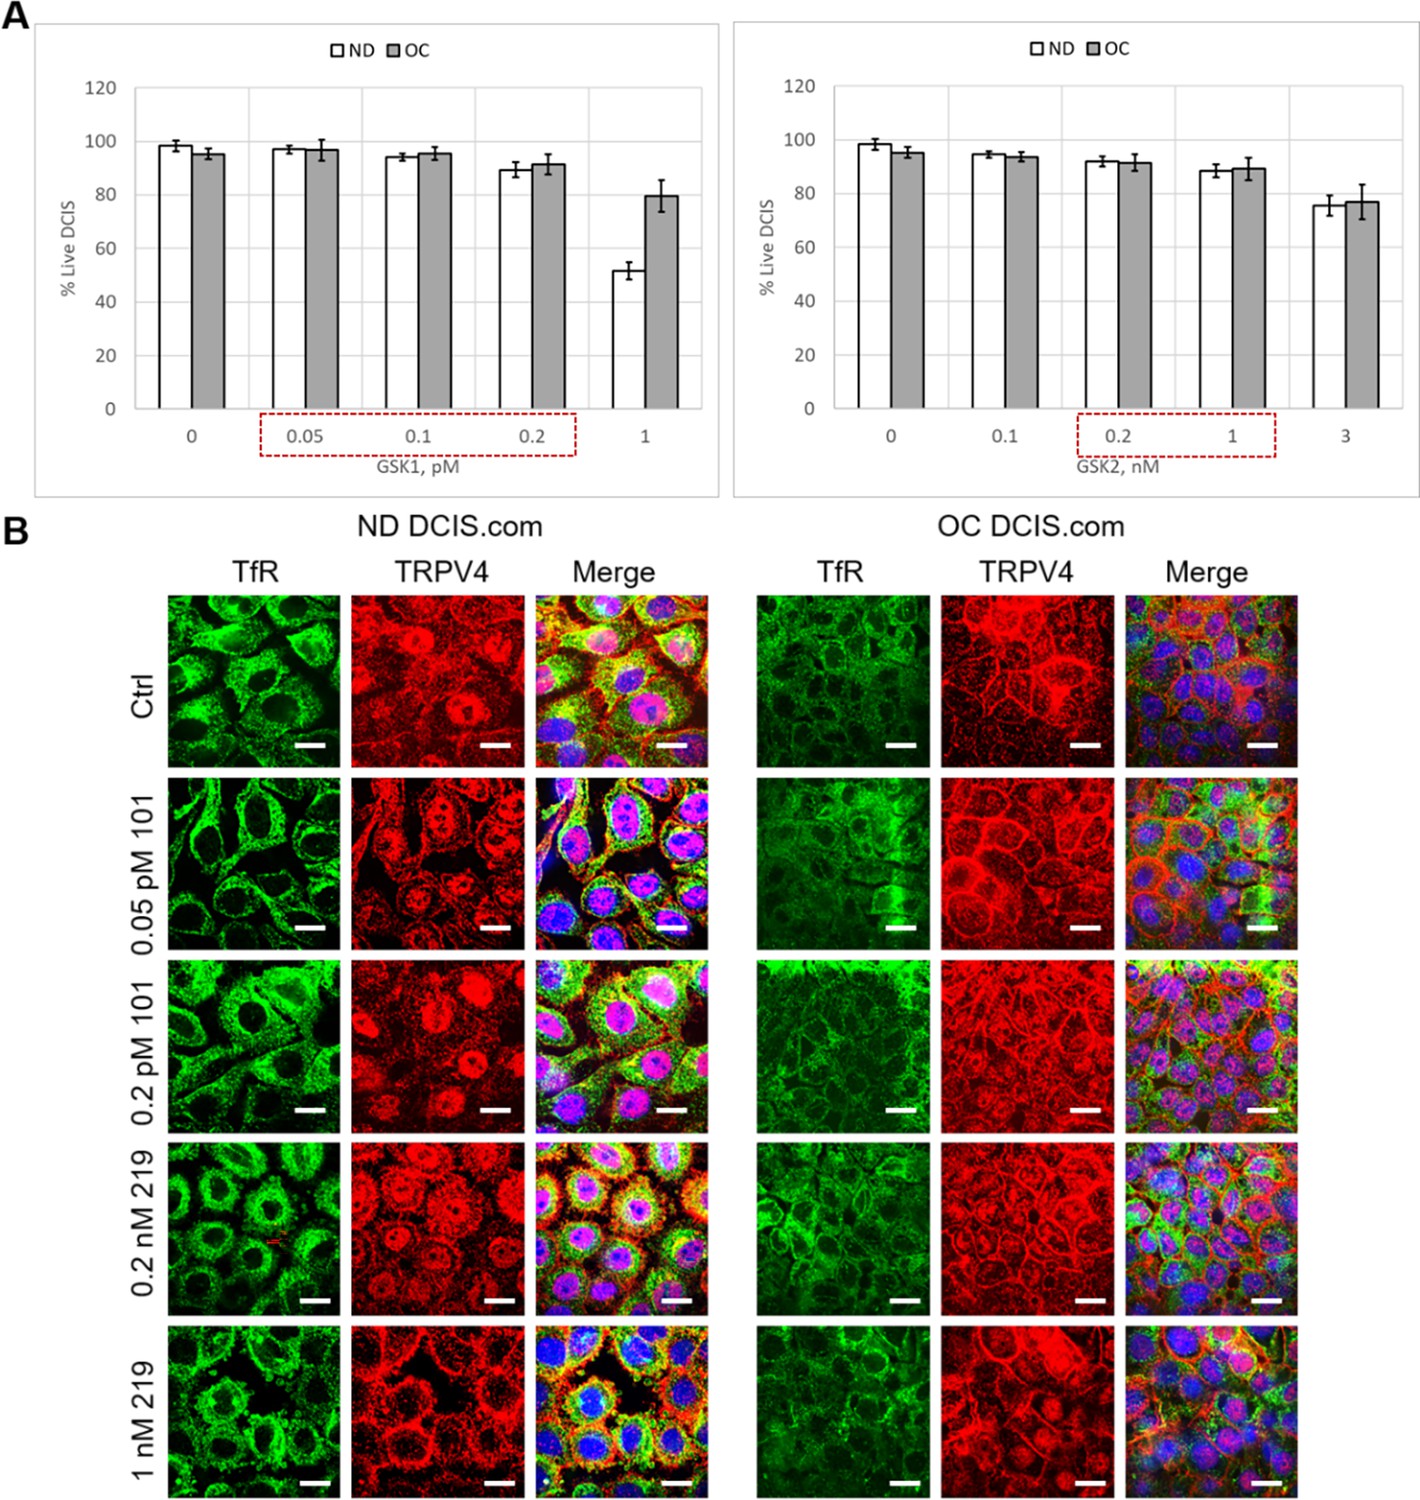
(A) Cell viability assays in which viable cells were counted based on trypan blue exclusion after 2 d of GSK101 or GSK219 treatment in the specified concentration ranges of ductal carcinoma in situ (DCIS) in normal density (ND) (white bars) and overconfluence (OC) (gray bars) conditions. Treatment ranges were selected so that cell viability was >90%. Concentrations used for dose-dependent assays were 0.05 and 0.2 pM for GSK101, and 0.2 and 1 nM for GSK219 (marked by dotted red boxes). (B) Representative confocal microscopy immunofluorescence images showed effects of GSK101 (0.05 and 0.2 pM) or GSK219 (0.2 and 1 nM) treatment for two days on TRPV4 (red) and control transferrin receptor (TfR; green) distributions in ND and OC cells in a dose-dependent manner. DAPI (blue) signal is shown in the merged images. Scale bar = 20 μm.
-
Figure 4—figure supplement 2—source data 1
Original data corresponding to panel A.
- https://cdn.elifesciences.org/articles/100490/elife-100490-fig4-figsupp2-data1-v1.xlsx
Figure 4—figure supplement 3
Hyperosmotic stress also induces plasma membrane relocation of ion channels, similar to cell crowding.
(A) Using the Fluo-4 assay, we observed an initial calcium spike (marked as ‘Rise’) in ND MCF10DCIS.com cells in response to 74.4 mOsmol/kg PEG 300, due to osmotic water outflow. This was followed by a homeostatic relaxation, aimed at restoring calcium levels, which likely involved the inhibition of ion channels like TRPV4, leading to their plasma membrane relocation. Scale bars = 20 μm. (B) The same hyperosmotic condition (74.4 mOsm/Kg PEG 300 for 15 min) led to the relocation of KCNN4 and PIEZO1 to the plasma membrane, similar to the relocations observed under OC conditions. Line analysis results showed the relative relocations of each channel in response to hyperosmotic (PEG) and cell crowding (OC) stresses, compared to ND conditions.
-
Figure 4—figure supplement 3—source data 1
Original data corresponding to panel A.
- https://cdn.elifesciences.org/articles/100490/elife-100490-fig4-figsupp3-data1-v1.xlsx
-
Figure 4—figure supplement 3—source data 2
Original data corresponding to panel B.
- https://cdn.elifesciences.org/articles/100490/elife-100490-fig4-figsupp3-data2-v1.xlsx
Figure 5 with 1 supplement
Cell crowding-induced plasma membrane TRPV4 association scales with cell volume reduction and increases in invasiveness and motility.
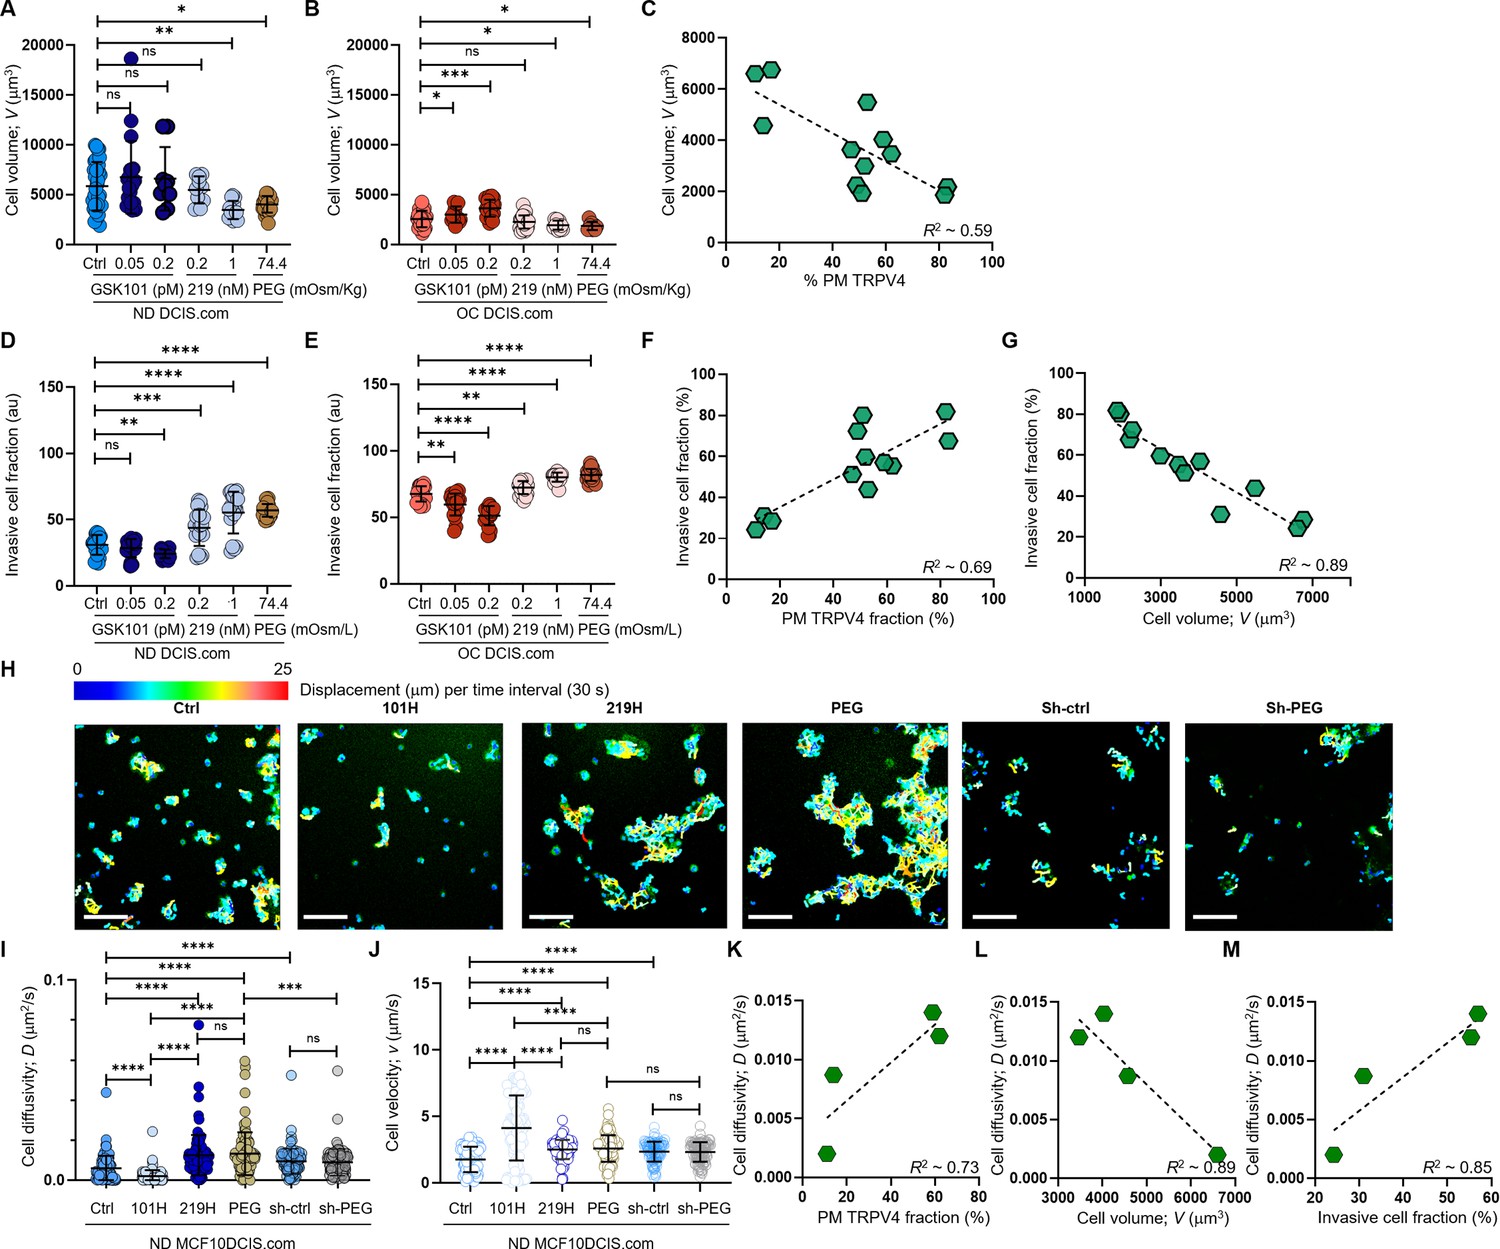
(A-C). MCF10DCIS.com cell volume changes with TRPV4 inhibition and activation. (A) In ND MCF10DCIS.com cells, TRPV4 agonist GSK101, which did not alter plasma membrane association of TRPV4, did not affect cell volume. Conversely, TRPV4 inhibitor GSK219, which increased plasma membrane association in a dose-dependent manner, reduced cell volume, with the effect of 1 nM GSK219 (219 H) being similar to that of 74.4 mOsm/Kg (2%) PEG 300. (B) Under OC conditions, GSK101, which led to significant Fluo-4 spikes, increased cell volume in a dose-dependent manner, while GSK219 and PEG only mildly reduced cell volume. (C) Cell volume changes in MCF10DCIS.com cells show an inverse relationship (R²=0.59) with plasma membrane association of TRPV4, reflecting the activation status of the channel. The number of single-cell volume measurements (technical replicates merged from three independent experimental repeats): ND (A) and OC (B) MCF10DCIS.com cells (Control: 33 and 43; GSK101 0.05 pM: 19 and 15; GSK101 0.2 pM: 9 and 22; GSK219 0.1 nM: 10 and 36; GSK101 1 nM: 15 and 9; 2% PEG 300: 23 and 8). (D-F) Cell invasiveness increases with greater cell volume reduction and plasma membrane association of TRPV4. (D) Cell invasiveness significantly increased with higher GSK219 concentrations under ND conditions. (E) GSK101 under OC conditions caused a notable decrease in cell invasiveness in a dose-dependent manner. (F-G) Plasma membrane association of TRPV4 predictably reports cell invasiveness (R²~0.69; F), while cell invasiveness and cell volume are inversely related (R²~0.69; G), reinforcing our observation that cell volume reduction promotes cell invasiveness. The number of invasive cell fraction measurements (technical replicates merged from two independent experimental repeats): ND (D) and OC (E) MCF10DCIS.com cells (Control: 6 and 4; GSK101 0.05 pM: 4 and 4; GSK101 0.2 pM: 4 and 4; GSK219 0.1 nM: 4 and 4; GSK101 1 nM: 4 and 4; 2% PEG 300: 4 and 7). (H-M) To assess if cell motility also follows the trend of cell invasiveness, we performed a single-cell motility assay by tracking nuclear WGA in individual live cells every 60 s for 25 min. (H) Representative trajectories of individual cells were color-coded to reflect displacement at each time interval. Compared to untreated ND cells, 0.2 pM GSK101 treatment slowed overall cell diffusion, while 1 nM GSK219 and 74.4 mOsm/Kg PEG 300 treatments increased cell diffusion. ShRNA TRPV4 (Sh-ctrl) increased cell motility under ND conditions. However, with TRPV4 depletion, treatment with 74.4 mOsm/Kg PEG 300 failed to increase cell diffusivity (D) in shRNA-treated cells (Sh-PEG), unlike in the untreated cells. Scale bar = 200 μm. Using single-cell analysis, we quantified cell diffusivity (D) and speed (v; movement directionality). (I) GSK101 treatment significantly reduced D, while GSK219 and PEG 300 notably increased it. shRNA TRPV4 also increased ND cell D, but PEG treatment did not change D in the shRNA-treated cells. (J) GSK101, GSK219, PEG 300, and shRNA treatments increased v, with GSK101 causing the most significant increase. The directionality of shRNA-treated ND cells was unaffected by PEG treatment. The number of single-cell motility measurements of MCF10DCIS.com cells (technical replicates merged from two independent experimental repeats): Control: 81; GSK101: 100; GSK219: 100, PEG: 100; shRNA: 102; shRNA +PEG: 104. (K) Like cell invasiveness, cell motility (D) positively scales with plasma membrane association of TRPV4 (R²~0.73). (L) Cell motility (D) inversely relates to cell volume (R²~0.89). (M) Cell motility (D) and cell invasiveness show a strong linear relationship (R²~0.85), enabling the use of cell motility measurements to assess overall cell invasiveness. ****p<0.0001, ***p<0.001, **p<0.01, *p<0.05, ns: p>0.05.
-
Figure 5—source data 1
Original data corresponding to panel A.
- https://cdn.elifesciences.org/articles/100490/elife-100490-fig5-data1-v1.xlsx
-
Figure 5—source data 2
Original data corresponding to panel B.
- https://cdn.elifesciences.org/articles/100490/elife-100490-fig5-data2-v1.xlsx
-
Figure 5—source data 3
Original data corresponding to panel C.
- https://cdn.elifesciences.org/articles/100490/elife-100490-fig5-data3-v1.xlsx
-
Figure 5—source data 4
Original data corresponding to panel D.
- https://cdn.elifesciences.org/articles/100490/elife-100490-fig5-data4-v1.xlsx
-
Figure 5—source data 5
Original data corresponding to panel E.
- https://cdn.elifesciences.org/articles/100490/elife-100490-fig5-data5-v1.xlsx
-
Figure 5—source data 6
Original data corresponding to panel F.
- https://cdn.elifesciences.org/articles/100490/elife-100490-fig5-data6-v1.xlsx
-
Figure 5—source data 7
Original data corresponding to panel G.
- https://cdn.elifesciences.org/articles/100490/elife-100490-fig5-data7-v1.xlsx
-
Figure 5—source data 8
Original data corresponding to panel I.
- https://cdn.elifesciences.org/articles/100490/elife-100490-fig5-data8-v1.xlsx
-
Figure 5—source data 9
Original data corresponding to panel J.
- https://cdn.elifesciences.org/articles/100490/elife-100490-fig5-data9-v1.xlsx
-
Figure 5—source data 10
Original data corresponding to panel K.
- https://cdn.elifesciences.org/articles/100490/elife-100490-fig5-data10-v1.xlsx
-
Figure 5—source data 11
Original data corresponding to panel L.
- https://cdn.elifesciences.org/articles/100490/elife-100490-fig5-data11-v1.xlsx
-
Figure 5—source data 12
Original data corresponding to panel M.
- https://cdn.elifesciences.org/articles/100490/elife-100490-fig5-data12-v1.xlsx
Figure 5—figure supplement 1
Mechanical stresses and TRPV4 activation status affect MCF10DCIS.com cell invasiveness.
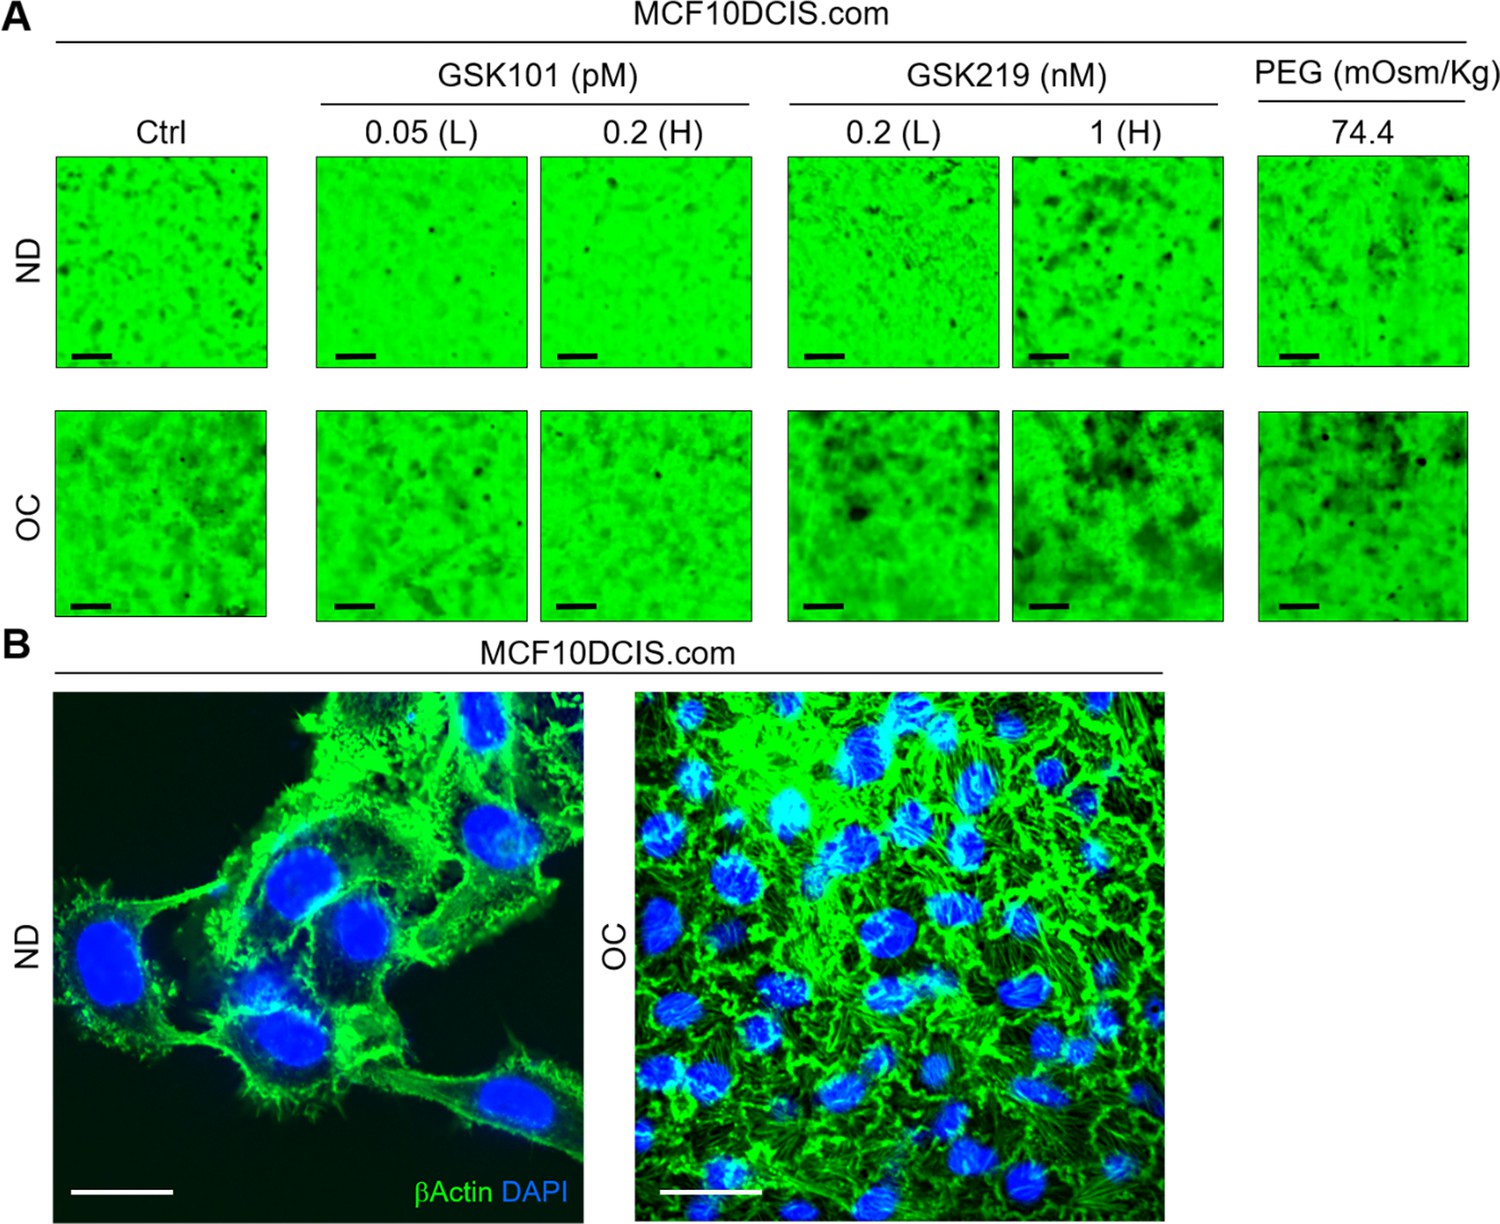
(A) The effects of 2 d of treatment with GSK101 (0.05 and 0.2 pM), GSK219 (0.2 and 1 nM), and PEG 300 (74.4 mOsm/kg) on the invasiveness of MCF10DCIS.com cells under normal density (ND) and overconfluence (OC) conditions. Gelatin488 images demonstrated the dose-dependent negative effects of GSK101 and positive effects of GSK219 on cell invasiveness. Similar to GSK219, PEG 300 also increased cell invasiveness. Scale bar = 100 μm. (B) Immunofluorescence (IF) images of β−actin (green) and DAPI (blue) in MCF10DCIS.com cells under ND (left) and OC (right) conditions. Strong stress fiber formation was observed in OC cells, while it was absent in ND cells, which was reflected by the increased stiffness of OC cells (Figure 2C). This suggests that cell crowding may enhance cell motility. Scale bar = 20 μm.
Figure 6 with 1 supplement
pro-invasive cell volume mechanotransduction pathway indicators.
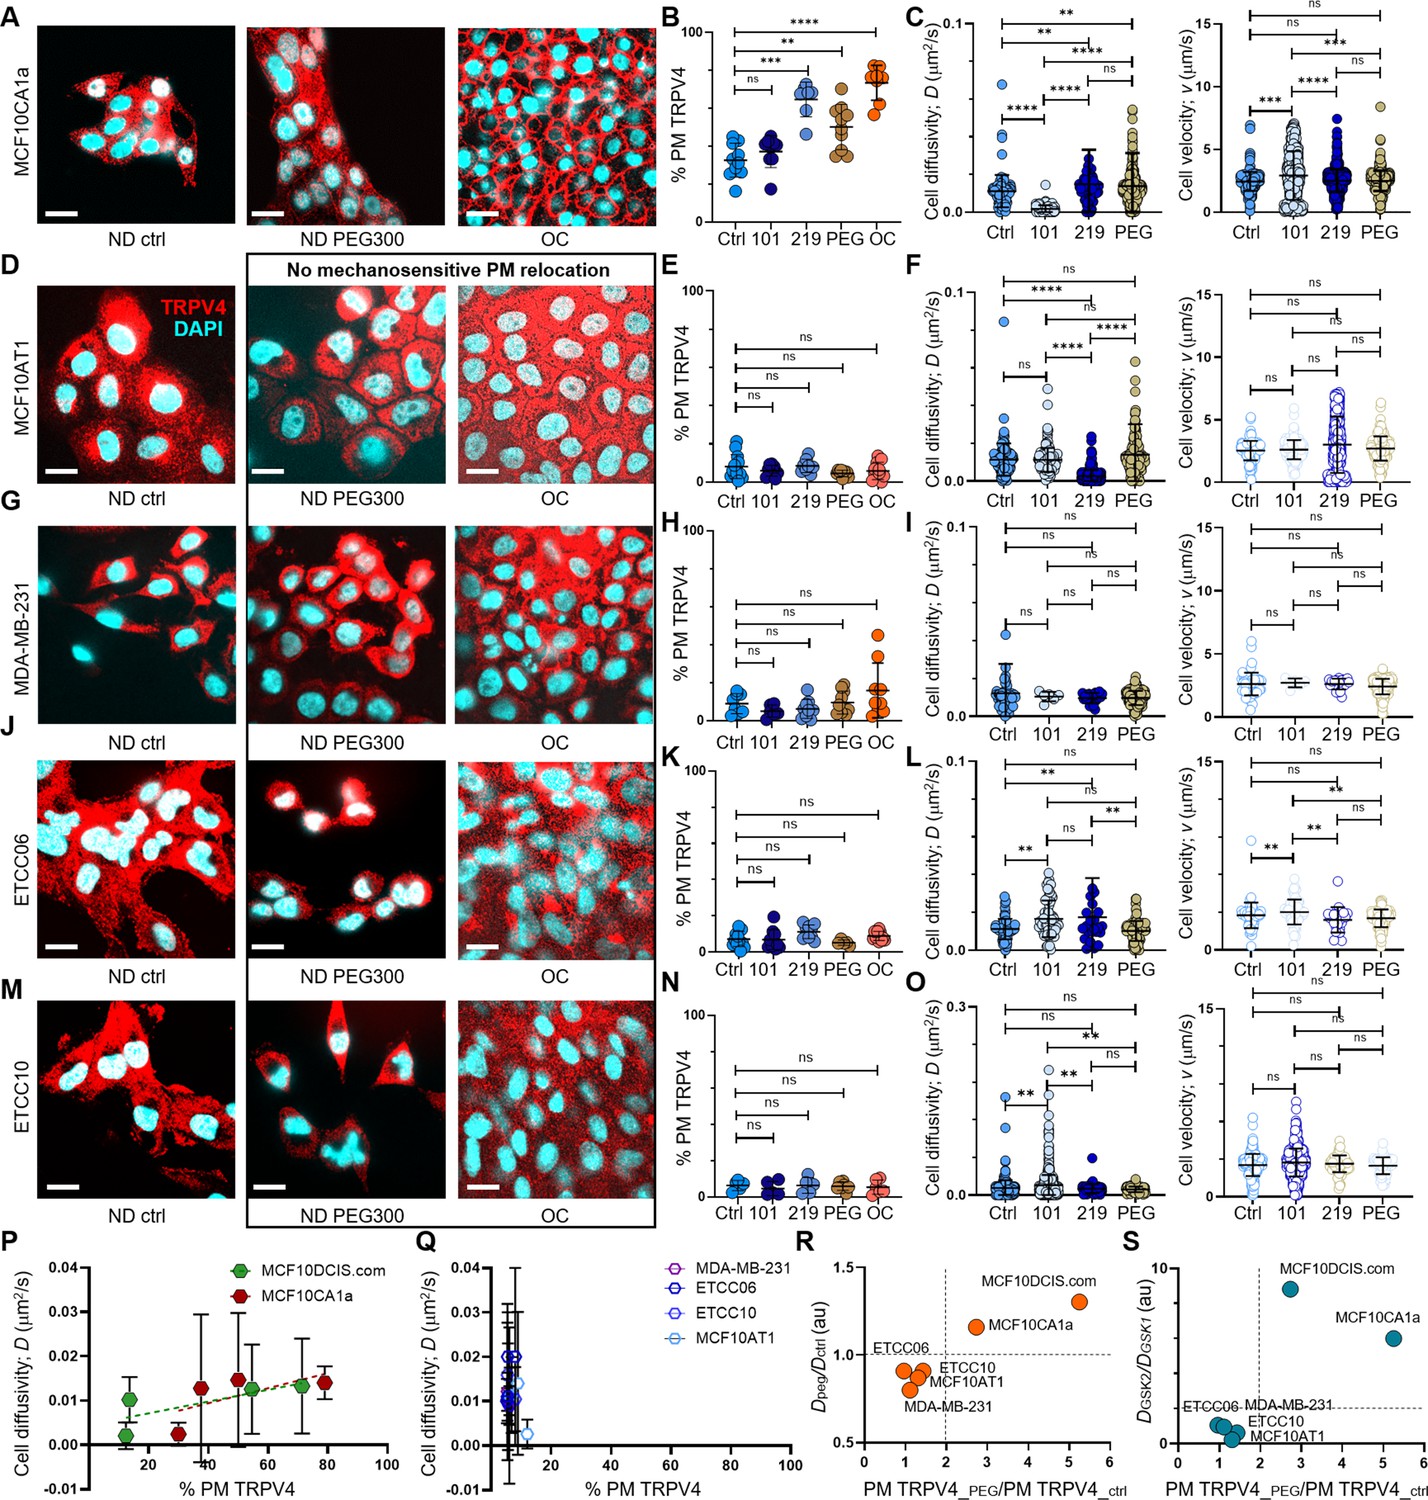
(A) In MCF10CA1a cells, plasma membrane relocation of TRPV4 was induced by a 15 min treatment with 2% PEG 300 (74.4 mOsm/kg) or by overconfluence (OC) conditions. IF images show a largely intracellular distribution of TRPV4 (red) in normal density (ND) control cells, whereas cells treated with PEG 300 or subjected to OC exhibit a significant increase in plasma membrane-associated TRPV4. Nuclei are stained with DAPI (blue). Scale bars in all panels of this figure represent 10 μm. (B) Line analysis quantifying plasma membrane-associated TRPV4 (%) reveals significant increases following a 1 hr treatment with GSK219 (1 nM), a 15 min exposure to 74.4 mOsm/kg PEG 300, or under OC conditions in MCF10CA1a cells. In contrast, no significant increase in plasma membrane TRPV4 is observed with GSK101 treatment. (C) In MCF10CA1a cells, cell movement diffusivity (D) increased following GSK219 or PEG 300 treatments, whereas it decreased with GSK101. Conversely, movement directionality (v) increased significantly with GSK101 (0.2 pM) but remained unchanged with GSK219 or PEG treatments. (D-O) No plasma membrane relocation of TRPV4 was observed in response to inhibition by GSK219, hyperosmotic stress induced by PEG 300, or cell crowding (OC) in MCF10AT1 (D, E, F), MDA-MB-231 (G, H, I), ETCC-006 (J, K, L), and ETCC-010 (M, N, O) cells. Similarly, GSK219 or PEG 300 did not increase single-cell motility in these cells. This is demonstrated by IF images (TRPV4: red; DAPI: blue) (D, G, J, M), line analysis results for plasma membrane-associated TRPV4 (E, H, K, N), and single-cell motility analyses for diffusivity (D) and directionality (v) (F, I, L, O). Notably, none of these cell lines showed motility changes in response to PEG 300 treatment. However, responses to TRPV4 activation (GSK101) and inhibition (GSK219) varied across cell types, suggesting distinct roles of TRPV4 in their cancer biology. In MCF10AT1 cells (F), GSK219 significantly reduced diffusivity (D), while no other treatment affected D or v. In MDA-MB-231 cells (I), neither D nor v was altered by any treatment, indicating that TRPV4 has an insignificant role in their motility. Both ETCC-006 and ETCC-010 cells exhibited increased diffusivity with GSK101; however, GSK219 also increased diffusivity in ETCC-006 cells (L), while having no effect on ETCC-010 cells (O). Directionality (v) increased with GSK101 in ETCC-006 cells (L), whereas ETCC-010 cells showed no change in v across all conditions (O). The number of line analyses for plasma membrane-associated TRPV4 under ND control, ND +0.2 pM GSK101, ND +1 nM GSK219, ND +2% PEG 300, and OC conditions (technical replicates merged from three independent experimental repeats) were: MCF10CA1a (B): 11, 6, 8, 12, 10; MCF10AT1 (E): 13, 9, 8, 9, 19; MDA-MB-231 (H): 13, 9, 8, 9, 19; ETCC-006 (K): 12, 10, 10, 5, 10; and ETCC-010 (N): 5, 5, 7, 5, 6. The number of single-cell motility analyses under ND control, ND +0.2 pM GSK101, ND +1 nM GSK219, and ND +2% PEG 300 conditions were: MCF10CA1a (C): 100, 100, 100, 100; MCF10AT1 (F): 130, 161, 582, 183; MDA-MB-231 (I): 57, 6, 21, 442; ETCC-006 (L): 65, 66, 24, 100; and ETCC-010 (O): 317, 1136, 43, 71. (P) Plasma membrane association of TRPV4 (% PM TRPV4) scaled positively with cell diffusivity (D) over a broader range in MCF10DCIS.com cells compared to MCF10CA1a cells, consistent with the higher cell volume plasticity observed in MCF10DCIS.com cells. This finding suggests that both cell types engage a pro-invasive mechanotransduction pathway. (Q) In contrast, this scaling relationship is absent in MCF10AT1, MDA-MB-231, ETCC-006, and ETCC-010 cells, indicating a lack of the mechanotransduction response. (R) The presence of this pathway in MCF10CA1a and MCF10DCIS.com cells is further supported by the observed > twofold increase in TRPV4 plasma membrane association (x-axis; PM TRPV4_peg/PM TRPV4_ctrl) and > onefold increase in diffusivity (y-axis; Dpeg/Dctrl) following PEG-300 treatment. (S) The cell volume reduction-driven mechanotransduction pathway is further demonstrated by plotting PEG-300-induced changes in TRPV4 plasma membrane association (x-axis; PM TRPV4_peg/PM TRPV4_ctrl) against the diffusivity ratio with GSK219 versus GSK101 (y-axis), where both cell types show a significantly greater than twofold increase, highlighting the activation of this pathway in MCF10DCIS.com and MCF10CA1a cells.****p<0.0001, ***p<0.001, **p<0.01, *p<0.05, ns: p>0.05.
-
Figure 6—source data 1
Original data corresponding to panel B.
- https://cdn.elifesciences.org/articles/100490/elife-100490-fig6-data1-v1.xlsx
-
Figure 6—source data 2
Original data corresponding to panel C.
- https://cdn.elifesciences.org/articles/100490/elife-100490-fig6-data2-v1.xlsx
-
Figure 6—source data 3
Original data corresponding to panel E.
- https://cdn.elifesciences.org/articles/100490/elife-100490-fig6-data3-v1.xlsx
-
Figure 6—source data 4
Original data corresponding to panel F.
- https://cdn.elifesciences.org/articles/100490/elife-100490-fig6-data4-v1.xlsx
-
Figure 6—source data 5
Original data corresponding to panel H.
- https://cdn.elifesciences.org/articles/100490/elife-100490-fig6-data5-v1.xlsx
-
Figure 6—source data 6
Original data corresponding to panel I.
- https://cdn.elifesciences.org/articles/100490/elife-100490-fig6-data6-v1.xlsx
-
Figure 6—source data 7
Original data corresponding to panel K.
- https://cdn.elifesciences.org/articles/100490/elife-100490-fig6-data7-v1.xlsx
-
Figure 6—source data 8
Original data corresponding to panel L.
- https://cdn.elifesciences.org/articles/100490/elife-100490-fig6-data8-v1.xlsx
-
Figure 6—source data 9
Original data corresponding to panel N.
- https://cdn.elifesciences.org/articles/100490/elife-100490-fig6-data9-v1.xlsx
-
Figure 6—source data 10
Original data corresponding to panel O.
- https://cdn.elifesciences.org/articles/100490/elife-100490-fig6-data10-v1.xlsx
-
Figure 6—source data 11
Original data corresponding to panels P and Q.
- https://cdn.elifesciences.org/articles/100490/elife-100490-fig6-data11-v1.xlsx
-
Figure 6—source data 12
Original data corresponding to panels R and S.
- https://cdn.elifesciences.org/articles/100490/elife-100490-fig6-data12-v1.xlsx
Figure 6—figure supplement 1
Cells lacking the capability for activating pro-invasive mechanotransduction pathway via TRPV4 inhibition-induced cell volume reduction do not relocate TRPV4 to the plasma membrane under TRPV4 inhibition and mechanical stresses.
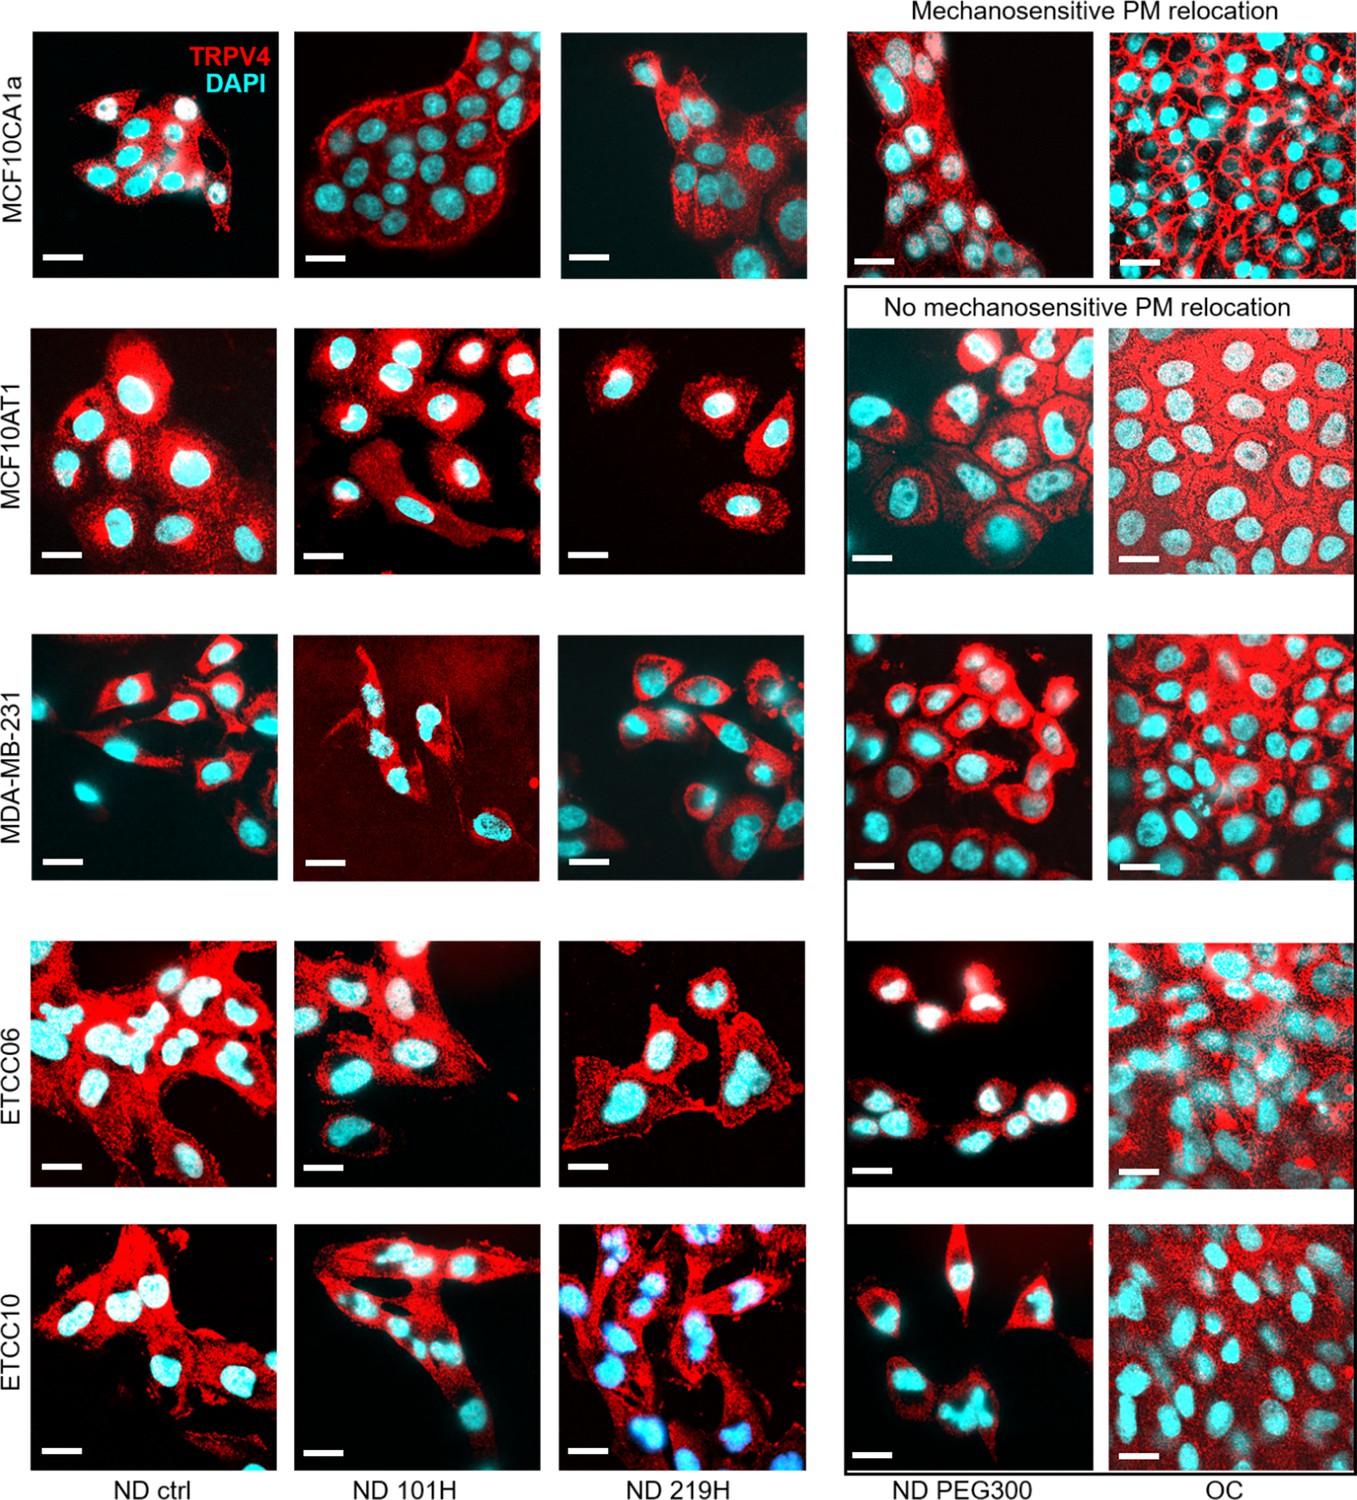
The effects of treatment with GSK101 (0.2 pM, 1 hr), GSK219 (1 nM, 1 hr), and PEG 300 (74.4 mOsm/kg, 15-miniutes) on cells under normal density (ND) or overconfluence (OC) conditions revealed differences in TRPV4 localization (red) in the immunofluorescence (IF) images (cyan: DAPI). Only MCF10CA1a cells show GSK219, PEG 300, and OC-induced TRPV4 relocation to the plasma membrane. Other cell types, including MCF10AT1, MDA-MB-231, ETCC-06, and ETCC-10, did not exhibit this translocation. Scale bar = 20 μm.
Figure 7
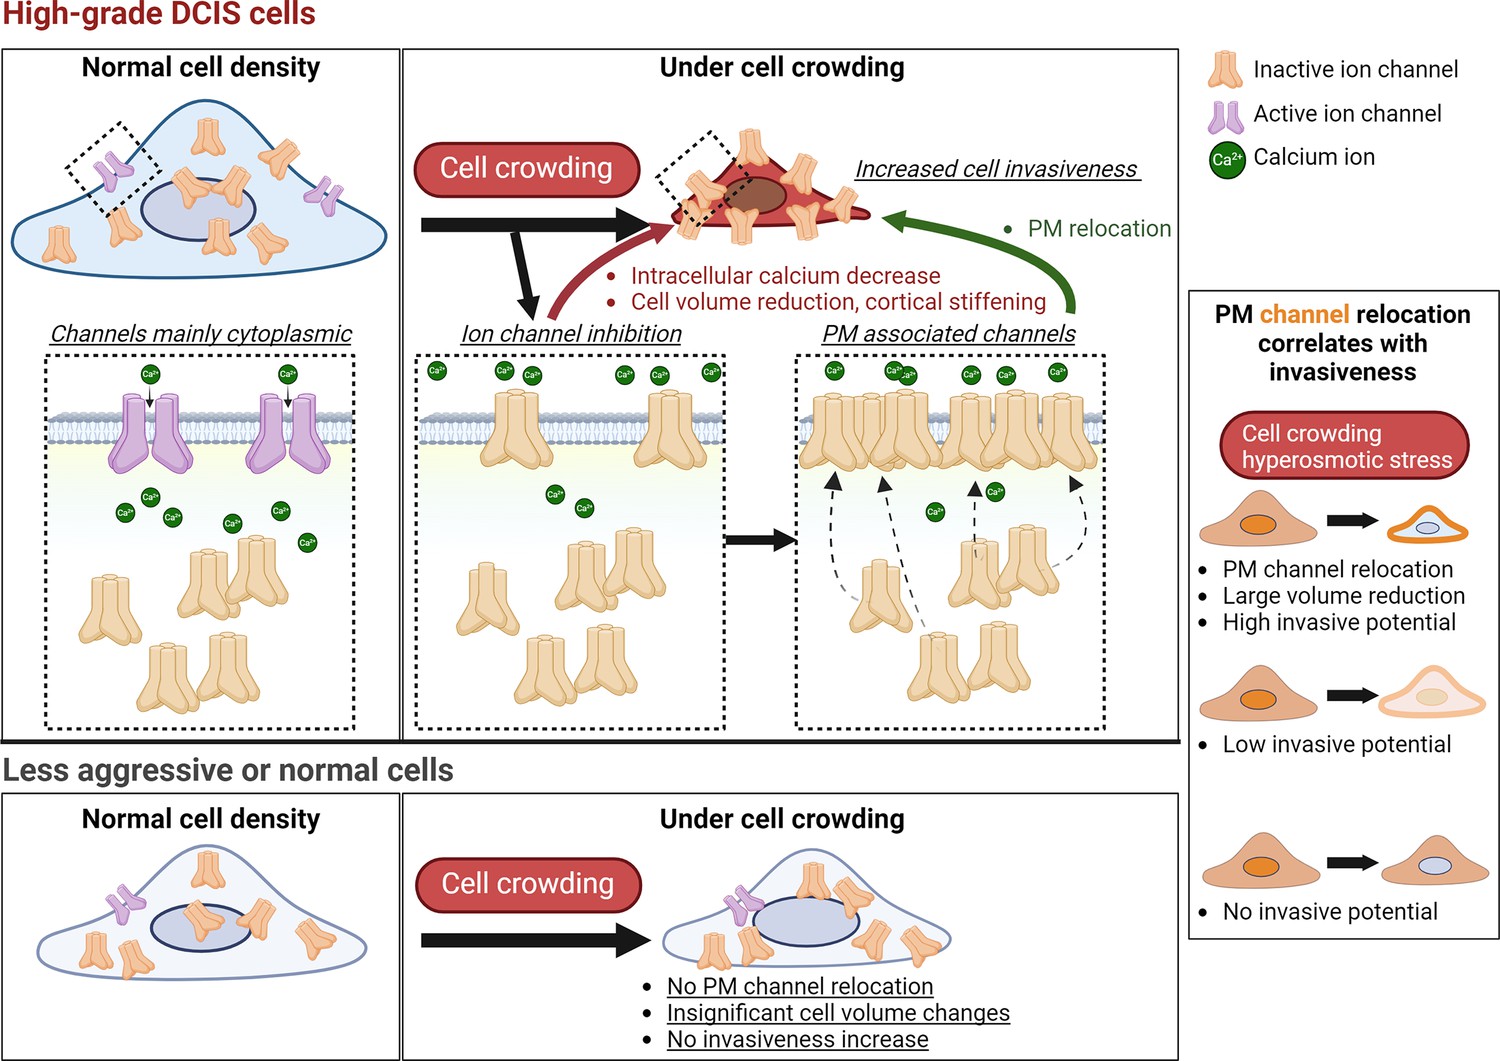
Cell crowding activates a pro-invasive mechanotransduction pathway in high-grade ductal carcinoma in situ (DCIS) cells but not in less aggressive or normal cells.
This cell-crowding-induced pro-invasive pathway involves a cascade of events, including ion channel inhibition, intracellular calcium reduction, cell volume reduction and cortical stiffening, and increased cell invasiveness and motility. In high-grade DCIS cells, calcium-permeable ion channels such as TRPV4 relocate to the plasma membrane upon inhibition, compensating for reduced intracellular calcium levels by priming the channels for later activation under mechanical stress. The pro-invasive mechanotransduction pathway is selectively triggered by cell crowding or hyperosmotic stress in high-grade DCIS cells, which exhibit significant TRPV4 plasma membrane relocation, pronounced cell volume reduction, and increased motility and invasiveness. In contrast, less aggressive or normal cells remain significantly less or non-responsive to these stimuli. Notably, MCF10DCIS.com cells exhibit greater cell volume reduction compared to other cells, likely due to their larger baseline cell volume at normal density, demonstrating their high cell volume plasticity that correlates with crowding-induced invasiveness. The extent of TRPV4 plasma membrane relocation, cell volume reduction, and increased invasiveness and motility scales with each other, where the increased TRPV4 association with the plasma membrane can robustly serve as a marker of pro-invasive mechanotransduction activation. This mechanotransduction capability sets high-grade DCIS cells apart from less aggressive cells, providing a critical criterion that may help identify high-risk cells with invasive potential. This mechanotransduction capability was also validated in patient specimens, suggesting its relevance in clinical settings. Future investigations will include utilizing TRPV4 localization patterns as a diagnostic tool to assist in pathological grading and as a prognostic marker to identify high-risk DCIS cells likely to activate this pathway under mechanical stress.
Tables
Key resources table
| Reagent type (species) or resource | Designation | Source or reference | Identifiers | Additional information |
|---|---|---|---|---|
| Cell line (Homo sapiens) | MCF10A | ATCC | RRID:CVCL_0598 | Non-tumorigenic human breast epithelial cell line |
| Cell line (Homo sapiens) | MCF10AT1 | Karmanos Cancer Institute | RRID:CVCL_5554 | Premalignant variant of MCF10A with oncogenic H-Ras expression |
| Cell line (Homo sapiens) | MCF10DCIS.com | Karmanos Cancer Institute | RRID:CVCL_5552 | DCIS progression model with features of comedo necrosis, derived from MCF10AT1 |
| Cell line (Homo sapiens) | MCF10CA1a | Karmanos Cancer Institute | RRID:CVCL_6675 | Invasive carcinoma derivative of MCF10DCIS.com |
| Cell line (Homo sapiens) | ETCC-010 | Leibniz Institute DSMZ | RRID:CVCL_6G22 | Patient-derived, hTERT-immortalized DCIS cell line |
| Cell line (Homo sapiens) | ETCC-006 | Leibniz Institute DSMZ | RRID:CVCL_6G19 | Patient-derived, hTERT-immortalized DCIS cell line |
| Cell line (Homo sapiens) | MDA-MD-231 | ATCC | RRID:CVCL_0062 | Highly aggressive, triple-negative breast cancer cell line |
| Transfected construct (Homo sapiens) | hTRPV4 shRNA Plasmid; shRNA | Santa Cruz | sc-61726-SH | Plasmid construct to transfect and express the shRNA |
| Transfected construct (Homo sapiens) | pCSII-EF-miRFP670v1-hGem(1/110) | Vladislav Verkhusha, Addgene | 80006 | Lentiviral construct to transfect and express the gene |
| Antibody | anti-TRPV4 (Rabbit polyclonal) | Abcam | ab39260 | 1:500 (IF), 1:100 (IHC) |
| Antibody | anti-transferrin receptor (Mouse monoclonal) | Thermo Fisher | 13–6800 | 1:500 |
| Antibody | anti-Piezo1 (extracellular) (Rabbit polyclonal) | Alomone | APC-087 | 1:500 |
| Antibody | anti-KCNN4 (KCa3.1, SK4) (extracellular) (Mouse monoclonal) | Alomone | ALM-051 | 1:500 |
| Antibody | anti-Rabbit IgG (H+L) Highly Cross-Absrobed Secodary Antibody, Alexa Fluor Plus 555 (Goat polyclonal); anti-rabbit-Alexa 550 | Thermo Fisher | A32732 | 1:5,000 |
| Antibody | anti-Mouse IgG (H+L) Highly Cross-Absrobed Secodary Antibody, Alexa Fluor 488 (Goat polyclonal); anti-mouse-Alexa 488 | Thermo Fisher | A11029 | 1:5,000 |
| Antibody | anti-TRPV4 (Rabbit polyclonal) | Thermo Fisher | PA5-41066 | 1:1,000 |
| Antibody | anti-GAPDH (6C5) (Mouse monoclonal) | Santa Cruz | sc-32233 | 1:2,000 |
| Antibody | anti-Mouse IgG (H+L) Superclonal Secondary Antibody, HRP (Goat superclonal) | Thermo Fisher | A28177 | 1:4,000 |
| Antibody | anti-Rabbit IgG (H+L) Superclonal Secondary Antibody, HRP (Goat superclonal) | Thermo Fisher | A27036 | 1:4,000 |
| Antibody | Anti-TRPV4 (extracellular) (Rabbit polyclonal) | Alomone | ACC-124 | 1:300 |
| Peptide, recombinant protein | Streptavidin UltraLink Resin; resin | Thermo Fisher | 53114 | High-capacity streptavidin resin for affinity purification of biotinylated proteins |
| Commercial assay or kit | Lenti-X Packaging Single Shots (Ecotropic) | Takara Bio | 631278 | Lentiviral packaging system for efficient viral particle production in ecotropic host cells |
| Commercial assay or kit | BCA Protein Assay Kits; bicinchoninic acid assay | Pierce | 23225 | Quantitative protein assay based on colorimetric detection of peptide bonds |
| Commercial assay or kit | Fluo-4 Direct Calcium Assay Kit | Thermo Fisher | F10471 | Fluorescent assay for real-time calcium flux measurement in live cells |
| Chemical compound, drug | GSK 1016790 A; GSK101 | Tocris | 64T33 | TRPV4 agonist |
| Chemical compound, drug | GSK 2193874; GSK219 | Tocris | 5106 | TRPV4 antagonist |
| Chemical compound, drug | Polyethylene glycol 300; PEG 300 | Millipore Sigma | 8074845000 | Osmotic reagent used to induce hyperosmotic stress |
| Chemical compound, drug | Polybrene Infection/Transfection Reagent; polybrene | Sigma-Aldrich | TR-1003–50 UL | 8 μg/mL |
| Chemical compound, drug | Puromycin Dihydrochloride, puromycin | Thermo Fisher | A1113803 | 1 μg/mL |
| Chemical compound, drug | Poly-L-Lysine | Fisher Scientific | A005C | 50 μg/mL |
| Chemical compound, drug | Glutaraldehyde | VWR | 100503–974 | 0.5% |
| Chemical compound, drug | fluorescein-gelatin | Thermo Fisher | G13187 | 1 mg/mL |
| Chemical compound, drug | Gelatin | Sigma-Aldrich | G2500 | 4 mg/mL |
| Chemical compound, drug | EZ-Link(TM) Sulfo-NHS-Biotin | Thermo Fisher | A39256 | 2 mM |
| Other | DAPI and Hoechst Nucleic Acid Stains; DAPI | Thermo Fisher | D3571 | 300 nM, Immunofluorescence, Line analysis, Cell invasion assay, |
| Other | DiI Stain (1,1’-Dioctadecyl-3,3,3',3'-Tetramethylindocarbocyanine Perchlorate (‘DiI’;DiIC18(3))) | Thermo Fisher | D282 | 5 μM, Materials and Methods – Immunofluorescence, Line analysis |
| Other | 8-well chambered slides | Nunc Lab-Tek | 155409PK | Materials and Methods – Live cell detection, Cell invasion assay, Calcium reporter assay, Cell viability assay |
| Other | Q Exactive HF mass spectrometer | Thermo Fisher | Materials and Methods – Mass spectrometry | |
| Other | MatTek 35 mm dishes with No. 1.5 coverslip, 14 mm glass diameter, and Poly-D-Lysine coated glass bottoms | MatTek | P35GC-1.5–14 C | Materials and methods – Cell motility Assay |
| Other | WGA-488 | Thermo Fisher | W11261 | 10 μg/mL (motility assay), 1 μg/mL (viability assay), Materials and methods – Cell motility assay; Cell viability assay |
| Other | Propidium Iodide Ready Flow Reagent; propidium iodide; PI | Thermo Fisher | R37169 | Materials and methods – Cell viability assay |
Additional files
Download links
A two-part list of links to download the article, or parts of the article, in various formats.
Downloads (link to download the article as PDF)
Open citations (links to open the citations from this article in various online reference manager services)
Cite this article (links to download the citations from this article in formats compatible with various reference manager tools)
Cell crowding activates pro-invasive mechanotransduction pathway in high-grade DCIS via TRPV4 inhibition and cell volume reduction
eLife 13:RP100490.
https://doi.org/10.7554/eLife.100490.4


