Pharmacologic activation of integrated stress response kinases inhibits pathologic mitochondrial fragmentation
- Department of Molecular and Cellular Biology, The Scripps Research Institute, United States
- Department of Integrative Structural and Computation Biology, The Scripps Research Institute, United States
- Department of Biochemistry and Molecular Biology, Cummings School of Medicine, University of Calgary, Canada
- Hotchkiss Brain Institute, Department of Clinical Neurosciences, Cumming School of Medicine, University of Calgary, Canada
- Alberta Child Health Research Institute, Department of Medical Genetics, Cumming School of Medicine, University of Calgary, Canada
- Department of Chemistry, The Scripps Research Institute, United States
- Departments of Medical Genetics and Biochemistry & Molecular Biology, Cumming School of Medicine, Hotchkiss Brain Institute, Snyder Institute for Chronic Diseases, Alberta Children's Hospital Research Institute, University of Calgary, Canada
Figures
Figure 1 with 1 supplement

Identification of nucleoside mimetics that preferentially activate the integrated stress response (ISR) kinase HRI.
(A) Screening pipeline used to identify selective ISR kinase-activating compounds that promote protective mitochondrial elongation. (B) Structures of the top 9 ISR-activating compounds identified in our nucleoside mimetic screen. (C, D) ATF4-FLuc activity in HEK293 cells stably expressing ATF4-FLuc (Yang et al., 2023a) treated for 8 hr with the indicated concentration of 0357 (C) or 3610 (D) in the absence or presence of ISRIB (200 nM). (E, F) Activation of the ATF4-FLuc ISR translational reporter (green), the XBP1-RLuc UPR reporter (red), the HSE-FLuc HSR reporter (blue), or the ARE-FLuc OSR reporter (purple) stably expressed in HEK293 cells treated with the indicated concentration of 0357 (E) or 3610 (F) for 16 hr. (G, H) ATF4-mAPPLE fluorescence in HEK293 cells stably expressing ATF4-mAPPLE and CRISPRi depleted of the indicated ISR kinase (Guo et al., 2020) treated for 8 hr with 0357 (G, 20 µM) or 3610 (H, 20 µM). **p<0.01, ***p<0.005 for one-way ANOVA.
-
Figure 1—source data 1
Excel spreadsheet containing source data for panels C-H.
- https://cdn.elifesciences.org/articles/100541/elife-100541-fig1-data1-v1.xlsx
Figure 1—figure supplement 1
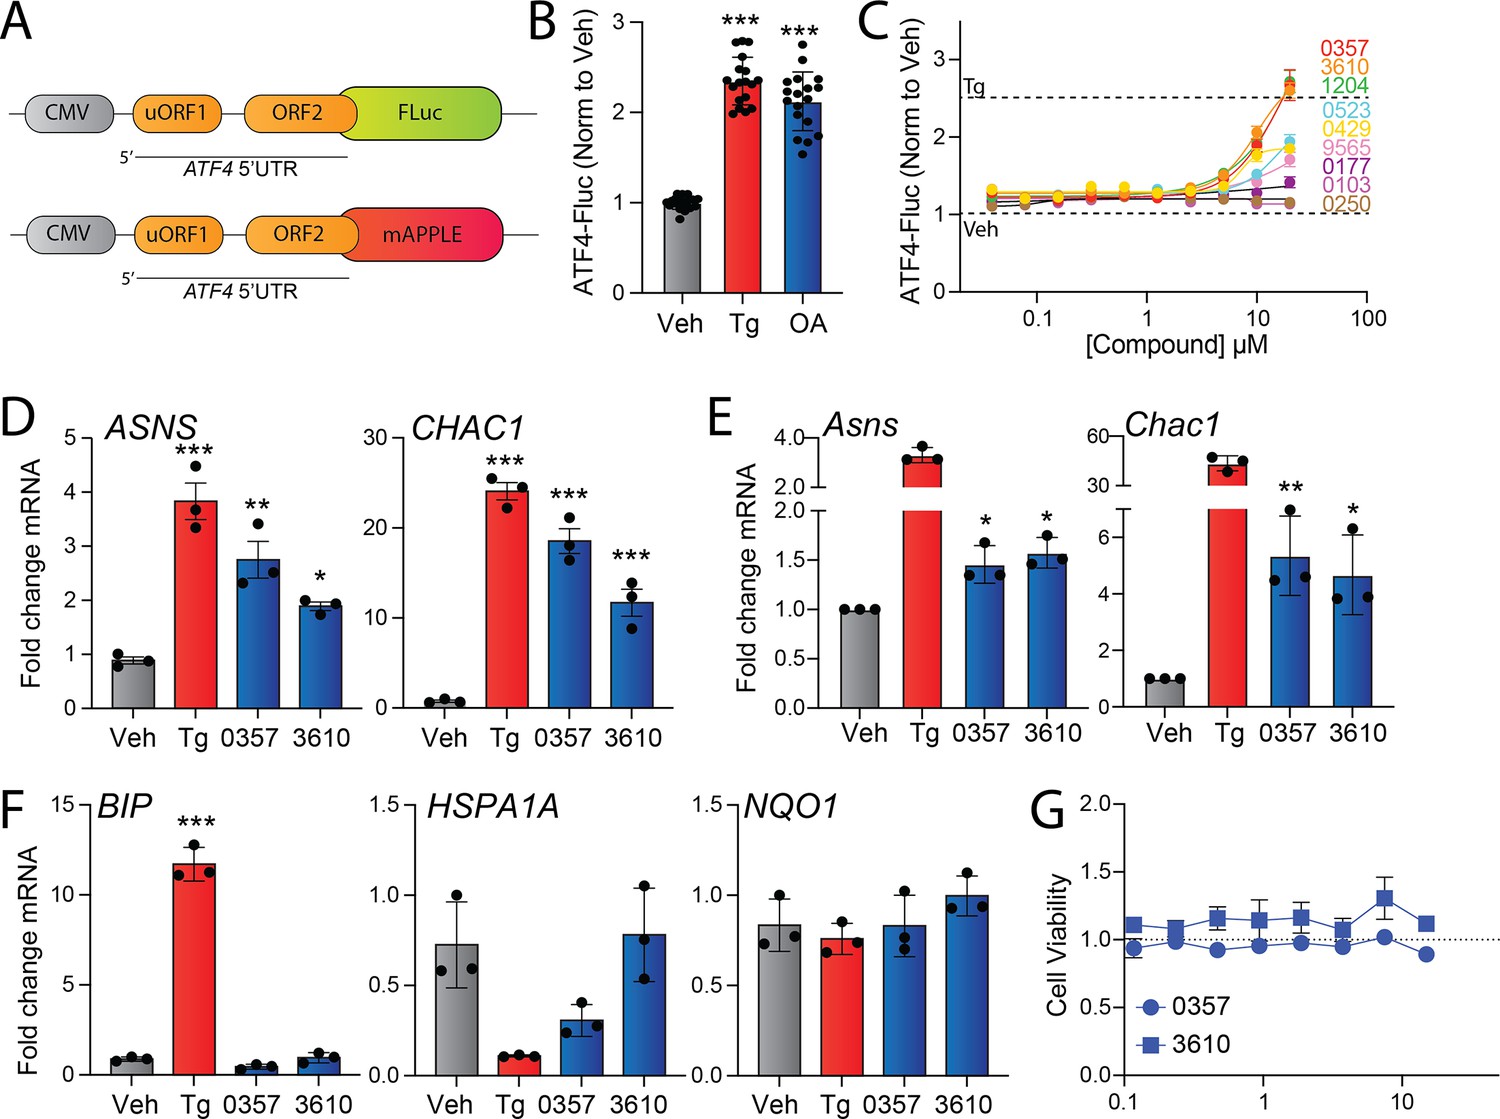
Identification of nucleoside mimetics that preferentially activate the integrated stress response (ISR) kinase HRI.
(A) The ATF4-FLuc and ATF4-mAPPLE reporters containing the 5’UTR of ATF4 (Guo et al., 2020; Yang et al., 2023a). (B) ATF4-Fluc activity, measured by luminescence, in HEK293 cells stably expressing ATF4-FLuc treated for 8 hr with vehicle, thapsigargin (Tg, 0.5 µM), or oligomycin A (OA, 50 ng/mL). (C) ATF4-FLuc activity, normalized to vehicle, in HEK293 cells stably expressing ATF4-FLuc treated for 8 hr with the indicated dose of the indicated compound. The signals observed in veh or Tg (0.5 µM) cells are shown by the dashed lines. Error bars show SEM for n = 9 replicates. (D) Expression, measured by qPCR, of the ISR target genes ASNS and CHAC1 in HEK293 cells treated for 8 hr with vehicle, Tg (0.5 µM), 0357 (25 µM), or 3610 (25 µM). (E) Expression, measured by qPCR, of the ISR target genes Asns and Chac1 in MEF cells treated for 8 hr with vehicle, Tg (0.5 µM), 0357 (20 µM), or 3610 (20 µM). (F) Expression, measured by qPCR, of the UPR target gene BiP, the HSR target gene HSPA1A, and the OSR target gene NQO1 in HEK293 cells treated for 8 hr with vehicle, Tg (0.5 µM), 0357 (25 µM), or 3610 (25 µM). (G) Viability, measured by Cell Titer Glo, of HEK293 cells treated for 24 hr with the indicated concentration of 0357 or 3610. Error bars show SEM for n = 3 replicates. *p<0.05, **p<0.01, ***p<0.005 for one-way ANOVA.
-
Figure 1—figure supplement 1—source data 1
Excel spreadsheet containing source data for panels C-F.
- https://cdn.elifesciences.org/articles/100541/elife-100541-fig1-figsupp1-data1-v1.xlsx
Figure 2 with 1 supplement
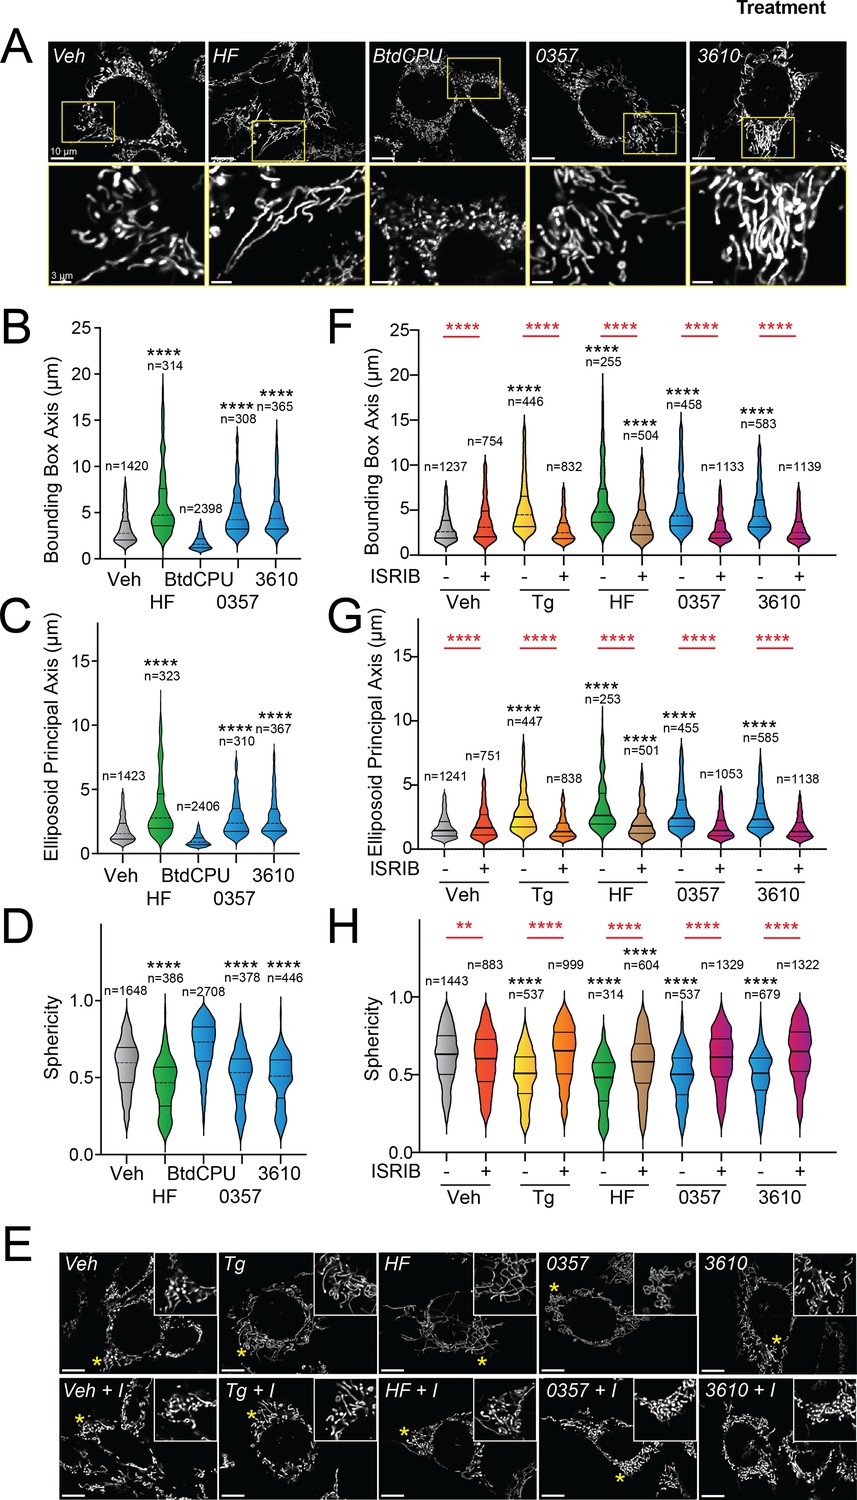
Pharmacologic HRI activation induces integrated stress response (ISR)-dependent mitochondrial elongation.
(A) Representative images of MEF cells stably expressing mtGFP (MEFmtGFP) (Wang et al., 2012) treated for 6 hr with vehicle (veh), halofuginone (HF, 100 nM), BtdCPU (10 µM), 0357 (10 µM), or 3610 (10 µM). The inset shows a 3-fold magnification of the region indicated by the yellow box. Scale bars, 10 µm (top) and 3.33 µm (bottom). (B–D) Quantification of bounding box axis, ellipsoid principal axis, and sphericity from the entire dataset of representative images shown in (A). The number of individual measurements for each condition is shown above. (E) Representative images of MEFmtGFP cells treated for 6 hr with vehicle (veh), thapsigargin (Tg; 0.5 µM) halofuginone (HF, 100 nM), 0357 (10 µM), or 3610 (10 µM) in the presence or absence of ISRIB (200 nM). The inset shows 3-fold magnification of the image centered on the asterisks. Scale bars, 10 µm. (F–H) Quantification of bounding box axis, ellipsoid principal axis, and sphericity from the entire dataset of representative images shown in (E). The number of 3D segmentations used for the individual measurements for each condition is shown above. *p<0.05, ****p<0.001 for Kruskal–Wallis ANOVA. Black asterisks indicate comparison to vehicle-treated cells. Red asterisks show comparisons for ISRIB co-treatment.
-
Figure 2—source data 1
Excel spreadsheet containing source data for panels B-D and F-H.
- https://cdn.elifesciences.org/articles/100541/elife-100541-fig2-data1-v1.xlsx
Figure 2—figure supplement 1
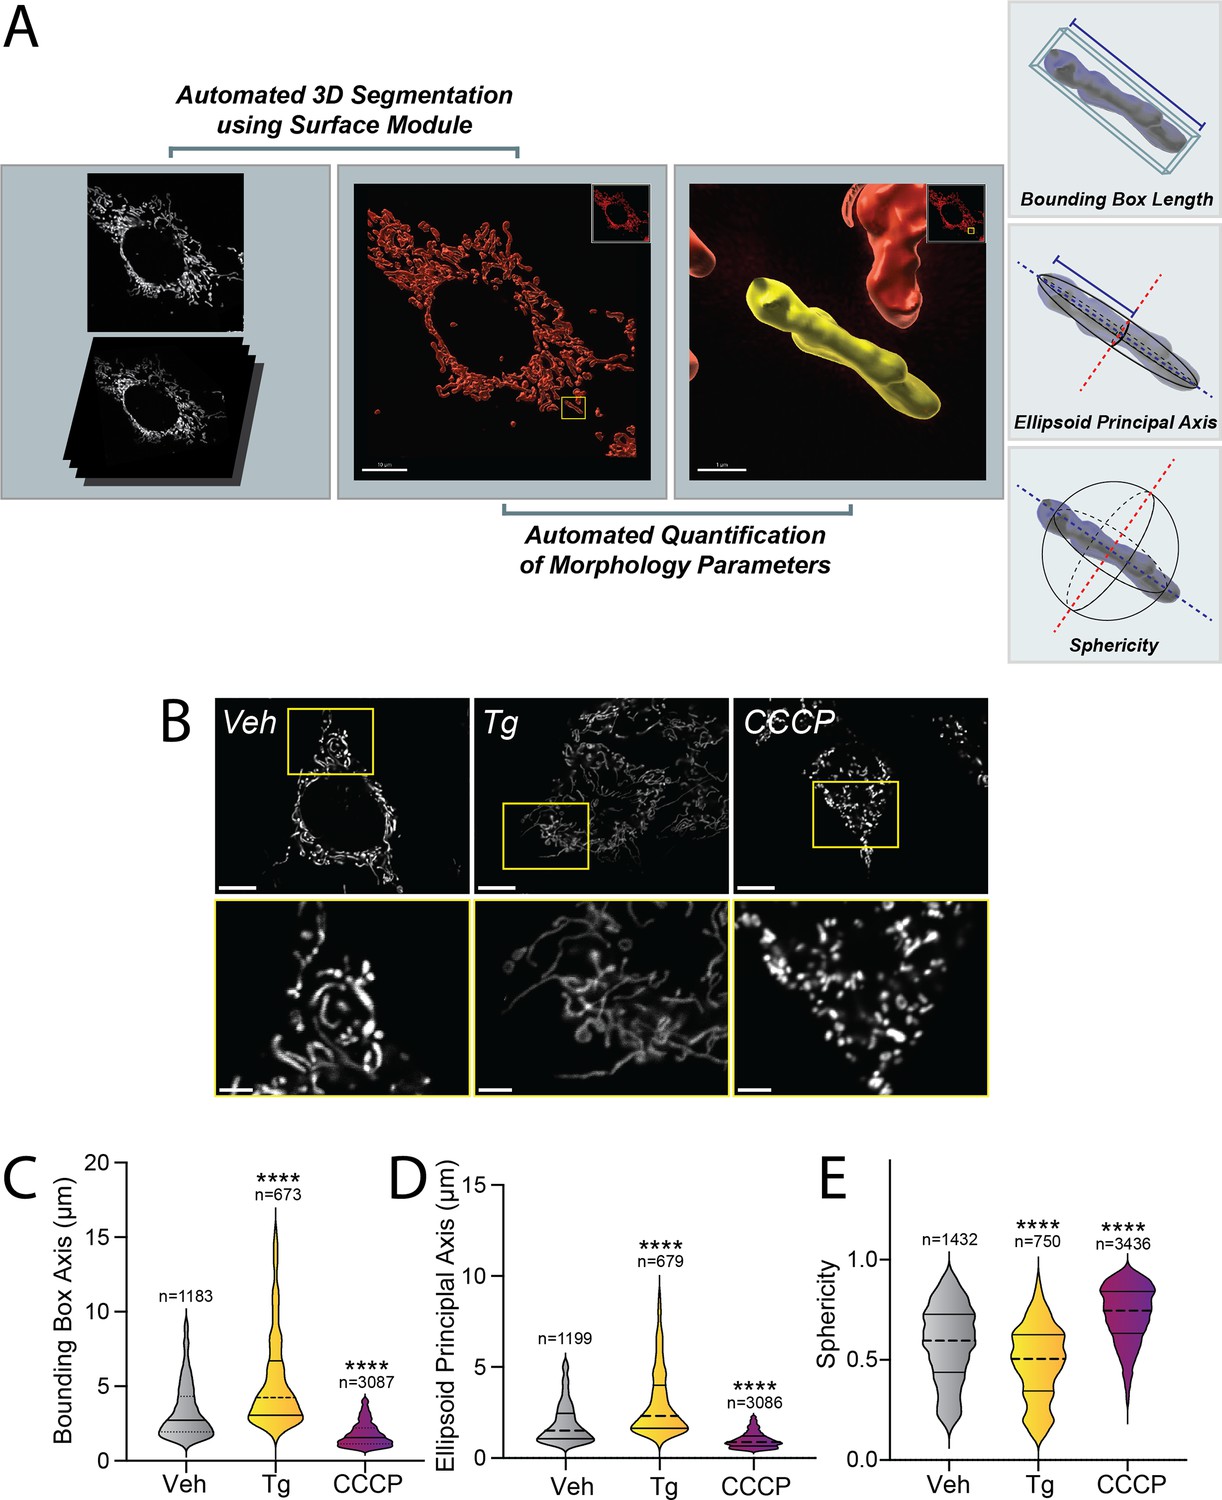
Pharmacologic HRI activation induces integrated stress response (ISR)-dependent mitochondrial elongation.
(A) Image processing and analysis workflow to quantify several parameters that define mitochondrial shape. (B) Representative images of MEFmtGFP cells treated for 6 hr with vehicle (veh), thapsigargin (Tg, 500 nM), or CCCP (10 µM). The inset shows a 3-fold magnification of the region indicated by the yellow box. Scale bars, 10 µm (top) and 3.33 µm (bottom) (C–E) Quantification of bounding box axis, ellipsoid principal axis, and sphericity from the entire dataset of representative images shown in (B). The number of 3D segmentations used for the individual measurements for each condition is shown above. ****p<0.001 for Kruskal–Wallis ANOVA. Black asterisks show comparison with vehicle-treated cells.
-
Figure 2—figure supplement 1—source data 1
Excel spreadsheet containing source data for panels C-E.
- https://cdn.elifesciences.org/articles/100541/elife-100541-fig2-figsupp1-data1-v1.xlsx
Figure 3 with 1 supplement
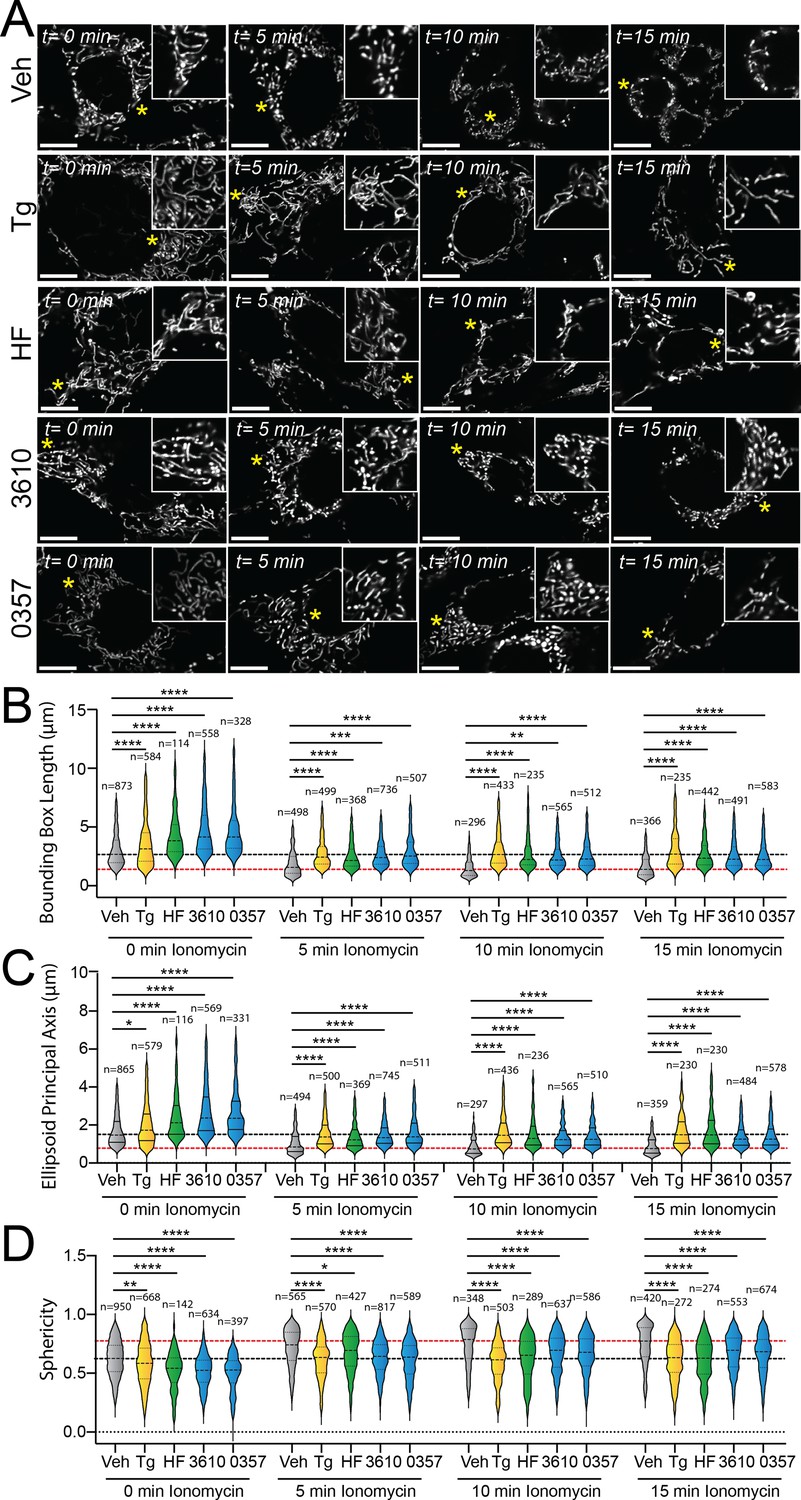
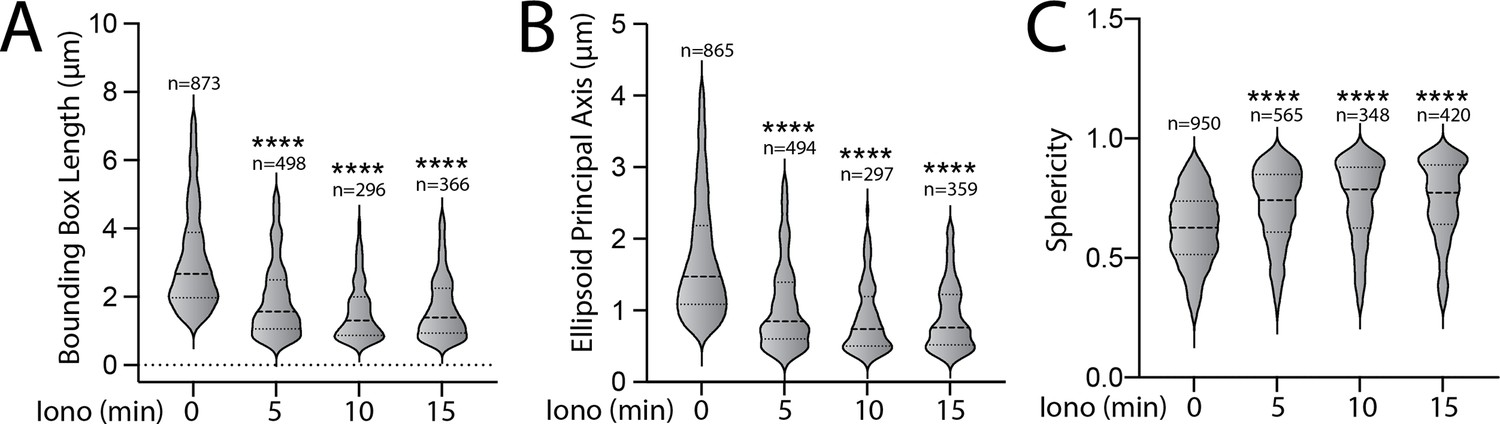
Pharmacologic activation of integrated stress response (ISR) kinases prevents ionomycin-dependent accumulation of fragmented mitochondria.
(A) Representative images of MEFmtGFP cells pretreated for 6 hr with vehicle (veh), thapsigargin (Tg, 500 nM), halofuginone (HF, 100 nM), 0357 (10 µM), or 3610 (10 µM) and then challenged with ionomycin (1 µM) for the indicated time. The inset shows 3-fold magnification of the image centered on the asterisk. Scale bars, 10 µm. (B–D) Quantification of bounding box axis length, ellipsoid principal axis length, and sphericity from the entire dataset of representative images shown in (A). The black dashed line shows the mean value of vehicle-treated cells prior to ionomycin treatment. The dashed red line shows the mean value of vehicle-treated cells following 15 min treatment with ionomycin. The number of 3D segmentations used for the individual measurements for each condition is shown above. *p<0.05, **p<0.01, ***p<0.005, ****p<0.001 for Kruskal–Wallis ANOVA. Black asterisks show comparison with vehicle-treated cells.
-
Figure 3—source data 1
Excel spreadsheet containing source data for panels B-D.
- https://cdn.elifesciences.org/articles/100541/elife-100541-fig3-data1-v1.xlsx
Figure 3—figure supplement 1
Pharmacologic activation of integrated stress response (ISR) kinases prevents ionomycin-dependent accumulation of fragmented mitochondria.
(A–C) Quantifications of bounding box axis, ellipsoid principal axis, and sphericity of MEFmtGFP cells pretreated for 6 hr with vehicle and then challenged with ionomycin (1 µM) for the indicated time. Representative images are shown in Figure 3A. The number of 3D segmentations used for the individual measurements for each condition are shown above. ****p<0.001 for Kruskal–Wallis ANOVA. Black asterisks show comparison with vehicle-treated cells at time 0.
-
Figure 3—figure supplement 1—source data 1
Excel spreadsheet containing source data for panels A-C.
- https://cdn.elifesciences.org/articles/100541/elife-100541-fig3-figsupp1-data1-v1.xlsx
Figure 4 with 1 supplement
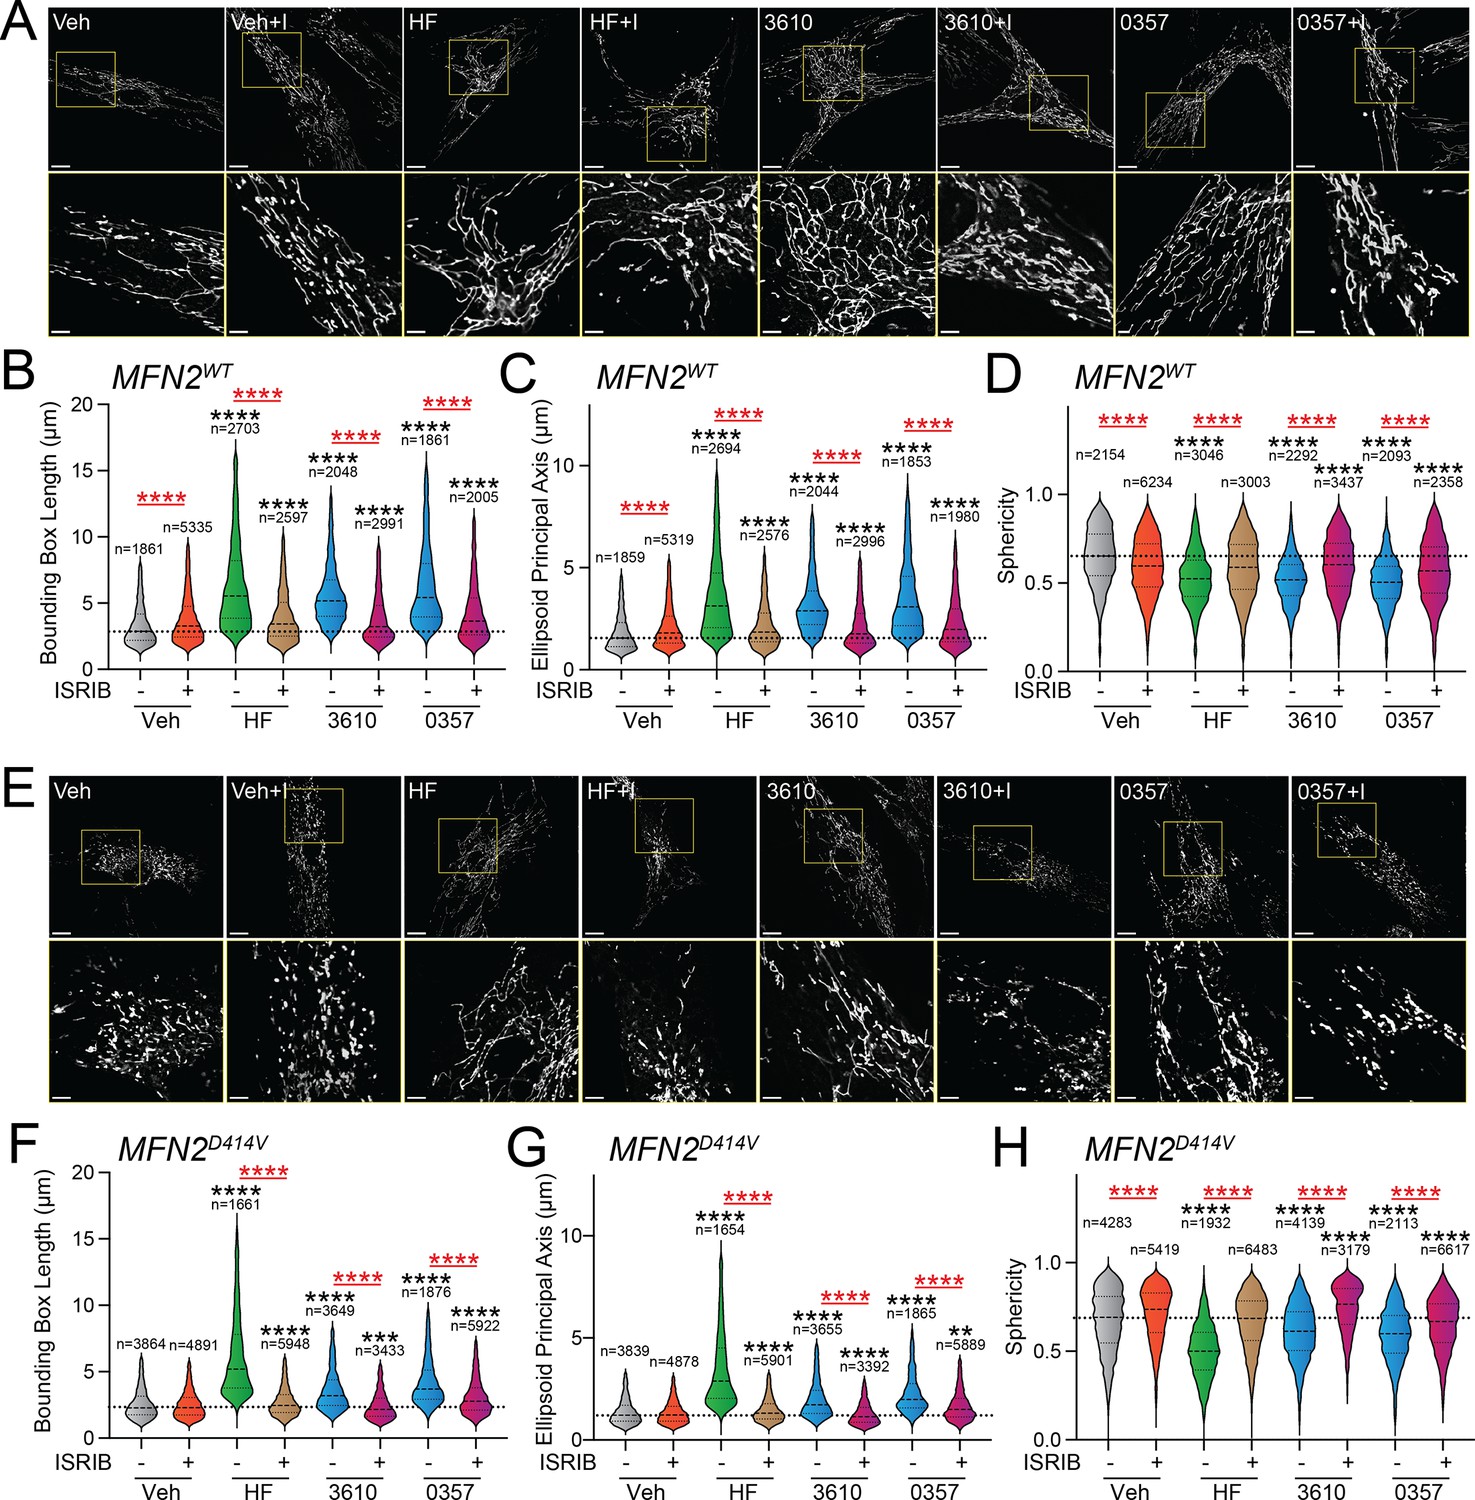
Pharmacologic activation of integrated stress response (ISR) kinases rescues basal mitochondrial morphology in patient fibroblasts expressing the disease-associated D414V MFN2 variant.
(A) Representative images of control human fibroblasts expressing MFN2WT treated for 6 hr with vehicle (veh), halofuginone (HF, 100 nM), 3610 (10 µM), 0357 (10 µM), and/or ISRIB (200 nM). The inset shows 3-fold magnification of the image centered on the asterisks. Scale bars, 15 µm (top) and 5 µM (bottom). (B–D) Quantification of bounding box axis (B), ellipsoid principal axis (C), and sphericity (D) from the entire dataset of images described in panel (A). The number of individual measurements for each condition is shown above. (E) Representative images of patient fibroblasts expressing MFN2D414V treated for 6 hr with veh, HF (100 nM), 3610 (10 µM), 0357 (10 µM), and/or ISRIB (200 nM). The inset shows 3-fold magnification of the image centered on the asterisks. Scale bars, 15 µm (top) and 5 µM (bottom). (F–H) Quantification of bounding box axis (F), ellipsoid principal axis (G), and sphericity (H) from the entire dataset of images described in panel (E). The number of 3D segmentations used for the individual measurements for each condition is shown above. *p<0.05, ***p<0.005, ****p<0.001 for Kruskal–Wallis ANOVA. Black asterisks show comparison with vehicle-treated cells. Red asterisks show comparisons for ISRIB co-treatment.
-
Figure 4—source data 1
Excel spreadsheet containing source data for panels B-D and F-H.
- https://cdn.elifesciences.org/articles/100541/elife-100541-fig4-data1-v1.xlsx
Figure 4—figure supplement 1
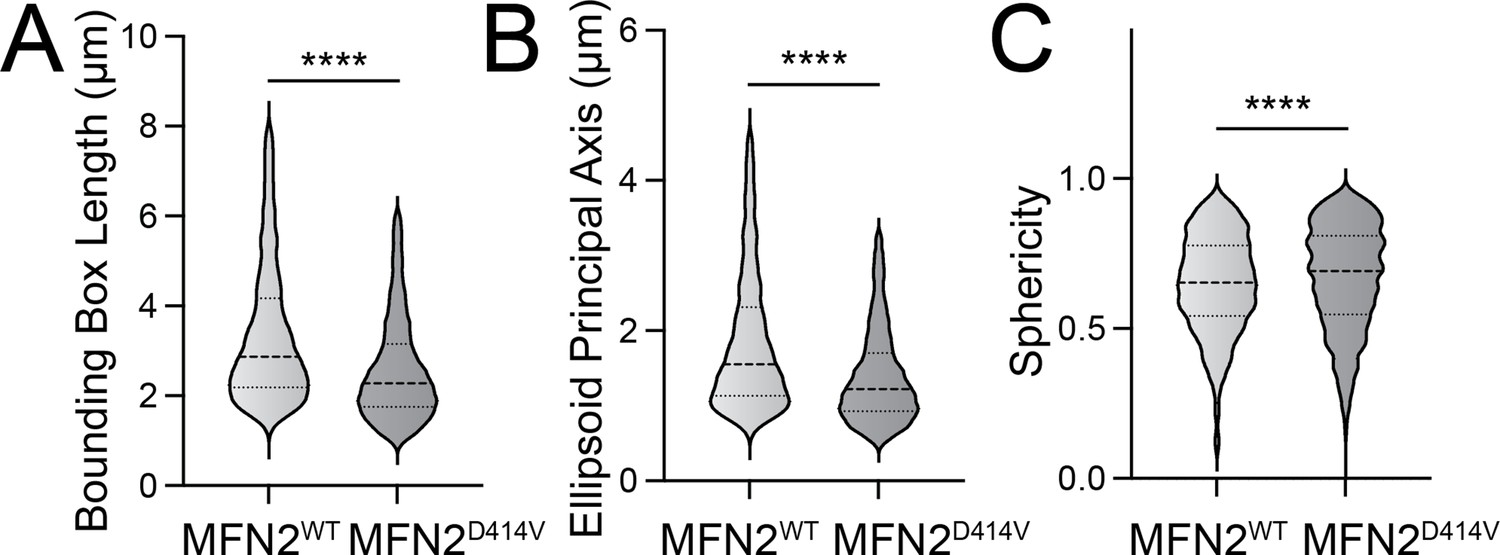
Pharmacologic activation of integrated stress response (ISR) kinases rescue basal mitochondrial morphology in patient fibroblasts expressing the disease-associated D414V MFN2 variant.
(A–C) Bounding box length (A), ellipsoid principal axis length (B), and sphericity (C) in control human fibroblasts expressing MFN2WT or patient fibroblasts expressing MFN2D414V. Representative images are shown in Figure 4A and E. ****p<0.001 for Mann–Whitney t-test.
-
Figure 4—figure supplement 1—source data 1
Excel spreadsheet containing source data for panels A-C.
- https://cdn.elifesciences.org/articles/100541/elife-100541-fig4-figsupp1-data1-v1.xlsx
Tables
Key resources table
| Reagent type (species) or resource | Designation | Source or reference | Identifiers | Additional information |
|---|---|---|---|---|
| Cell line (human) | HEK293 | ATCC | ||
| Cell line (human) | HEK293 cells expressing XBP1-RLuc | Wiseman Lab (TSRI) | Grandjean et al., 2020; Plate et al., 2016 | |
| Cell line (human) | HEK293 cells expressing ATF4-FLuc | Martin Kampmann’s lab (UCSF) | Yang et al., 2023a | |
| Cell line (human) | HEK293 cells expressing ATF4-mAPPLE and CRISPRi-depleted of PERK, GCN2, HRI, or PKR | Martin Kampmann’s lab (UCSF) | Guo et al., 2020 | |
| Cell line (mouse) | MEF cells stably expressing mitochondrial-targeted GFP (MEFmtGFP) | Peter Schultz’s lab (TSRI) | Wang et al., 2012 | |
| Cell line (human) | Primary fibroblasts from patients expressing WT or D414V MFN2 | University of Calgary | Sharma et al., 2021a; Martens et al., 2020 | |
| Commercial assay or kit | Promega Bright-Glo substrate | Promega | ||
| Commercial assay or kit | Quick-RNA MiniPrepKit | Zymo Research | ||
| Commercial assay or kit | High-Capacity Reverse Transcription Kit | Applied Biosystems | ||
| Commercial assay or kit | Power SYBR Green PCR Master Mix | Applied Biosystems | ||
| Chemical compound, drug | Thapsigargin (Tg) | Fisher Scientific | 50-464-294 | |
| Chemical compound, drug | ISRIB | Sigma | SML0843 | |
| Chemical compound, drug | CCCP | Sigma | C2759 | |
| Chemical compound, drug | BtdCPU | Fisher | 32-489-210MG | |
| Chemical compound, drug | Halofuginone (HF) | Sigma | 50-576-3001 | |
| Chemical compound, drug | Oligomycin A | Selleck | S1478 | |
| Chemical compound, drug | MitoTracker Green | Life Technologies | M7514 | |
| Software, algorithm | Imaris 10.0 | Oxford Instruments | 3-D Surface Rendering Module |
Additional files
Download links
A two-part list of links to download the article, or parts of the article, in various formats.
Downloads (link to download the article as PDF)
Open citations (links to open the citations from this article in various online reference manager services)
Cite this article (links to download the citations from this article in formats compatible with various reference manager tools)
Pharmacologic activation of integrated stress response kinases inhibits pathologic mitochondrial fragmentation
eLife 13:RP100541.
https://doi.org/10.7554/eLife.100541.3


