Simultaneous polyclonal antibody sequencing and epitope mapping by cryo electron microscopy and mass spectrometry
- Biomolecular Mass Spectrometry and Proteomics, Bijvoet Center for Biomolecular Research and Utrecht Institute of Pharmaceutical Sciences, Utrecht University, Padualaan, Netherlands
- Science for Life Laboratory, School of Engineering Sciences in Chemistry, Biotechnology and Health, Royal Institute of Technology – KTH, Sweden
Figures
Figure 1
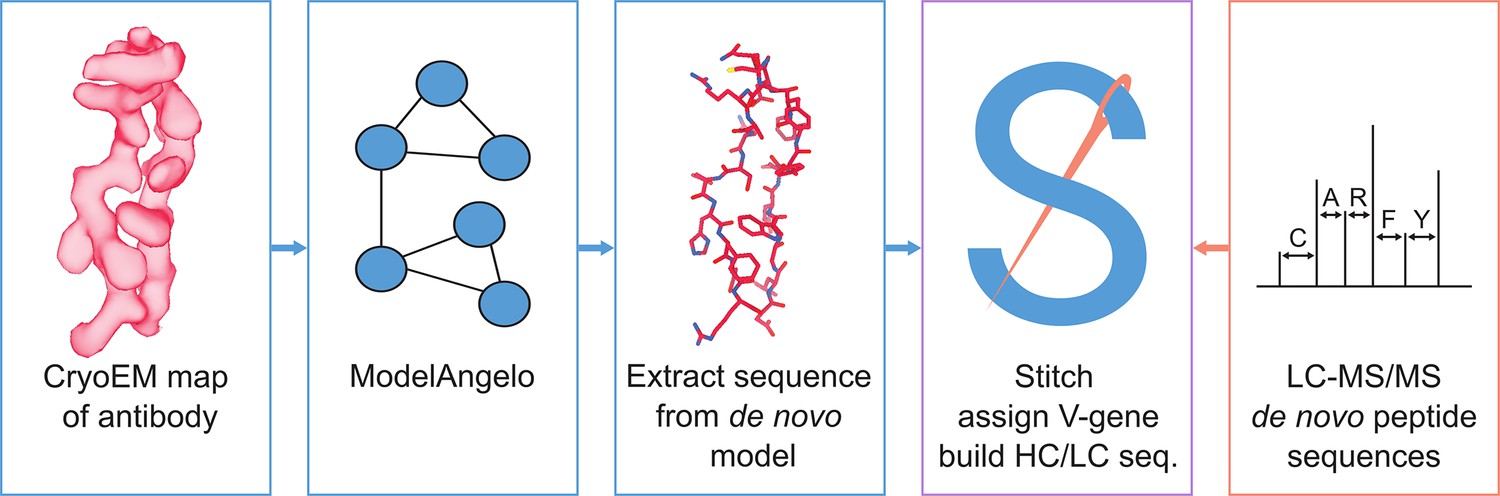
Schematic workflow to estimate de novo antibody sequences by the integration of cryoEM and LC-MS/MS data with Stitch.
Figure 2
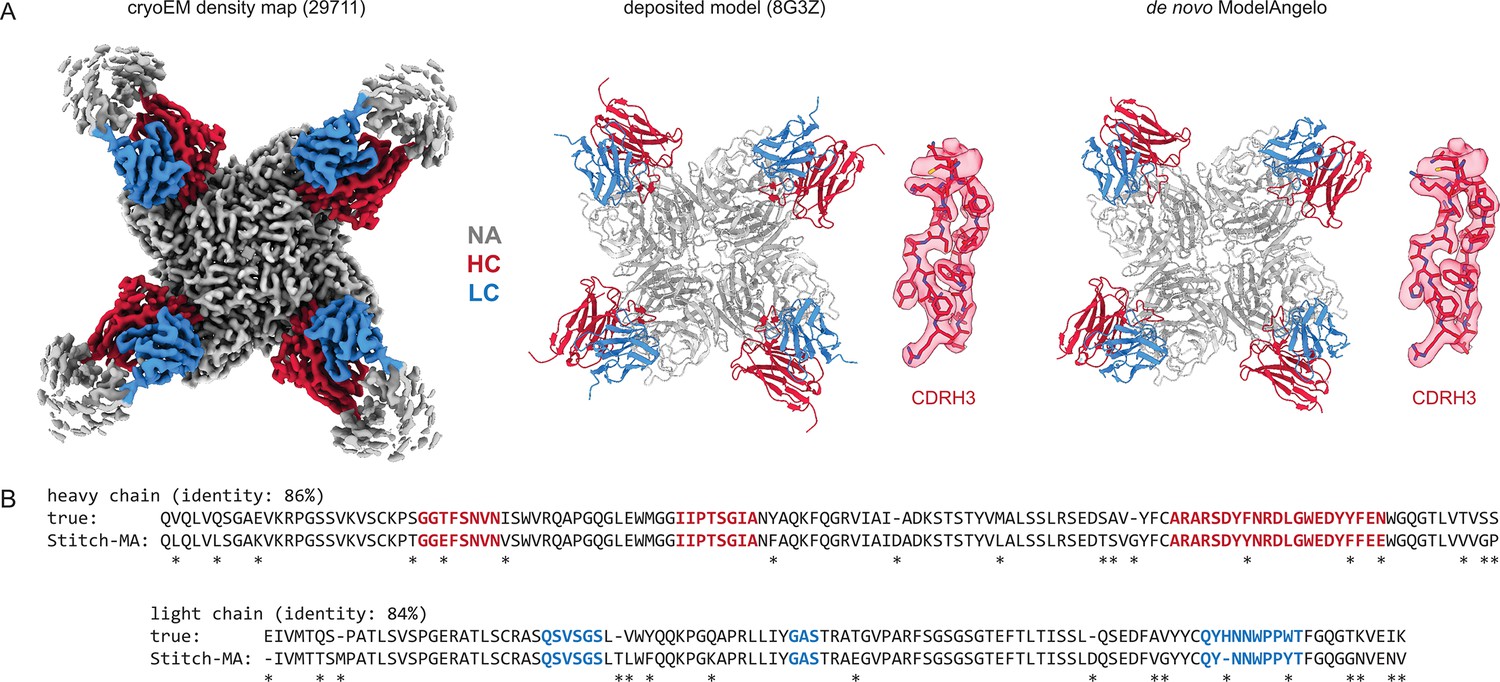
Determining de novo antibody sequences from cryoEM data with ModelAngelo.
(A) Exemplary map (with top10% alignment scores of 1076/1174 for HC/LC) from the benchmark dataset, representing an Influenza B virus neuraminidase (NA) in complex with four copies of a neutralizing Fab, at global FSC resolution of 2.3 Å. Shown are the deposited map, model, and the de novo model generated by ModelAngelo, along with a detailed view of CDRH3. (B) Consensus sequences for heavy and light chains as generated by Stitch compared to the true sequences. Sequencing errors are indicated by an asterisk (*).
Figure 3
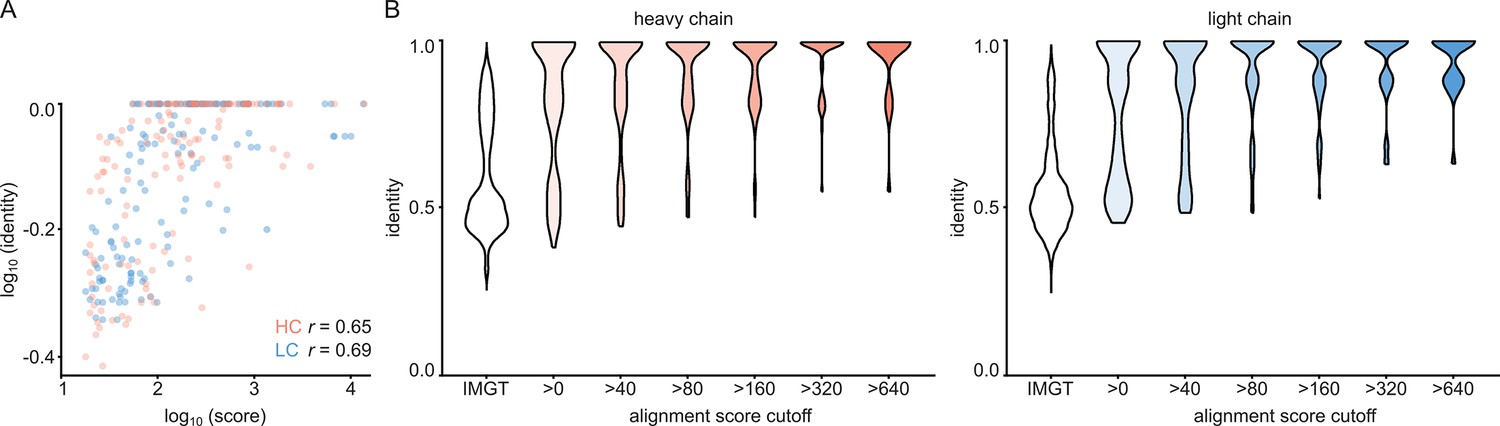
V-gene assignment from ModelAngelo data.
(A) Correlation between Stitch alignment score and sequence identity between the top-scoring V-gene of the ModelAngelo vs PDB sequence of the heavy and light chain variable domains, as indicated with the non-parametric Spearman correlation coefficient. (B) Distribution of V-gene sequence identity for progressive alignment score cutoffs, compared to the pairwise V-gene sequence identity in the IMGT repertoire.
Figure 4
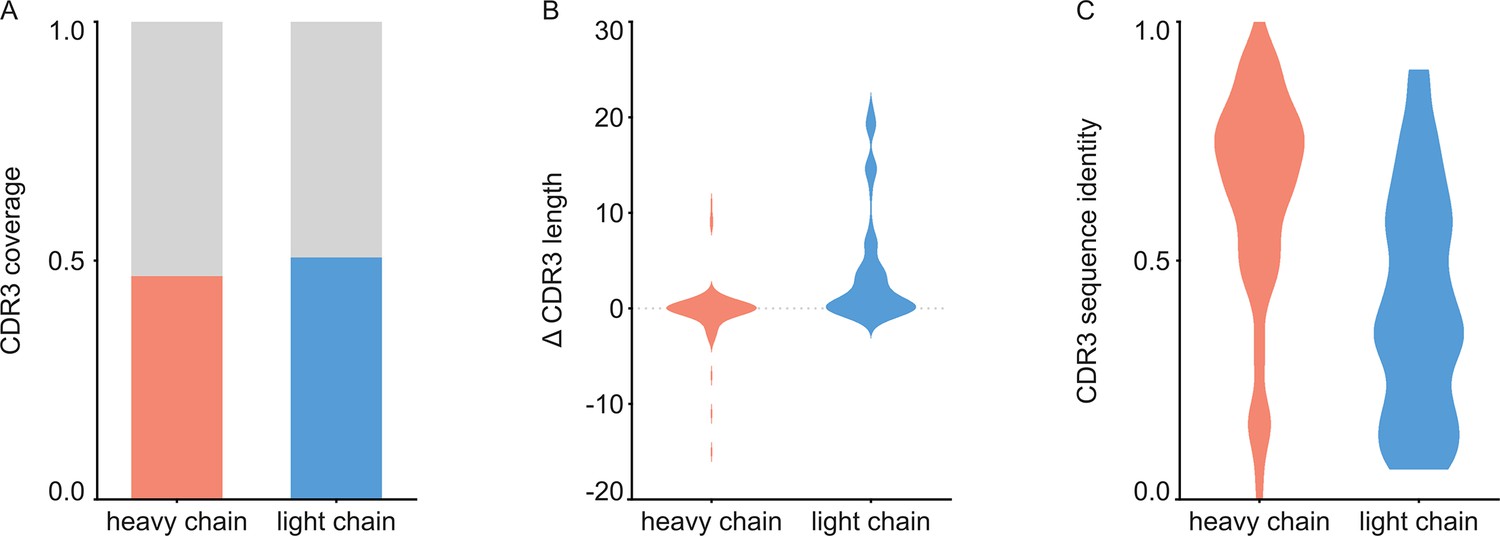
Analysis of de novo CDR3 modeling in ModelAngelo-Stitch.
(A) Coverage of CDR3 for the heavy and light chain. CDR3 was counted for coverage if the de novo sequence spanned the flanking cysteine on the V gene and the tryptophan or phenylalanine on the J gene. Proportion of maps with CDR3 coverage in red/blue, maps with missing CDR3 in grey. (B) Difference in length between de novo modelled CDR3 vs. true sequence. (C) Sequence identity of de novo modelled CDR3 vs. true sequence.
Figure 5
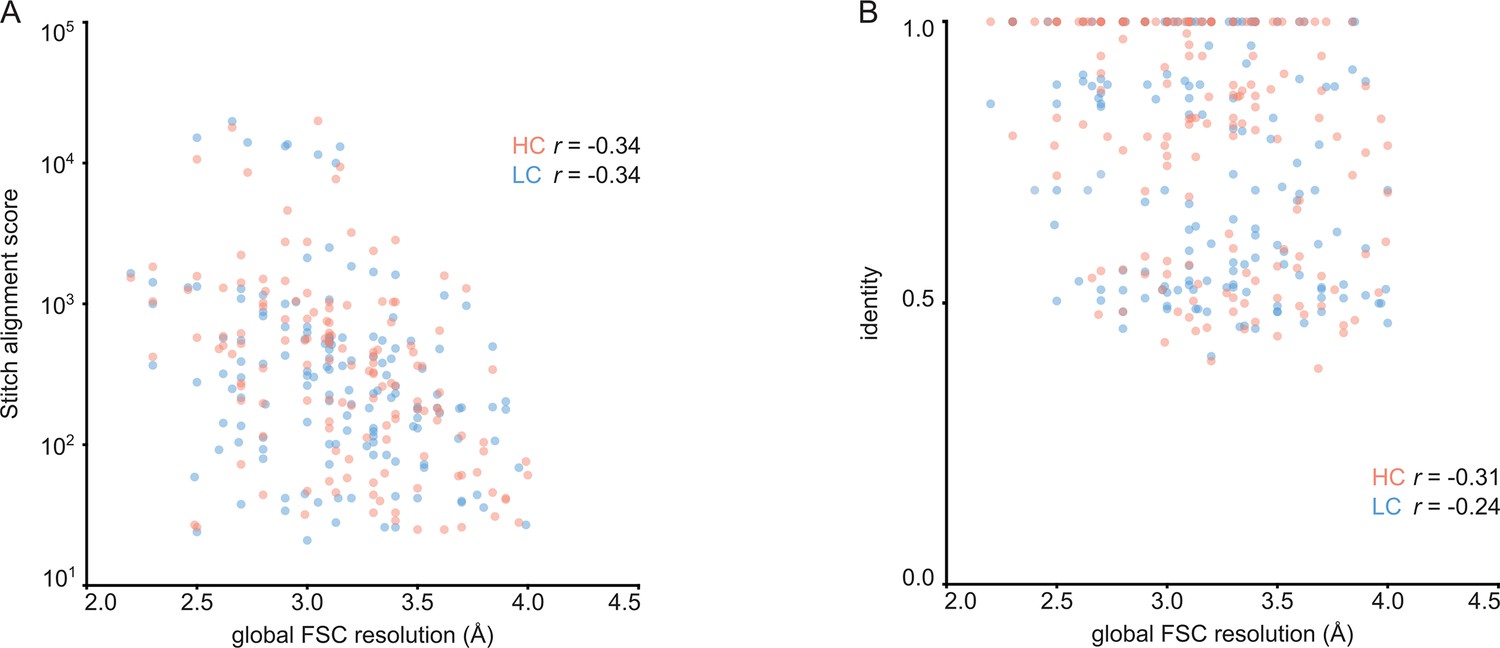
Correlation between global FSC resolution and Stitch alignment score (A) or inferred V-gene identity (B).
The non-parametric Spearman correlation coefficient is indicated for heavy and light chain.
Figure 6
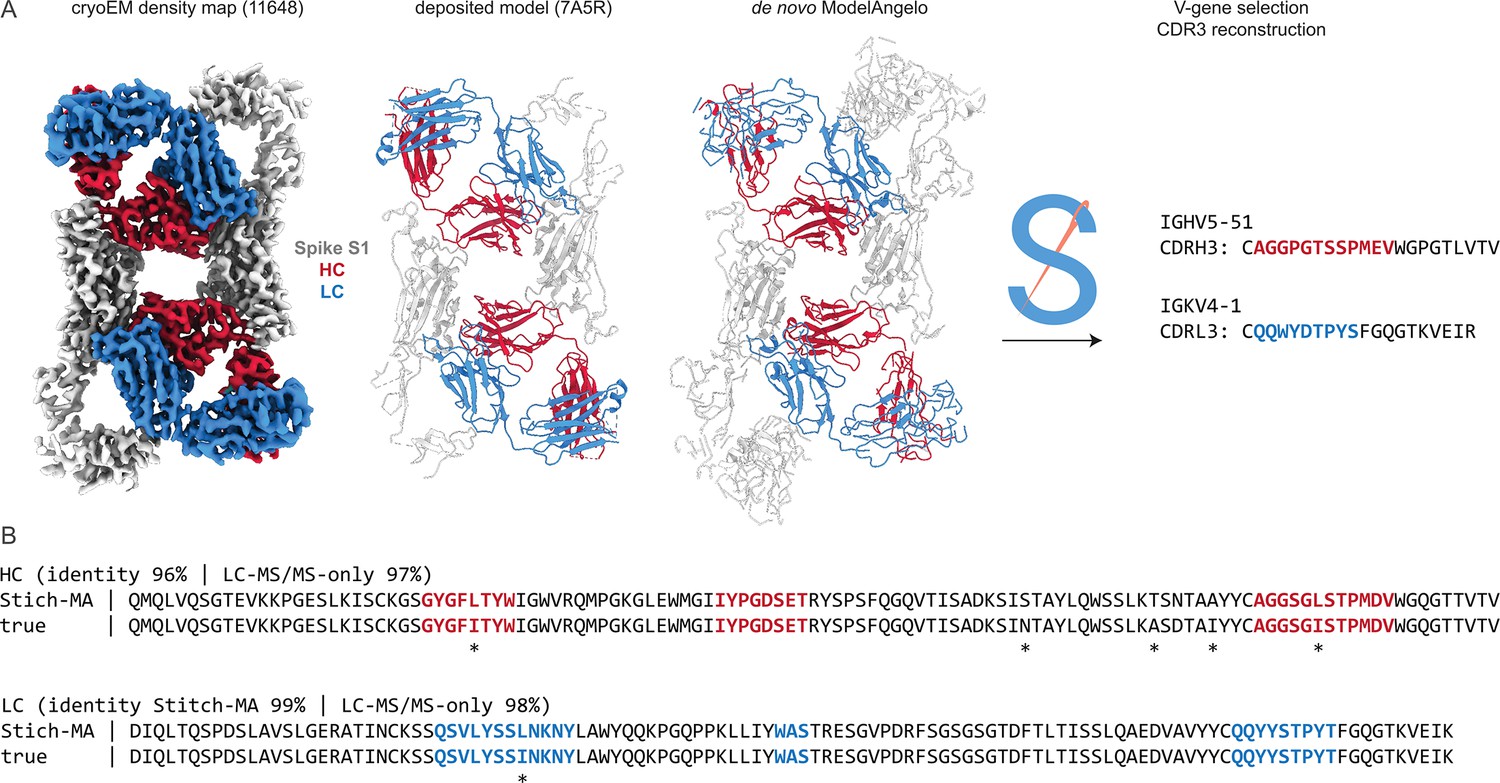
Sequencing CR3022 with integrated cryoEM and LC-MS/MS data.
(A) Shown are the deposited cryoEM map (global FSC resolution 4.1 Å), model, and de novo ModelAngelo output for the CR3022 Fab in complex with the SARS-CoV-2 Spike S1 subunit. The sequences were extracted from the de novo model and used as input for Stitch, resulting in the identification of the indicated V-genes and CDR3 sequences. These variable domains were used as templates in Stitch to assemble the LC-MS/MS derived de novo peptides. (B) Consensus sequences for CR3022 from the integrated cryoEM-MS data in Stitch compared to the true heavy and light chain sequences. Sequencing errors are indicated with an asterisk (*) .
Figure 7
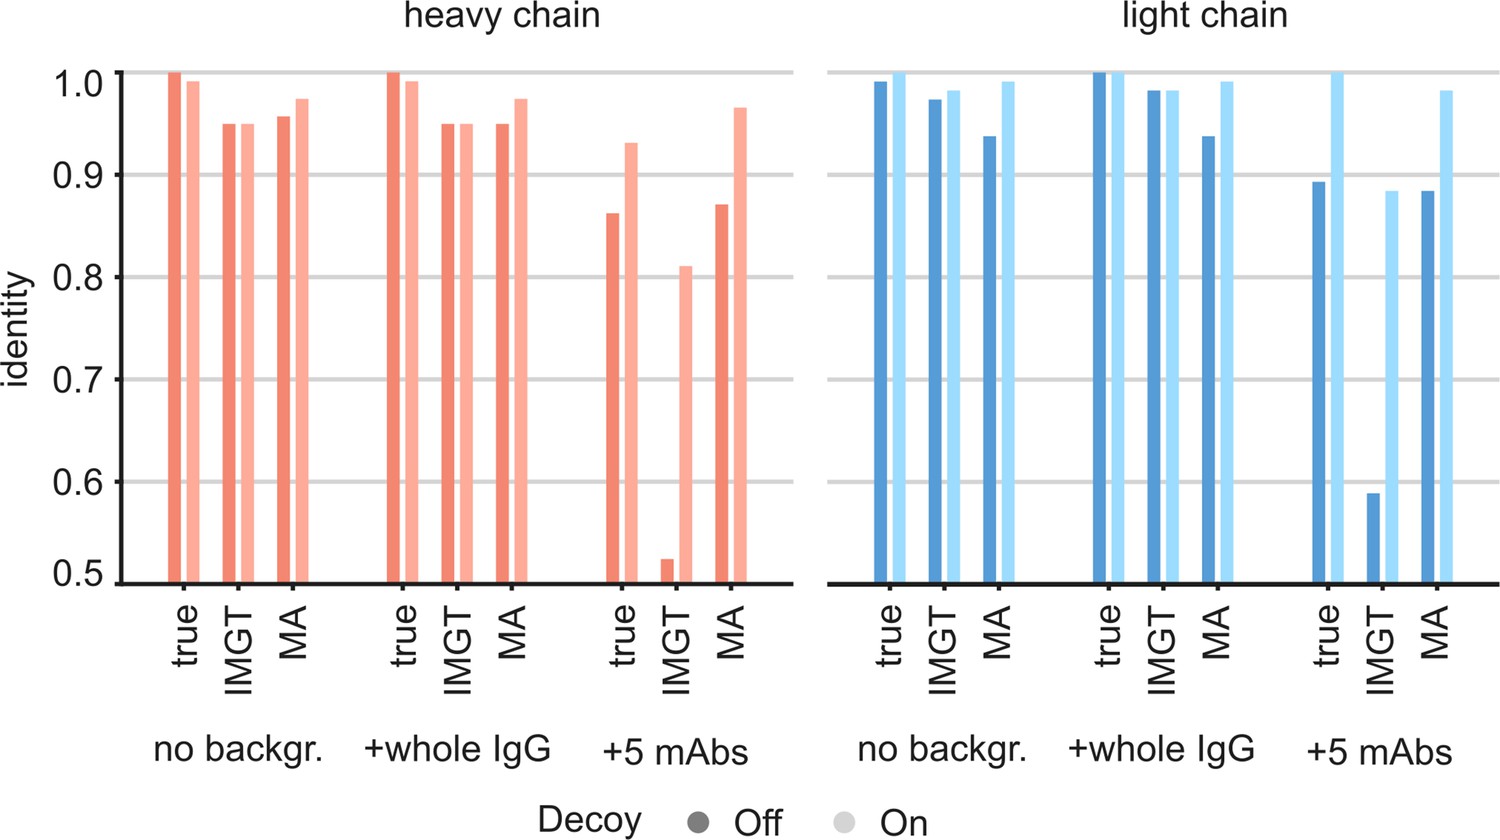
Targeted sequencing of CR3022 against a complex background of other antibodies.
Plotted are the de novo consensus sequence identities derived from the LC-MS/MS data using either the true sequences, the full IMGT repertoire, or the ModelAngelo-derived variable domains as templates. We compare the output from the CR3022 dataset alone (‘No backgr.’) with the output after adding either a diffuse polyclonal IgG background from a COVID-19 patient (‘+whole IgG’) or full datasets from five additional anti-Influenza-HA monoclonals (‘+5 mAbs’). Use of decoy sequences as indicated by dark/light colors.
Figure 8
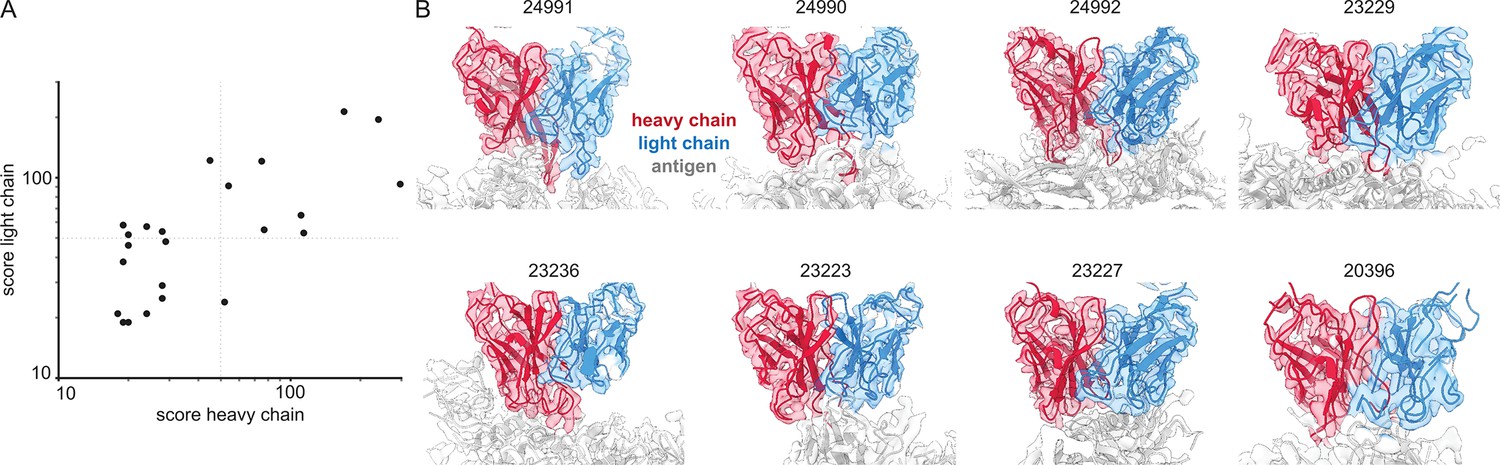
Inferring V-genes from published EMPEM data.
(A) Plotted are all non-zero alignment scores in Stitch from published EMPEM maps. (B) Views of the variable domains of EMPEM maps with alignment scores >50 for both heavy and light chains. The EMDB identifiers are indicated at each panel.
Additional files
-
Supplementary file 1
Benchmark of experimental cryoEM maps of monoclonal antibody-antigen complexes from EMDB.
Overview and results of maps for benchmark.
Name: PDB-ID of deposited model for corresponding map
Actual: corresponding to true VH/VL sequence as deposited in PDB model
Built: corresponding to de novo sequences determined by ModelAngelo
Segment: inferred V-gene from top-scoring hit in Stitch alignment
Score: alignment score in Stitch
Identity: sequence identity between Actual-Built based on de novo seq. or inferred Segments
Resolution: Global FSC resolution of corresponding map
HC: heavy chain
LC: light chain
- https://cdn.elifesciences.org/articles/101322/elife-101322-supp1-v1.csv
-
Supplementary file 2
Benchmark of EMPEM maps downloaded from EMDB for de novo modelling in ModelAngelo, with alignment scores in Stitch.
Overview and results of maps for EMPEM benchmark.
- https://cdn.elifesciences.org/articles/101322/elife-101322-supp2-v1.xlsx
-
MDAR checklist
- https://cdn.elifesciences.org/articles/101322/elife-101322-mdarchecklist1-v1.pdf
Download links
A two-part list of links to download the article, or parts of the article, in various formats.
Downloads (link to download the article as PDF)
Open citations (links to open the citations from this article in various online reference manager services)
Cite this article (links to download the citations from this article in formats compatible with various reference manager tools)
Simultaneous polyclonal antibody sequencing and epitope mapping by cryo electron microscopy and mass spectrometry
eLife 14:RP101322.
https://doi.org/10.7554/eLife.101322.3


