In silico screening by AlphaFold2 program revealed the potential binding partners of nuage-localizing proteins and piRNA-related proteins
- Graduate School of Frontier Biosciences, Osaka University, Japan
- D3 Center, Osaka University, Japan
- NEC Solution Innovators, Ltd., Japan
- Graduate School of Information Science and Technology, Osaka University, Japan
Figures
Figure 1 with 1 supplement
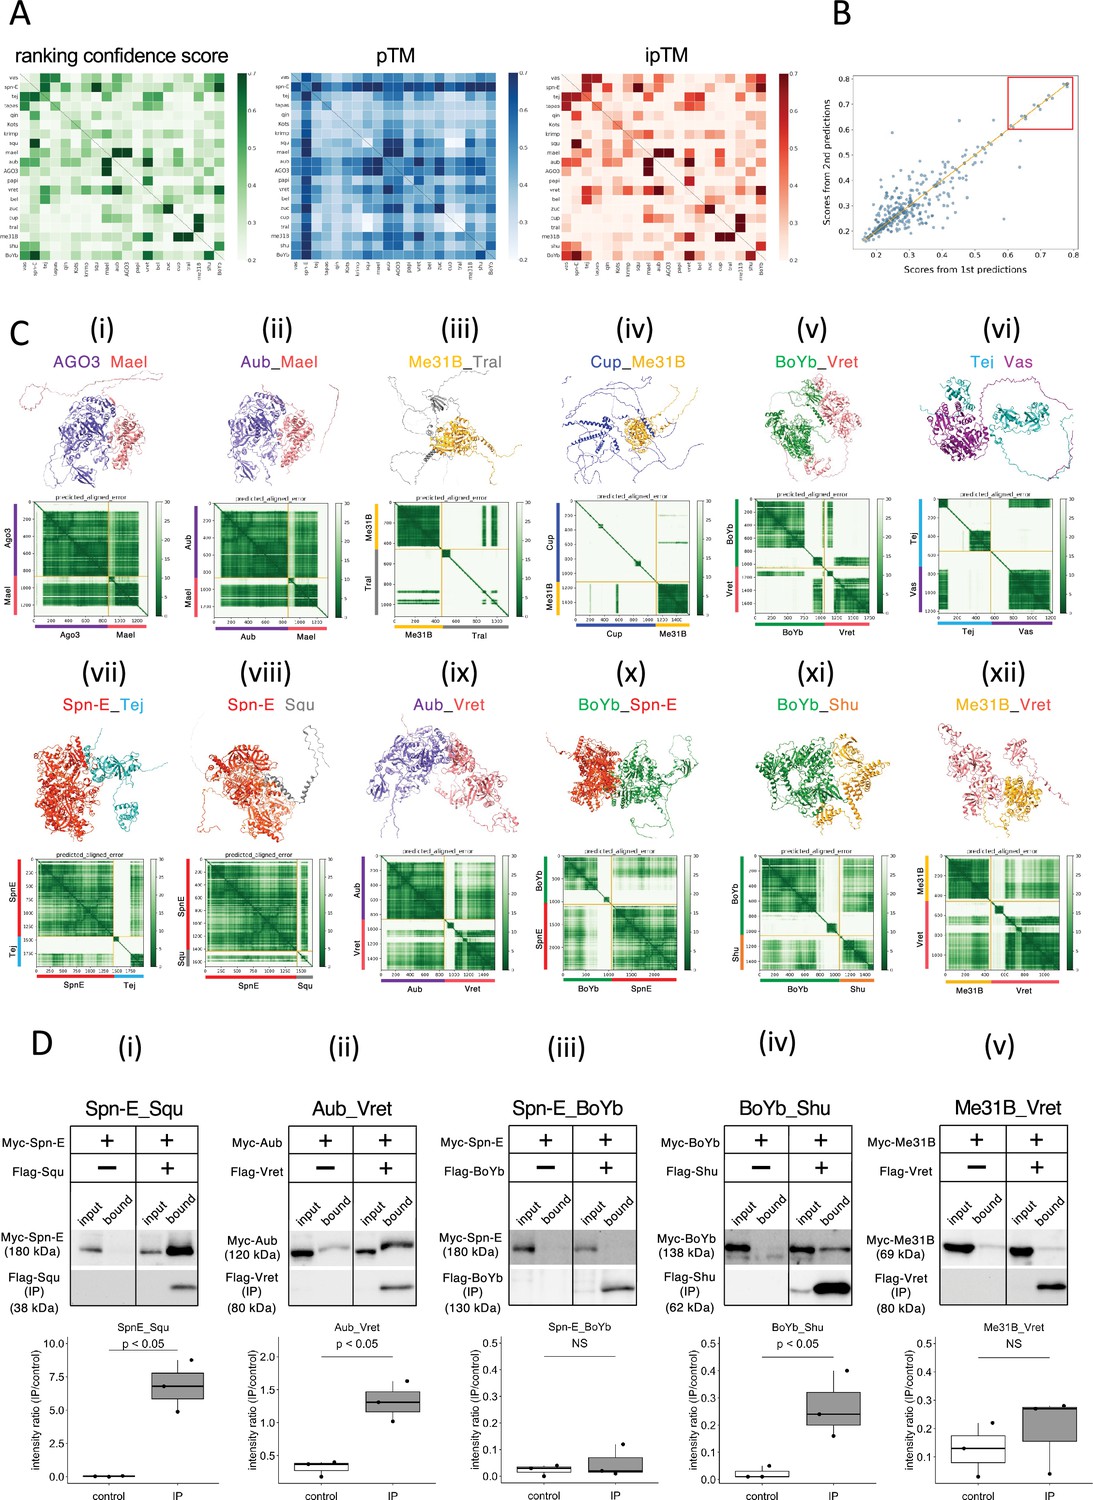
The 1:1 dimer structure prediction by AlphaFold2 for piRNA-related proteins.
(A) Heatmaps of the prediction confidence scores (ranking confidence, green), pTM values (blue), and ipTM values (red) provided by AlphaFold2. The 20 types of proteins are aligned from top to bottom and left to right in the same order. Boxes on diagonal line represent homodimers. (B) Scatter plot of the ranking confidences. The scores from first and second predictions for each heterodimer pair are plotted on X and Y axis, respectively. (Ci~xii) The predicted 3D structures (top panels) and the Predicted Aligned Error (PAE) plots (bottom panels) for each candidate heterodimers scoring above 0.6. The PAE plot displays the positional errors between all amino acid residue pairs, formatted in a matrix layout. (D) Co-immunoprecipitation assays using tagged proteins to verify interactions between specific pairs: Spn-E_Squ (i), Aub_Vret (ii), Spn-E_BoYb (iii), BoYb_Shu (iv), and Me31B_Vret (v). Single transfected cells expressing only Myc-tagged but not Flag-tagged proteins are used as negative controls for each set. Box and whisker plots show the intensity ratio between immunoprecipitated and input bands (n = 3 biological replicates). p-values were calculated using Student’s t-test.
-
Figure 1—source data 1
PDB files used in Figure 1C.
- https://cdn.elifesciences.org/articles/101967/elife-101967-fig1-data1-v1.zip
-
Figure 1—source data 2
Western blots indicating the relevant bands for Figure 1Di.
- https://cdn.elifesciences.org/articles/101967/elife-101967-fig1-data2-v1.zip
-
Figure 1—source data 3
Original western blots for Figure 1Di.
- https://cdn.elifesciences.org/articles/101967/elife-101967-fig1-data3-v1.zip
-
Figure 1—source data 4
Western blots indicating the relevant bands for Figure 1Dii.
- https://cdn.elifesciences.org/articles/101967/elife-101967-fig1-data4-v1.zip
-
Figure 1—source data 5
Original western blots for Figure 1Dii.
- https://cdn.elifesciences.org/articles/101967/elife-101967-fig1-data5-v1.zip
-
Figure 1—source data 6
Western blots indicating the relevant bands for Figure 1Diii.
- https://cdn.elifesciences.org/articles/101967/elife-101967-fig1-data6-v1.zip
-
Figure 1—source data 7
Original western blots for Figure 1Diii.
- https://cdn.elifesciences.org/articles/101967/elife-101967-fig1-data7-v1.zip
-
Figure 1—source data 8
Western blots indicating the relevant bands for Figure 1Div.
- https://cdn.elifesciences.org/articles/101967/elife-101967-fig1-data8-v1.zip
-
Figure 1—source data 9
Original western blots for Figure 1Div.
- https://cdn.elifesciences.org/articles/101967/elife-101967-fig1-data9-v1.zip
-
Figure 1—source data 10
Western blots indicating the relevant bands for Figure 1Dv.
- https://cdn.elifesciences.org/articles/101967/elife-101967-fig1-data10-v1.zip
-
Figure 1—source data 11
Original western blots for Figure 1Dv.
- https://cdn.elifesciences.org/articles/101967/elife-101967-fig1-data11-v1.zip
Figure 1—figure supplement 1
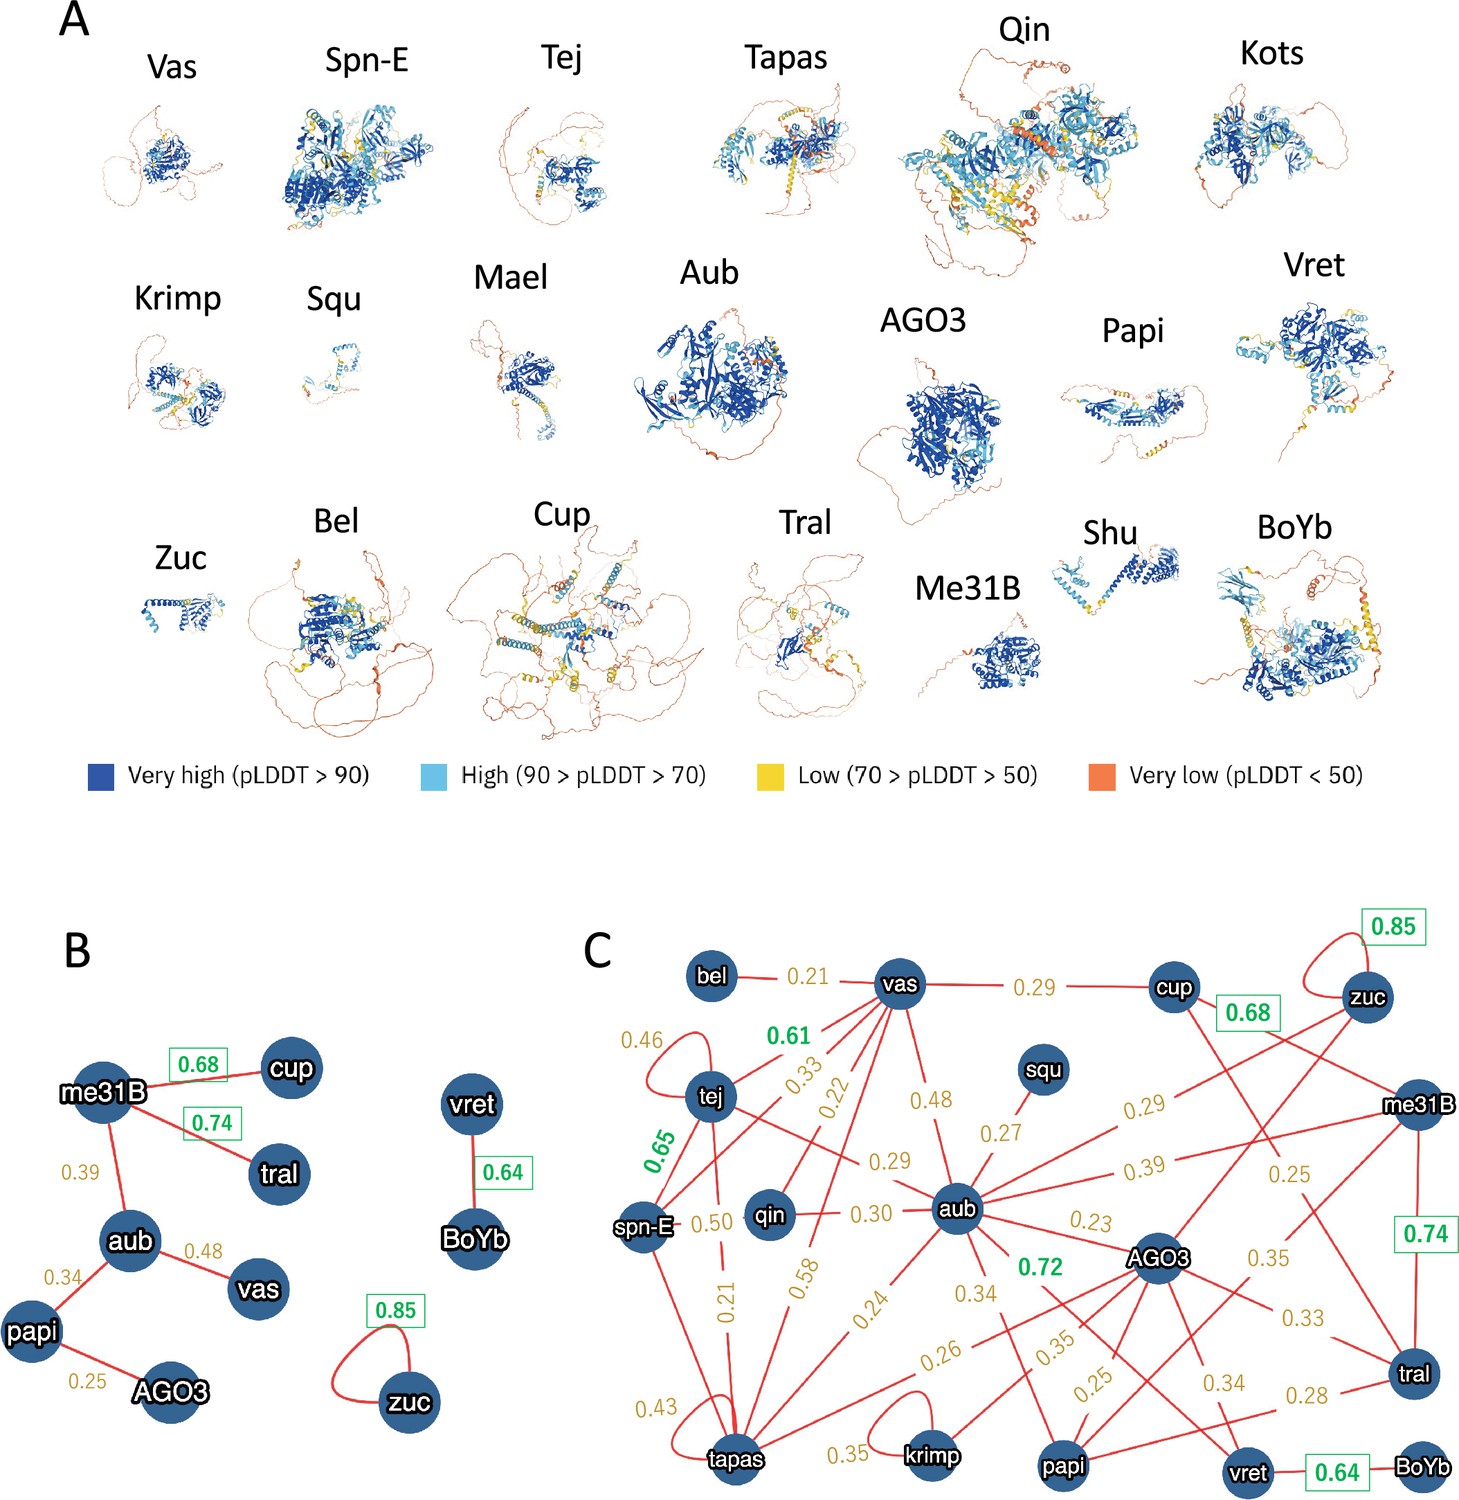
The nuage proteins analyzed in this study.
(A) Predicted monomeric structures of 20 proteins used in this study, presented as ribbon models scaled uniformly. Residues are colored by per-residue model confidence scores (pLDDT). (B) Direct binding pairs from the MIST database, shown with AlphaFold2 scores. (C) Direct or indirect binding pairs from the MIST database, shown with AlphaFold2 scores.
Figure 2 with 3 supplements
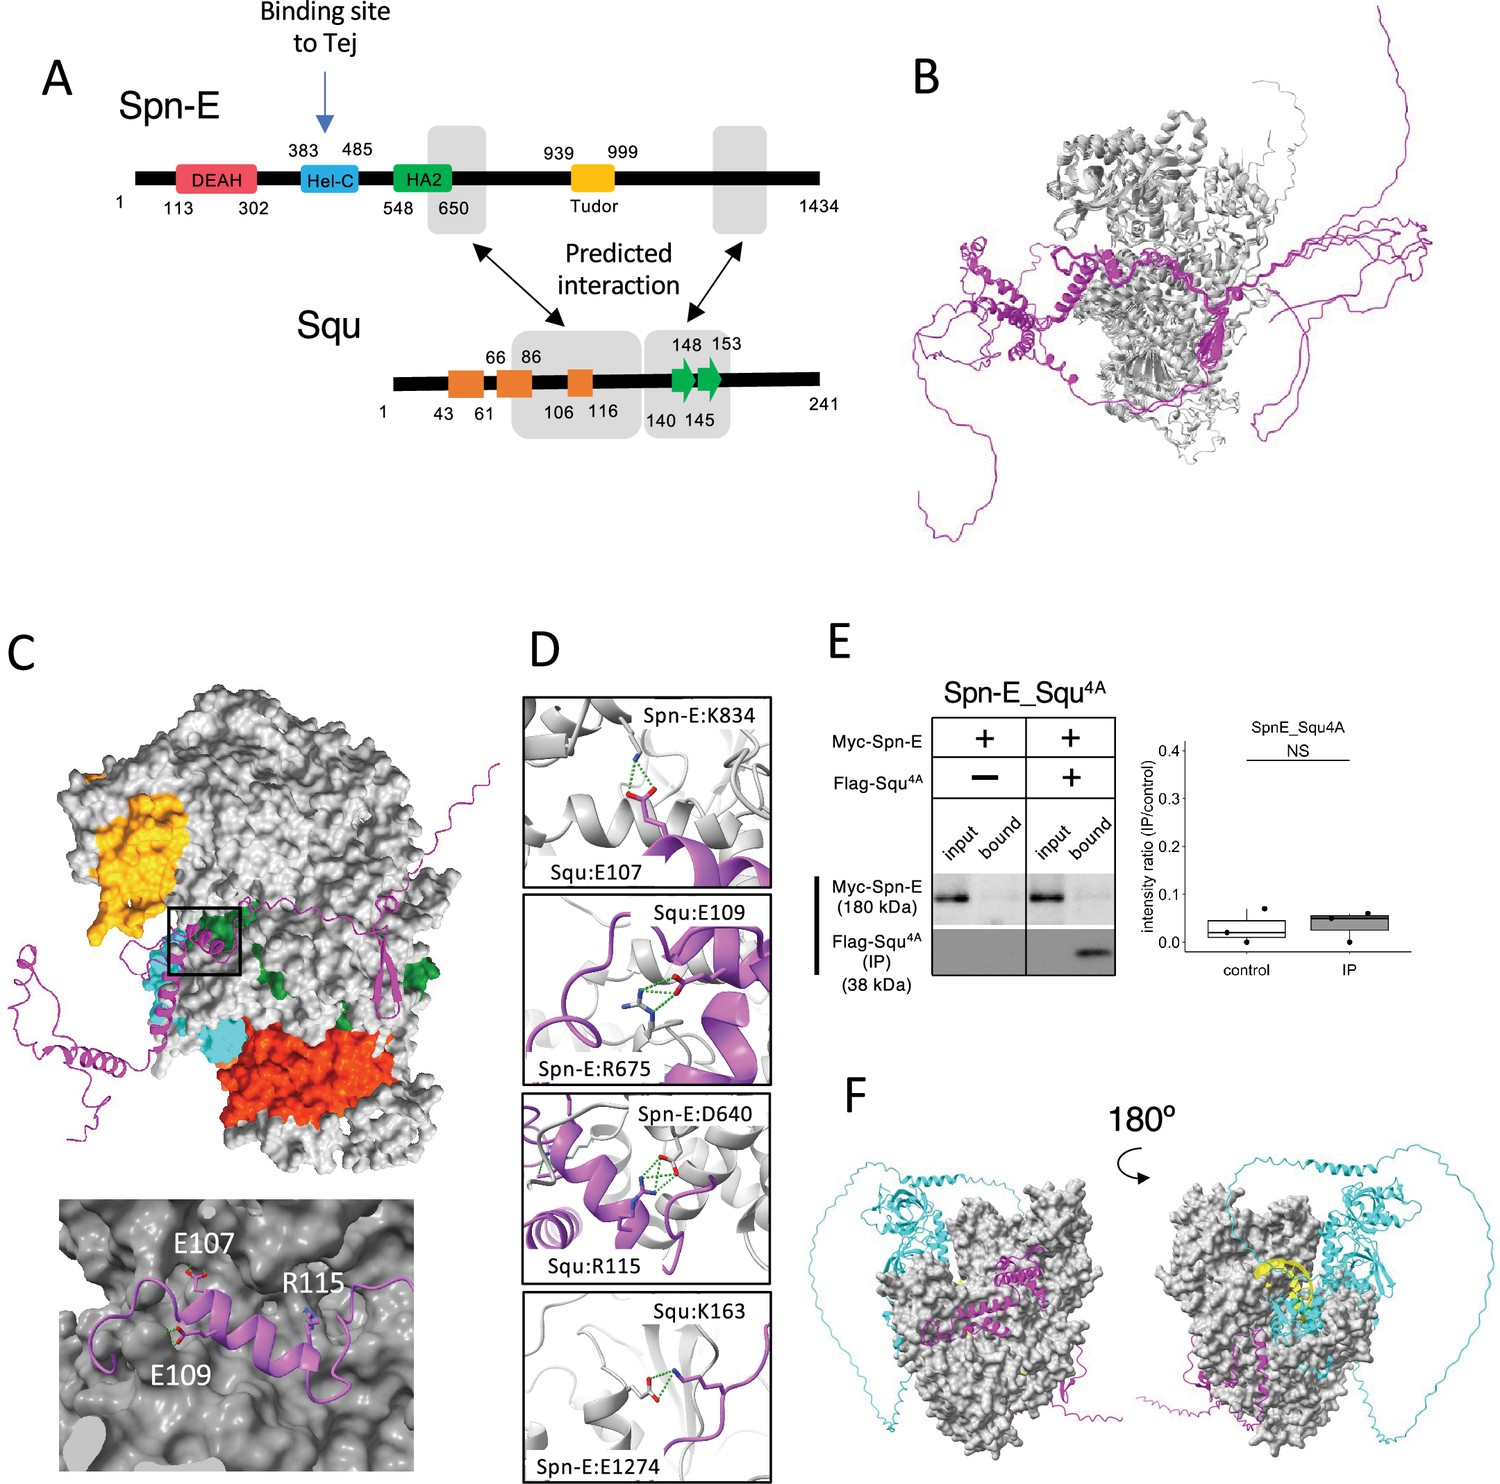
Interaction between Spn-E and Squ.
(A) Schematic of Spn-E domain structures defined in SMART (Letunic et al., 2021). Boxes (α-helix: orange) and arrow (β-sheet: green) for Squ structure. The predicted interacting regions between Spn-E and Squ are indicated in gray boxes. Tej interaction site of Spn-E is also shown (Lin et al., 2023). (B) The predicted five models of heterodimer of Spn-E (in gray) and Squ (in magenta). Spn-E molecules in all five models are superimposed. (C) 3D structure of the Spn-E_Squ dimer colored by Spn-E domains as indicated in (A), with Squ in magenta. The enlarged image of the interface indicated by box is also shown. (D) The predicted salt bridges at the interface, with Spn-E in gray and Squ in magenta. The residues forming salt bridges are depicted in stick model. (E) Co-immunoprecipitation assay using S2 cell lysate to examine the interaction between Myc-Spn-E and Flag-Squ mutant (4A) whose salt bridge-forming residues are mutated to Ala. S2 cells expressing Myc-Spn-E alone is used as a control. The ratios of the band intensity (IP/input) are shown in a box and whisker plot (n = 3 biological replicates). p-values were calculated using Student’s t-test. (F) The heterotetramer model of Spn-E_Squ_Tej_RNA predicted by AlphaFold3. Spn-E is shown as a space filled model in gray, Squ in magenta, Tej in cyan, and RNA in yellow. The model on the left is rotated 180° in the Y axis to produce the image on the right.
-
Figure 2—source data 1
PDB files used in Figure 2B.
- https://cdn.elifesciences.org/articles/101967/elife-101967-fig2-data1-v1.zip
-
Figure 2—source data 2
Western blots indicating the relevant bands for Figure 2E.
- https://cdn.elifesciences.org/articles/101967/elife-101967-fig2-data2-v1.zip
-
Figure 2—source data 3
Original western blots for Figure 2E.
- https://cdn.elifesciences.org/articles/101967/elife-101967-fig2-data3-v1.zip
-
Figure 2—source data 4
CIF file used in Figure 2F.
- https://cdn.elifesciences.org/articles/101967/elife-101967-fig2-data4-v1.zip
Figure 2—figure supplement 1
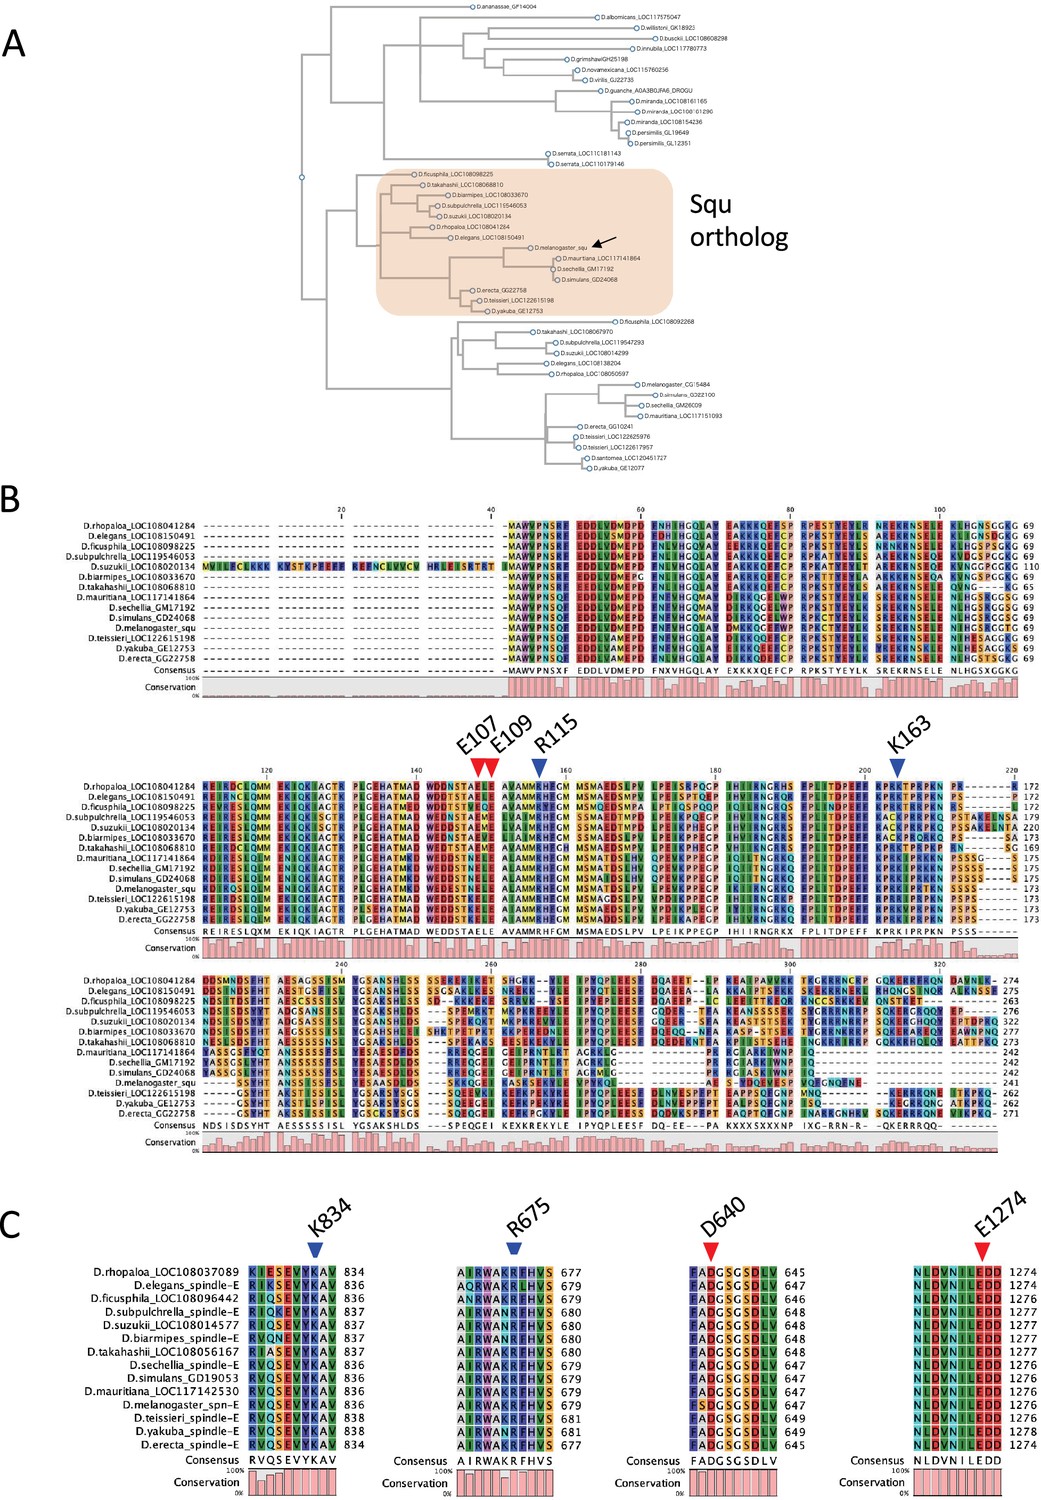
Comparative analysis of Squ and Spn-E orthologs in Drosophila.
(A) Phylogenetic tree of Squ homologs across various Drosophila species. (B) Multiple sequence alignment of Squ orthologs from different Drosophila species, highlighting residues predicted to form salt bridges with Spn-E. (C) Multiple sequence alignment of Spn-E orthologs in Drosophila species focusing on regions around residues predicted to interact with Squ. The legend was shown in the original pdf, but the legends has been removed during the process.
Figure 2—figure supplement 2
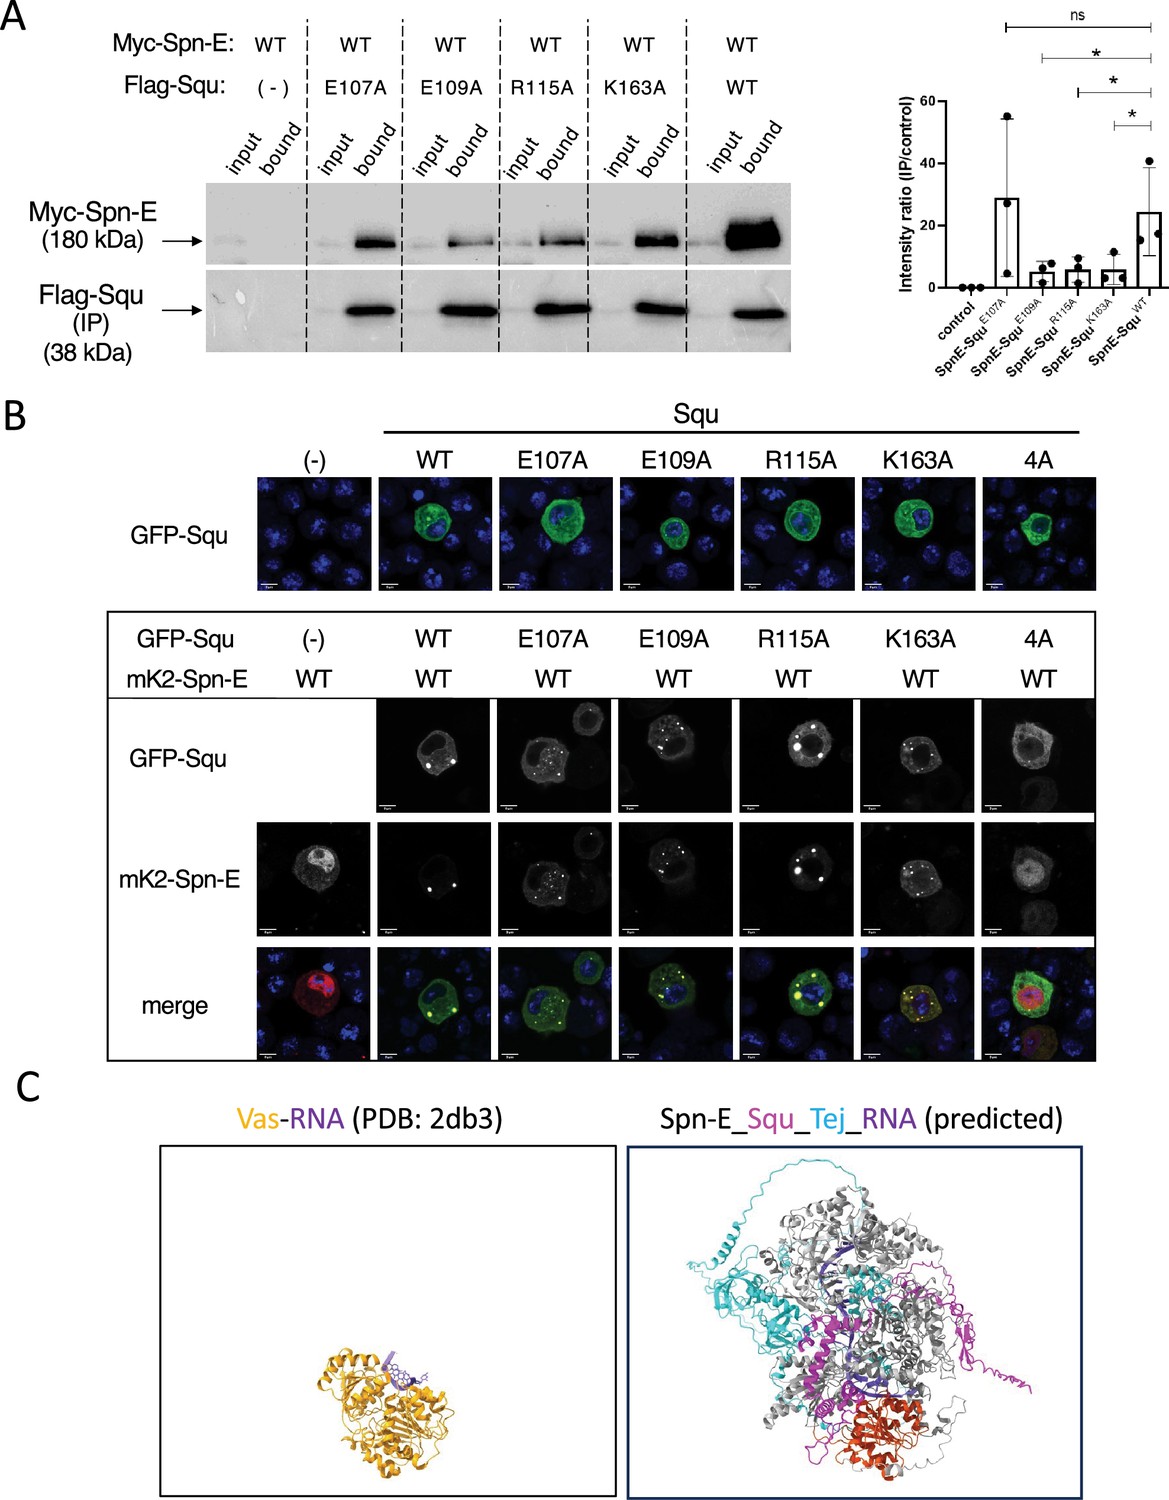
Interaction and localization analysis of Spn-E and Squ in S2 cells.
(A) Co-immunoprecipitation of Myc-Spn-E and Flag-Squ expressed in S2 culture cells. In addition to the wildtype, Squ mutants containing amino acid residues predicted to form salt bridges altered to Alanine were also examined. The right panel shows quantifications of the intensity ratio (IP/input) with error bars indicating s.d. (n=3). ns: not significant. *: p-value < 0.10. (B) Localization of GFP-Squ wildtype and mutants in S2 cells (upper panels). Scale bars: 5 µm. Co-localization of mK2-Spn-E and GFP-Squ wildtype or mutant proteins (except for the 4A mutant) are shown in lower panels. Scale bars: 5 µm. (C) Structural comparison of the Vasa-ssRNA complex (PDB: 2db3, left) and the predicted SpnE_Squ_Tej_RNA complex by AlphaFold3 (right). The Spn-E helicase domain is highlighted in red, with Vas superimposed for comparison. Both views are from the same orientation.
-
Figure 2—figure supplement 2—source data 1
Western blots indicating the relevant bands for Figure 2—figure supplement 2A.
- https://cdn.elifesciences.org/articles/101967/elife-101967-fig2-figsupp2-data1-v1.zip
-
Figure 2—figure supplement 2—source data 2
Original western blots for Figure 2—figure supplement 2A.
- https://cdn.elifesciences.org/articles/101967/elife-101967-fig2-figsupp2-data2-v1.zip
-
Figure 2—figure supplement 2—source data 3
Confocal microscopy images in Figure 2—figure supplement 2B.
- https://cdn.elifesciences.org/articles/101967/elife-101967-fig2-figsupp2-data3-v1.zip
Figure 2—figure supplement 3
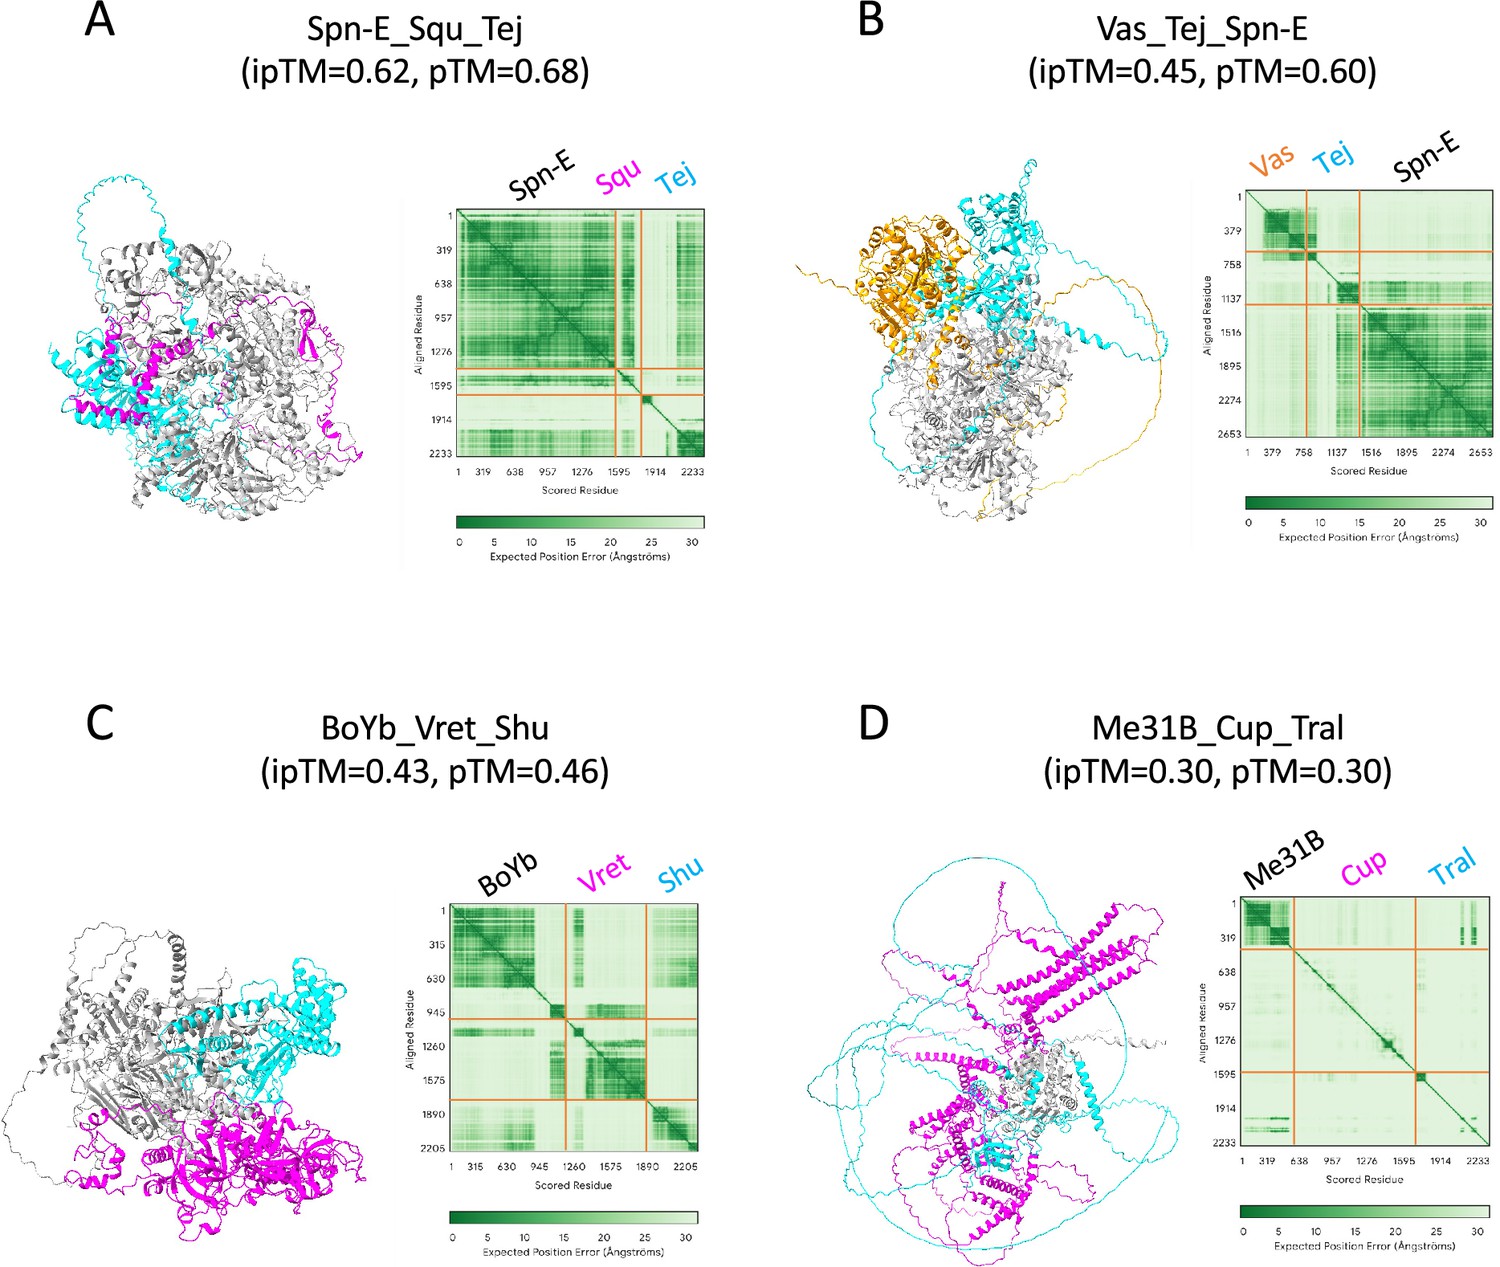
Trimer structures predicted by AlphaFold3.
(A) SpnE_Squ_Tej. (B) Vas_Tej_Spn-E. (C) BoYb_Vret_Shu. (D) Me31B_Cup_Tral.PAE plots are also shown on the right. Orange lines indicate the protein boundaries.
-
Figure 2—figure supplement 3—source data 1
CIF files used in Figure 2—figure supplement 3A–D.
- https://cdn.elifesciences.org/articles/101967/elife-101967-fig2-figsupp3-data1-v1.zip
Figure 3
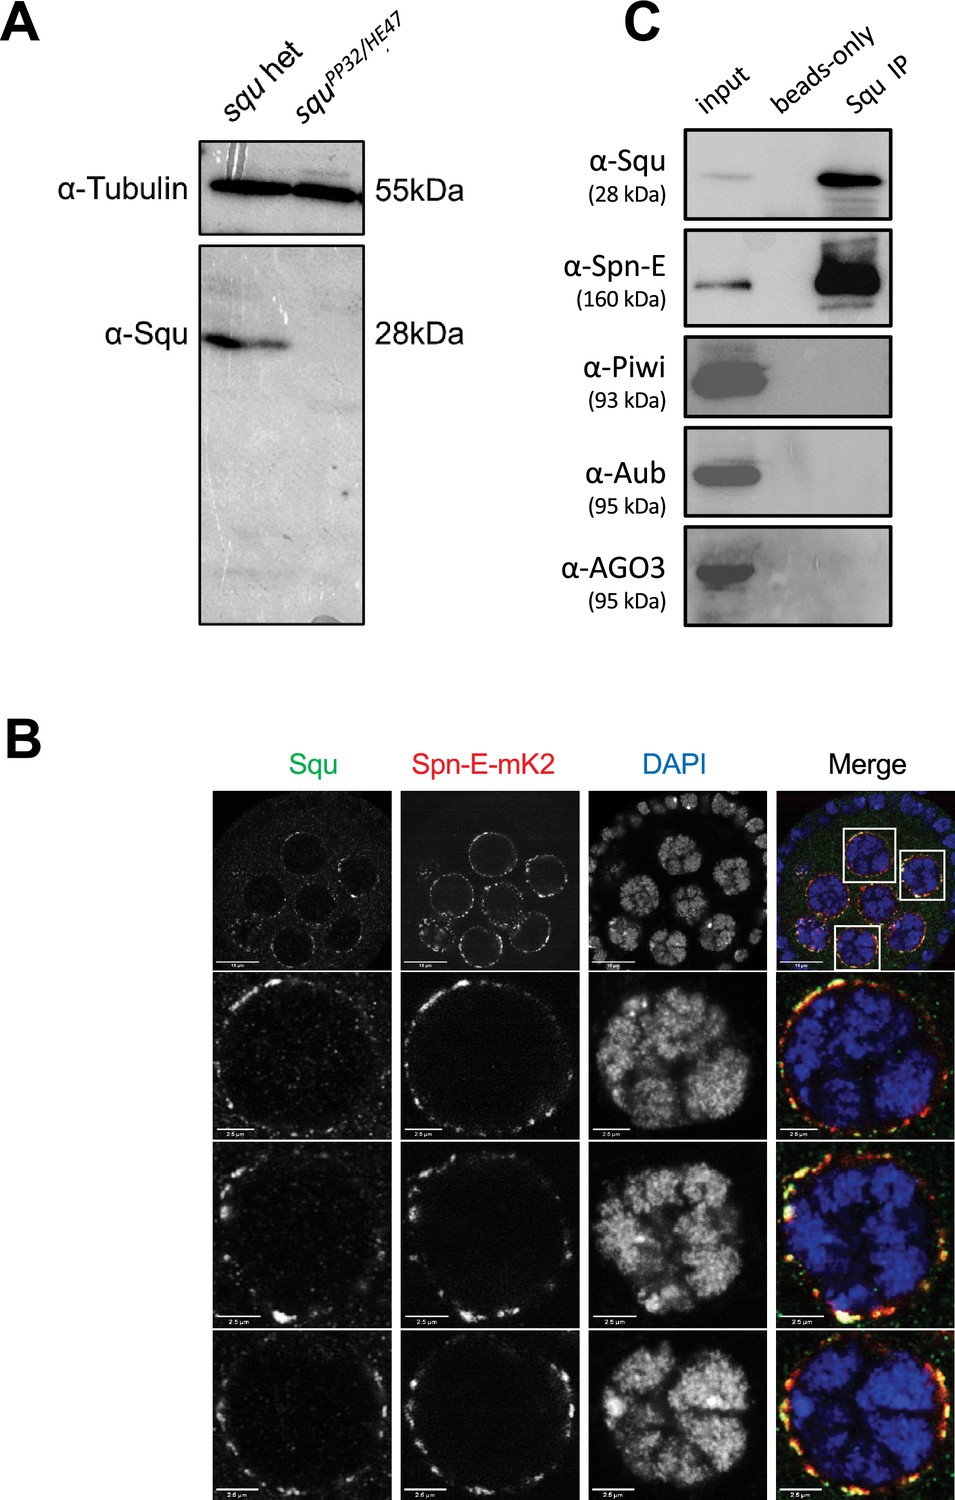
Spn-E and Squ interact in Drosophila ovary.
(A) Western blotting analysis using anti-Squ antibody reveals a specific band at the expected size (approximately 28 kDa) for endogenous Squ in Drosophila ovarian lysates of the heterozygous control. This band is absent in the transheterozygote, squPP32/HE47. (B) Immunostaining of Drosophila egg chambers with anti-Squ antibody and anti-mKate2 (mK2) antibody demonstrates colocalization of Squ and Spn-E-mK2 in nuage, a perinuclear granule in germline cells. The enlarged images of nuclei are shown in the panels below. Scale bars: 10 μm (top row), 2.5 μm (enlarged images). (C) Immunoprecipitation of the endogenous Squ from ovarian lysate revealed the interaction with Spn-E protein. Proteins were detected by western blotting analysis using the specific antibody for each protein. The negative control was performed without anti-Squ antibody (beads only).
-
Figure 3—source data 1
Western blot indicating the relevant bands for Figure 3A.
- https://cdn.elifesciences.org/articles/101967/elife-101967-fig3-data1-v1.zip
-
Figure 3—source data 2
Original western blot for Figure 3A.
- https://cdn.elifesciences.org/articles/101967/elife-101967-fig3-data2-v1.zip
-
Figure 3—source data 3
Confocal microscopy images in Figure 3B.
- https://cdn.elifesciences.org/articles/101967/elife-101967-fig3-data3-v1.zip
-
Figure 3—source data 4
Western blots indicating the relevant bands for Figure 3C.
- https://cdn.elifesciences.org/articles/101967/elife-101967-fig3-data4-v1.zip
-
Figure 3—source data 5
Original western blots for Figure 3C.
- https://cdn.elifesciences.org/articles/101967/elife-101967-fig3-data5-v1.zip
Figure 4 with 1 supplement
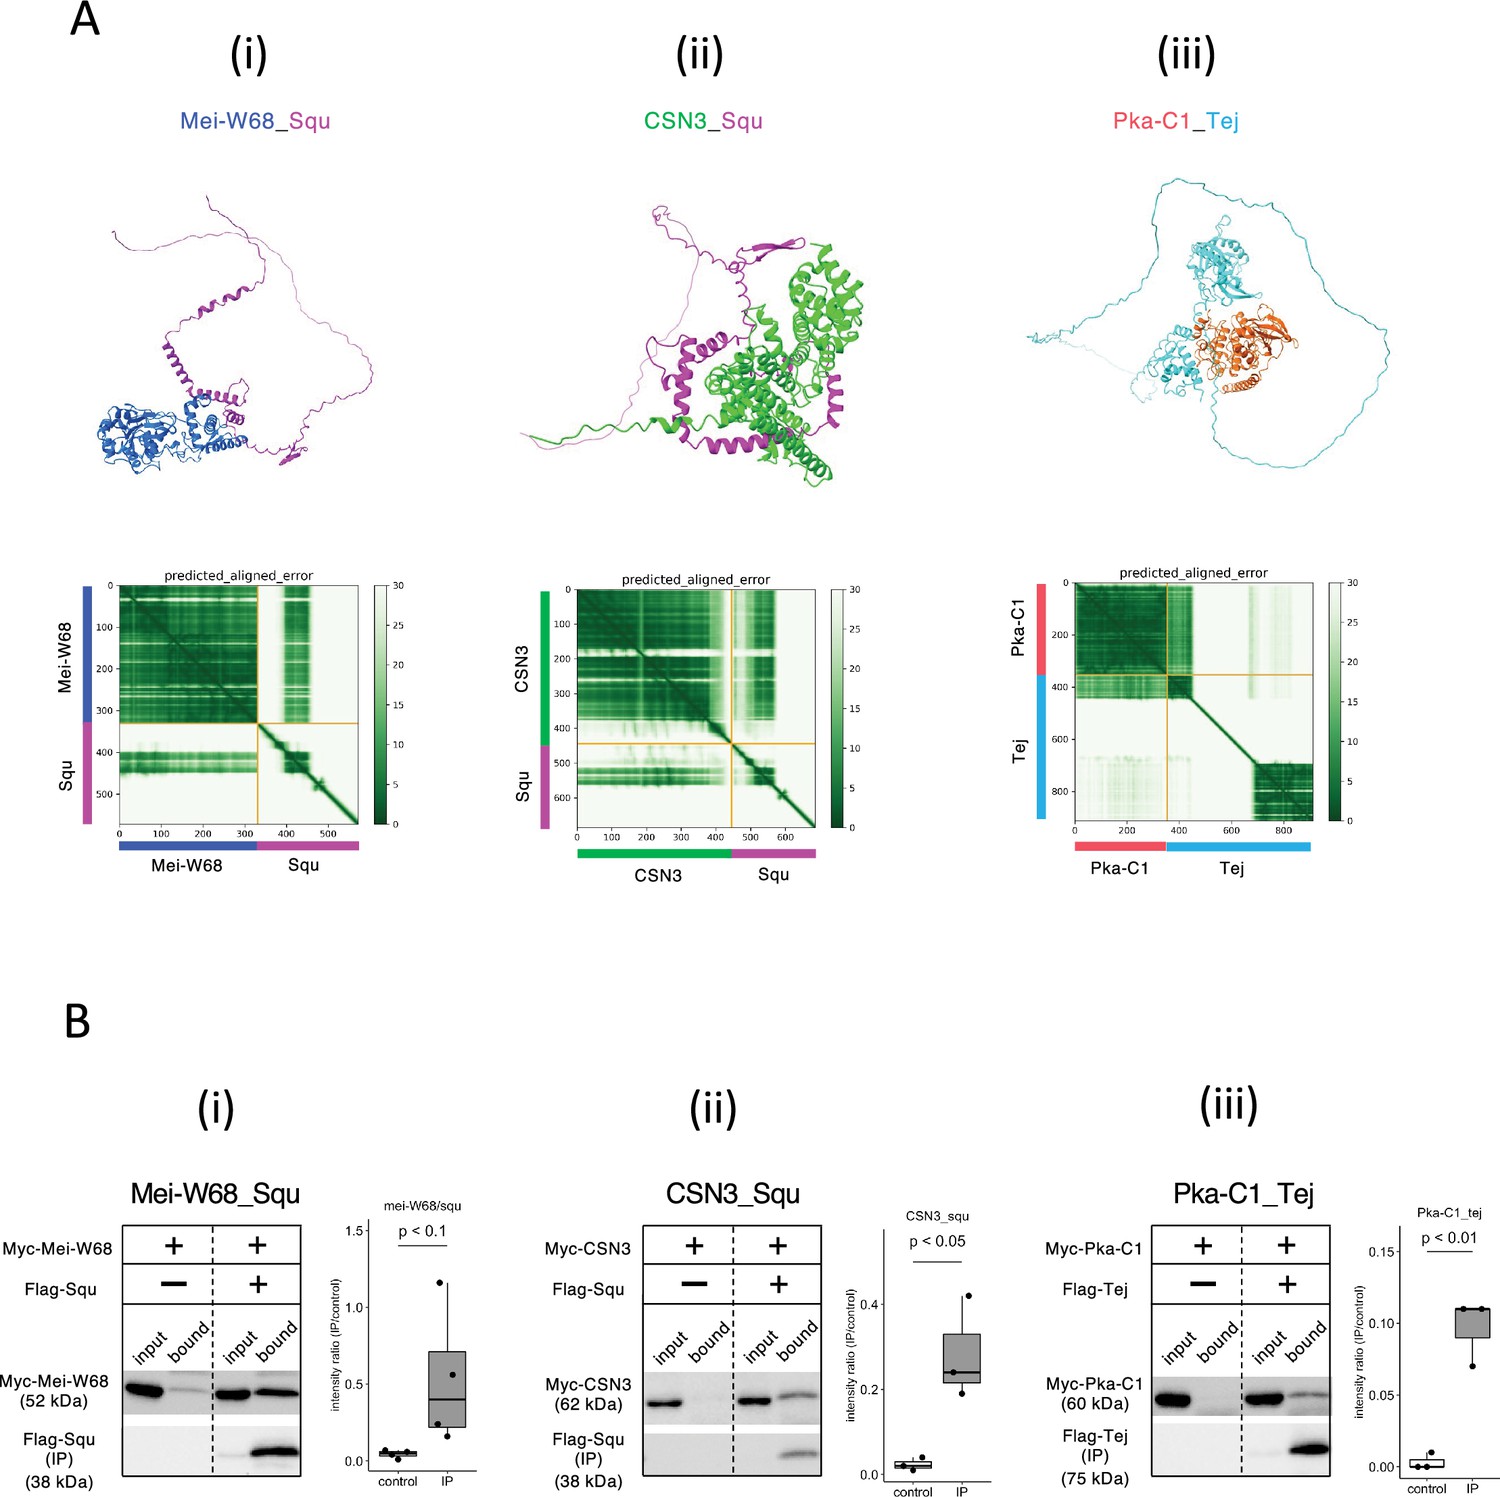
Squ- and Tej-interacting proteins predicted by AlphaFold2.
(Ai–iii) The predicted dimer structures (top) and Predicted Aligned Error (PAE) plots (bottom) of Mei-W68 in blue and Squ in magenta (i), CSN3 in green and Squ in magenta (ii), Pka-C1 in orange and Tej in cyan (iii). The PAE plot displays the positional errors between all amino acid residue pairs, formatted in a matrix layout. (Bi–iii) Co-immunoprecipitation assays using tagged proteins to verify interactions between specific pairs: Mei-W68_Squ (i), CSN3_Squ (ii), and Pka-C1_Tej (iii). Single transfected cells expressing only Myc-tagged but not Flag-tagged proteins are used as negative controls for each set. Box and whisker plots show the intensity ratio between immunoprecipitated and input bands (n = 3 biological replicates). p-values were calculated using Student’s t-test.
-
Figure 4—source data 1
PDB files used in Figure 4A.
- https://cdn.elifesciences.org/articles/101967/elife-101967-fig4-data1-v1.zip
-
Figure 4—source data 2
Western blots indicating the relevant bands for Figure 4Bi.
- https://cdn.elifesciences.org/articles/101967/elife-101967-fig4-data2-v1.zip
-
Figure 4—source data 3
Original western blots for Figure 4Bi.
- https://cdn.elifesciences.org/articles/101967/elife-101967-fig4-data3-v1.zip
-
Figure 4—source data 4
Western blots indicating the relevant bands for Figure 4Bii.
- https://cdn.elifesciences.org/articles/101967/elife-101967-fig4-data4-v1.zip
-
Figure 4—source data 5
Original western blots for Figure 4Bii.
- https://cdn.elifesciences.org/articles/101967/elife-101967-fig4-data5-v1.zip
-
Figure 4—source data 6
Western blots indicating the relevant bands for Figure 4Biii.
- https://cdn.elifesciences.org/articles/101967/elife-101967-fig4-data6-v1.zip
-
Figure 4—source data 7
Original western blots for Figure 4Biii.
- https://cdn.elifesciences.org/articles/101967/elife-101967-fig4-data7-v1.zip
Figure 4—figure supplement 1
Validation of predicted protein interactions via co-immunoprecipitation from S2 cell lysate.
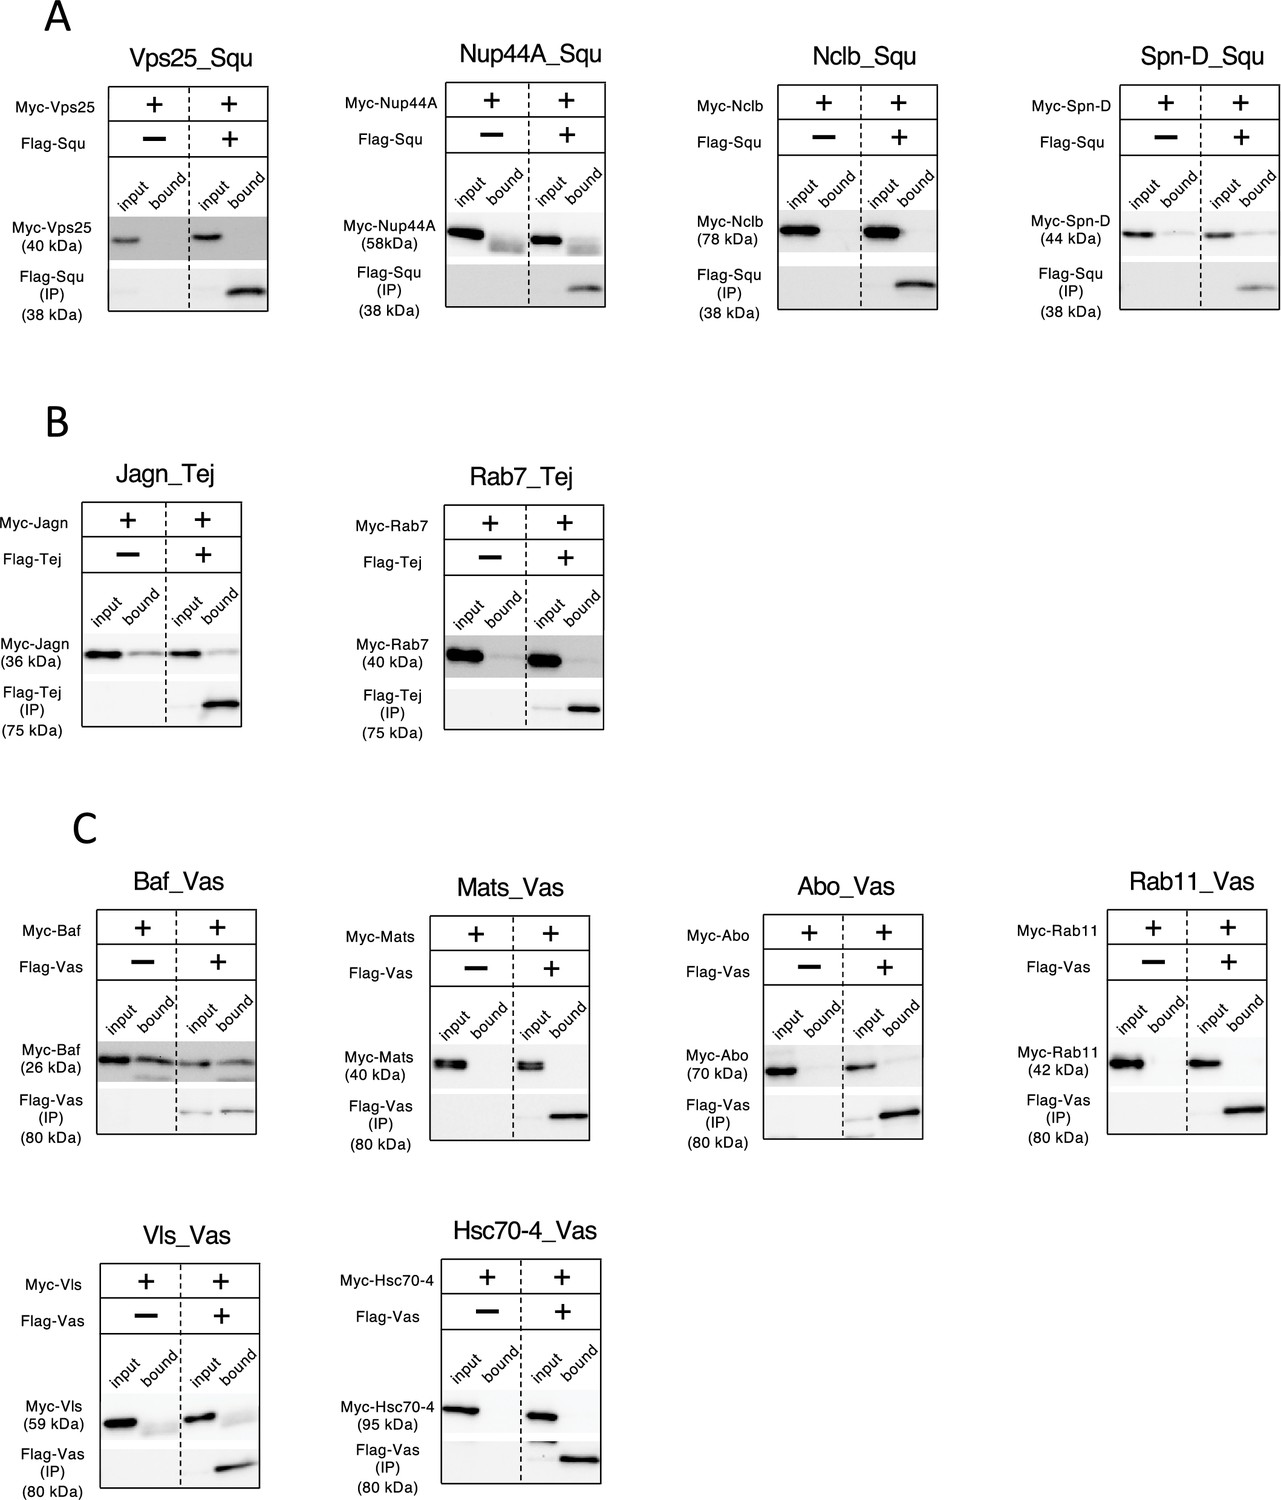
(A) Examination of Squ-interacting candidates predicted by AlphaFold2. (B) Examination of Tej-interacting candidates predicted by AlphaFold2. (C) Examination of Vas-interacting candidates predicted by AlphaFold2.In all the experiments, Flag-tagged proteins are immunoprecipitated and blotted with anti-Myc and anti-Flag antibodies. Single-transfection of Myc-tagged proteins serve as controls.
-
Figure 4—figure supplement 1—source data 1
Western blots indicating the relevant bands for Figure 4—figure supplement 1A.
- https://cdn.elifesciences.org/articles/101967/elife-101967-fig4-figsupp1-data1-v1.zip
-
Figure 4—figure supplement 1—source data 2
Original western blots for Figure 4—figure supplement 1A.
- https://cdn.elifesciences.org/articles/101967/elife-101967-fig4-figsupp1-data2-v1.zip
-
Figure 4—figure supplement 1—source data 3
Western blots indicating the relevant bands for Figure 4—figure supplement 1B.
- https://cdn.elifesciences.org/articles/101967/elife-101967-fig4-figsupp1-data3-v1.zip
-
Figure 4—figure supplement 1—source data 4
Original western blots for Figure 4—figure supplement 1B.
- https://cdn.elifesciences.org/articles/101967/elife-101967-fig4-figsupp1-data4-v1.zip
-
Figure 4—figure supplement 1—source data 5
Western blots indicating the relevant bands for Figure 4—figure supplement 1C (Abo, Baf, Hsc70-4).
- https://cdn.elifesciences.org/articles/101967/elife-101967-fig4-figsupp1-data5-v1.zip
-
Figure 4—figure supplement 1—source data 6
Western blots indicating the relevant bands for Figure 4—figure supplement 1C (Mats, Rab11, Vls).
- https://cdn.elifesciences.org/articles/101967/elife-101967-fig4-figsupp1-data6-v1.zip
-
Figure 4—figure supplement 1—source data 7
Original western blots for Figure 4—figure supplement 1C.
- https://cdn.elifesciences.org/articles/101967/elife-101967-fig4-figsupp1-data7-v1.zip
Figure 5 with 1 supplement
Screening for Piwi-interacting proteins in Drosophila proteome.
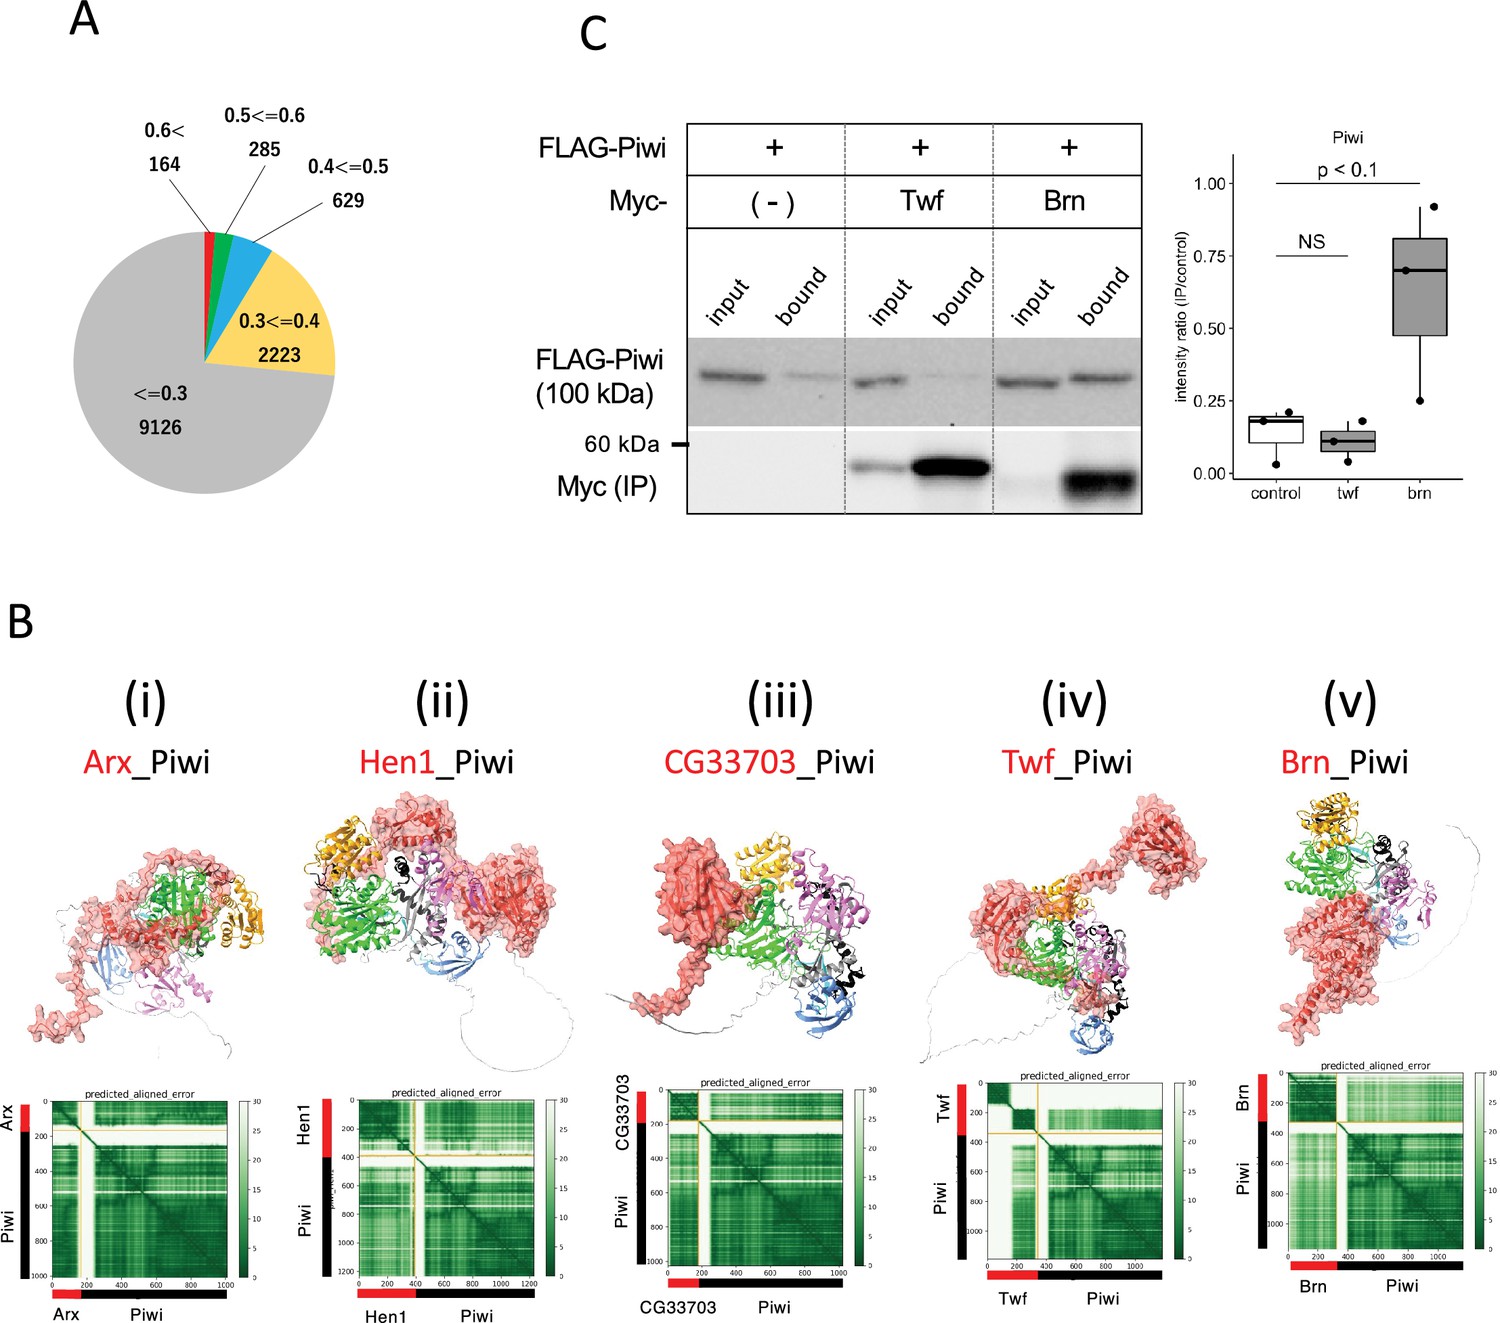
(A) Pie chart displaying the distribution of ranking confidences from the AlphaFold2 screening for Piwi-interacting proteins among those encoded by Drosophila genome. (Bi–v) The predicted dimer structure (top) and PAE plots (bottom) for the Piwi and the binding candidates in red: Arx (i), Hen1 (ii), CG33703 (iii), Twf (iv), and Brn (v). Piwi is shown in the same colors as Figure 5—figure supplement 1A. (C) Co-immunoprecipitation assays using tagged proteins to verify interactions between Piwi and the binding candidates, Twf and Brn. Single transfected cells expressing only Flag-Piwi is used as negative control. Box and whisker plots show the intensity ratio between immunoprecipitated and input bands (n = 3 biological replicates). p-values were calculated using Student’s t-test.
-
Figure 5—source data 1
PDB files used in Figure 5B.
- https://cdn.elifesciences.org/articles/101967/elife-101967-fig5-data1-v1.zip
-
Figure 5—source data 2
Western blots indicating the relevant bands for Figure 5C.
- https://cdn.elifesciences.org/articles/101967/elife-101967-fig5-data2-v1.zip
-
Figure 5—source data 3
Original western blots for Figure 5C.
- https://cdn.elifesciences.org/articles/101967/elife-101967-fig5-data3-v1.zip
Figure 5—figure supplement 1
Structural analyses of Piwi complexes and interactions.
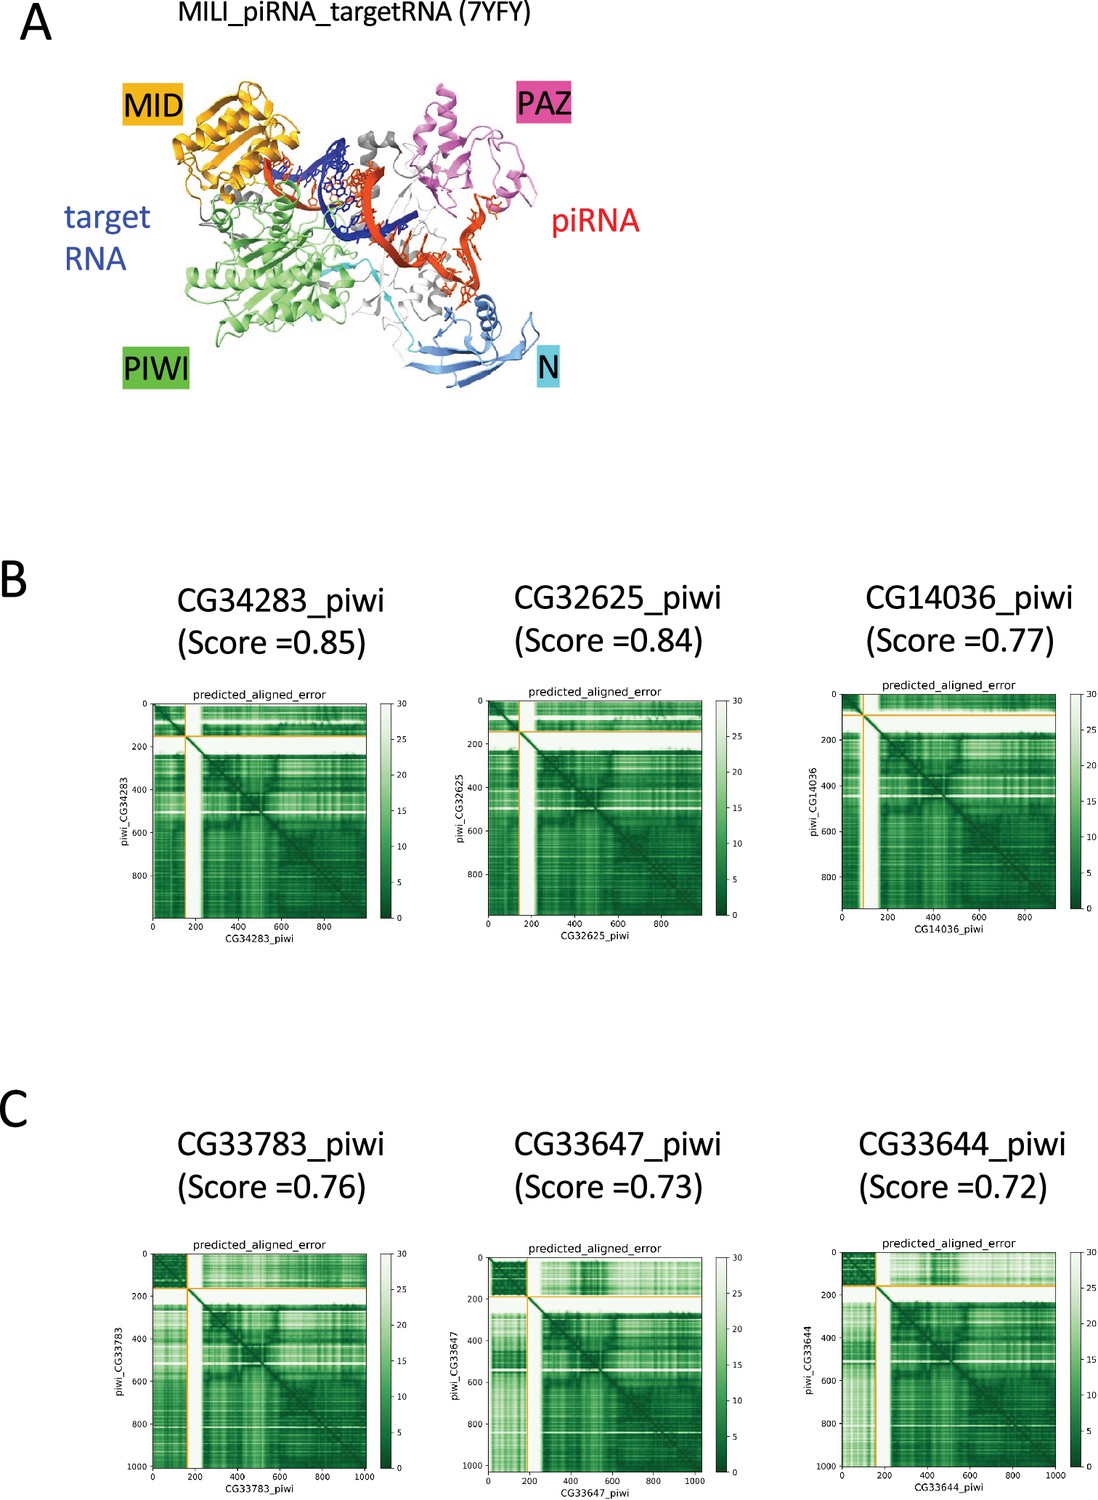
(A) The ternary complex of mouse Piwi ortholog (MILI), piRNA, and the target RNA determined by cryo-EM (PDB: 7YFY). (B) PAE plots for the predicted dimer structures of Piwi and Arx paralogs in Drosophila melanogaster. (C) PAE plots for the predicted dimer structures of Piwi and CG33703 paralogs in Drosophila melanogaster.
Tables
Table 1
The piRNA production-related proteins used in this study.
| Protein | Ortholog | Number of residues | Domain | Direct binding(MIST database) | Localization | Reference |
|---|---|---|---|---|---|---|
| Vas | DDX4 | 661 | DEAD-Box, Hel-C | Aub | Nuage | Lim and Kai, 2007 |
| Spn-E | Tdrd9 | 1434 | DEAD-Box, Hel-C, HA2, eTud | Nuage | Andress et al., 2016 | |
| Tej | Tdrd5 | 559 | Lotus, eTud | Nuage | Lin et al., 2023 | |
| Tapas | Tdrd7 | 1222 | Lotus, eTud | Nuage | Patil et al., 2014 | |
| Qin | Rnf17 | 1857 | RING, eTud | Nuage | Andress et al., 2016 | |
| Kots | Tdrd1 | 892 | eTud | Nuage | Lim et al., 2022 | |
| Krimp | - | 746 | eTud | Nuage | Lim and Kai, 2007 | |
| Squ | - | 241 | Nuage | Pane et al., 2007 | ||
| Mael | Mael | 462 | HMG, MAEL | Nuage | Lim and Kai, 2007 | |
| Aub | PIWIL2 | 866 | N, PAZ, PIWI, MID | Vas, Papi, Me31B | Nuage | Lim and Kai, 2007 |
| AGO3 | PIWIL4 | 867 | N, PAZ, PIWI, MID | Papi | Nuage | Webster et al., 2015 |
| Papi | Tdrkh | 576 | eTud, KH | Aub, AGO3 | Mitochondria | Liu et al., 2011 |
| Vret | Tdrd1 | 691 | eTud | BoYb | Nuage | Handler et al., 2011 |
| Bel | DDX3 | 801 | DEAD-Box | Nuage | Johnstone et al., 2005 | |
| Zuc | Pld6 | 253 | PLD-like | Zuc | Mitochondria | Nguyen et al., 2023 |
| Cup | Eif4enif1 | 1117 | Me31B | Nuage | McCambridge et al., 2020 | |
| Tral | Lsm14 | 657 | Lsm, FDF | Me31B | Nuage | McCambridge et al., 2020 |
| Me31B | DDX6 | 459 | DEAD-Box | Aub, Cup, Tral | Nuage | McCambridge et al., 2020 |
| Shu | Fkbp6 | 455 | PPIase | Nuage | Olivieri et al., 2012 | |
| BoYb | Tdrd12 | 1059 | DEAD-Box, eTud | Vret | Nuage | Handler et al., 2011 |
-
MIST, Molecular Interaction Search Tool.
Table 2
The screening for the interacting proteins (prediction confidence score, ranking confidence >0.6).
| Protein A_Bfirst prediction | ranking confidence | Protein B_Asecond prediction | Ranking confidence | Reference | Validation by co-IP |
|---|---|---|---|---|---|
| Zuc_Zuc | 0.85 | N/A | N/A | Nishimasu et al., 2012 | N/A |
| AGO3_Mael | 0.78 | Mael_AGO3 | 0.78 | Namba et al., 2022 | N/A |
| Aub_Mael | 0.78 | Mael_Aub | 0.78 | Namba et al., 2022 | N/A |
| Spn-E_Squ | 0.77 | Squ_Spn-E | 0.78 | This study | ++ |
| Me31B_Tral | 0.74 | Tral_Me31B | 0.72 | McCambridge et al., 2020 | N/A |
| Aub_Vret | 0.72 | Vret_Aub | 0.72 | This study | + |
| BoYb_Spn-E | 0.69 | Spn-E_BoYb | 0.69 | This study | - |
| Cup_Me31B | 0.68 | Me31B_Cup | 0.70 | McCambridge et al., 2020 | N/A |
| Spn-E_Tej | 0.65 | Tej_Spn-E | 0.65 | Lin et al., 2023 | N/A |
| BoYb_Vret | 0.64 | Vret_BoYb | 0.65 | Handler et al., 2011 | N/A |
| BoYb_Shu | 0.64 | Shu_BoYb | 0.56 | This study | + |
| Me31B_Vret | 0.64 | Vret_Me31B | 0.45 | This study | - |
| Tej_Vas | 0.61 | Vas_Tej | 0.62 | Patil and Kai, 2010 | N/A |
Table 3
The binding candidates predicted by AlphaFold2.
| Protein_A | Protein_B | AlphaFold2ranking confidence | Validation by co-IP | Function of Protein_A |
|---|---|---|---|---|
| Vps25 | Squ | 0.71 | No | A member of the ESCRT-II complex |
| Nup44A | Squ | 0.65 | No | A nuclear pore protein |
| Nclb | Squ | 0.64 | No | Chromatin-associated factor |
| Mei-W68 | Squ | 0.63 | Bound | Formation of double-strand breaks |
| DNaseII | Squ | 0.63 | N/E | Deoxyribonuclease II |
| Spn-D | Squ | 0.62 | No | Homologous recombinational DNA repair |
| CSN3 | Squ | 0.62 | Bound | Subunit of the COP9 signalosome |
| Jagn | Tej | 0.72 | No | Located in the endoplasmic reticulum |
| Pka-C1 | Tej | 0.64 | Bound | Serine/threonine kinase |
| Rab7 | Tej | 0.62 | No | Vesicle trafficking regulation |
| Baf | Vas | 0.85 | No | Chromatin organization |
| Mats | Vas | 0.79 | No | Coactivator of Warts (Wts) kinase |
| Abo | Vas | 0.68 | No | Negative regulator of histone transcription genes |
| CathD | Vas | 0.67 | N/E | Apoptosis and the defense response |
| Rab11 | Vas | 0.67 | No | Endomembrane trafficking |
| Vls | Vas | 0.63 | No | Substrate recognition platform for cusl |
| Hsc70-4 | Vas | 0.62 | No | Protein folding |
| RhoL | Vas | 0.61 | N/E | Maturation of hemocytes |
-
The expression plasmids were not constructed due to the technical reasons.
-
N/E, not examined.
Table 4
Piwi-interacting proteins predicted by AlphaFold2 (score ≥ 0.75).
| Protein | Length (residue) | Ranking confidence | Human ortholog | Gene summary (FlyBase) |
|---|---|---|---|---|
| CG34283 | 153 | 0.85 | GTSF1 | - |
| CG32625 | 144 | 0.84 | GTSF1 | - |
| Arx | 167 | 0.83 | GTSF1 | It plays an essential role in piRNA-guided transcriptional silencing, interacting probably directly with the product of piwi |
| CG33703 | 181 | 0.82 | - | No phenotypic data is available |
| GstE12 | 223 | 0.82 | GSTT2B | Glutathione S transferase E12 (GstE12) encodes an enzyme involved in glutathione metabolism |
| CAH4 | 279 | 0.81 | CA6 | Predicted to enable carbonate dehydratase activity. Predicted to be active in cytoplasm |
| CG13192 | 323 | 0.81 | GNB1L | Predicted to be involved in social behavior |
| Mael | 462 | 0.79 | MAEL | Involved both in the piRNA and miRNA metabolic processes |
| Adk3 | 366 | 0.78 | ADK | Predicted to enable adenosine kinase activity |
| Alg11 | 475 | 0.78 | ALG11 | Predicted to enable GDP-Man:Man3GlcNAc2-PP-Dol alpha-1,2-mannosyltransferase activity |
| CG41378 | 228 | 0.78 | IFI30 | Predicted to enable oxidoreductase activity |
| CG14036 | 93 | 0.77 | GTSF1 | Involved in copper ion homeostasis |
| CG7966 | 486 | 0.77 | SELENBP1 | Predicted to enable methanethiol oxidase activity |
| Hen1 | 391 | 0.77 | HENMT1 | Hen1 encodes a methyltransferase that methylates the terminal 2' hydroxyl group of small interfering RNAs and Piwi-interacting RNAs |
| Rpp14b | 112 | 0.77 | RPP14 | Predicted to enable ribonuclease P RNA binding activity |
| CG33783 | 164 | 0.76 | - | No phenotypic data is available |
| AANATL4 | 224 | 0.75 | - | Predicted to enable aralkylamine N-acetyltransferase activity |
| CG14787 | 260 | 0.75 | CDYL2 | Is expressed in adult heart; embryonic Malpighian tubule; and embryonic main segment of Malpighian tubule |
| CG33160 | 258 | 0.75 | PRSS1 | Predicted to enable serine-type endopeptidase activity |
| CG3397 | 342 | 0.75 | AKR7A2 | Predicted to enable D-arabinose 1-dehydrogenase [NAD(P)+] activity |
| CG4390 | 330 | 0.75 | ESD | Enables serine hydrolase activity |
| CG7142 | 334 | 0.75 | KLK1 | Predicted to enable serine-type endopeptidase activity |
| JanA | 135 | 0.75 | PHPT1 | JanA and janB regulate somatic sex differentiation |
| Yip7 | 270 | 0.75 | CTRB1 | Enables serine hydrolase activity |
Key resources table
| Reagent type (species) or resource | Designation | Source or reference | Identifiers | Additional information |
|---|---|---|---|---|
| Gene (Drosophila melanogaster) | Vas | FlyBase | FBgn0283442 | |
| Gene (D. melanogaster) | Spn-E | FlyBase | FBgn0003483 | |
| Gene (D .melanogaster) | Tej | FlyBase | FBgn0033921 | |
| Gene (D. melanogaster) | Tapas | FlyBase | FBgn0027529 | |
| Gene (D. melanogaster) | Qin | FlyBase | FBgn0263974 | |
| Gene (D. melanogaster) | Kots | FlyBase | FBgn0038191 | |
| Gene (D. melanogaster) | Krimp | FlyBase | FBgn0034098 | |
| Gene (D. melanogaster) | Squ | FlyBase | FBgn0267347 | |
| Gene (D. melanogaster) | Mael | FlyBase | FBgn0016034 | |
| Gene (D. melanogaster) | Aub | FlyBase | FBgn0000146 | |
| Gene (D. melanogaster) | AGO3 | FlyBase | FBgn0250816 | |
| Gene (D. melanogaster) | Papi | FlyBase | FBgn0031401 | |
| Gene (D. melanogaster) | Vret | FlyBase | FBgn0263143 | |
| Gene (D. melanogaster) | Bel | FlyBase | FBgn0263231 | |
| Gene (D. melanogaster) | Zuc | FlyBase | FBgn0261266 | |
| Gene (D. melanogaster) | Cup | FlyBase | FBgn0000392 | |
| Gene (D. melanogaster) | Tral | FlyBase | FBgn0041775 | |
| Gene (D. melanogaster) | Me31B | FlyBase | FBgn0004419 | |
| Gene (D. melanogaster) | Shu | FlyBase | FBgn0003401 | |
| Gene (D. melanogaster) | BoYb | FlyBase | FBgn0037205 | |
| Gene (D. melanogaster) | Piwi | FlyBase | FBgn0004872 | |
| Gene (D. melanogaster) | Mei-W68 | FlyBase | FBgn0002716 | |
| Gene (D. melanogaster) | CSN3 | FlyBase | FBgn0027055 | |
| Gene (D. melanogaster) | Pka-C1 | FlyBase | FBgn0000273 | |
| Gene (D. melanogaster) | Twf | FlyBase | FBgn0038206 | |
| Gene (D. melanogaster) | Brn | FlyBase | FBgn0000221 | |
| Gene (D. melanogaster) | Vps25 | FlyBase | FBgn0022027 | |
| Gene (D. melanogaster) | Nup44A | FlyBase | FBgn0033247 | |
| Gene (D. melanogaster) | Nclb | FlyBase | FBgn0263510 | |
| Gene (D. melanogaster) | Spn-D | FlyBase | FBgn0003482 | |
| Gene (D. melanogaster) | Jagn | FlyBase | FBgn0037374 | |
| Gene (D. melanogaster) | Rab7 | FlyBase | FBgn0015795 | |
| Gene (D. melanogaster) | Baf | FlyBase | FBgn0031977 | |
| Gene (D. melanogaster) | Mats | FlyBase | FBgn0038965 | |
| Gene (D. melanogaster) | Abo | FlyBase | FBgn0000018 | |
| Gene (D. melanogaster) | Rab11 | FlyBase | FBgn0015790 | |
| Gene (D. melanogaster) | Vls | FlyBase | FBgn0003978 | |
| Gene (D. melanogaster) | Hsc70-4 | FlyBase | FBgn0266599 | |
| Strain, strain background (Escherichia coli) | DH5α | Takara | Cat# 9057 | Competent cells |
| Genetic reagent (D. melanogaster) | w-; squHE47 cn bw/CyO; TM3 Sb/TM6 Tb | Pane et al., 2007 | ||
| Genetic reagent (D. melanogaster) | w; squpp32/CyO; TM3 Sb/TM6 Tb | Pane et al., 2007 | ||
| Cell line (D. melanogaster) | S2 | DRSC | FLYB:FBtc0000181; RRID:CVCL_Z992 | Cell line maintained in T. Kai lab |
| Antibody | Anti-Squ (rat polyclonal) | This study | IF (1:5000) WB (1:1000) | |
| Antibody | Anti-Spn-E (rat polyclonal) | Lin et al., 2023 | WB (1:500) | |
| Antibody | Anti-Ago3 (rat polyclonal) | Lin et al., 2023 | WB (1:200) | |
| Antibody | Anti-Aub (guinea pig polyclonal) | Lim et al., 2022 | WB (1:1000) | |
| Antibody | Anti-Piwi (mouse monoclonal G-1) | Santa Cruz | Cat# sc-390946 | WB (1:1000) |
| Antibody | Anti-α-Tubulin (mouse monoclonal DM1A) | Santa Cruz | Cat# sc-32293; RRID:AB_628412 | WB (1:1000) |
| Antibody | Anti-guinea pig HRP-conjugated (rabbit polyclonal) | Dako | Cat # P0141; RRID:AB_628412 | WB (1:1000) |
| Antibody | Anti-rat HRP-conjugated (rabbit polyclonal) | Dako | Cat # P0450; RRID:AB_2630354 | WB (1:1000) |
| Antibody | Anti-mouse HRP-conjugated (goat polyclonal) | Bio-Rad | Cat # 1706516; RRID:AB_2921252 | WB (1:3000) |
| Antibody | Anti-rabbit HRP-conjugated (goat polyclonal) | Bio-Rad | Cat # 1706515; RRID:AB_11125142 | WB (1:3000) |
| Antibody | Anti-DDDDK-tag HRP-conjugated (mouse monoclonal) | MBL | Cat# M185-7; RRID:AB_2687989 | WB (1:1000) |
| Antibody | Anti-Myc-tag HRP-conjugated (mouse monoclonal) | MBL | Cat# M192-7; RRID:AB_3678890 | WB (1:1000) |
| Recombinant DNA reagent | Spn-E (plasmid) | Lin et al., 2023 | Myc-tag mK2-tag | |
| Recombinant DNA reagent | Aub (plasmid) | Patil and Kai, 2010 | Myc-tag | |
| Recombinant DNA reagent | BoYb (plasmid) | This study | Myc-tag Flag-tag | |
| Recombinant DNA reagent | Me31B (plasmid) | This study | Myc-tag | |
| Recombinant DNA reagent | Vret (plasmid) | This study | Flag-tag | |
| Recombinant DNA reagent | Shu (plasmid) | This study | Flag-tag | |
| Recombinant DNA reagent | SquWT (plasmid) | This study | Flag-tag GFP tag | |
| Recombinant DNA reagent | Squ4A (plasmid) | This study | Flag-tag GFP tag | |
| Recombinant DNA reagent | SquE107A (plasmid) | This study | Flag-tag GFP tag | |
| Recombinant DNA reagent | SquE109A (plasmid) | This study | Flag-tag GFP tag | |
| Recombinant DNA reagent | SquR115A (plasmid) | This study | Flag-tag GFP tag | |
| Recombinant DNA reagent | SquK163A (plasmid) | This study | Flag-tag GFP tag | |
| Recombinant DNA reagent | Tej (plasmid) | Patil and Kai, 2010 | Flag-tag | |
| Recombinant DNA reagent | Vas (plasmid) | Patil and Kai, 2010 | Flag-tag | |
| Recombinant DNA reagent | Mei-W68 (plasmid) | This study | Myc-tag | |
| Recombinant DNA reagent | CSN3 (plasmid) | This study | Myc-tag | |
| Recombinant DNA reagent | Pka-C1 (plasmid) | This study | Myc-tag | |
| Recombinant DNA reagent | Vps25 (plasmid) | This study | Myc-tag | |
| Recombinant DNA reagent | Nup44A (plasmid) | This study | Myc-tag | |
| Recombinant DNA reagent | Nclb (plasmid) | This study | Myc-tag | |
| Recombinant DNA reagent | Spn-D (plasmid) | This study | Myc-tag | |
| Recombinant DNA reagent | Jagn (plasmid) | This study | Myc-tag | |
| Recombinant DNA reagent | Rab7 (plasmid) | This study | Myc-tag | |
| Recombinant DNA reagent | Baf (plasmid) | This study | Myc-tag | |
| Recombinant DNA reagent | Mats (plasmid) | This study | Myc-tag | |
| Recombinant DNA reagent | Abo (plasmid) | This study | Myc-tag | |
| Recombinant DNA reagent | Rab11 (plasmid) | This study | Myc-tag | |
| Recombinant DNA reagent | Vls (plasmid) | This study | Myc-tag | |
| Recombinant DNA reagent | Hsc70-4 (plasmid) | This study | Myc-tag | |
| Recombinant DNA reagent | Piwi (plasmid) | This study | Flag-tag | |
| Recombinant DNA reagent | Twf (plasmid) | This study | Myc-tag | |
| Recombinant DNA reagent | Brn (plasmid) | This study | Myc-tag | |
| Commercial assay or kit | anti-FLAG magnetic beads | MBL | Cat# M185-11R | |
| Commercial assay or kit | anti-Myc magnetic beads | Thermo Fisher | Cat# 88842 | |
| Commercial assay or kit | Dynabeads protein A | Thermo Fisher | Cat# 10001D | |
| Commercial assay or kit | Dynabeads protein G | Thermo Fisher | Cat# 10003D | |
| Chemical compound, drug | Hilymax | Dojindo | Cat# 342-91103 | Transfection in S2 |
| Chemical compound, drug | Signal Enhancer HIKARI | Nacalai Tesque | Cat# 02270-81 | Western blotting |
| Chemical compound, drug | Chemi-Lumi One reagent kit | Nacalai Tesque | Cat# 07880-54 | Western blotting |
| Chemical compound, drug | Fluoro-Keeper Antifade Reagent | Nacalai Tesque | Cat# 12593-64 | |
| Software, algorithm | AlphaFold v2.2 | Developed by DeepMind | RRID:SCR_025454 | Installed in SQUID (Osaka University) |
| Software, algorithm | ImageJ | Schneider et al., 2012 |
Additional files
-
Supplementary file 1
The prediction confidence scores (ranking confidences) for the pairwise dimer predictions by AlphaFold2 as shown in Figure 1A.
- https://cdn.elifesciences.org/articles/101967/elife-101967-supp1-v1.xlsx
-
Supplementary file 2
The experimentally determined 3D structure models for the nuage-localizing/piRNA-related proteins.
- https://cdn.elifesciences.org/articles/101967/elife-101967-supp2-v1.xlsx
-
Supplementary file 3
The salt-bridges and H-bonds found in the predicted interface between Spn-E and Squ dimer.
- https://cdn.elifesciences.org/articles/101967/elife-101967-supp3-v1.docx
-
Supplementary file 4
The hydrophobic residues found in the predicted interface between Spn-E and Squ proteins.
- https://cdn.elifesciences.org/articles/101967/elife-101967-supp4-v1.xlsx
-
Supplementary file 5
The AlphaFold2 screening for the interacting pairs of Squ, Tej, Vas against 430 oogenesis-related proteins.
- https://cdn.elifesciences.org/articles/101967/elife-101967-supp5-v1.xlsx
-
Supplementary file 6
The computed binding affinity of the protein–protein complex on the basis of the three-dimensional structure predicted by AlphaFold2.
- https://cdn.elifesciences.org/articles/101967/elife-101967-supp6-v1.xlsx
-
Supplementary file 7
The AlphaFold2 screen for Piwi interacting pairs against 12,427 Drosophila proteins.
- https://cdn.elifesciences.org/articles/101967/elife-101967-supp7-v1.xlsx
-
Supplementary file 8
The list of oligo DNA primers used in this study.
- https://cdn.elifesciences.org/articles/101967/elife-101967-supp8-v1.xlsx
-
MDAR checklist
- https://cdn.elifesciences.org/articles/101967/elife-101967-mdarchecklist1-v1.docx
Download links
A two-part list of links to download the article, or parts of the article, in various formats.
Downloads (link to download the article as PDF)
Open citations (links to open the citations from this article in various online reference manager services)
Cite this article (links to download the citations from this article in formats compatible with various reference manager tools)
In silico screening by AlphaFold2 program revealed the potential binding partners of nuage-localizing proteins and piRNA-related proteins
eLife 13:RP101967.
https://doi.org/10.7554/eLife.101967.3


