Plectin-mediated cytoskeletal crosstalk as a target for inhibition of hepatocellular carcinoma growth and metastasis
- Laboratory of Integrative Biology, Institute of Molecular Genetics of the Czech Academy of Sciences, Czech Republic
- Institute of Molecular Cancer Research, University of Zurich, Switzerland
- Division of Chronic Inflammation and Cancer, German Cancer Research Center, Im Neuenheimer Feld, Germany
- Department of Analytical Chemistry, University of Vienna, Austria
- Institute of Inorganic Chemistry, University of Vienna, Austria
- Joint Metabolome Facility, Medical University of Vienna and University of Vienna, Germany
- Department of Surgery, University Hospital Mannheim, Medical Faculty Mannheim, University of Heidelberg, Germany
- Department of General and Visceral Surgery, Ulm University Hospital, Germany
- Department of Natural Sciences, Faculty of Biomedical Engineering, Czech Technical University in Prague, Czech Republic
- Department of Radiodiagnostic and Interventional Radiology, Institute for Clinical and Experimental Medicine, Czech Republic
- Department of Physics, University of Erlangen-Nuremberg, Germany
- Department of Cell Biology, Faculty of Science, Charles University, BIOCEV, Prumyslova, Czech Republic
- Department of Clinical and Transplant Pathology, Institute for Clinical and Experimental Medicine, Czech Republic
- Department of Pathology, Third Faculty of Medicine, Charles University, Czech Republic
- Department of Biology, North Park University, United States
- Department of Biochemistry and Cell Biology, Max F. Perutz Laboratories, University of Vienna, Austria
Figures
Figure 1 with 1 supplement
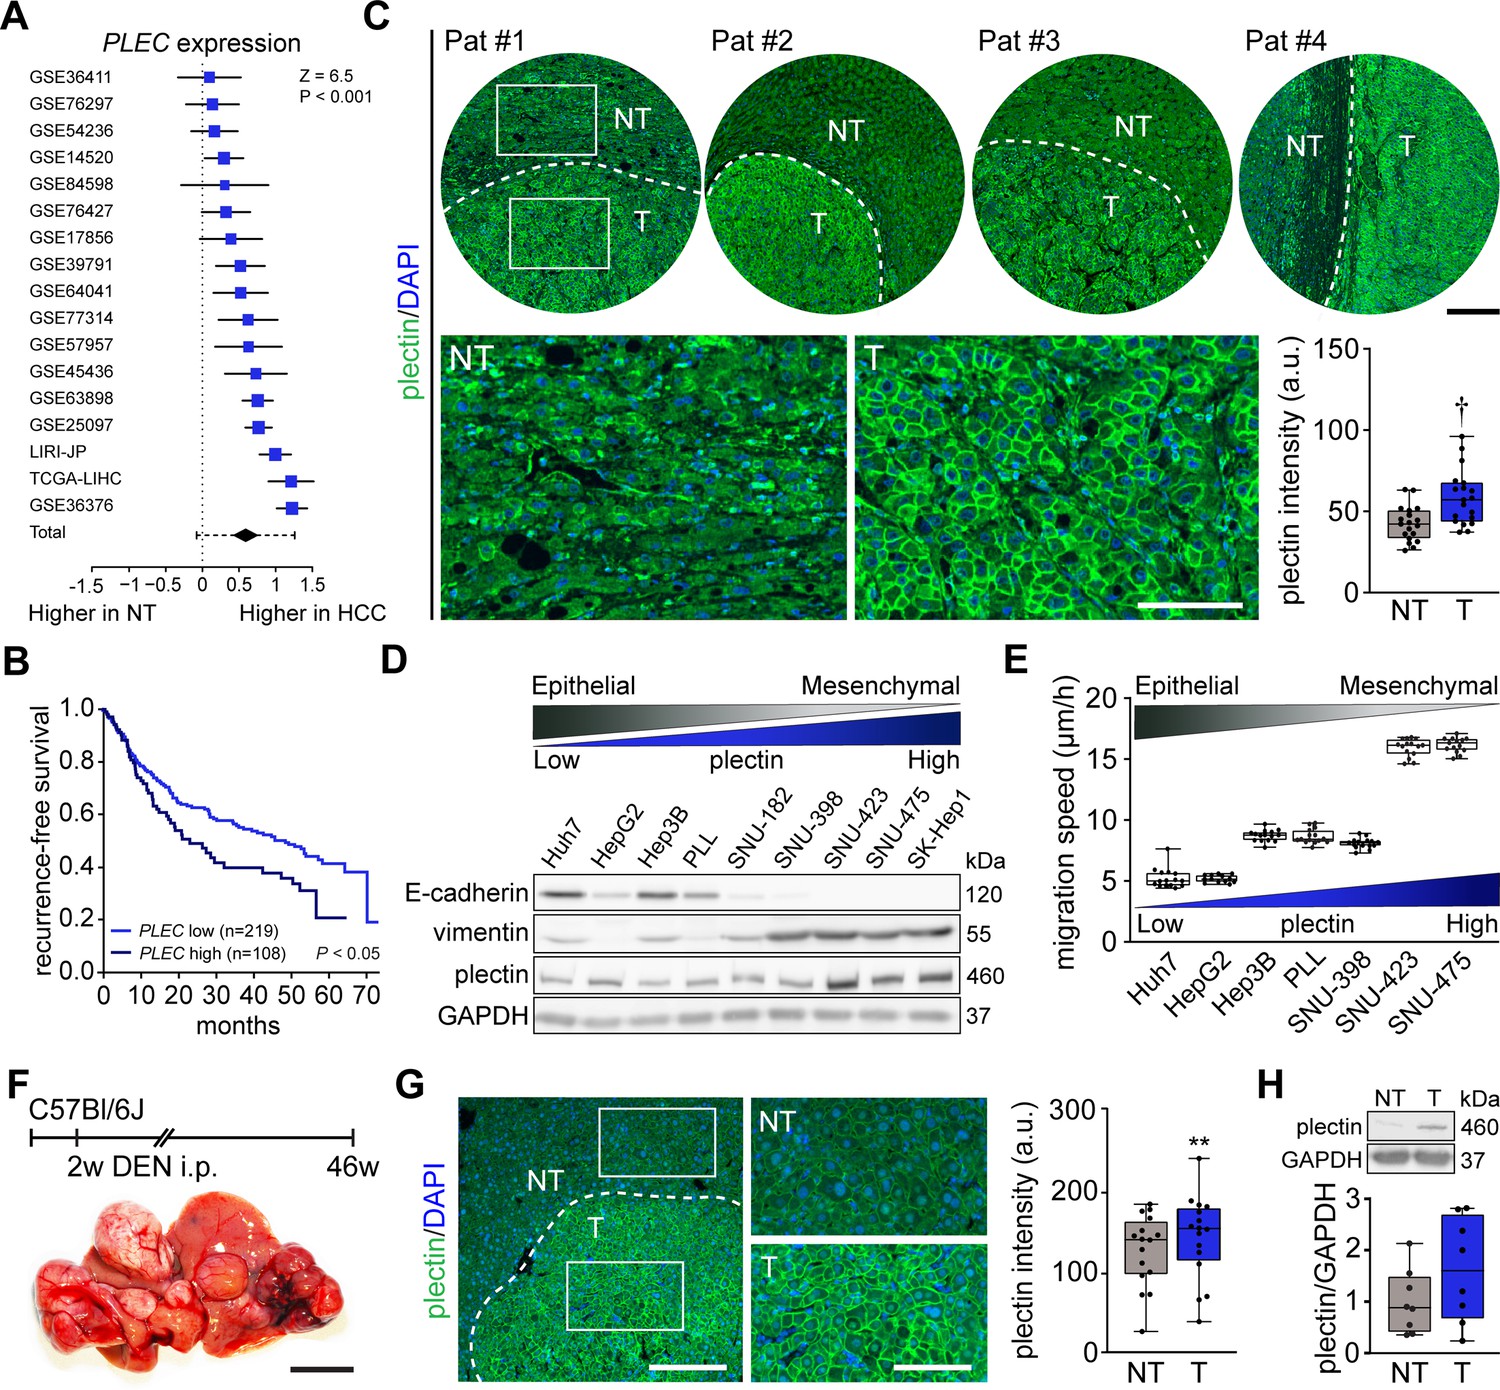
Plectin elevation in tumor hepatocytes is associated with hepatocellular carcinoma (HCC) progression and poor prognosis.
(A) Meta-analysis of differential plectin (PLEC) mRNA expression in non-tumor (NT) liver and hepatocellular carcinoma (HCC) patients. Blue squares indicate the standardized mean difference (SMD) and 95% confidence interval of individual datasets. The black diamond shows the mean and 95% confidence interval for the combined SMD, while the whiskers indicate the 95% prediction interval. (B) Kaplan-Meier curve of recurrence-free survival of HCC patients with low PLEC (lower two tertiles, n=219) and high PLEC (top tertile, n=108) mRNA expression. Log-rank test; p<0.05. (C) Representative images of human HCC tissue sections immunolabeled for plectin (green). Nuclei, DAPI (blue). Dashed line, the borderline between non-tumor (NT) and tumor (T) area. Boxed areas, 4x images. Scale bars, 200 and 100 µm (boxed areas). Boxplot shows quantification of plectin fluorescence intensities in NT and T areas. The box represents the median, 25th, and 75th percentile; whiskers reach the last data point; dots, individual patients; N=19. Paired two-tailed t-test; †p<0.001. (D) Immunoblot analysis of indicated HCC cell lines with antibodies to plectin, E-cadherin, and vimentin. GAPDH, loading control. (E) Quantification of the speed of indicated HCC cell lines migrating in the scratch-wound assay. Boxplots show the median, 25th, and 75th percentile with whiskers reaching the last data point; dots, fields of view; n=15 (Huh7), 13 (HepG2), 15 (Hep3B), 15 (PLL), 15 (SNU-398), 15 (SNU-423), 15 (SNU-475) fields of view; N=3. (F) Hepatocarcinogenesis was induced in 2-wk-old C57Bl/6J mice by intraperitoneal injection of DEN. Representative image of the livers with multifocal HCC at 46 wk post-induction. Scale bar, 1 cm. (G) Representative image of DEN-induced HCC section immunolabeled for plectin (green). Nuclei, DAPI (blue). Dashed line, the borderline between non-tumor (NT) and tumor (T) area. Boxed areas, 2x images. Scale bars, 200 and 100 µm (boxed areas). Quantification of plectin fluorescence intensities in NT and T areas. Boxplot shows the median, 25th, and 75th percentile with whiskers reaching the last data point; dots, fields of view; n=16 fields of view; N=4. Paired two-tailed t-test; **p<0.01. (H) Immunoblot analysis of NT and T liver lysates. The boxplot shows relative plectin band intensities normalized to GAPDH. The box represents the median, 25th, and 75th percentile; whiskers reach the last data point; dots, individual mice; N=8.
-
Figure 1—source data 1
PDF file containing original western blots for Figure 1D, indicating the relevant bands.
- https://cdn.elifesciences.org/articles/102205/elife-102205-fig1-data1-v1.pdf
-
Figure 1—source data 2
Original files for western blot analysis displayed in Figure 1D.
- https://cdn.elifesciences.org/articles/102205/elife-102205-fig1-data2-v1.zip
-
Figure 1—source data 3
PDF file containing original western blots for Figure 1H, indicating the relevant bands.
- https://cdn.elifesciences.org/articles/102205/elife-102205-fig1-data3-v1.pdf
-
Figure 1—source data 4
Original files for western blot analysis displayed in Figure 1H.
- https://cdn.elifesciences.org/articles/102205/elife-102205-fig1-data4-v1.zip
Figure 1—figure supplement 1
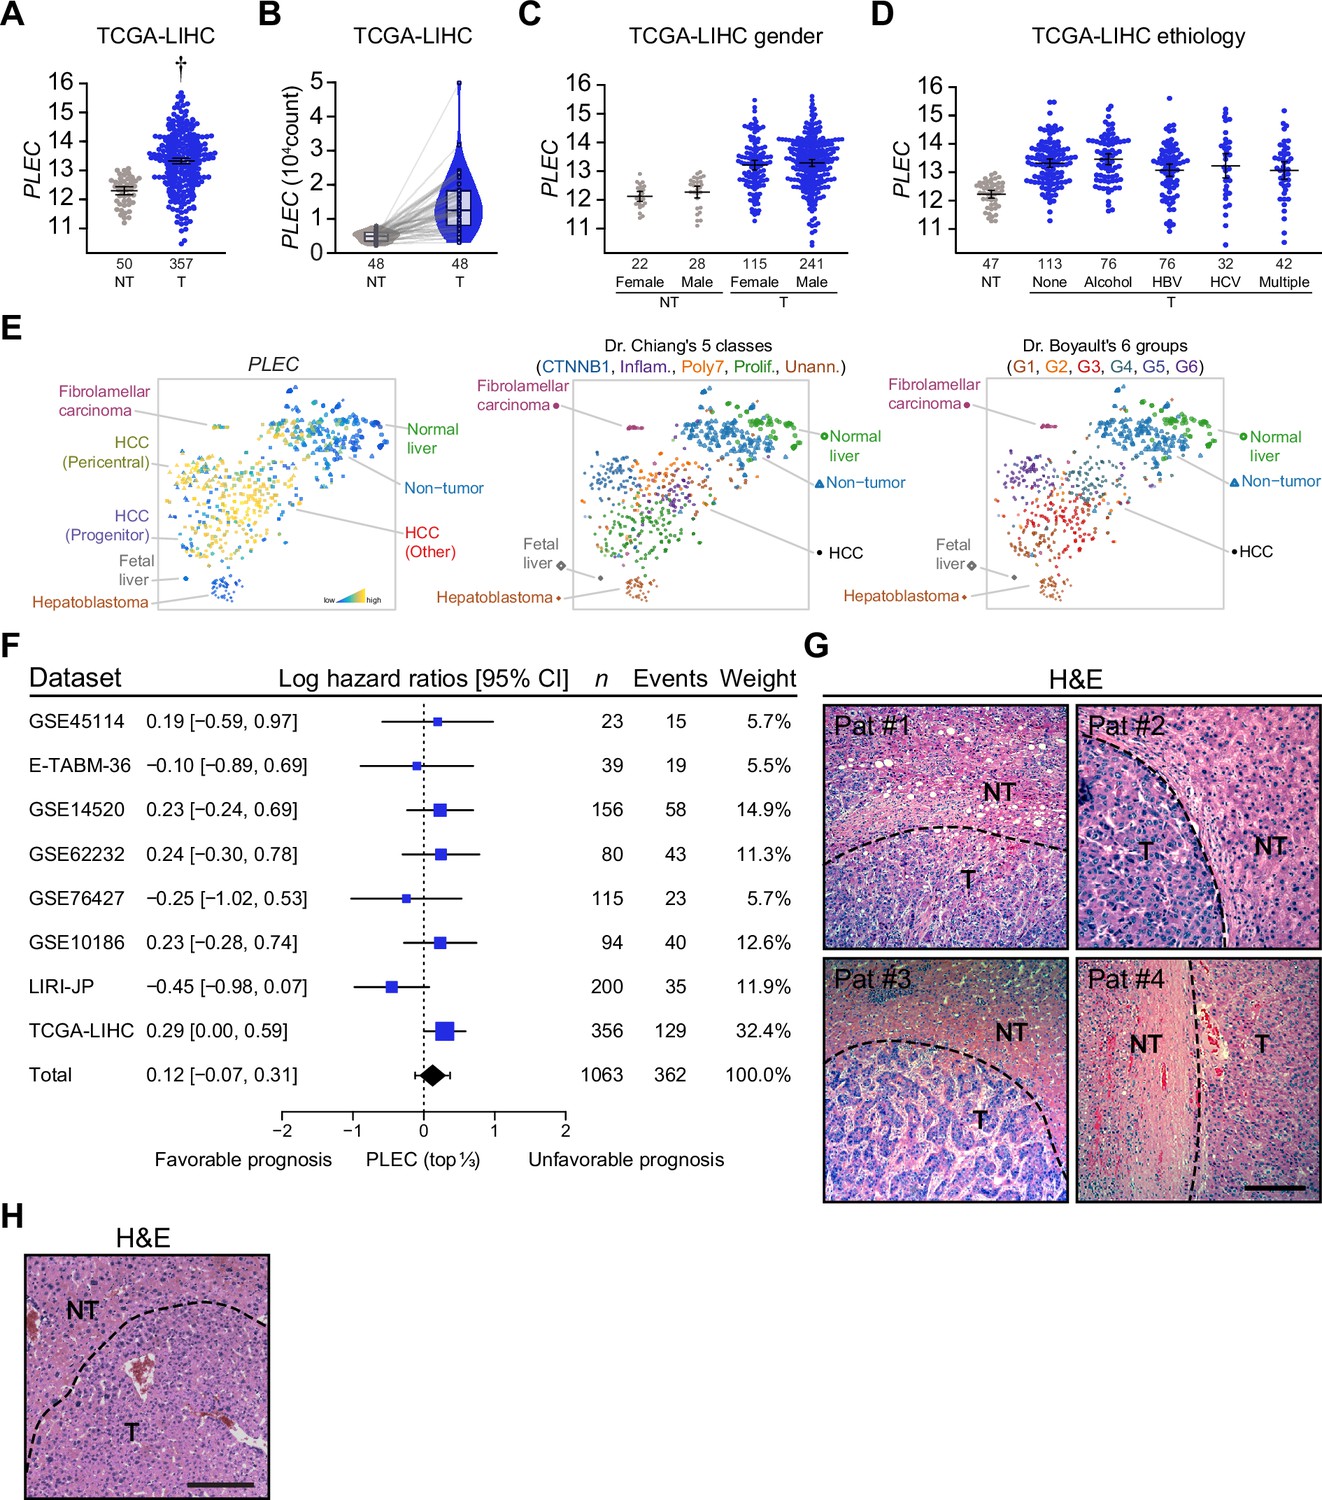
Plectin is elevatted in hepatocellular carcinoma (HCC) across genders and etiologies.
(A–D) TCGA-based analysis of plectin (PLEC) mRNA expression in non-tumor (NT) and tumor (T) tissue of liver hepatocellular carcinoma (LIHC). Graphs show differential plectin expression in the whole cohort (A), pair-matched samples (B), and samples sorted by gender (C) and etiology (D). The numbers of included participants per cohort are indicated in the graph. (E) t-SNE plots (left graph) show plectin (PLEC) mRNA expression in subgroups of HCC patients. Points, individual patient tissue samples. As a reference, t-SNE plots of Dr. Chiang’s (middle graph) and Dr. Boyault’s (right graph) classification are shown. The HCC classes were predicted using the Nearest Template Prediction method. (F) Meta-analysis of the predictive value of plectin expression across different HCC datasets. Blue squares indicate the log hazard ratios and 95% confidence interval from a Cox proportional hazards model. The black diamond represents the mean and 95% confidence interval for the overall log hazard ratio, while the whiskers indicate the 95% prediction interval. (G) Representative images of H&E-stained human HCC tissue sections corresponding to immunofluorescence images are shown in Figure 1C. NT, non-tumor area; T, tumor area. Scale bar, 200 µm. (H) Representative image of H&E-stained section of DEN-induced HCC corresponding to immunofluorescence images shown in Figure 1G. NT, non-tumor area; T, tumor area. Scale bar, 200 µm.
Figure 2 with 1 supplement
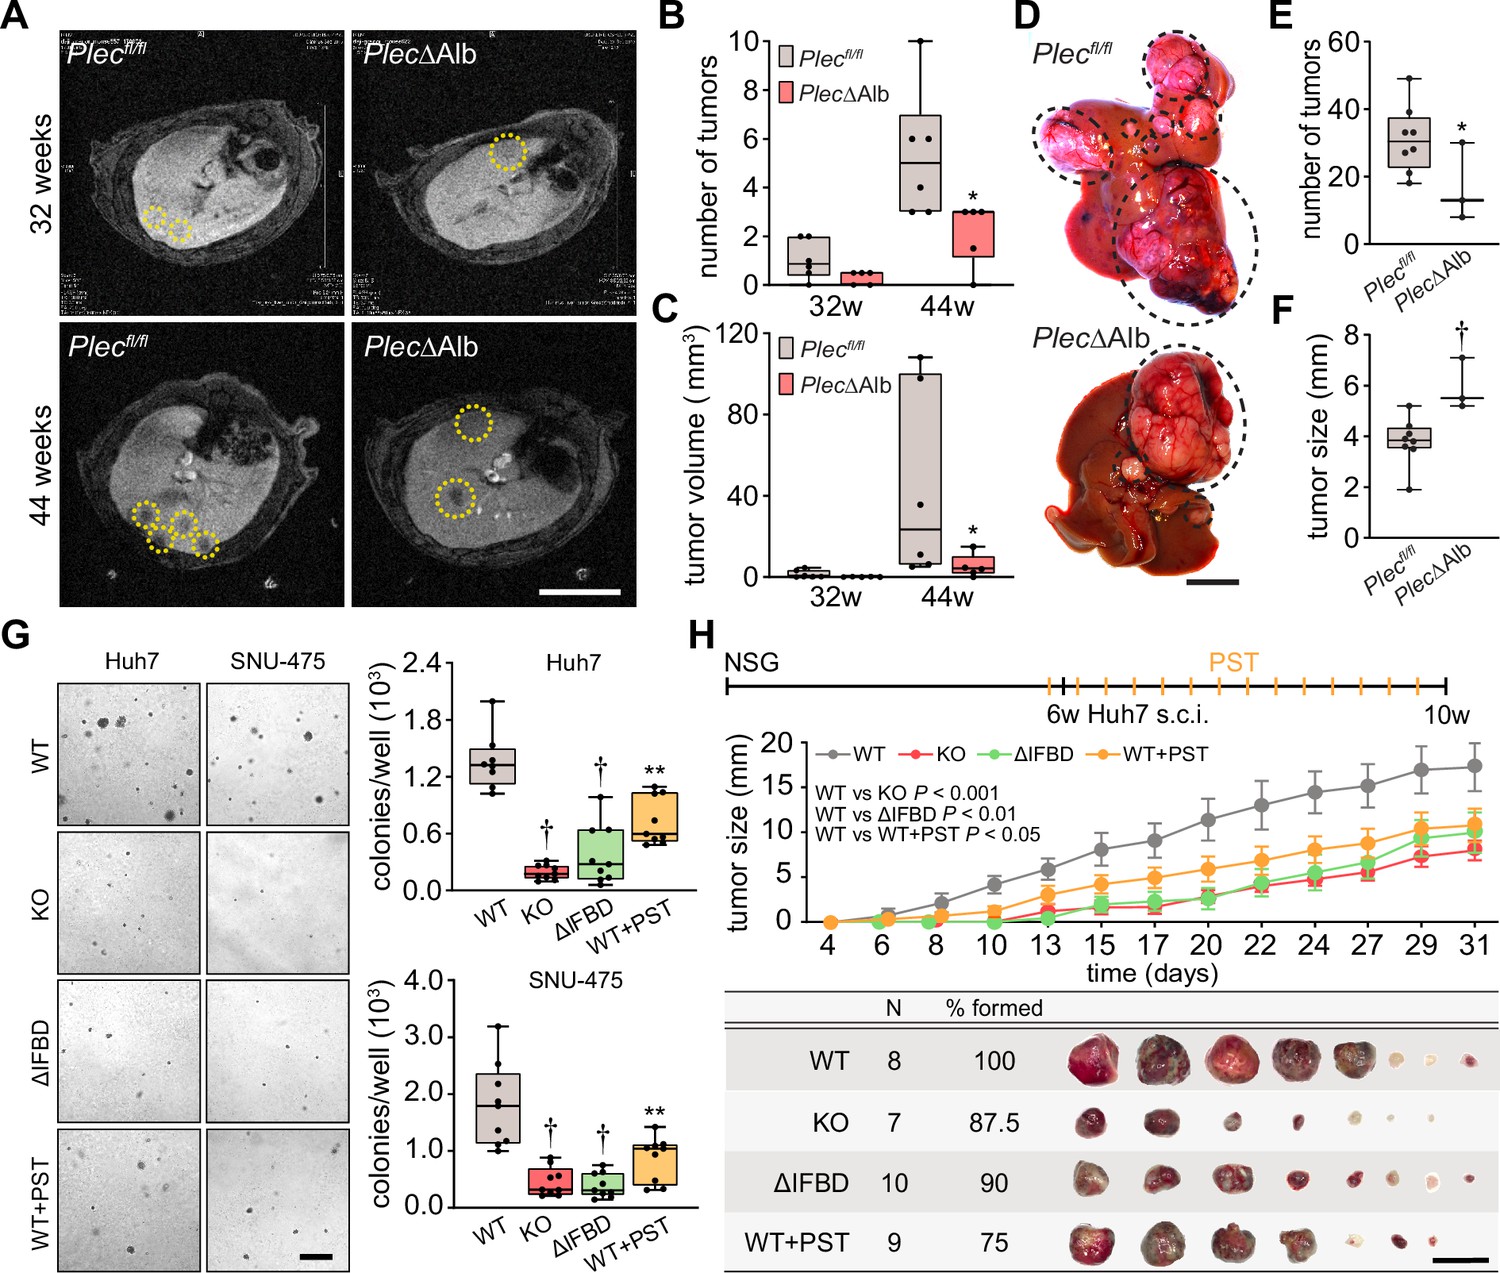
Plectin promotes hepatocellular carcinoma (HCC) growth.
(A) Representative MRI images of Plecfl/fl and PlecΔAlb livers at 32 and 44 weeks post-diethylnitrosamine (DEN) injection. Dashed circles, tumors. Scale bar, 500 µm. (B, C) Quantification of tumor number (B) and volume (C) in Plecfl/fl and PlecΔAlb livers shown in (A). Boxplot shows the median, 25th, and 75th percentile with whiskers reaching the last data point; dots, individual mice; N=6 (Plecfl/fl), 5 (PlecΔAlb). Two-tailed t-test; *p<0.05. (D) Representative images of Plecfl/fl and PlecΔAlb livers at 44 wk post-induction. Dashed circles, tumors. Scale bar, 1 cm. (E, F) Quantification of the number (E) and size (F) of Plecfl/fl and PlecΔAlb tumors shown in (D). Boxplot shows the median, 25th, and 75th percentile with whiskers reaching the last data point; dots, individual mice; N=8 (Plecfl/fl), 3 (PlecΔAlb). Two-tailed t-test; *p<0.05; †p<0.001. (G) Representative images of colonies from WT, KO, ΔIFBD, and PST-treated WT (WT+PST) Huh7 and SNU-475 cells grown in soft agar. Scale bar, 500 µm. Boxplots show the number of Huh7 (upper graph) and SNU-475 (lower graph) cell colonies. The box represents the median, 25th, and 75th percentile with whiskers reaching the last data point; dots, agar wells; n=9 agar wells; N=3. Two-tailed t-test; **p<0.01; †p<0.001. (H) Six-week-old NSG mice were subcutaneously injected with indicated Huh7 cells into both hind flanks and were kept either untreated (WT, KO, and ΔIFBD) or bidiurnally treated by orogastric gavage of plecstatin (WT+PST) as indicated in the upper bar. Mice were sacrificed 4 wk post-injection and xenografts were dissected. The graph shows the time course of xenograft growth. Data are shown as mean ± SEM; n=8 (WT), 7 (KO), 10 (ΔIFBD) and 9 (WT+PST) tumors; N=4 (WT), 4 (KO), 5 (ΔIFBD) and 6 (WT+PST). Two-way ANOVA. The table shows the number (N), percentage, and representative images of formed xenografts. Scale bar, 2 cm.
Figure 2—figure supplement 1
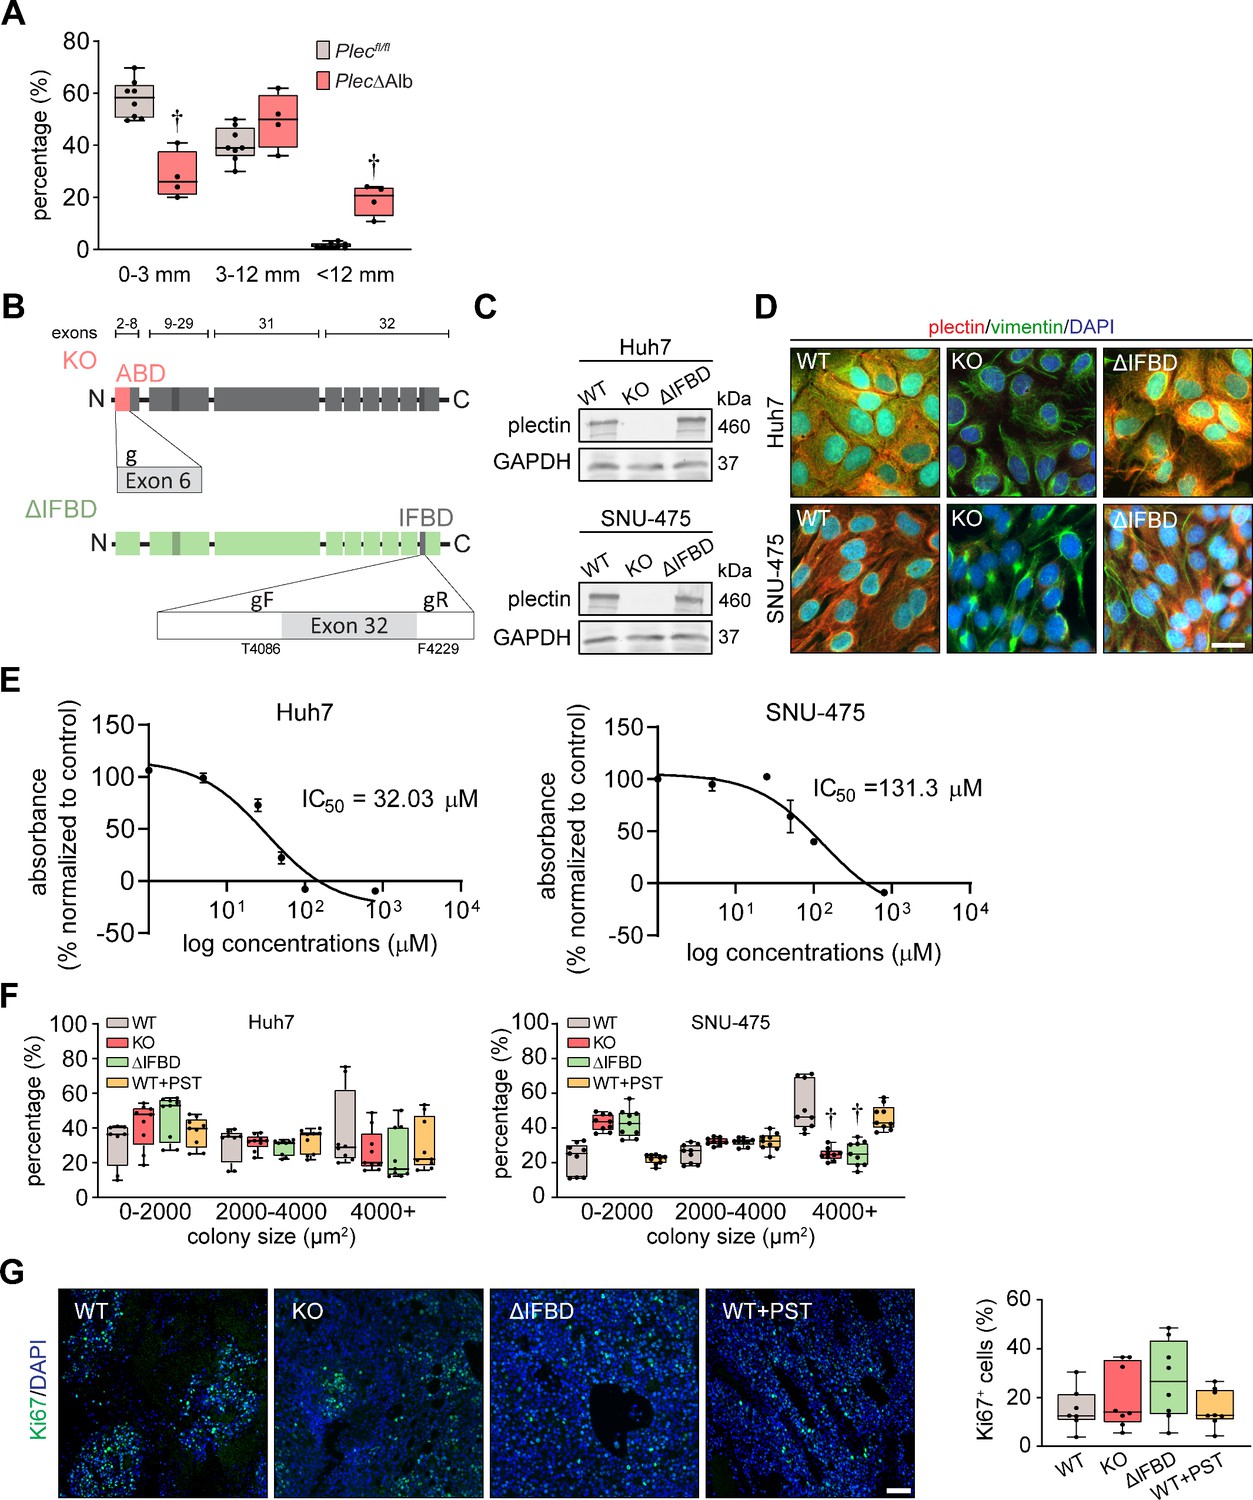
Plectin influences hepatocellular carcinoma (HCC) progression in vivo.
(A) Percentage of diethylnitrosamine (DEN)-induced Plecfl/fl and PlecΔAlb HCCs corresponding to the indicated size intervals. Boxplot shows the median, 25th, and 75th percentile with whiskers reaching the last data point; dots, individual mice; N=8 (Plecfl/fl), 4 (PlecΔAlb). Two-tailed t-test; †p<0.001. (B) Schematic of CRISPR/Cas9-based strategy for the generation of plectin knockout (KO) and ∆IFBD mutant HCC lines. To generate plectin KO, exon 6 of plectin was targeted by the single guide RNA (g) as previously described (Prechova et al., 2022). To generate the plectin ∆IFBD HCC lines, deletion between amino acid T4086-F4229 (Uniprot accession: Q15149-9) was introduced using crRNA array targeting the sequences within the exon 32 flanking the IFBD. Upper bar indicates the exons encoding plectin domains shown below. For details, see the Materials and Methods section. (C) Representative immunoblots for plectin in WT, KO, and ∆IFBD Huh7 and SNU-475 cell lines. GAPDH, loading control. (D) Representative images of WT, KO, and ∆IFBD Huh7 and SNU-475 cells immunolabeled for plectin (red) and vimentin (green). Nuclei, DAPI (blue). Scale bar, 10 μm. (E) IC50 curve of Huh7 and SNU-475 after treatment with plecstatin-1 (PST) for 96 hr. (F) Percentage of colonies grown from WT, KO, ∆IFBD, and PST-treated WT (WT+PST) Huh7 and SNU-475 cells within indicated size intervals. Boxplots show the median, 25th, and 75th percentile with whiskers reaching the last data point; dots, agar wells; n=9 agar wells; N=3. Two-way ANOVA; †p<0.001. (G) Representative images of WT, KO, ∆IFBD, and WT+PST Huh7 xenograft sections immunolabeled for Ki67 (green). Nuclei, DAPI (blue). Scale bar, 150 μm. Quantification (percentage) of Ki67-positive cells in xenografts grown from WT, KO, ∆IFBD, and WT+PST Huh7 cells shown in Figure 2H. Boxplot shows the median, 25th and 75th percentile with whiskers reaching the last data point; dots, individual tumors; N=7 (WT), 8 (KO), 8 (∆IFBD), 8 (WT+PST).
-
Figure 2—figure supplement 1—source data 1
PDF file containing original western blots for Figure 2—figure supplement 1C, indicating the relevant bands.
- https://cdn.elifesciences.org/articles/102205/elife-102205-fig2-figsupp1-data1-v1.pdf
-
Figure 2—figure supplement 1—source data 2
Orignal files for western blot analysis displayed in Figure 2—figure supplement 1C.
- https://cdn.elifesciences.org/articles/102205/elife-102205-fig2-figsupp1-data2-v1.zip
Figure 3 with 1 supplement
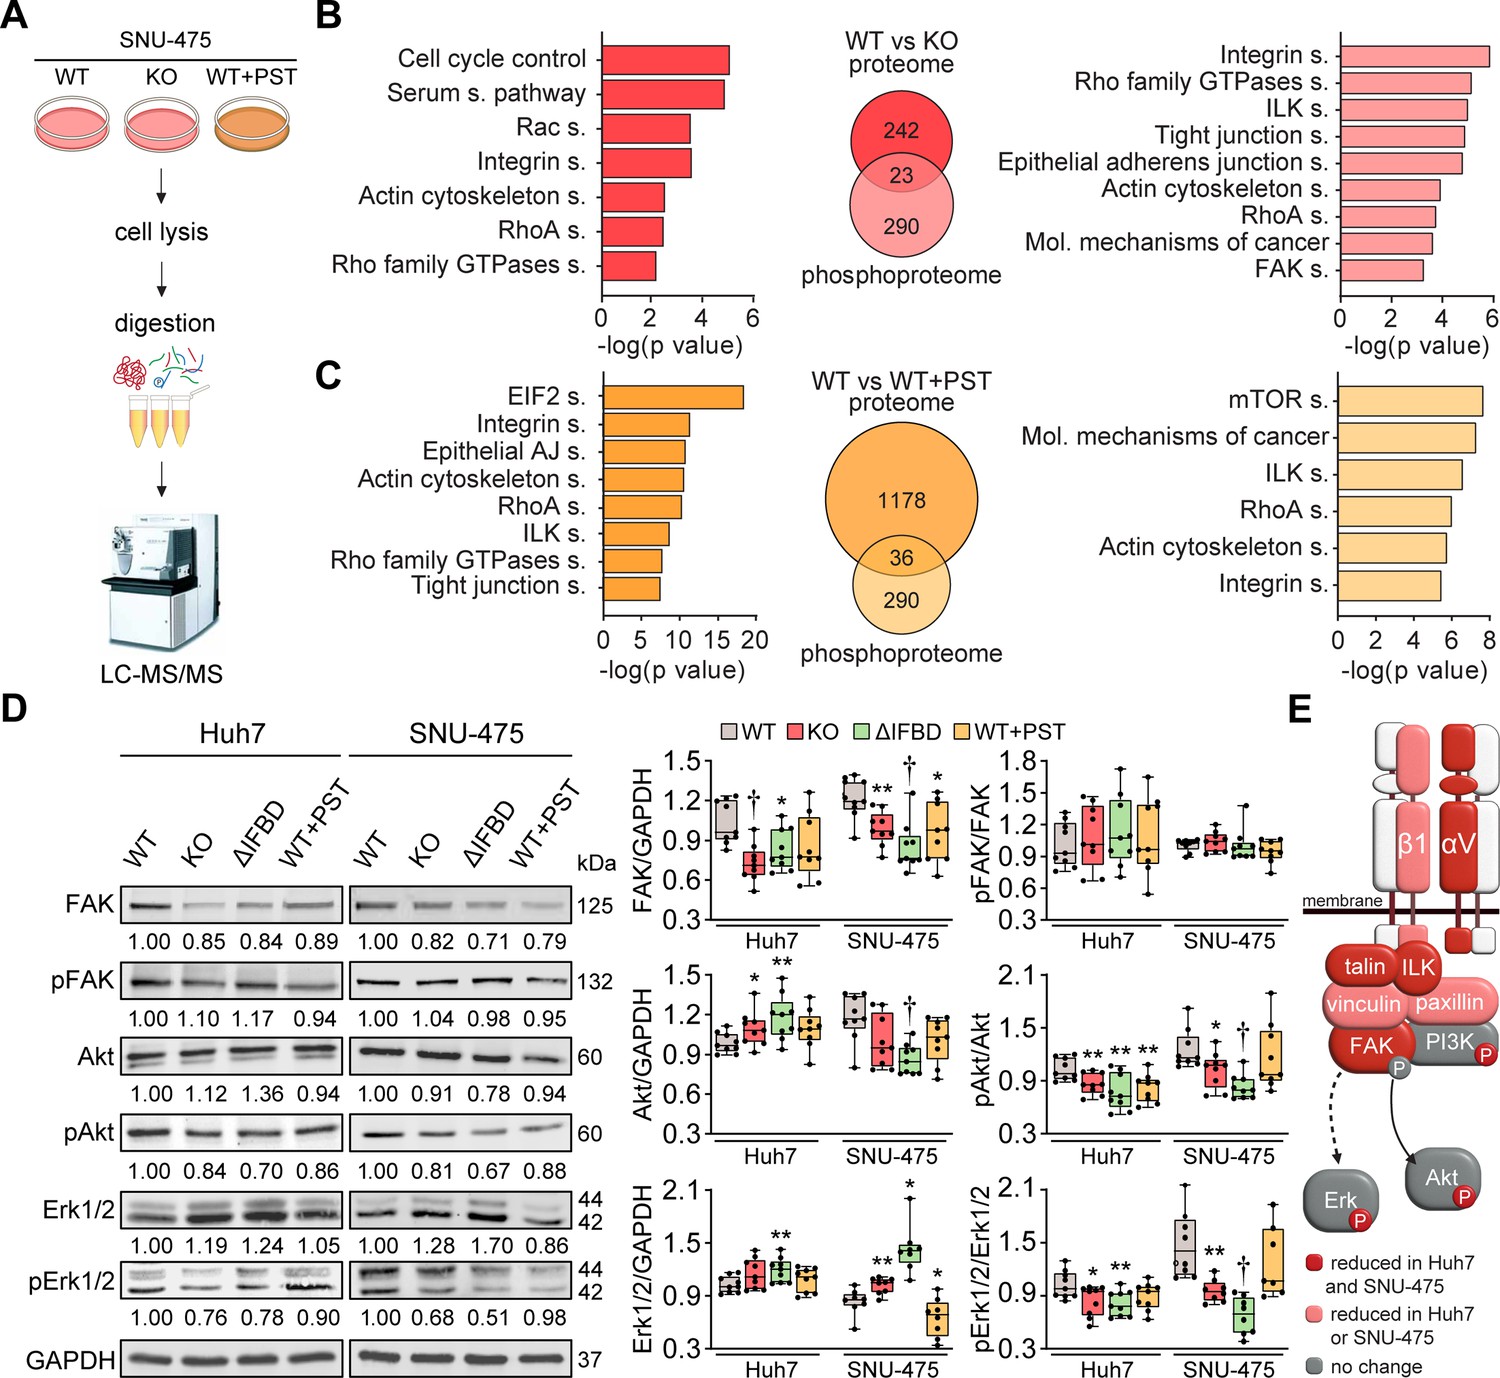
CRISPR/Cas9- or Plecstatin-1 (PST)-mediated plectin inactivation attenuates hepatocellular carcinoma (HCC) oncogenic potential through FAK, Erk1/2, and PI3K/Akt axis.
(A) Schematic of MS-based proteomic analysis of wild-type (WT), knockout (KO), and PST-treated WT (WT+PST) SNU-475 cells. (B, C) Ingenuity Pathway Analysis (IPA) canonical signaling pathways predicted from differentially expressed proteins identified by proteomics (left) and phosphoproteomics (right) in WT vs. KO (B) and WT vs. WT+PST (C) proteomes. Venn diagrams show relative proportions of differentially expressed proteins. Two-sided Student´s t-test with multiple testing correction: FDR < 0.05; s0 = 0.1; triplicates. (D) Quantification of FAK, phospho-Tyr397-FAK (pFAK), Akt, phospho-Ser473-Akt (pAkt), Erk1/2, and phospho-Thr202/Tyr204-Erk (pErk) in indicated Huh7 and SNU-475 cell lines by immunoblotting. GAPDH, loading control. The numbers below lines indicate relative band intensities normalized to average WT values. Boxplots show relative band intensities normalized to GAPDH or non-phosphorylated protein. The box represents the median, 25th, and 75th percentile with whiskers reaching the last data point; dots, individual experiments; N=9. Two-tailed t-test; *p<0.05; **p<0.01; †p<0.001. (E) Schematic representation of immunoblot analyses of adhesome-associated signaling shown in (D) and (Extended Data Figure 3—figure supplement 1C). Proteins with significantly reduced expression levels and/or phosphorylation status (P) upon plectin inactivation in both HCC cell lines are highlighted in red, proteins with significantly reduced expression levels upon plectin inactivation in either Huh7 or SNU-475 cells are highlighted in pink.
-
Figure 3—source data 1
PDF file containing original western blots for Figure 3D, indicating the relevant bands.
- https://cdn.elifesciences.org/articles/102205/elife-102205-fig3-data1-v1.pdf
-
Figure 3—source data 2
Original files for western blot analysis displayed in Figure 3D, Figure 3—figure supplement 1C.
Huh7 replicate 1 and SNU475 replicate 1–9.
- https://cdn.elifesciences.org/articles/102205/elife-102205-fig3-data2-v1.zip
-
Figure 3—source data 3
Original files for western blot analysis displayed in Figure 3D, Figure 3—figure supplement 1C.
Huh7 replicate 2–9.
- https://cdn.elifesciences.org/articles/102205/elife-102205-fig3-data3-v1.zip
Figure 3—figure supplement 1
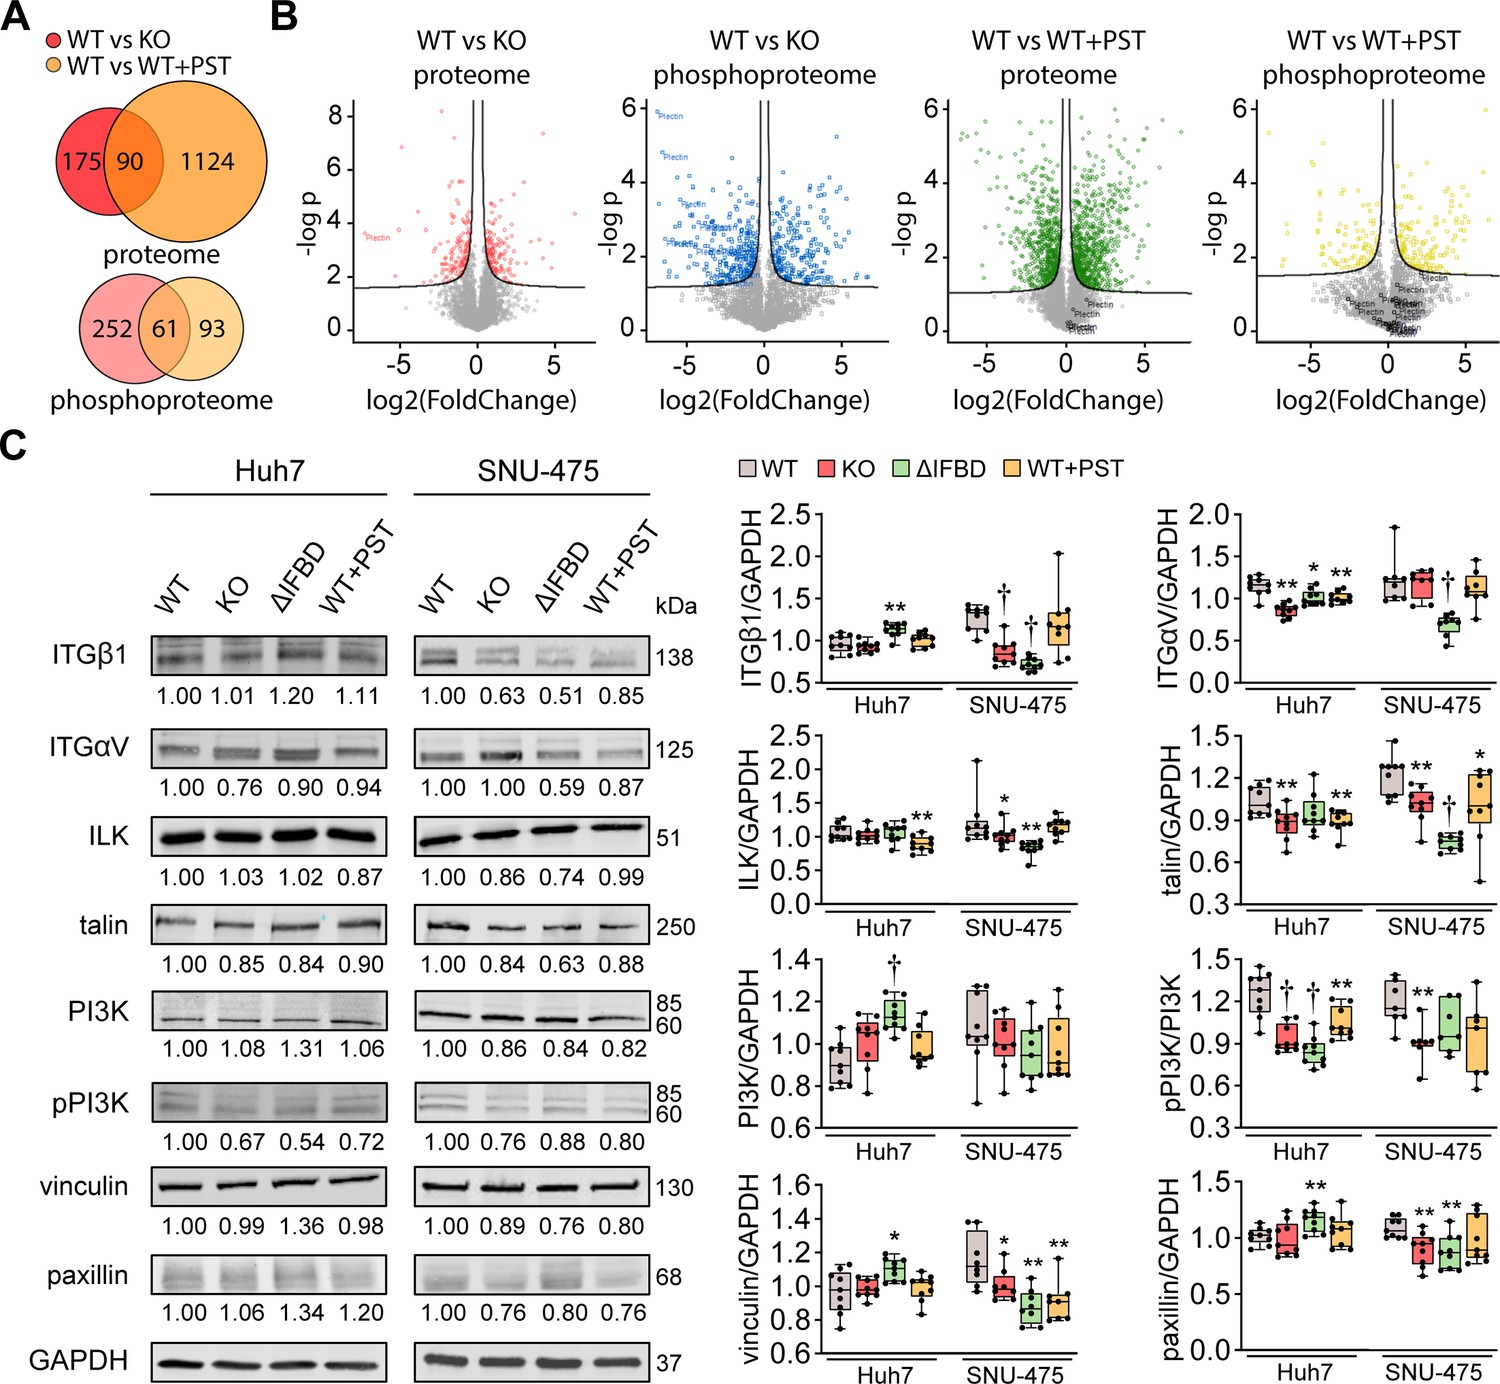
Integrin-associated signaling is altered in SNU-475 cells upon CRISPR/Cas9- or Plecstatin-1 (PST)-mediated plectin inactivation.
(A) Venn diagrams show relative proportions of differentially expressed/phosphorylated proteins identified by proteomic (proteome) and phospho-proteomic (phosphoproteome) analyses of wild-type (WT) vs knockout (KO) and WT vs WT+PST SNU-475 cells shown in Figure 3A–C. (B) Volcano plots show the fold change vs. p-value of differentially expressed/phosphorylated proteins of indicated comparisons of Snu475 cells. (C) Quantification of β1 integrin (ITGβ1), αV integrin (ITGαV), ILK, talin, PI3K, phospho-p85 (Tyr458)/p55(Tyr199)-PI3K (pPI3K), vinculin, and paxillin in indicated Huh7 and SNU-475 cell lines by immunoblotting. GAPDH, loading control. The numbers below lines indicate relative band intensities normalized to average WT values. Boxplots show relative band intensities normalized to GAPDH or non-phosphorylated protein. The box represents the median, 25th, and 75th percentile with whiskers reaching the last data point; dots, individual experiments; N=9. Two-tailed t-test; *p<0.05; **p<0.01; †p<0.001.
-
Figure 3—figure supplement 1—source data 1
PDF file containing original western blots for Figure 3—figure supplement 1C, indicating the relevant bands.
- https://cdn.elifesciences.org/articles/102205/elife-102205-fig3-figsupp1-data1-v1.pdf
Figure 4 with 1 supplement
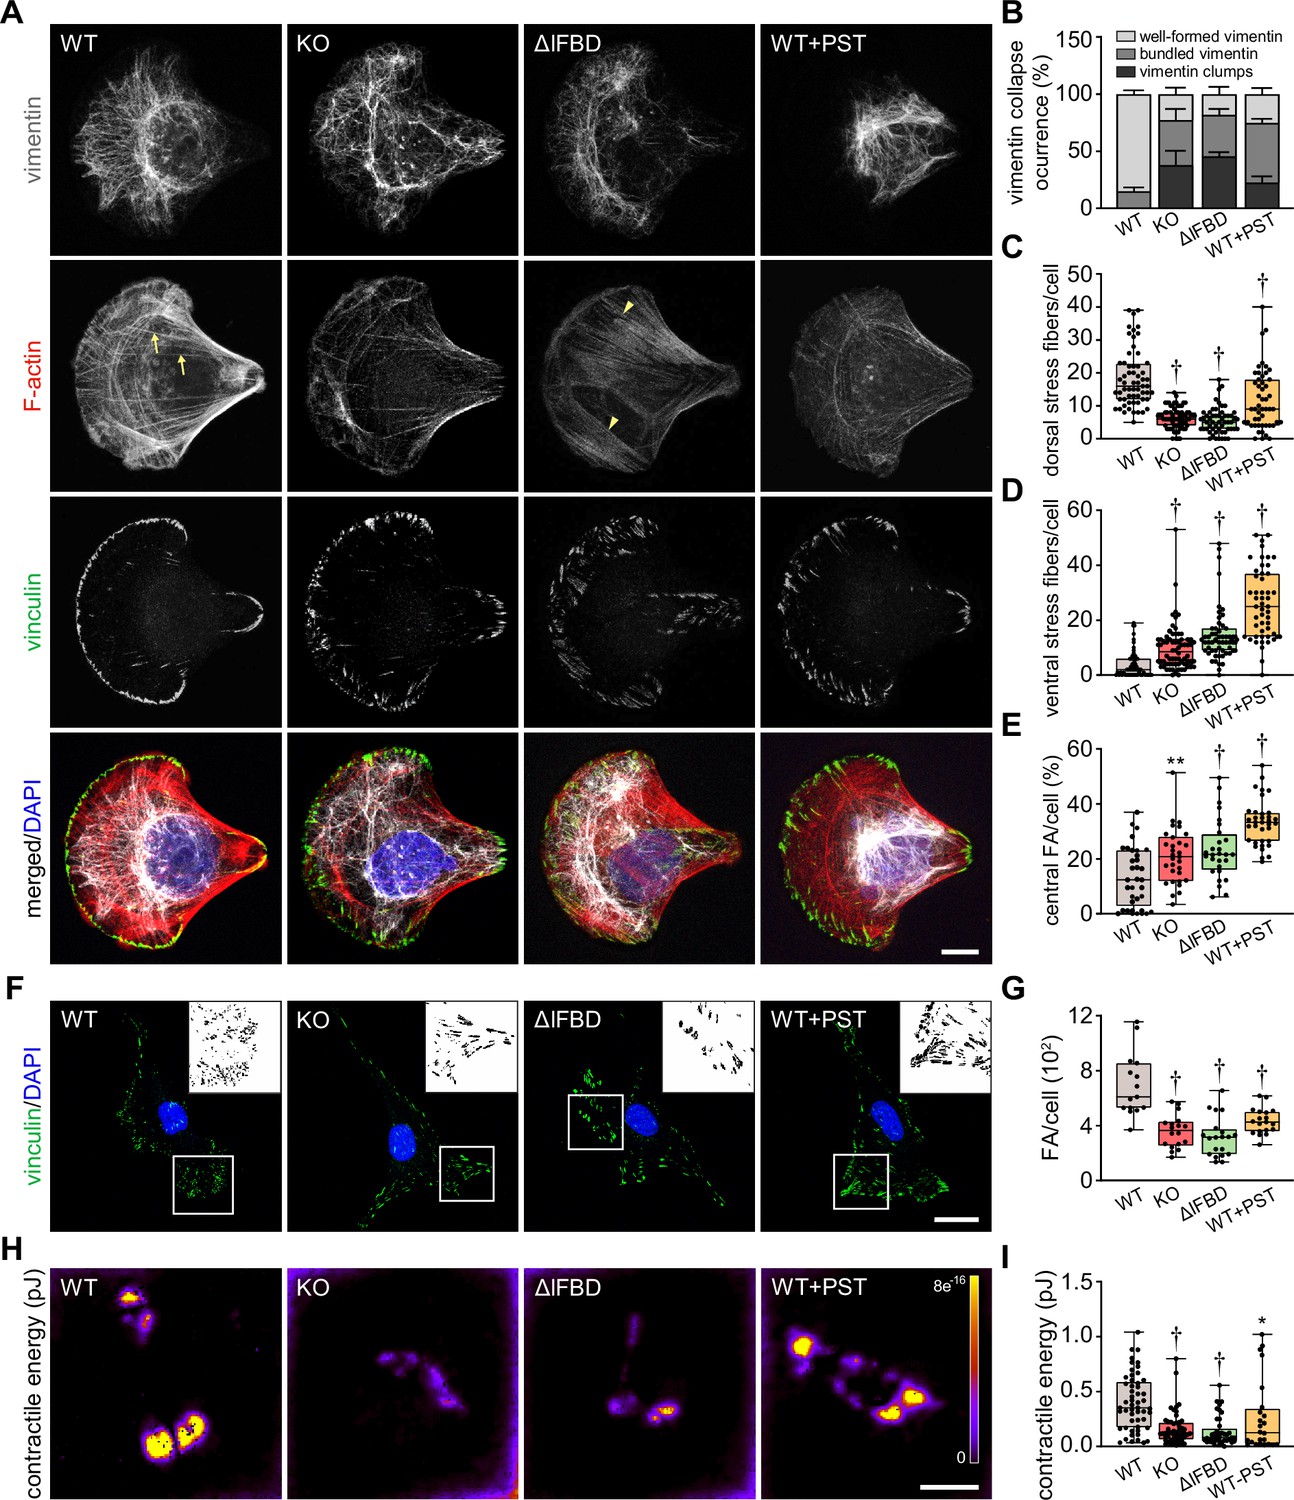
Disruption of cytoskeletal networks upon plectin inactivation accounts for reduced contractility and aberrant adhesions in hepatocellular carcinoma (HCC) cells.
(A) Representative confocal images of crossbow-shaped fibronectin micropattern-seeded wild-type (WT), knockout (KO), ΔIFBD, and Plecstatin-1 (PST)-treated WT (WT+PST) SNU-475 cells stained for F-actin (red), vinculin (green), and vimentin (gray). Nuclei, DAPI (blue). Arrows, dorsal stress fibers; arrowheads, ventral stress fibers. Scale bar, 10 μm. (B) Quantification of the percentage of cells (shown in (A)) with well-formed, bundled, and clump-containing vimentin networks. Data are shown as mean ± SEM; n=60 (WT), 68 (KO), 55 (ΔIFBD), 50 (WT+PST) cells; N=4 (WT, KO, IFBD), 3 (WT+PST). (C, D) Quantification of the number of dorsal (C) and ventral (D) actin stress fibers in cells shown in (A). Boxplots show the median, 25th, and 75th percentile with whiskers reaching the last data point; dots, individual cells; n=60 (WT), 68 (KO), 55 (ΔIFBD), 50 (WT+PST); N=4 (WT, KO, IFBD), 3 (WT+PST). Two-tailed t-test; †p<0.001. (E) Quantification of focal adhesions (FAs) located within the interior of cells (central) shown in (A). Boxplot shows the median, 25th, and 75th percentile with whiskers reaching the last data point; dots, individual cells; n=25 (WT), 26 (KO), 23 (ΔIFBD), 28 (WT+PST); N=3. **p<0.01; †p<0.001. (F) Representative confocal images of WT, KO, ΔIFBD, and PST-treated WT (WT+PST) SNU-475 cells immunolabeled for vinculin (green). Nuclei, DAPI (blue). Boxed areas, and representative FA clusters shown as segmented binary maps in 2x enlarged insets. Scale bar, 30 µm. (G) Quantification of FA number in cells shown in (F). Boxplot shows the median, 25th, and 75th percentile with whiskers reaching the last data point; dots, individual cells; n=15 (WT), 18 (KO), 20 (ΔIFBD), 19 (WT+PST); N=3. Two-tailed t-test; †p<0.001. (H) Pseudocolor spatial maps of contractile energy determined by TFM in WT, KO, ΔIFBD, and PST-treated WT (WT+PST) SNU-475 cells. Scale bar, 50 µm. (I) Quantification of contractile energy in cells shown in (H). Boxplots show the median, 25th, and 75th percentile with whiskers reaching the last data point; dots, individual cells; n=54 (WT), 53 (KO), 41 (ΔIFBD), 24 (WT+PST) cells; N=4. Two-tailed t test; *p<0.05; **p<0.01; †p<0.001.
Figure 4—figure supplement 1
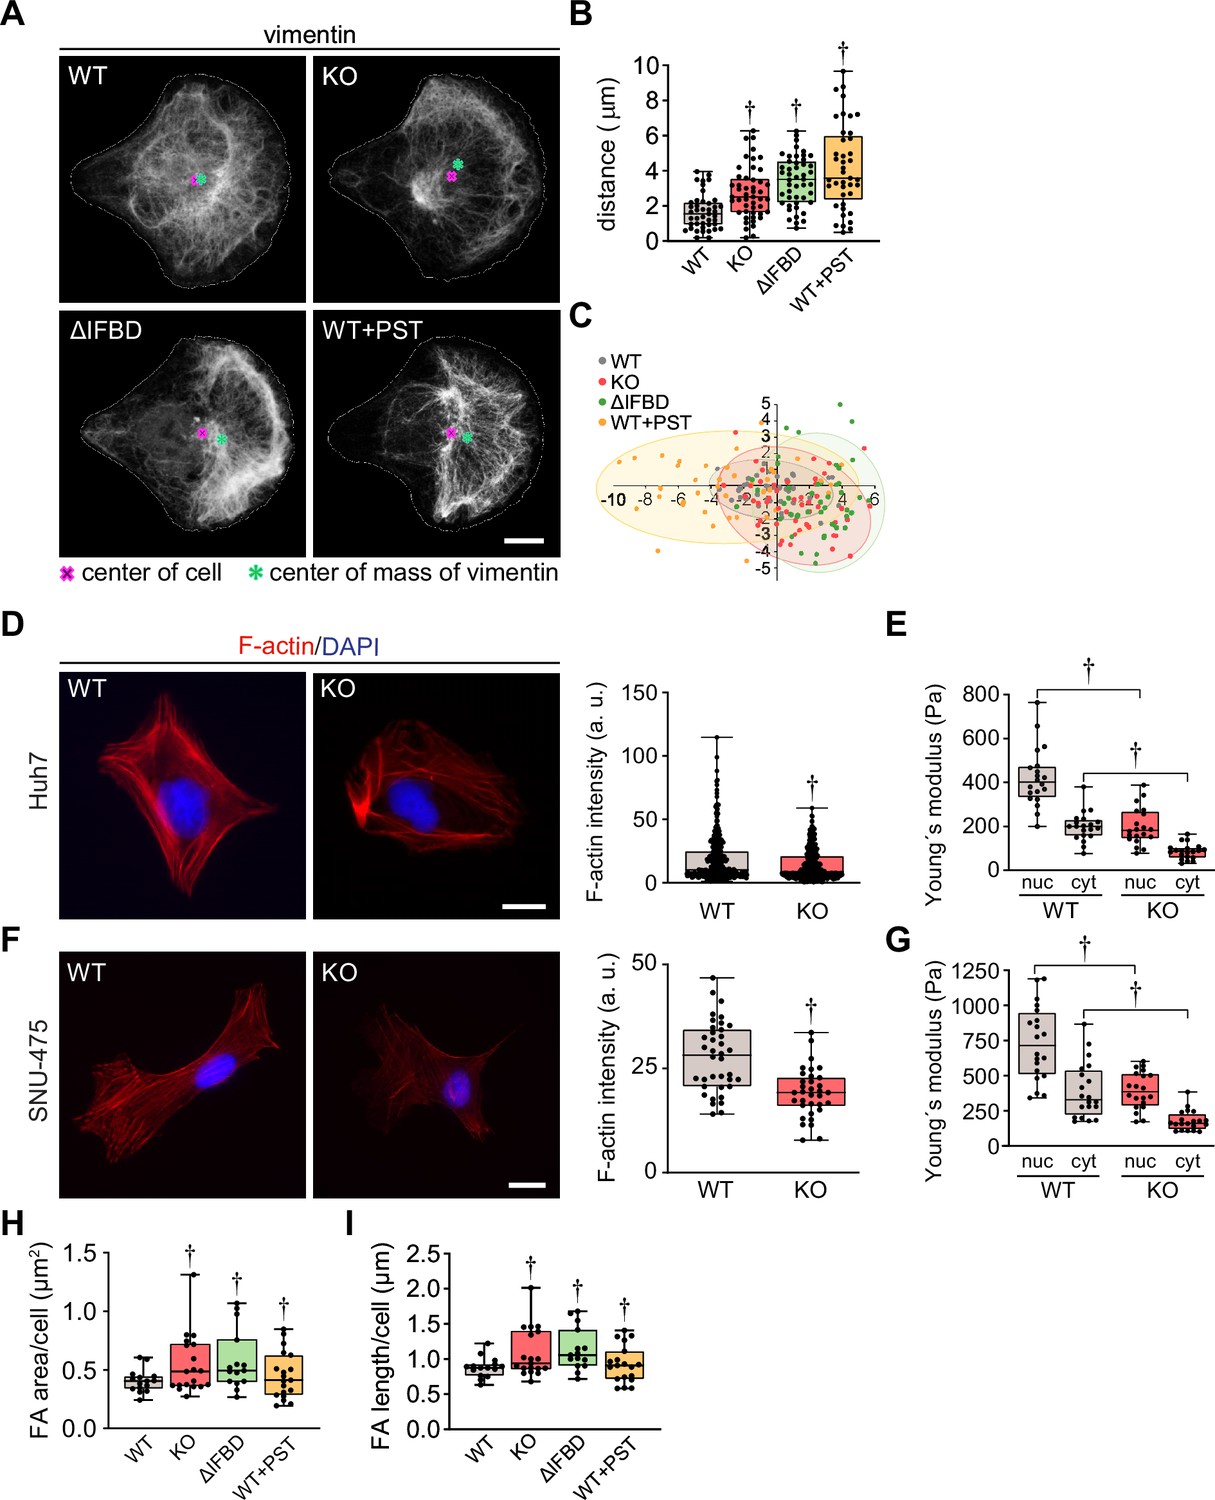
Cytoskeletal networks and cell stiffness are altered upon plectin inactivation.
(A) Representative confocal images of micropattern-seeded wild-type (WT), knockout (KO), ∆IFBD, and Plecstatin-1 (PST)-treated WT (WT+PST) SNU-475 cells immunolabeled for vimentin. Line, cell contour; red cross, center of cell; green asterisk, the center of mass of vimentin fluorescence signal. Scale bar, 10 μm. (B,C) Quantification of vimentin distribution in WT, KO, ∆IFBD, and PST-treated WT (WT+PST) SNU-475 cells shown in (A). Graphs show the distance between the cell center and the center of mass of the vimentin signal (B) and the position of the center of mass of the vimentin signal (C). Boxplot shows the median, 25th and 75th percentile with whiskers reaching the last data point; dots, individual cells; n=43 (WT), 48 (KO), 47 (∆IFBD), 41 (WT+PST) cells; N=3. Two-tailed t-test; †p<0.001. (D, F) Representative images of WT and KO Huh7 (D) and SNU-475 (F) cells immunolabeled for F-actin (red). Nuclei, DAPI (blue). Scale bar, 20 μm. Graphs show the quantification of F-actin fluorescence intensity. Boxplots show the median, 25th, and 75th percentile with whiskers reaching the last data point; dots, individual cells; n (Huh7)=169 (WT), 180 (KO); n (SNU-475)=38 (WT), 34 (KO) cells; N (Huh7)=3; N (SNU-475)=3. Two tailed t-test; †p<0.001. (E, G) Quantification of average Young´s modulus values in nuclear (nuc) and cytosolic (cyt) area of WT and KO Huh7 (E) and SNU-475 (G) cells. Boxplot shows the median, 25th, and 75th percentile with whiskers reaching the last data point; dots, individual cells; n=20 cells; N=3. Two-tailed t-test; †p<0.001. (H,I) Quantification of average focal adhesion (FA) area (H) and FA length (I) per cell for WT, KO, ∆IFBD, and PST-treated WT (WT+PST) SNU-475 cells shown in Figure 4F. Boxplot shows the median, 25th, and 75th percentile with whiskers reaching the last data point; dots, individual cells; n=15 (WT), 18 (KO), 20 (ΔIFBD), 19 (WT+PST) cells; N=3. Two-tailed t-test; †p<0.001.
Figure 5 with 1 supplement
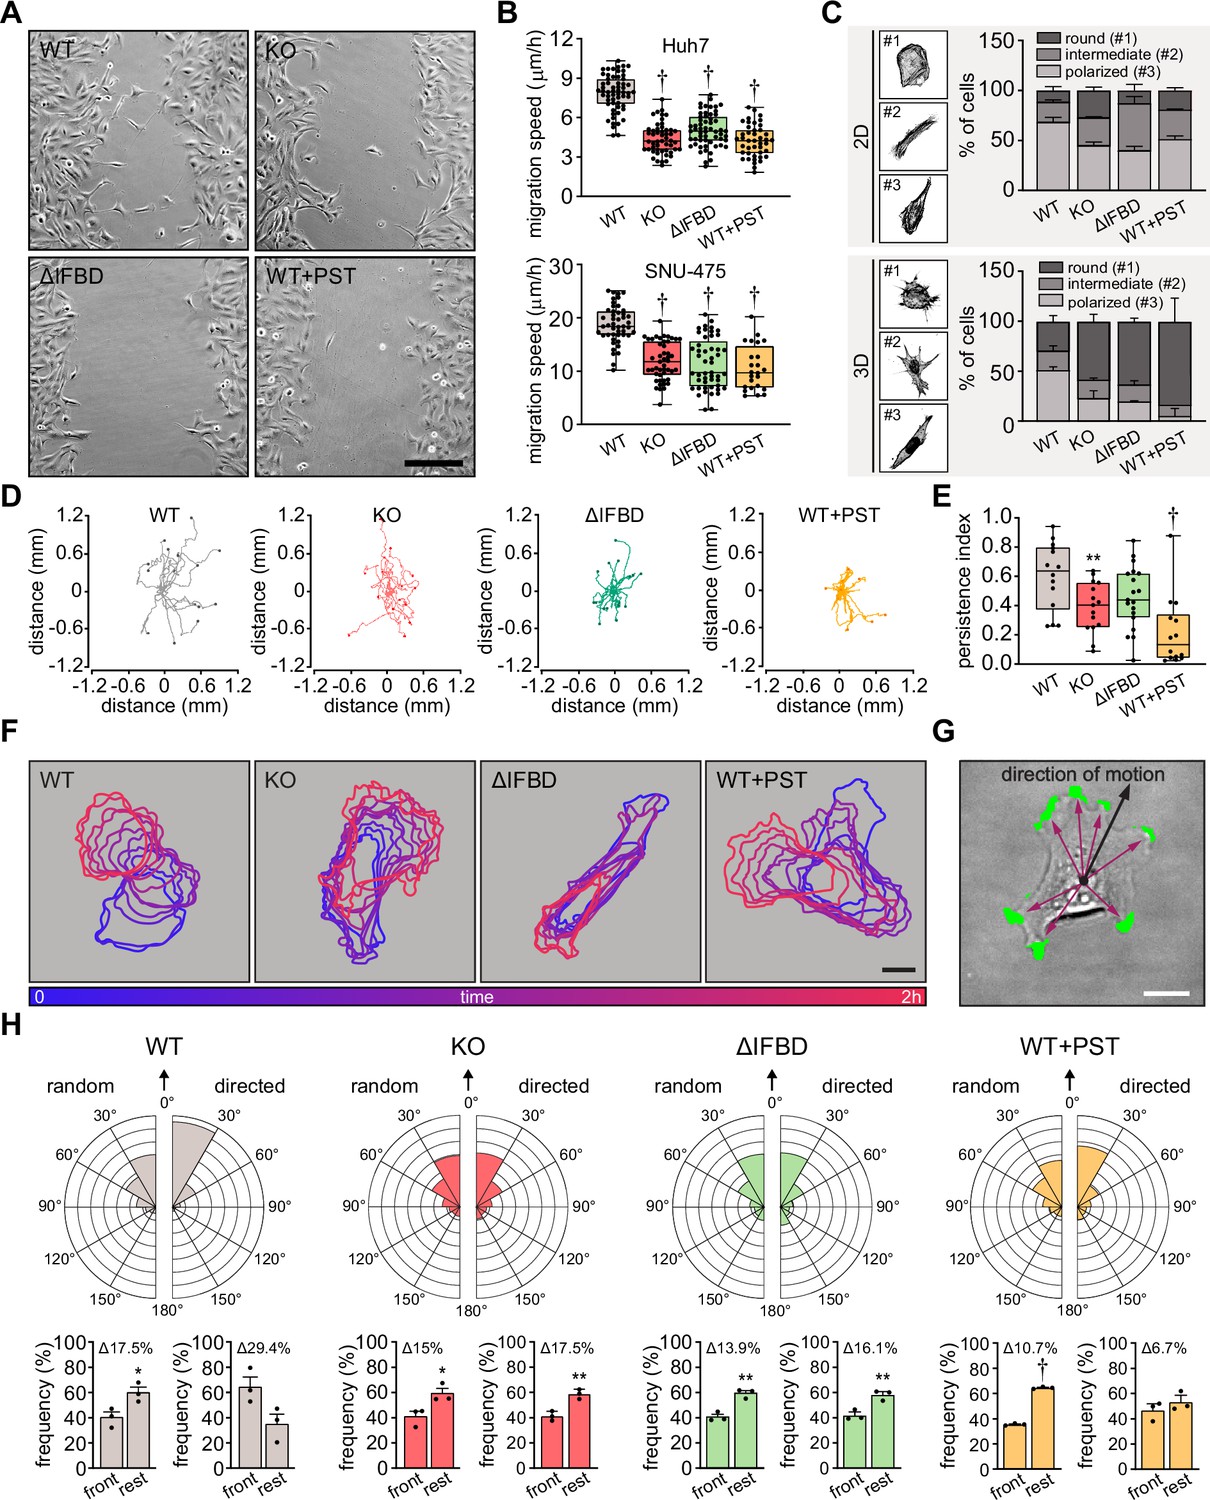
Plectin links the migration potential of hepatocellular carcinoma (HCC) cells to cell shape dynamics.
(A) Representative phase contrast images of wild-type (WT), knockout (KO), ΔIFBD, and PST-treated WT (WT+PST) SNU-475 cells migrating in the scratch-wound assay for 14 hr. Note individual, highly polarized WT cells frequently migrate into scratch areas. Scale bar, 200 µm. (B) Quantification of migration speed of indicated Huh7 (upper graph) and SNU-475 (lower graph) cells. Boxplots show the median, 25th, and 75th percentile with whiskers reaching the last data point; dots, fields of view; n (Huh7)=59 (WT), 51 (KO), 58 (ΔIFBD), 43 (WT+PST); n (SNU-475)=47 (WT), 47 (KO), 50 (ΔIFBD), 24 (WT+PST); N (Huh7)=3; N (SNU-475)=5 (WT, KO, ΔIFBD), 3 (WT+PST). Two-tailed t-test; † p<0.001. (C) Representative confocal images of F-actin stained WT, KO, ΔIFBD, and PST-treated WT (WT+PST) SNU-475 cells grown on fibronectin-coated coverslips (2D) or in collagen (3D) and classified as round (#1), intermediate (#2), and polarized (#3) shape. Quantification of the percentage of cell shape categories in indicated 2D and 3D SNU-475 cell cultures. Data are shown as mean ± SEM; N (2D)=3; N (3D)=5 (WT), 3 (KO, ΔIFBD), 2 (WT+PST). (D) Spider plots with migration trajectories of WT, KO, ΔIFBD, and PST-treated WT (WT+PST) SNU-475 cells tracked during 16 hr of EGF-guided migration; dots, the final position of each single tracked cell. (E) Quantification of processivity indices of WT, KO, ΔIFBD, and PST-treated WT (WT+PST) SNU-475 cells shown in (D). Boxplot shows the median, 25th, and 75th percentile with whiskers reaching the last data point; dots, individual cells; n=15 (WT), 15 (KO), 19 (ΔIFBD), 14 (WT+PST); N=3. Two-tailed t-test; **p<0.01;† p<0.001. (F) Representative time sequences of the WT, KO, ΔIFBD, and Plecstatin-1 (PST)-treated WT (WT+PST) SNU-475 cell contours during EGF-guided migration. Color coding indicates the time of cell position acquired in 10 min intervals. Scale bar, 20 µm. (G) Representative phase contrast image of SNU-475 cell with protrusions (green) segmented from superimposed contours used in morphodynamic analysis. Extension vectors (purple arrows) were drawn from the center of the cell nucleus towards individual protrusions and related to the direction of cell motion (black arrow). Scale bar, 20 µm. (H) Rose graphs show the percentage of extension vector directions in 30° cones, normalized to the directions of random and EGF-guided (directed) motions (0°; arrows) of WT, KO, ΔIFBD, and PST-treated WT (WT+PST) SNU-475 cells. n=9752 extensions in 22 cells (WT random), 4167 extensions in 15 cells (WT directed), 8394 extensions in 19 cells (KO random), 5107 extensions in 15 cells (KO directed), 8362 extensions in 21 cells (ΔIFBD random), 5809 extensions in 19 cells (ΔIFBD directed), 9450 extensions in 20 cells (WT+PST random), 4350 extensions in 14 cells (WT+PST directed); N=3. Bar graphs show the percentage of cell extensions formed either in the direction of motion (frontal, 30° to –30° cones) or along the rest of the cell perimeter (rest). Data are shown as mean ± SEM; dots, biological replicates; N=3. Two-tailed t-test; *p<0.05; **p<0.01;† p<0.001.
Figure 5—figure supplement 1
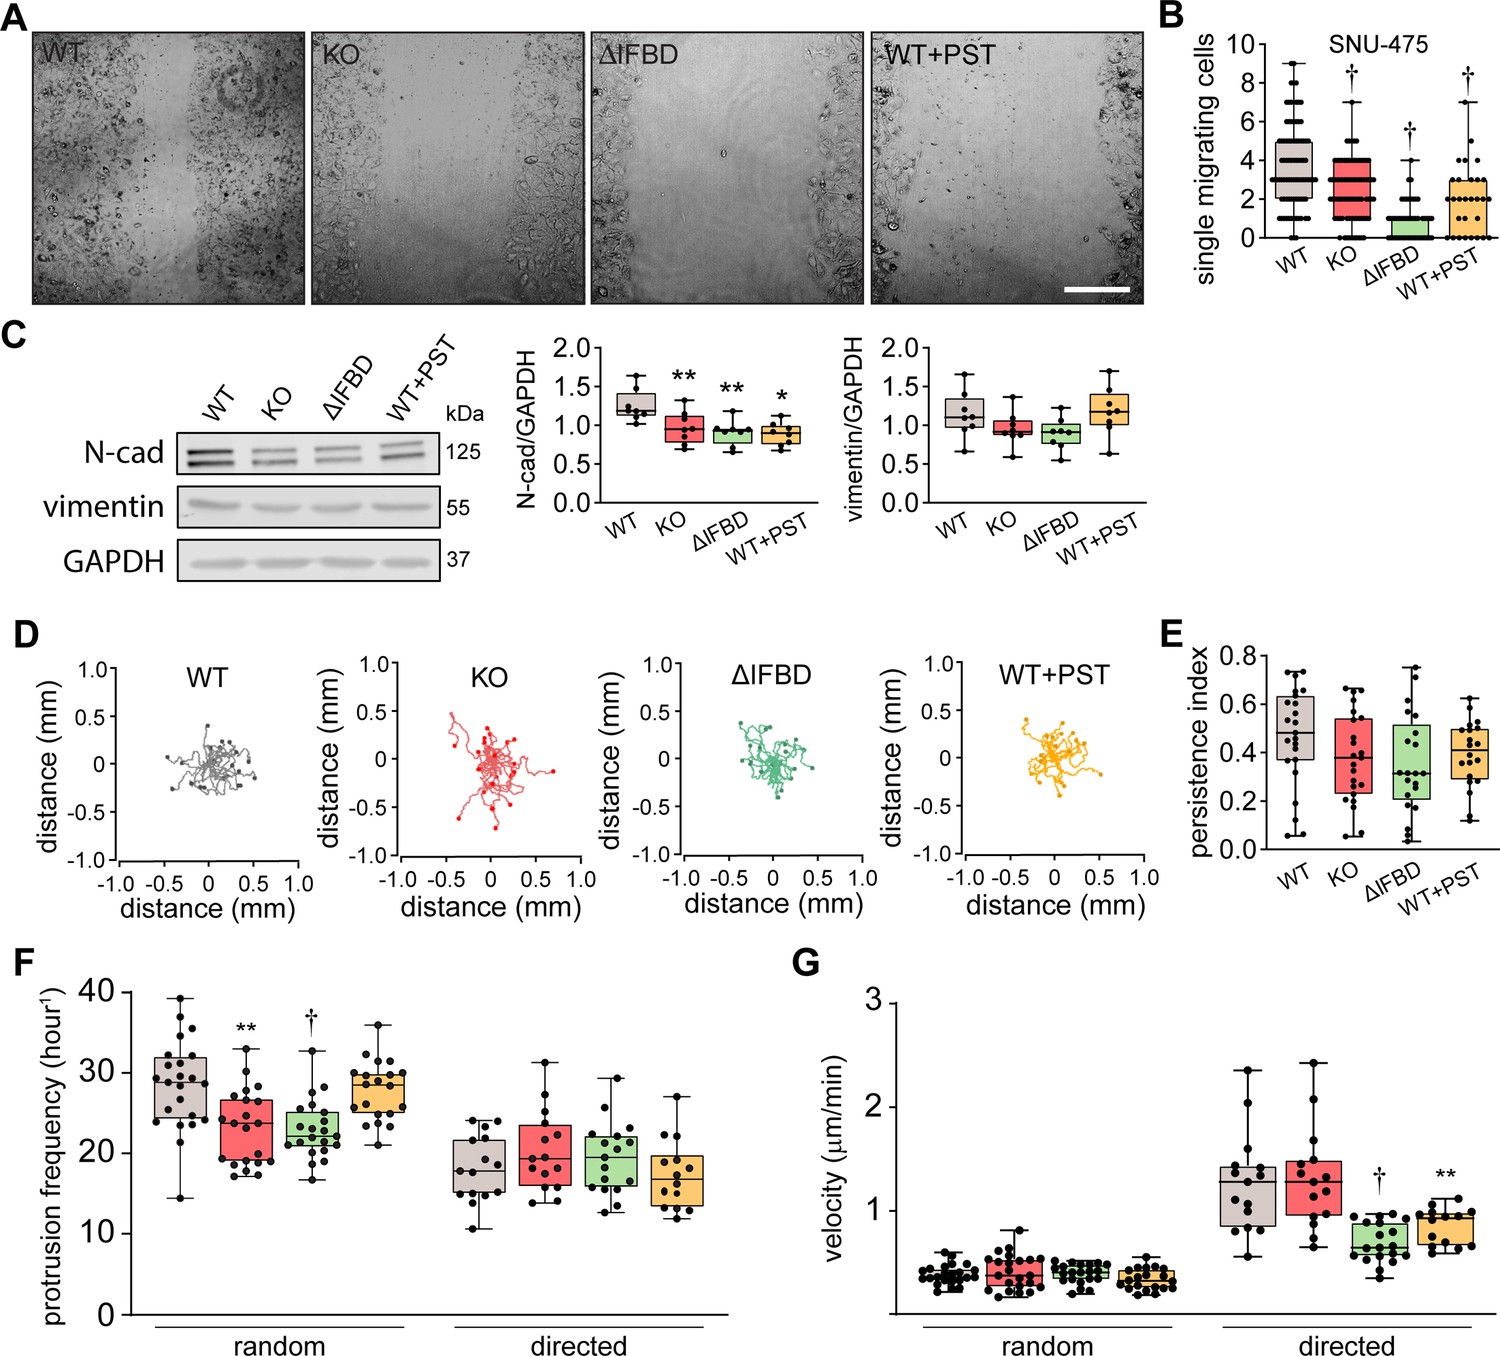
Plectin inactivation impairs the migration of hepatocellular carcinoma (HCC) cells.
(A) Representative phase contrast images of wild-type (WT), knockout (KO), ΔIFBD, and Plecstatin-1 (PST)-treated WT (WT+PST) Huh7 cells migrating in the scratch-wound assay for 24 hr corresponding to the graph shown in Figure 5B. Scale bar, 200 µm. (B) Quantification of the number of WT, KO, ∆IFBD, and PST-treated WT (WT+PST) leader SNU-475 cells migrating individually into the scratch wounds shown Figure 5A. Boxplot shows the median, 25th, and 75th percentile with whiskers reaching the last data point; dots, fields of view; n=47 (WT), 47 (KO), 50 (ΔIFBD), 24 (WT+PST) fields of view; N=5 (WT, KO, ΔIFBD), 3 (WT+PST). Two tailed t-test; †p<0.001. (C) Quantification of N-cadherin (N-cad) and vimentin in indicated SNU-475 cell lines by immunoblotting. GAPDH, loading control. Boxplots show relative band intensities normalized to GAPDH. The box represents the median, 25th, and 75th percentile with whiskers reaching the last data point; dots, individual experiments; N=8. Two-tailed t-test; *p<0.05, **p<0.01. (D) Spider plots with migration trajectories of WT, KO, ΔIFBD, and PST-treated WT (WT+PST) SNU-475 cells tracked during 16 hr of random migration; dots, the final position of each single tracked cell. (E) Quantification of persistence indices of WT, KO, ΔIFBD, and PST-treated WT (WT+PST) SNU-475 cells shown in (D). Boxplot shows the median, 25th, and 75th percentile with whiskers reaching the last data point; dots, individual cells; n=15 (WT), 15 (KO), 19 (ΔIFBD), 14 (WT+PST); N=3. (F) Quantification of average protrusion frequency of WT, KO, ΔIFBD, and PST-treated WT (WT+PST) SNU-475 cells during random and EGF-guided (directed) migrations. Boxplot shows the median, 25th, and 75th percentile with whiskers reaching the last data point; dots, individual cells; n (random)=23 (WT), 21 (KO), 21 (ΔIFBD), 20 (WT+PST) cells; n (directed)=15 (WT), 15 (KO), 17 (ΔIFBD), 14 (WT+PST) cells; N=3. Two-tailed t-test; *p<0.05, **p<0.01; †p<0.001. (G) Quantification of migration velocity of WT, KO, ΔIFBD, and PST-treated WT (WT+PST) SNU-475 cells during random and EGF-guided (directed) migrations. Boxplot shows the median, 25th, and 75th percentile with whiskers reaching the last data point; dots, individual cells; n (random)=23 (WT), 21 (KO), 21 (ΔIFBD), 20 (WT+PST) cells; n (directed)=15 (WT), 15 (KO), 17 (ΔIFBD), 14 (WT+PST) cells; N=3. Two-tailed t-test; †p<0.001.
-
Figure 5—figure supplement 1—source data 1
PDF file containing original western blots for Figure 5—figure supplement 1C, indicating the relevant bands.
- https://cdn.elifesciences.org/articles/102205/elife-102205-fig5-figsupp1-data1-v1.pdf
-
Figure 5—figure supplement 1—source data 2
Original files for western blot analysis displayed in Figure 5—figure supplement 1C.
- https://cdn.elifesciences.org/articles/102205/elife-102205-fig5-figsupp1-data2-v1.zip
Figure 6 with 2 supplements
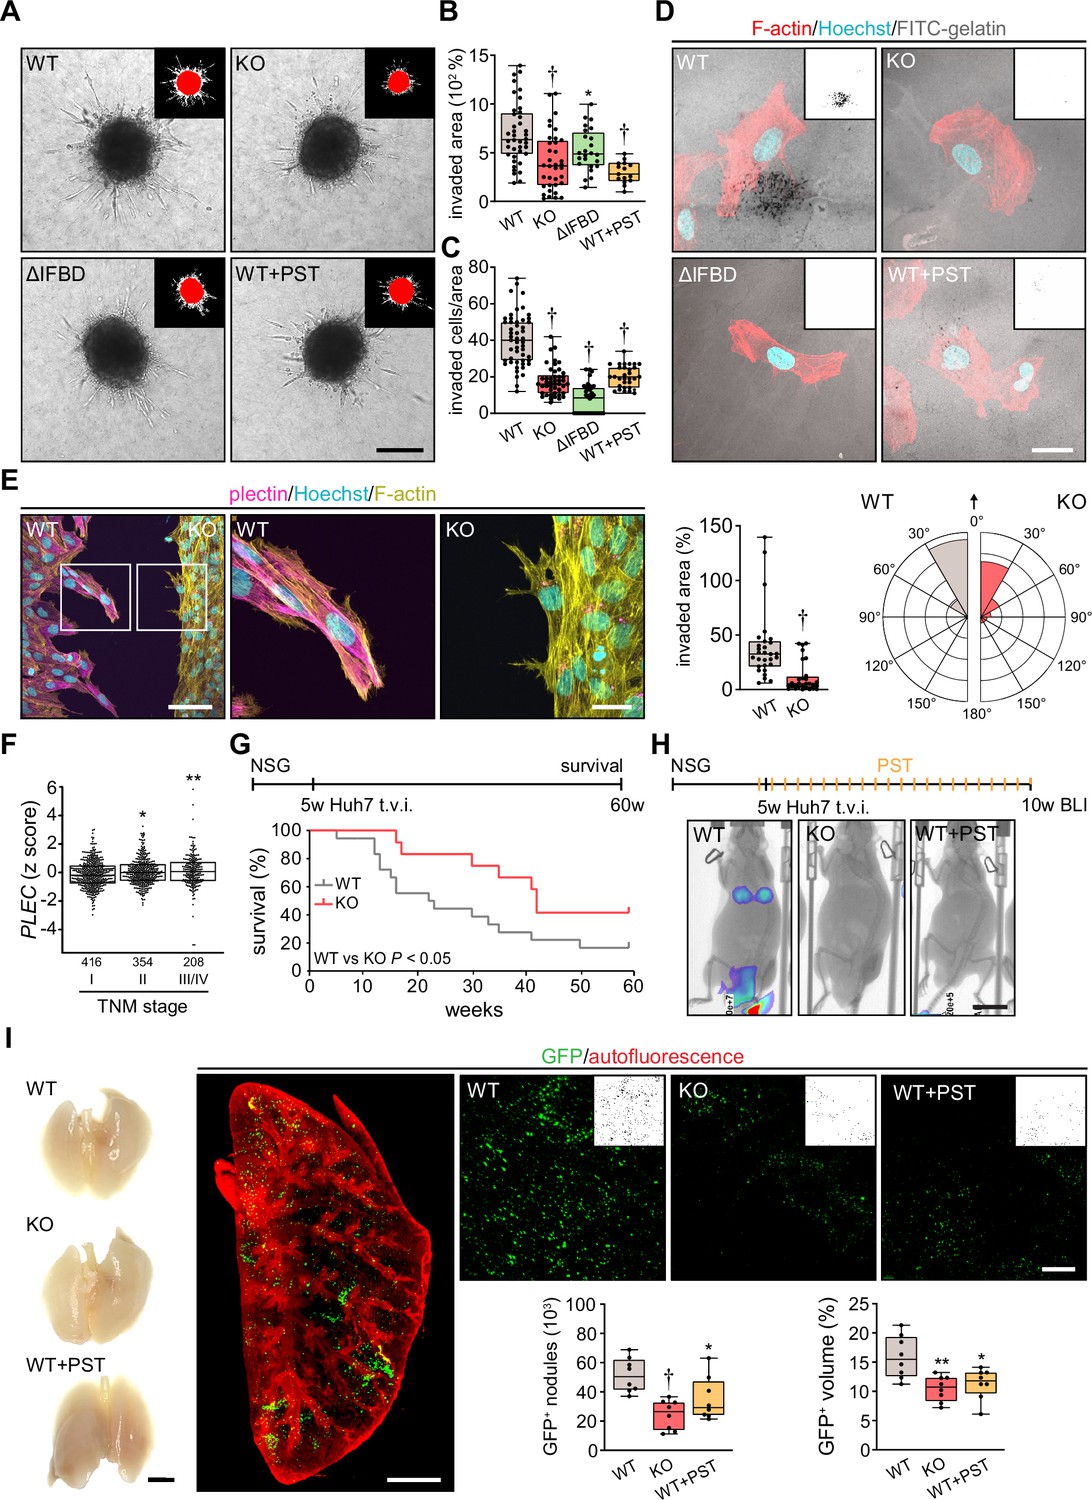
Plectin inactivation inhibits hepatocellular carcinoma (HCC) invasion and metastasis.
(A) Representative images of wild-type (WT), knockout (KO), ΔIFBD, and Plecstatin-1 (PST)-treated WT (WT+PST) SNU-475 spheroids grown for 3 d in collagen mixture. Insets, superimposed binary masks of initial (red) and final (white) spheroid area. Scale bar, 200 µm. (B) Quantification of the invaded area calculated as the percentage of the initial spheroid area from day 0. Boxplots show the median, 25th, and 75th percentile with whiskers reaching the last data point; dots, individual spheroids; n=47 (WT), 44 (KO), 34 (ΔIFBD), 25 (WT+PST) spheroids; N=5 (WT, KO), 4 (ΔIFBD), 3 (WT+PST). Two-tailed t-test; **p<0.01; †p<0.001. (C) Quantification of the number of indicated cells invaded in Matrigel transwell assay. Boxplots show the median, 25th, and 75th percentile with whiskers reaching the last data point; dots, fields of view; n=51 (WT), 45 (KO), 38 (ΔIFBD), 31 (WT+PST) fields of view; N=4 (WT, KO), 3 (ΔIFBD, WT+PST). Two-tailed t-test; †p<0.001. (D) Representative confocal micrographs of WT, KO, ΔIFBD, and PST-treated WT (WT+PST) SNU-475 cells grown on FITC-labeled gelatin (gray) for 24 hr and stained for F-actin (red). Nuclei, Hoechst (blue). Insets, segmented binary masks of FITC-gelatin signal. Black regions correspond to gelatin areas degraded by individual cells. Scale bar, 30 µm. (E) Representative confocal images of WT and KO SNU-475 cells during the Matrigel invasion assay, stained for plectin (magenta) and F-actin (yellow). Nuclei, Hoechst (blue). See Figure 6—video 1. Boxed areas, 3x images. Scale bars, 100 and 30 µm (boxed areas). Boxplot shows the invaded area calculated as the percentage of the initial area covered by WT and KO cells. The box represents the median, 25th, and 75th percentile with whiskers reaching the last data point; dots, fields of view; n=29 fields of view; N=2. Rose graphs show the percentage of extension vector directions in 30° cones, normalized to the directions of cell motions (0°; arrow) during matrigel invasion. n=857 extensions in 18 cells (WT), 623 extensions in 12 cells (KO); N=2. Two-tailed t-test; †p<0.001. (F) Relative plectin (PLEC) mRNA expression in samples collected from HCC patient meta-cohort clustered based on tumor, node, metastasis (TNM) classification (stage I-IV). The meta-cohort includes 6 different datasets from five platforms (for details, see Materials and methods section). The numbers of participants per stage are indicated in the graph. Scattered boxplots show individual data points, median, 25th, and 75th percentile; N=978. Wilcoxon rank-sum test; *p<0.05; **p<0.01. (G) The 5-wk-old NSG mice were injected into tail vein (tail vein injection; t.v.i.) with WT and KO RedFLuc-GFP-expressing Huh7 cells generated for lung colonization assay. Kaplan-Meier curves show the overall survival of mice injected with the cells indicated. N = 14 (WT), 13 (KO). Long-rank test, p<0.05. (H) The 5-week-old NSG mice were injected (t.v.i.) with indicated RedFLuc-GFP-expressing Huh7 cells. WT cell-bearing mice were kept either untreated or every second day provided with orogastric gavage of plecstatin (WT+PST) as indicated. Five weeks post-injection mice were screened by whole-body bioluminescence imaging (BLI). Representative BLI images of WT, KO, and PST-treated WT (WT+PST) Huh7 cells-bearing mice are shown. Scale bar, 2 cm. (I) Representative images of lungs dissected from mice shown in (H). Scale bar, 1 cm. Representative lattice light sheet fluorescence image of clear, unobstructed brain imaging cocktails (CUBIC)-cleared lung lobe immunolabeled with antibodies against GFP (green). Autofluorescence visualizing the lobe structures is shown in red. Scale bar, 2 mm. Representative magnified images from lung lobes with GFP-positive WT, KO, and WT+PST Huh7 nodules. Insets, segmented binary masks of GFP-positive metastatic nodules. Scale bar, 400 µm. Boxplots show metastatic load in the lungs expressed as the number (left graph) and relative volume (right graph) of indicated GFP-positive (GFP+) nodules. The box represents the median, 25th, and 75th percentile with whiskers reaching the last data point; dots, lung lobes; n=8 lung lobes; N=4. Two-tailed t-test; *p<0.05; **p<0.01; †p<0.001.
Figure 6—figure supplement 1
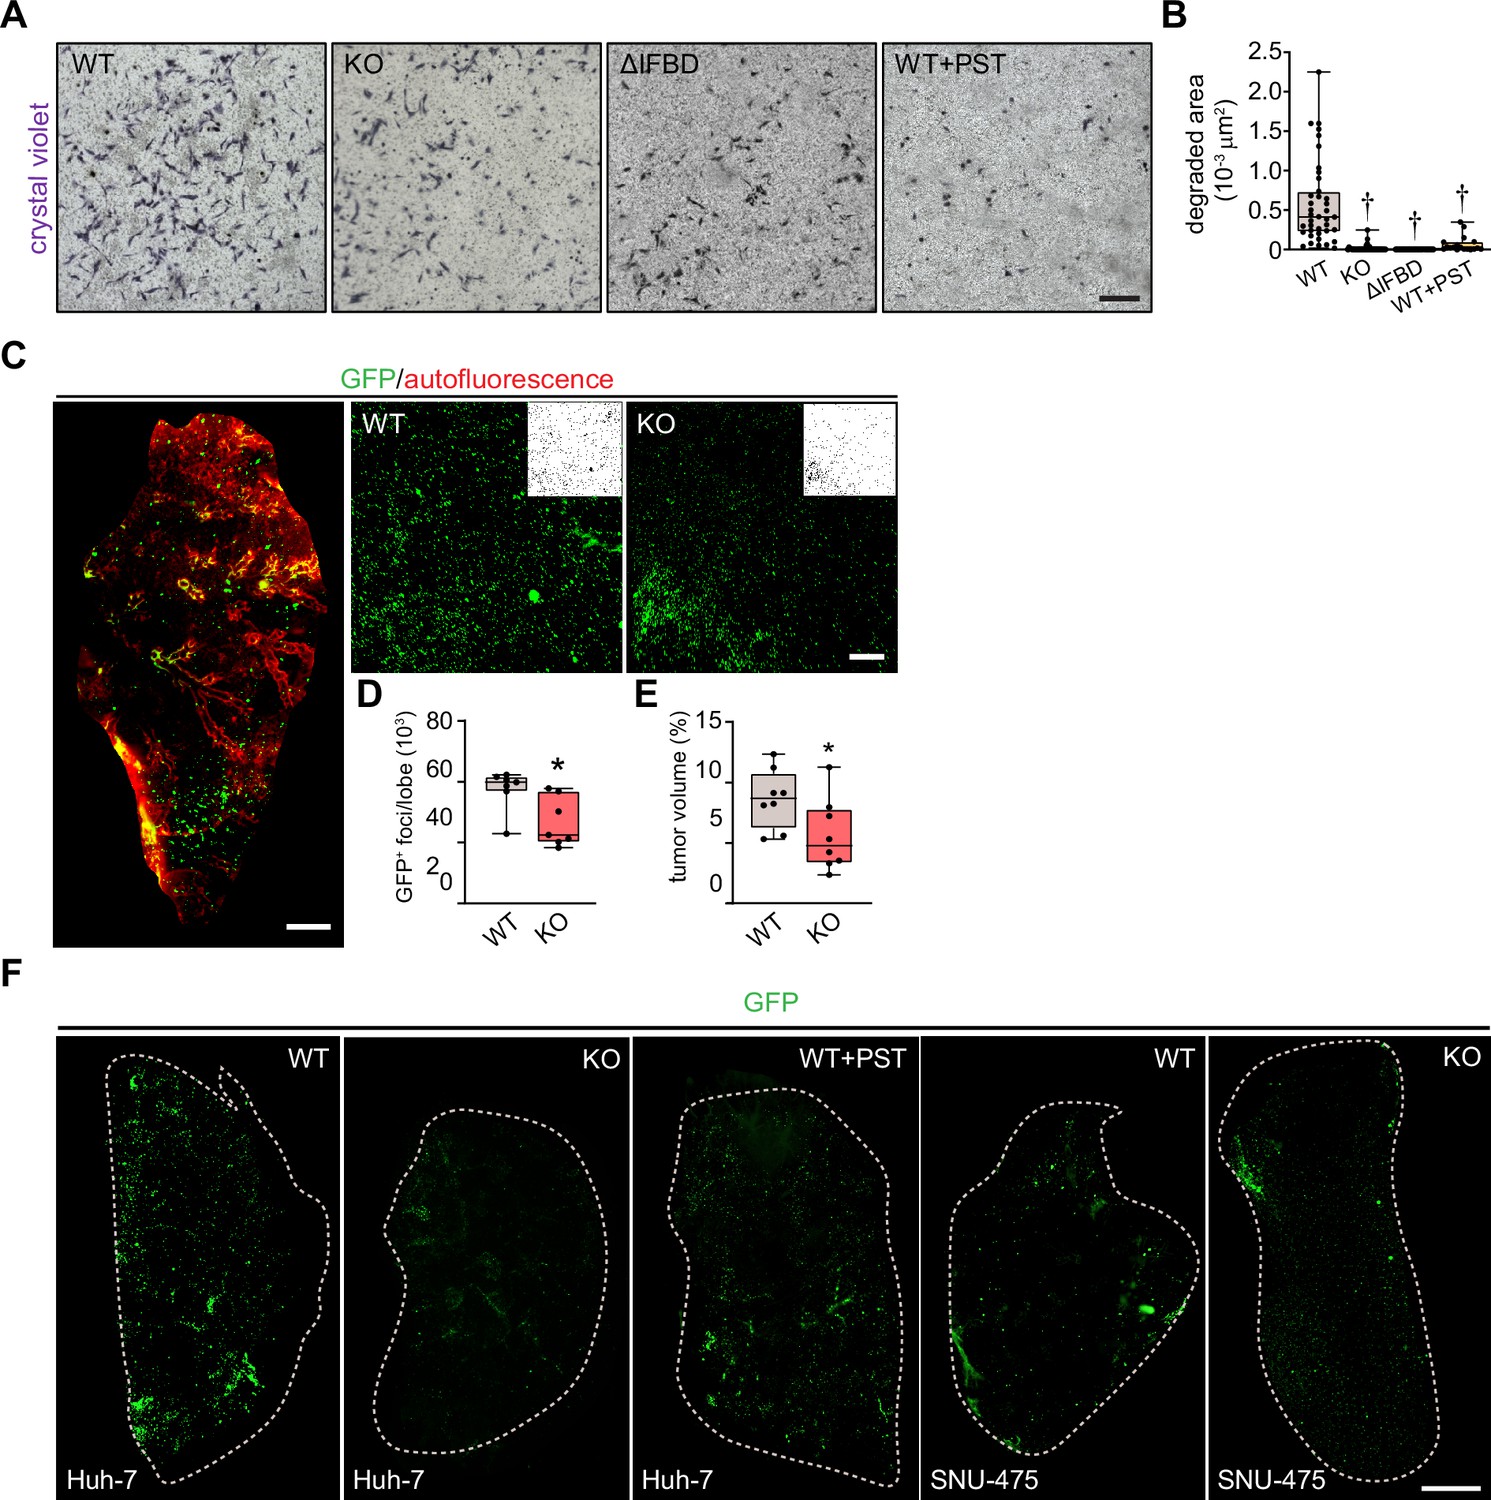
Plectin inactivation reduces the invasiveness of hepatocellular carcinoma (HCC) cells.
(A) Representative images of crystal violet-stained wild-type (WT), knockout (KO), ∆IFBD, and Plecstatin-1 (PST)-treated WT (WT+PST) SNU 475 cells invading in Matrigel transwell assay shown in Figure 6C. Scale bar, 300 µm. (B) Quantification of gelatin area degraded by WT, KO, ∆IFBD, and PST-treated WT (WT+PST) SNU-475 cells shown in Figure 6D. Boxplot shows the median, 25th, and 75th percentile with whiskers reaching the last data point; dots, individual cells; n=49 (WT), 36 (KO), 25 (ΔIFBD), 29 (WT+PST); N=5 (WT), 4 (KO), 3 (∆IFBD, WT+PST). Two-tailed t-test; †p<0.001. (C) The 5-wk-old NSG mice were injected (t.v.i.) with indicated RedFLuc-GFP-expressing SNU-475 cells. Representative lattice light sheet fluorescence image of CUBIC-cleared lung lobe immunolabeled with antibodies against GFP (green). Autofluorescence visualizing the lobe structures is shown in red. Scale bar, 1 mm. Representative magnified images from lung lobes with GFP-positive wild-type (WT) and knockout (KO) nodules. Insets, segmented binary masks of GFP-positive metastatic nodules. Scale bar, 200 µm. (D, E) Boxplots show metastatic load in the lungs expressed as the number (D) and relative volume (E) of GFP-positive (GFP+) nodules indicated in (C). The box represents the median, 25th, and 75th percentile with whiskers reaching the last data point; dots, lung lobes; n=8 lung lobes; N=4. Two-tailed t-test; *p<0.05 (F) Representative lattice light sheet fluorescence images of CUBIC-cleared lung lobes from (C) and Figure 6I, immunolabeled with antibodies against GFP (green). Dashed line, lobe contour. Scale bar, 1500 µm.
Figure 6—video 1
Representative video of wild-type (WT) and knockout (KO) SNU-475 cells invading the matrigel.
Time-lapse covers total 21 hr with frame taken every 15 min (∼15 min elapsed time per frame of the movie). Scale bar, 200 µm. The fixed and immunolabeled cells from the endpoint of this experiment are shown in Figure 6E.
Figure 7 with 3 supplements
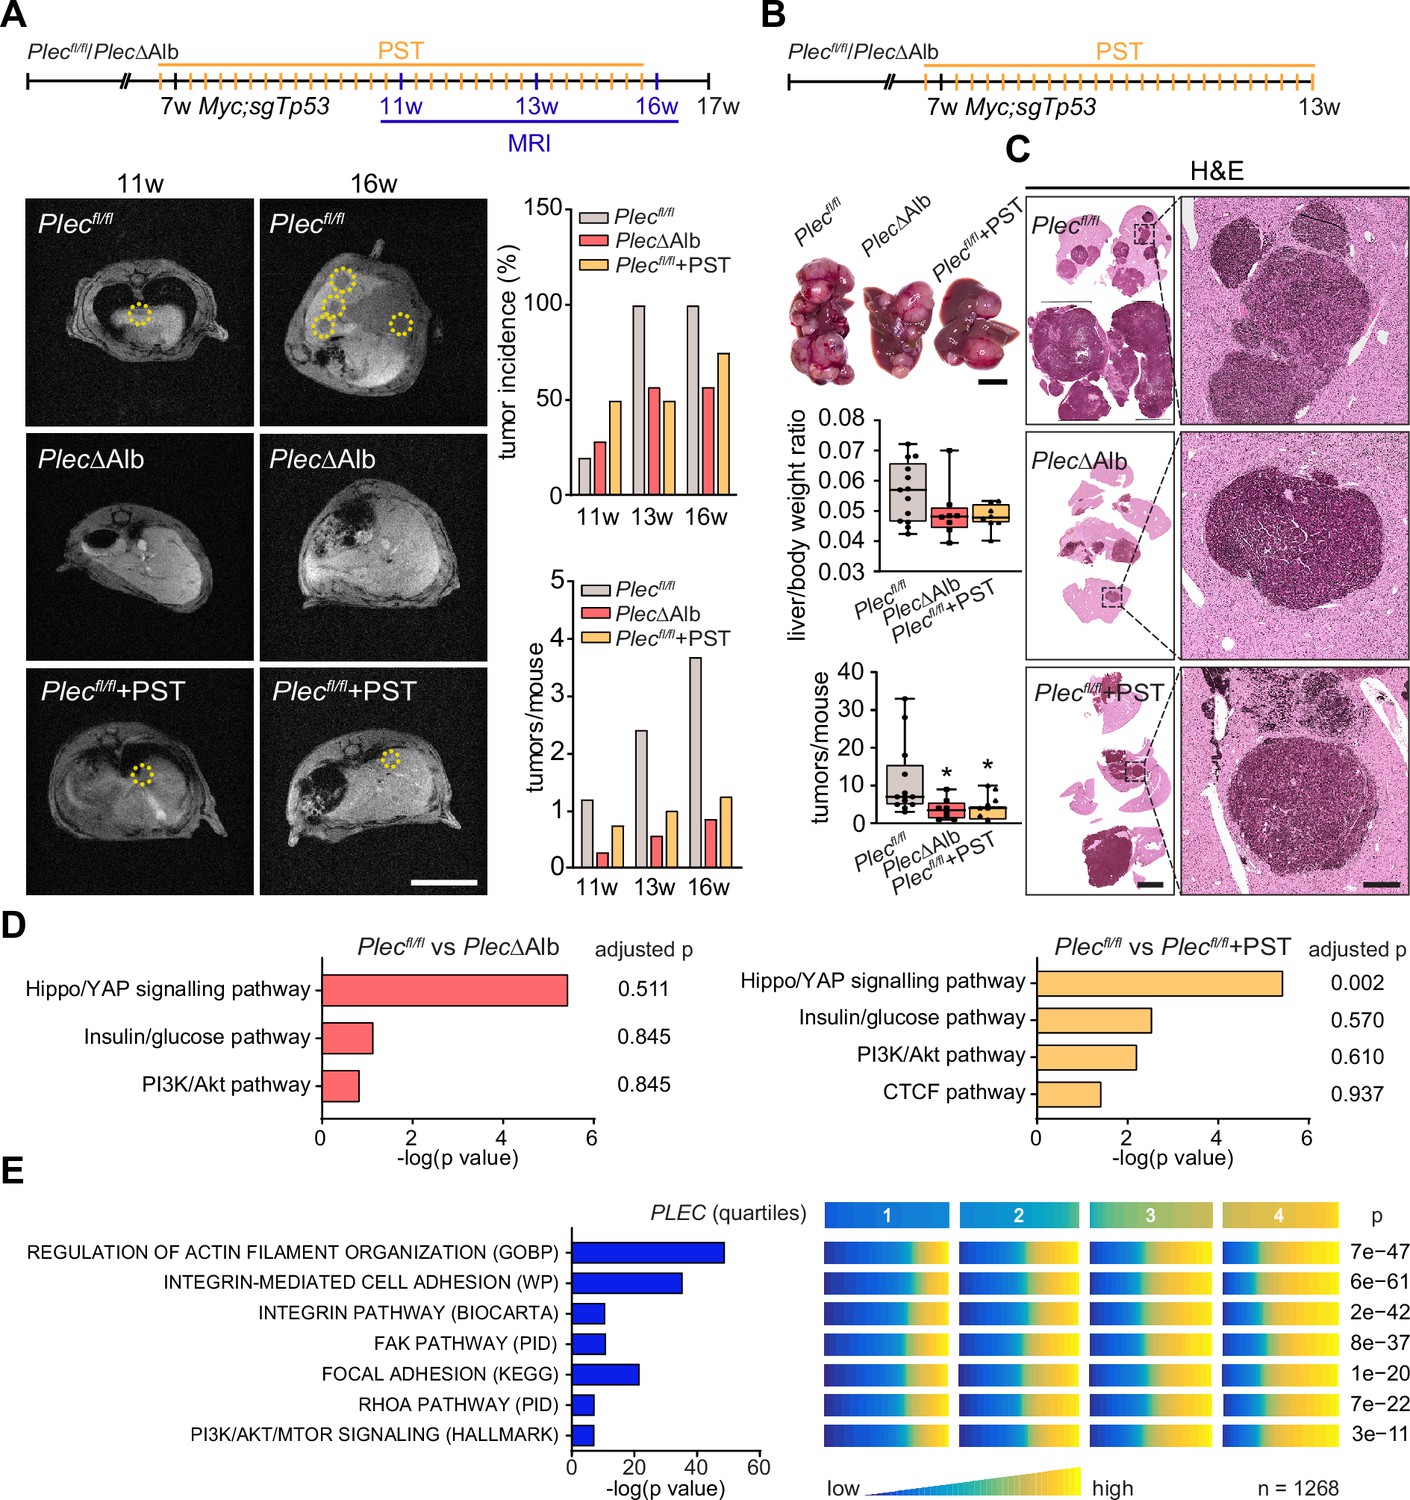
Genetic and pharmacological plectin targeting prevents hepatocarcinogenesis through signatures shared by animal models and patients.
(A) Hepatocellular carcinoma (HCC)-predisposing lesions were introduced by hydrodynamic gene delivery via tail vein injection (HDTVi) of transposon vector encoding MYC in conjunction with CRISPR/Cas9 construct targeting Tp53 (Myc;sgTp53) in Plecfl/fl and PlecΔAlb cohorts of 7-wk-old male mice. Plecfl/fl mice were kept either untreated or every second day provided with orogastric gavage of plecstatin (Plecfl/fl+PST) and the development of HCC was monitored by MRI at 11, 13, and 16 wk, as indicated. Representative MRI images of Plecfl/fl and PlecΔAlb and Plecfl/fl+PST tumors acquired at indicated time points. Dashed circles, tumors. Scale bar, 2 cm. Graphs show the average number of tumors (lower graph) and percentual tumor incidence (upper graph) inferred from MRI images. N=5 (Plecfl/fl), 7 (PlecΔAlb), 4 (Plecfl/fl+PST). (B) Myc;sgTp53 HCC was induced in Plecfl/fl, PlecΔAlb, and PST-treated Plecfl/fl (Plecfl/fl+PST) male mice as in (A). Shown are representative images of Plecfl/fl, PlecΔAlb, and Plecfl/fl+PST livers from mice with fully developed multifocal HCC sacrificed 6 wk post-induction. Scale bar, 1 cm. Boxplots show tumor burden in the livers expressed as the liver/body weight ratio (upper graph) and number of tumors per mouse (lower graph). The box represents the median, 25th, and 75th percentile with whiskers reaching the last data point; dots, mice; N=12 (Plecfl/fl), 9 (PlecΔAlb), 10 (Plecfl/fl+PST). Two-tailed t-test; *p<0.05. (C) Representative images of H&E-stained Plecfl/fl, PlecΔAlb, and Plecfl/fl+PST liver sections. Note darker areas corresponding to HCC lesions. Boxed areas, 12x images. Scale bars, 5 and 1 mm (boxed areas). (D) Gene set enrichment analysis of differentially regulated proteins in Plecfl/fl vs PlecΔAlb and Plecfl/fl vs Plecfl/fl+PST livers from the cohort shown in (A). Prediction of canonical signaling pathways in Plecfl/fl vs PlecΔAlb (left) and Plecfl/fl vs Plecfl/fl+PST (right) proteomes. (E) Association of plectin-dependent signatures compiled from human HCC-derived cells (see Figure 3B–E) and mouse models (see D) with plectin (PLEC) mRNA expression in HCC patients. Right panel shows the levels of selected signatures in patients grouped into quartiles of PLEC expression level. N=1268. p-values were generated from an analysis of variance (ANOVA).
Figure 7—figure supplement 1
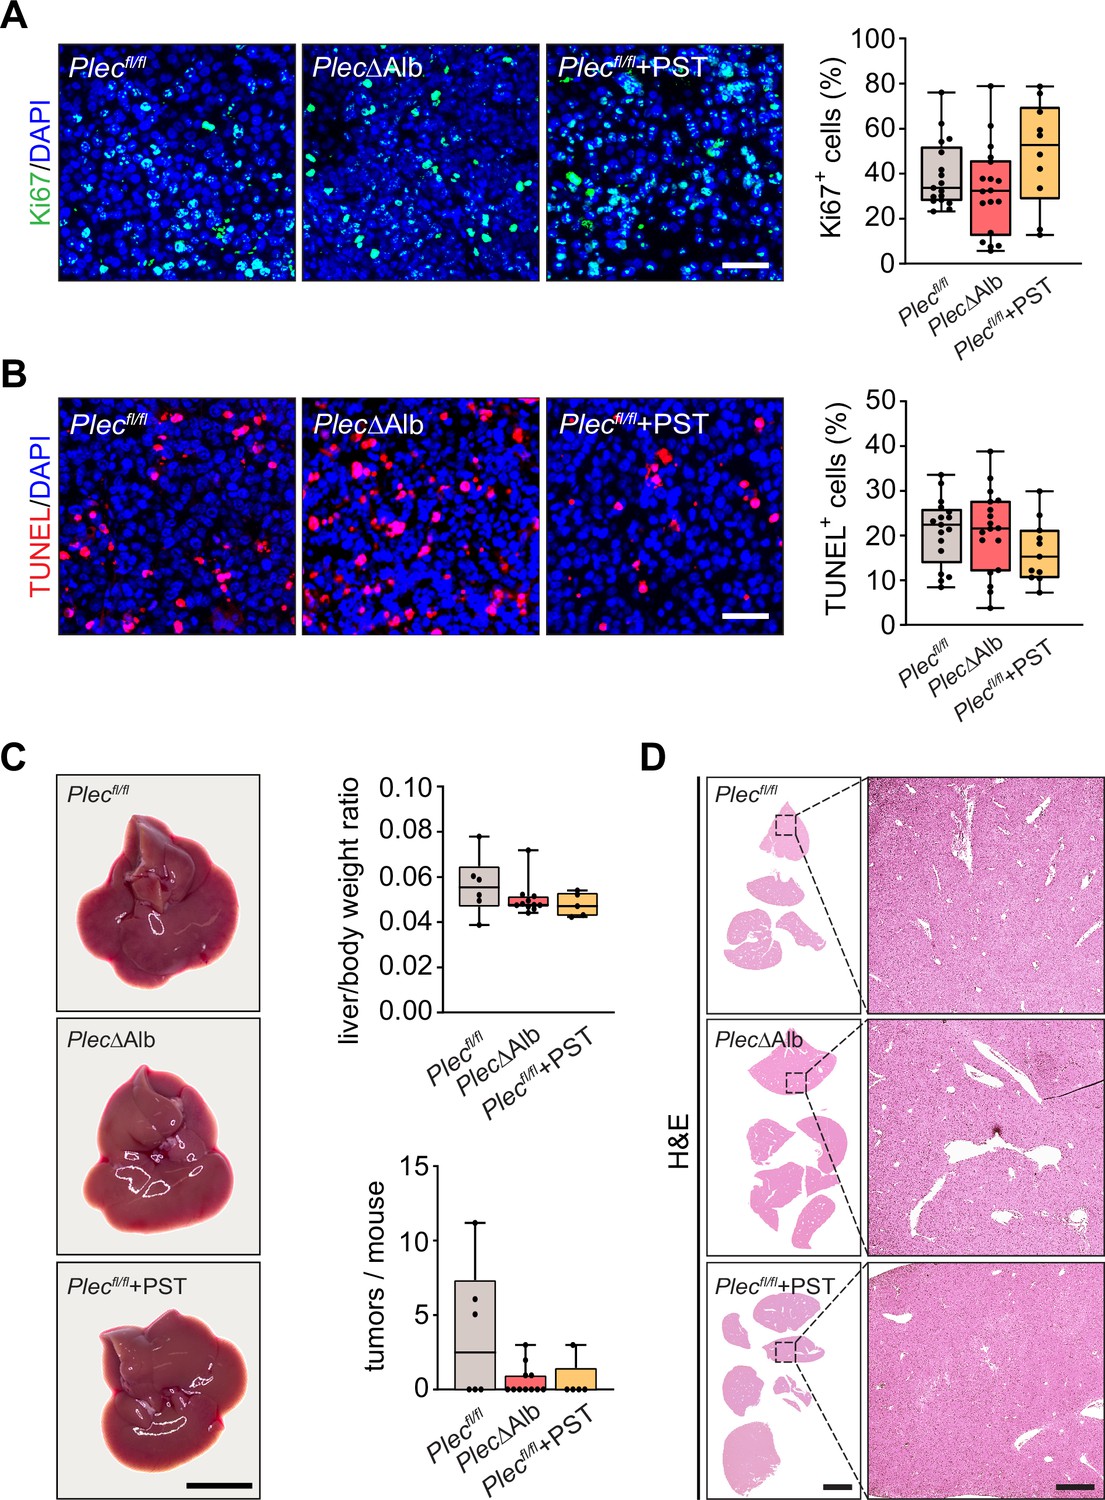
Effect of plectin inactivation on hepatocellular carcinoma (HCC) proliferation, apoptosis, and development.
(A, B) Representative images of Myc;sgTp53-induced liver tumor sections from Plecfl/fl, PlecΔAlb, and Plecstatin-1 (PST)-treated Plecfl/fl (Plecfl/fl+PST) mice shown in Figure 7B and C immunolabeled for Ki67 (green; A) and TUNEL (red; B). Nuclei, DAPI (blue). Scale bar, 50 μm. Quantification (percentage) of Ki67-positive cells (A) and TUNEL-positive cells (B). Boxplot shows the median, 25th, and 75th percentile with whiskers reaching the last data point; dots, individual tumors; n=17 (Plecfl/fl), 18 (PlecΔAlb), 10 (Plecfl/fl+PST). (C, D) Myc;sgTp53 HCC was induced as before (see Figure 7A and B) in 8-wk-old Plecfl/fl and PlecΔAlb female mice. Plecfl/fl mice were kept either untreated or every second day provided with orogastric gavage of plecstatin (Plecfl/fl+PST). Animals were sacrificed 8 wk post-induction. Representative images of Plecfl/fl, PlecΔAlb, and Plecfl/fl+PST livers. Scale bar, 1 cm. Boxplots show tumor burden in the livers expressed as the liver/body weight ratio (upper graph) and number of tumors per mouse (lower graph). The box represents the median, 25th, and 75th percentile with whiskers reaching the last data point; dots, mice; N=6 (Plecfl/fl), 13 (PlecΔAlb), 5 (Plecfl/fl+PST). (D) Representative images of H&E-stained Plecfl/fl, PlecΔAlb, and Plecfl/fl+PST sections of livers are shown in (C). Boxed areas, 12x images. Scale bars, 5 and 1 mm (boxed areas).
Figure 7—figure supplement 2
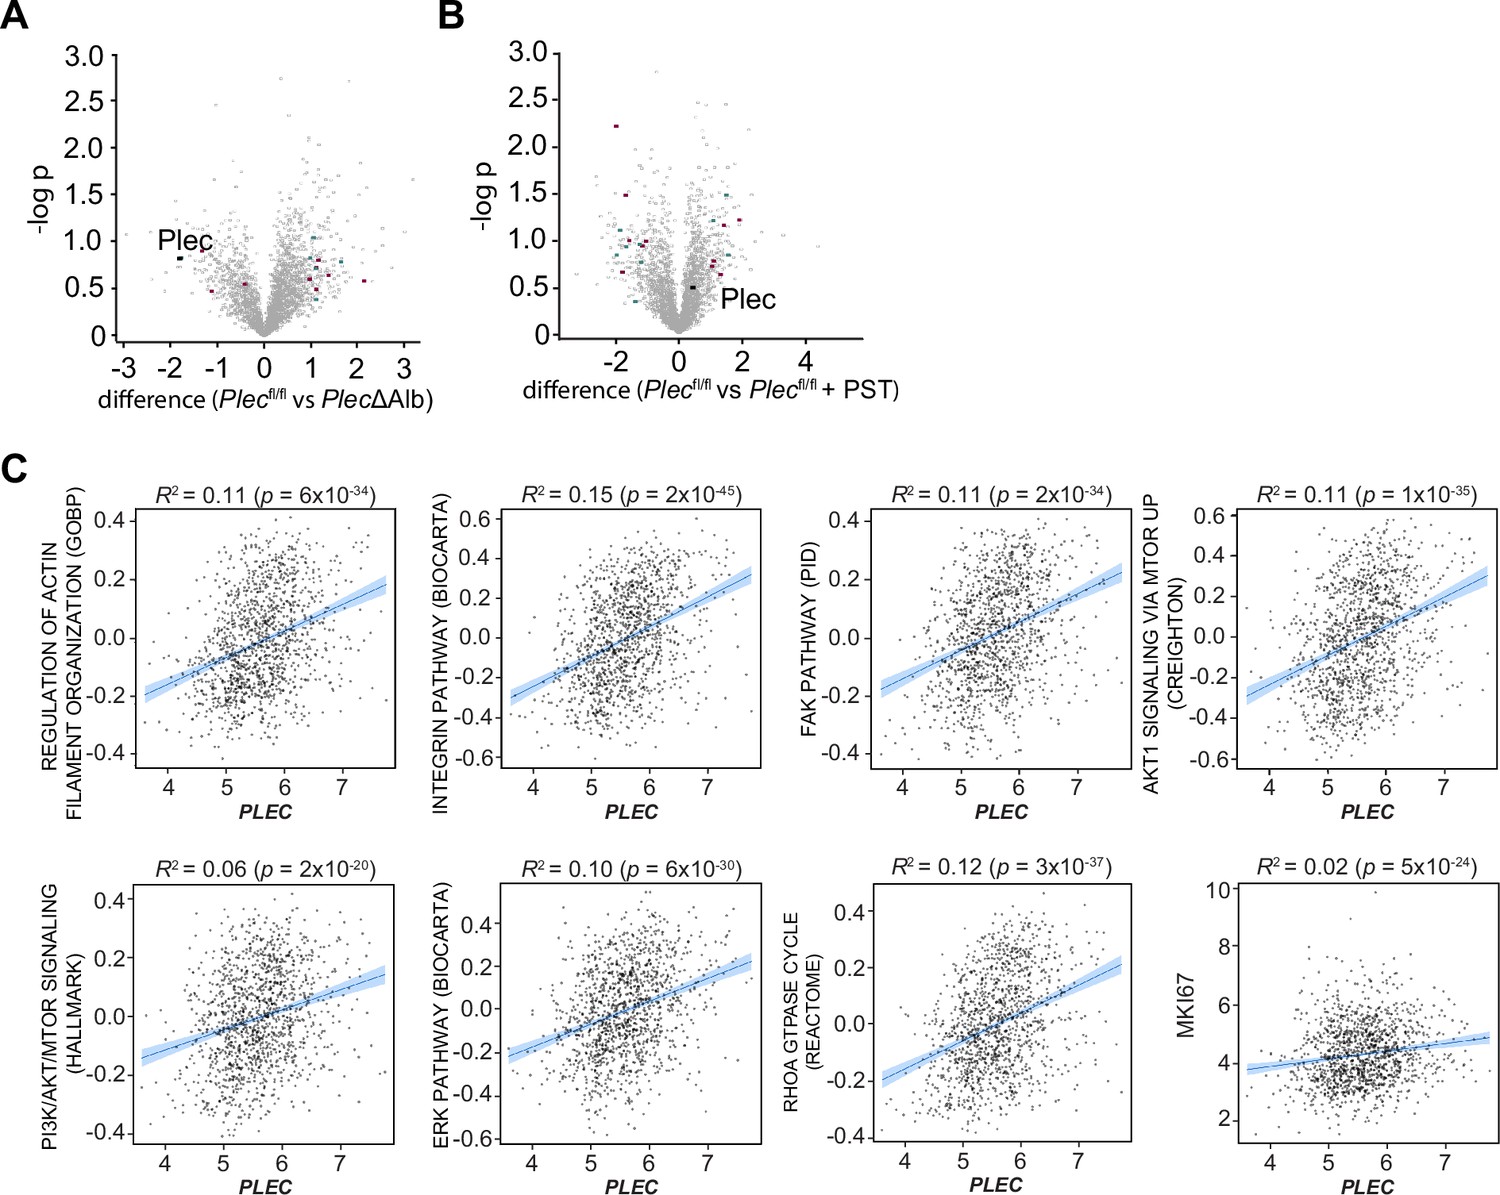
Plectin-related expression signatures hepatocellular carcinoma (HCC) from animal models and patients.
(A, B) Volcano plots show the fold change vs. p-value of differentially expressed proteins in livers of Plecfl/fl vs. PlecΔAlb (A) and Plecfl/fl vs. Plecfl/fl+PST (B) Myc;sgTp53-treated mice (see also Figure 7B). Colored dots represent differentially expressed proteins identified in canonical signaling pathways shown in Figure 7D. (C) Scatter plots show the correlation of plectin (PLEC) mRNA expression with indicated expression signatures. Line, linear regression line; blue area, 95% confidence intervals. Coefficient of determination (R2) and p-values are indicated above the graphs.
Figure 7—figure supplement 3
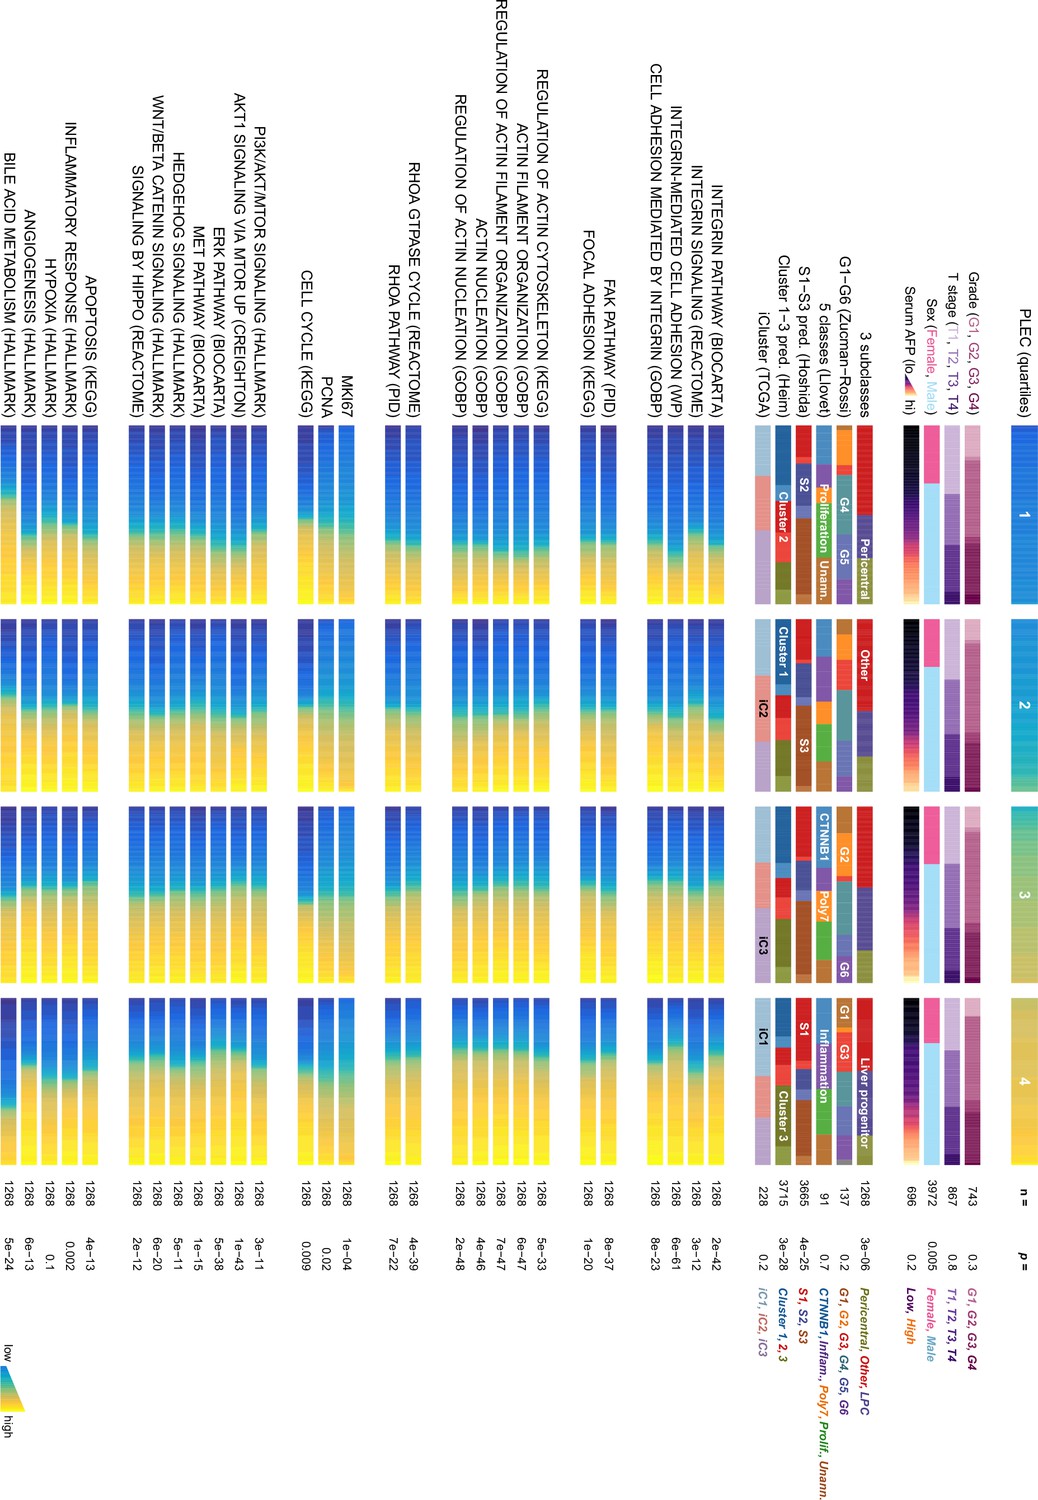
Plectin signature in hepatocellular carcinoma (HCC) patients.
The graph shows the association of plectin (PLEC) mRNA expression with indicated clinicopathological parameters, molecular classifications, and signature pathways among patients grouped into quartiles of PLEC expression. The analysis is based on data from gene set variation analysis (GSVA) used to produce quantitative enrichment scores for all gene sets from msigdb in pooled and batch-adjusted data. p-values represent the result of a chi-square test (for categorical data) or analysis of variance (for numerical data such as gene signature expression levels).
Author response image 1
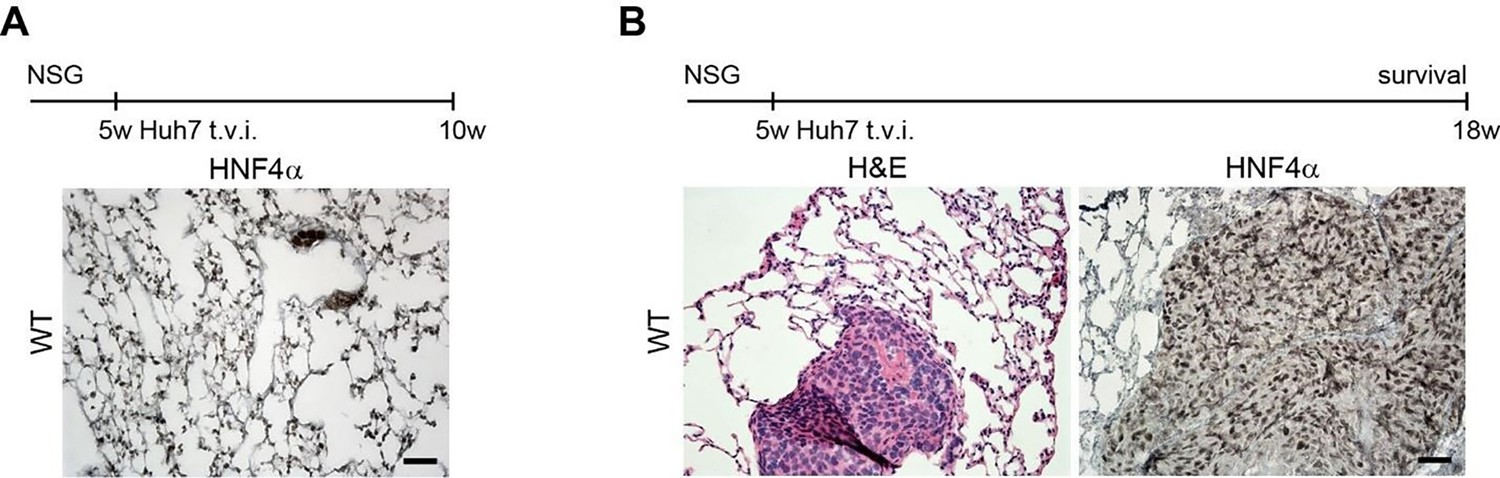
(A) HNF4α staining of lung tissue after CUBIC clearing from mice inoculated with WT Huh7 from the timepoint of BLI, when the positive signal in chest area has been detected. This timepoint was then selected for the comparison of initial stages of lung colonization. (B) H&E and HNF4α staining from lung tissue of mice inoculated with WT Huh7 cells from the survival experiment. Scale bars, 50 µm.
Tables
Author response table 1
| FAK expression (to GAPDH) | 85 (KO) 84 (/_\1IFBD) 89 (WT+PST) in Huh7 |
|---|---|
| 82 (KO) 71 (/_\1FBD) 79 (WT+PST) in SNU-475 | |
| phospho-Tyr397-FAK (to FAK) | 110 (KO) 117 (Delta1IFBD) 94 (WT+PST) in Huh7 |
| 104 (KO) 98 (Delta1FBD) 95 (WT+PST) in SNU-475 | |
| Akt expression (to GAPDH) | 112 (KO) 136 (Delta1IFBD) 94 (WT+PST) in Huh7 |
| 91 (KO) 78 (/_\1FBD) 94 (WT+PST) in SNU-475 | |
| phospho-Ser473-Akt (to Akt) | 84 (KO) 70 (/_\1IFBD) 86 (WT+PST) in Huh7 |
| 81 (KO) 67 (/_\1FBD) 88 (WT+PST) in SNU-475 | |
| Erk1/2 expression (to GAPDH) | 119 (KO) 124 (/_\ IFBD) 105 (WT+PST) in Huh7 |
| 128 (KO) 170 (/_\ IFBD) 86 (WT+PST) in SNU-475 | |
| phospho-Thr202/Tyr204-Erk (to Erk) | 76 (KO) 78 (/_\1IFBD) 90 (WT+PST) in Huh7 |
| 68 (KO) 51 (/_\1FBD) 98 (WT+PST) in SNU-475 | |
| ILK expression (to GAPDH) | 103 (KO) 102 (Delta1FBD) 87 (WT+PST) in Huh7 |
| 86 (KO) 74 (/_\1FBD) 99 (WT+PST) in SNU-475 | |
| PI3K expression (to GAPDH) | 108 (KO) 131 (/_\ IFBD) 106 (WT+PST) in Huh7 |
| 86 (KO) 84 (/_\1FBD) 82 (WT+PST) in SNU-475 | |
| phospho-p85 (Tyr458)/p55(Tyr199)-PI3K (to PI3K) | 67 (KO) 54 (/_\1FBD) 72 (WT+PST) in Huh7 |
| 76 (KO) 88 (/_\IFBD) 80 (WT+PST) in SNU-475 |
Author response table 2
| phospho-Ser473-Akt (to Akt) | 84 (KO) 70 (DeltaIFBD)86 (WT+PST) in Huh7 |
|---|---|
| 81 (KO) 67 (DeltaFBD)88 (WT+PST) in SNU-475 | |
| phospho-Thr202/Tyr204-Erk (to Erk) | 76 (KO) 78 (DeltaFBD)90 (WT+PST) in Huh7 |
| 68 (KO) 51 (DeltaFBD)98 (WT+PST) in SNU-475 |
Author response table 3
| FAK expression (to GAPDH) | 85 (KO) 84 (Delta IFBD) 89 (WT+PST) in Huh7 |
|---|---|
| 82 (KO) 71 (Delta IFBD) 79 (WT+PST) in SNU-475 | |
| phospho-Tyr397-FAK (to FAK) | 110 (KO) 117 (Delta1FBD) 94 (WT+PST) in Huh7 |
| 104 (KO) 98 (Delta1IFBD) 95 (WT+PST) in SNU-475 | |
| Normalized pFAKxNormalized FAK | 94 (KO) 98 (/_\1 IFBD) 84 (WT+PST) in Huh7 |
| 85 (KO) 70 (DeltaIFBD) 75 (WT+PST) in SNU-475 |
Author response table 4
| FAK expression (to GAPDH) | 85 (KO) 84 (DeltaIFBD)89 (WT+PST) in Huh7 |
|---|---|
| phospho-Tyr397-FAK (to FAK) | 82 (KO) 71 (DeltaIFBD)79 (WT+PST) in SNU-475 |
| Normalized pFAKxNormalized FAK | 110 (KO) 117 (DeltaIFBD)94 (WT+PST) in Huh7 |
| 104 (KO) 98 (DeltaIFBD)95 (WT+PST) in SNU-475 | |
| 94 (KO) 98 (DeltaIFBD)84 (WT+PST) in Huh7 | |
| 85 (KO) 70 (DeltaIFBD)75 (WT+PST) in SNU-475 |
Author response table 5
| phospho-Ser473-Akt (to Akt) | 84 (KO) 70 (Delta IFBD) 86 (WT+PST) in Huh7 |
|---|---|
| 81 (KO) 67 (Delta IFBD) 88 (WT+PST) in SNU-475 | |
| phospho-Thr202/Tyr204-Erk (to Erk) | 76 (KO) 78 (Delta IFBD) 90 (WT+PST) in Huh7 |
| 68 (KO) 51 (Delta IFBD) 98 (WT+PST) in SNU-475 |
Additional files
-
Supplementary file 1
Table of patients’ clinical data.
- https://cdn.elifesciences.org/articles/102205/elife-102205-supp1-v1.docx
-
Supplementary file 2
List of antibodies used in this study.
- https://cdn.elifesciences.org/articles/102205/elife-102205-supp2-v1.docx
-
Supplementary file 3
Supplemental material.
- https://cdn.elifesciences.org/articles/102205/elife-102205-supp3-v1.pdf
-
MDAR checklist
- https://cdn.elifesciences.org/articles/102205/elife-102205-mdarchecklist1-v1.pdf
Download links
A two-part list of links to download the article, or parts of the article, in various formats.
Downloads (link to download the article as PDF)
Open citations (links to open the citations from this article in various online reference manager services)
Cite this article (links to download the citations from this article in formats compatible with various reference manager tools)
Plectin-mediated cytoskeletal crosstalk as a target for inhibition of hepatocellular carcinoma growth and metastasis
eLife 13:RP102205.
https://doi.org/10.7554/eLife.102205.3


