Oncogenic and teratogenic effects of Trp53Y217C, an inflammation-prone mouse model of the human hotspot mutant TP53Y220C
- Genetics of Tumor Suppression, Institut Curie, CNRS UMR3244, Sorbonne University, PSL University, France
- Chromatin Dynamics, Institut Curie, CNRS UMR3664, Sorbonne University, PSL University, France
- Non Coding RNA, Epigenetic and Genome Fluidity, Institut Curie, CNRS UMR3244, Sorbonne University, PSL University, France
- Chemical Biology, Institut Curie, CNRS UMR3666, INSERM U1143, PSL University, France
- Signaling and Neural Crest Development, Institut Curie, CNRS UMR3347, INSERM U1021, Université Paris-Saclay, PSL University, France
- Hematopoietic and Leukemic Development, Centre de Recherche Saint-Antoine, INSERM UMRS938, Sorbonne University, France
Figures
Figure 1 with 1 supplement
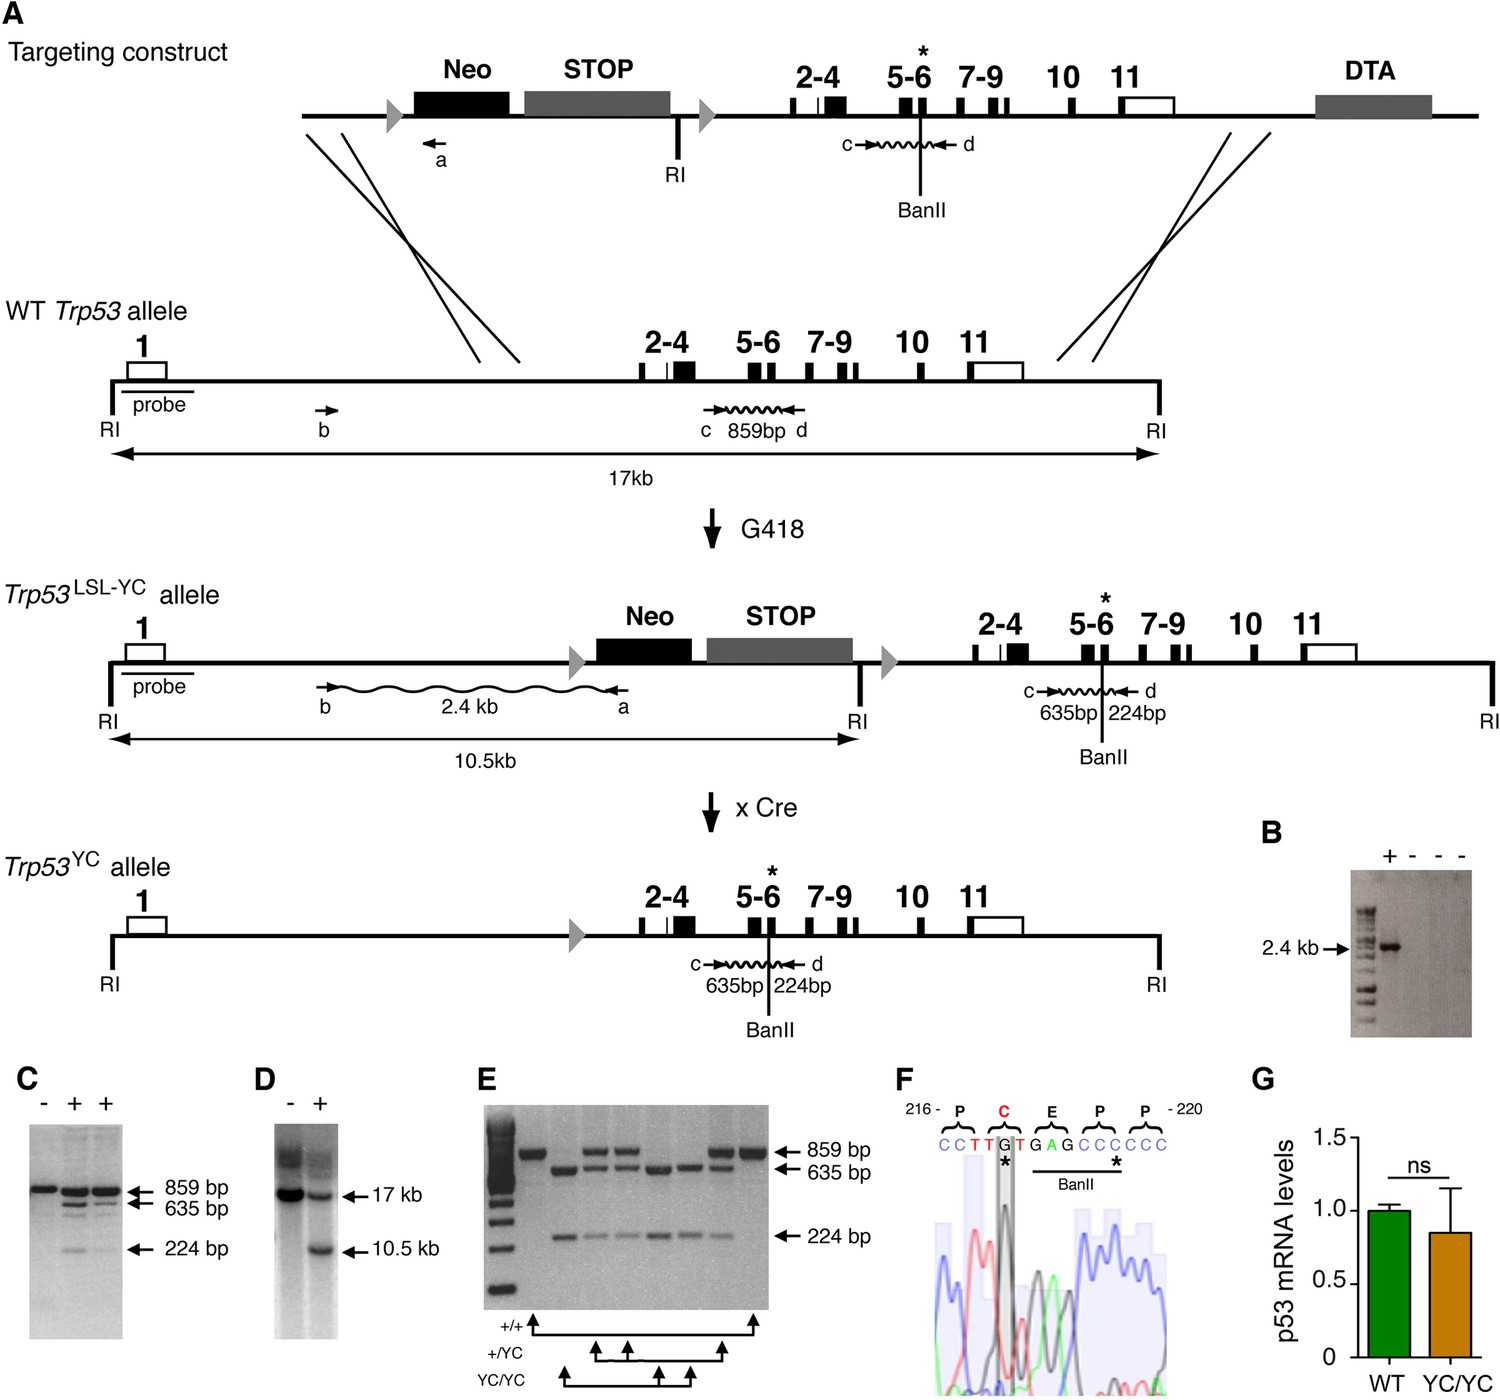
Targeting the Y217C missense mutation at the mouse Trp53 locus.
(A) Targeting strategy. The wildtype (WT) Trp53 gene is within a 17-kb-long EcoRI (RI) fragment (black boxes are for coding sequences and white boxes for UTRs). The targeting construct contains: (1) a 1.5-kb-long 5’ homology region; (2) a Lox-Stop-Lox (LSL) cassette with a neomycin selection gene (Neo), four transcriptional stops (STOP) and an EcoRI site, flanked by LoxP sites (arrowheads); (3) p53 coding exons, including the Y217C (YC) missense mutation in exon 6 (asterisk) and an additional BanII site; (4) a 2.8-kb-long 3’ homology region; and (5) the diphteria α-toxin (DTA) gene for targeting enrichment. Proper recombinants with a Trp53LSL-Y217C allele, resulting from the described crossing-overs, were G418 resistant. They were identified by a 2.4-kb-long band after PCR with primers a and b, and confirmed by bands of 635 and 224 bp after PCR with primers c and d and BanII digestion. They were also verified by Southern blot with the indicated probe as containing a 10.5 kb EcoRI band. Two recombinant ES clones were injected into blastocysts to generate chimeras, and germline transmission was verified by genotyping with primers c and d and BanII digestion. Excision of the LSL cassette was performed in vivo, by breeding Trp53+/LSL-Y217C male mice with females carrying the PGK-Cre transgene, to obtain mice with a Trp53Y217C allele. (B–D) Screening of recombinant ES clones (+) by PCR with primers a and b (B); PCR with primers c and d then BanII digestion (C); Southern blot (D). (E) Genotyping of mouse embryonic fibroblasts (MEFs) from an intercross of Trp53+/Y217C mice, by PCR with primers c and d and BanII digestion. (F) Trp53Y217C sequence around codon 217. The introduced Y217C missense mutation and the silent mutation creating an additional BanII restriction site are highlighted (asterisks). (G) WT and Trp53Y217C/Y217C (YC/YC) MEFs express similar p53 mRNA levels. Total RNA was extracted, then p53 mRNAs were quantified by real-time qPCR, normalized to control mRNAs and the amount in WT cells was assigned the value of 1. Means + SEM (n=3) are shown. Primer sequences are listed in Supplementary file 5.
-
Figure 1—source data 1
Labeled files for gels and blots in Figure 1B, C, D, and E.
- https://cdn.elifesciences.org/articles/102434/elife-102434-fig1-data1-v1.zip
-
Figure 1—source data 2
Raw and unedited gels and blots for Figure 1B, C, D, and E.
- https://cdn.elifesciences.org/articles/102434/elife-102434-fig1-data2-v1.zip
Figure 1—figure supplement 1

Protein sequence alignment showing homology between mouse p53 Tyrosine 217 and human p53 Tyrosine 220.
Portions of the DNA-binding domains from the mouse (residues 208–228) and human (residues 211–231) p53 proteins are shown, with identical residues in bold, and mouse Tyrosine 217 and human Tyrosine 220 in red.
Figure 2 with 3 supplements
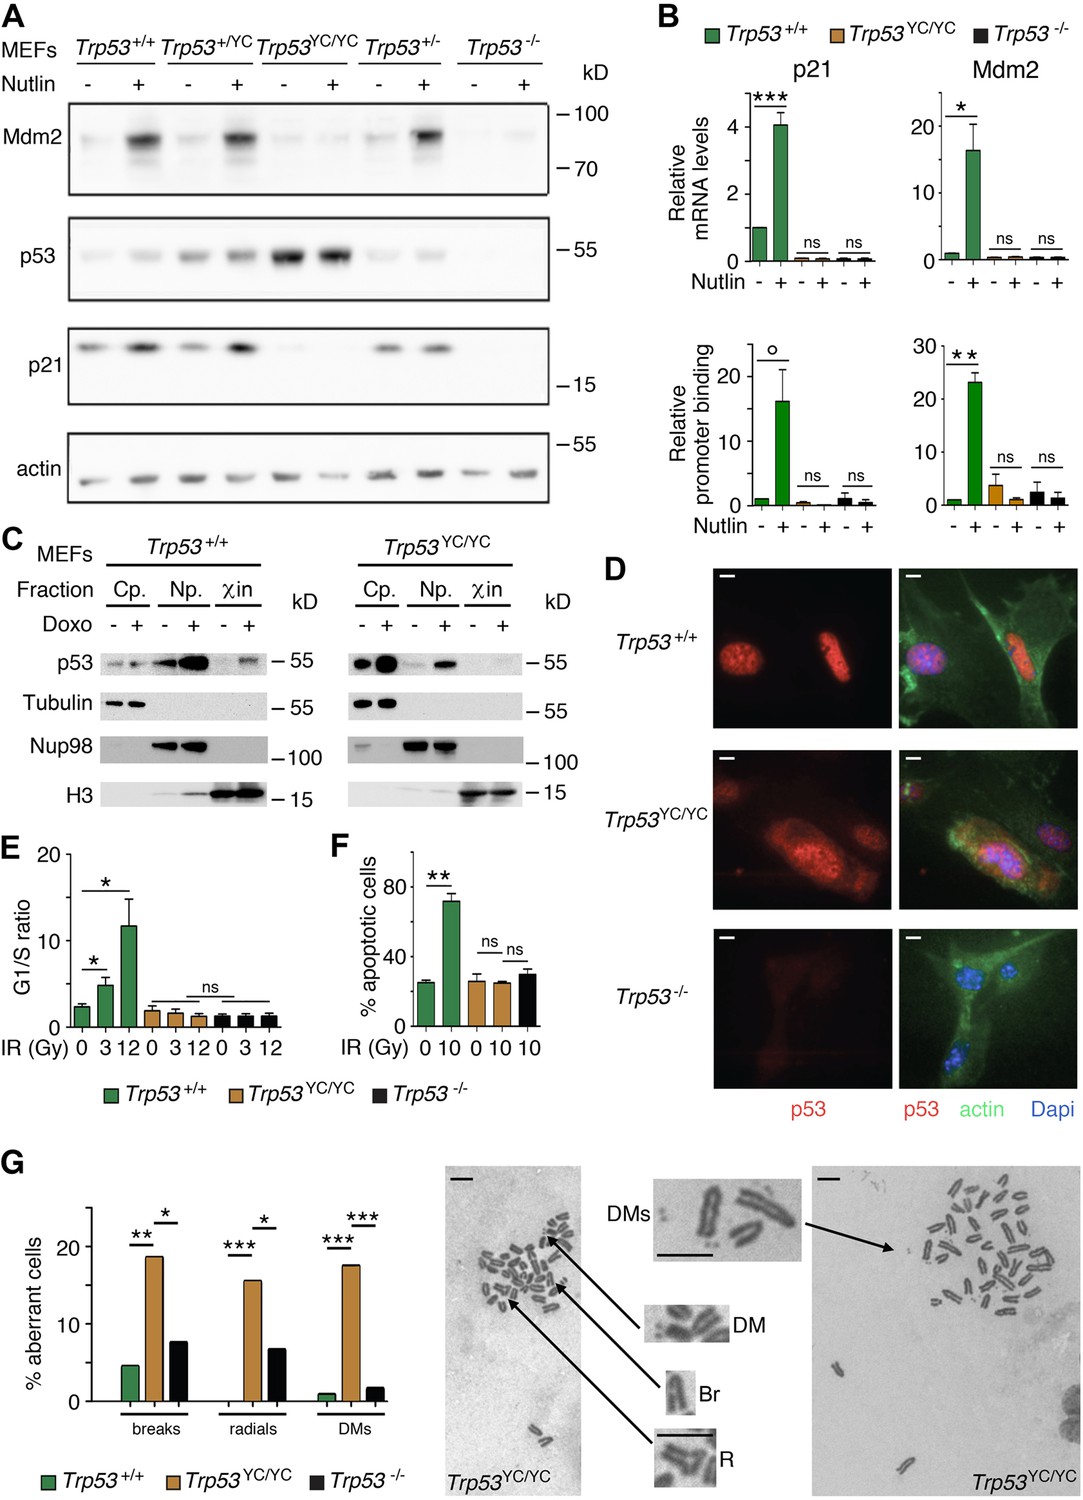
Trp53YC/YC cells exhibit alterations in p53 abundance and subcellular localization, defective responses to DNA damage, and increased chromosomal instability.
(A) Increased p53 protein levels in Trp53YC/YC and Trp53+/YC mouse embryonic fibroblasts (MEFs). MEFs of the indicated genotypes were treated or not with 10 μM Nutlin 3a for 24 hr, then protein extracts were immunoblotted with antibodies against Mdm2, p53, p21, and actin. (B) The transactivation of classical p53 target genes Cdkn1a and Mdm2 is impaired in Trp53YC/YC cells. Wildtype (WT), Trp53YC/YC, and Trp53-/- MEFs were treated as in (A), then (top) mRNAs were quantified in five to six independent experiments using real-time PCR, with results normalized to control mRNAs and mean RNA amounts in unstressed WT cells assigned a value of 1; or (bottom) ChIP assays were performed at the Cdkn1a and Mdm2 promoters in two to three independent experiments with an antibody against p53 or rabbit IgG as a negative control. Immunoprecipitates were quantified using real-time PCR, normalized to data over an irrelevant region, and the amount in unstressed WT cells was assigned a value of 1. Error bars: SEM. (C) Assessment of p53WT and p53Y217C subcellular localization by cellular fractionation. WT and Trp53YC/YC MEFs were treated or not with 1 μΜ doxorubicin (Doxo) for 24 hr, submitted to cellular fractionation, then protein extracts were immunoblotted with antibodies against p53 or the fraction controls Tubulin for cytoplasm (Cp.), Nup98 for nucleoplasm (Np.), and histone H3 for chromatin (χin). (D) Assessment of p53WT and p53Y217C subcellular localization by immunofluorescence. WT, Trp53YC/YC and Trp53-/- MEFs were treated with 10 μM Nutlin 3a for 24 hr, then stained with antibodies against p53 (red) or actin (green) and DNA was counterstained with DAPI (blue). (E) Absence of a cell cycle arrest response in Trp53YC/YC MEFs. Asynchronous cell populations of Trp53+/+, Trp53YC/YC, and Trp53-/- MEFs were analyzed 24 hr after 0, 3, or 12 Gy γ-irradiation. Means + SEM from three independent experiments. (F) Absence of a p53-dependent apoptotic response in Trp53YC/YC thymocytes. Age-matched mice of the indicated genotypes were left untreated or submitted to 10 Gy whole-body γ-irradiation then sacrificed after 4 hr and their thymocytes were stained with Annexin V-FITC and analyzed by FACS. Means + SEM from two independent experiments. (G) Increased chromosomal instability in Trp53YC/YC fibroblasts. Metaphase spreads were prepared from WT, Trp53YC/YC, and Trp53-/- MEFs at passage 4, then aberrant metaphases (with chromosome breaks, radial chromosomes, or double-minute chromosome [DMs]) were scored. Left: distribution of aberrant metaphases. Data from 110 WT, 97 Trp53YC/YC, or 119 Trp53-/- complete diploid metaphases, independently observed by two experimenters. Right: examples of two aberrant Trp53YC/YC metaphases: one with a DM, a chromosome break (Br) and a radial chromosome (R), the other with multiple DMs. Enlargements of regions of interest are presented between the two metaphases. Scale bars (D, G): 5 μm. ***p<0.001, **p<0.01, *p<0.05, °p=0.09, ns: non-significant by Student’s t (B, E, F) or Fisher’s (G) tests.
-
Figure 2—source data 1
Labeled files for gels and blots in Figure 2A and C.
- https://cdn.elifesciences.org/articles/102434/elife-102434-fig2-data1-v1.zip
-
Figure 2—source data 2
Raw and unedited gels and blots for Figure 2A and C.
- https://cdn.elifesciences.org/articles/102434/elife-102434-fig2-data2-v1.zip
Figure 2—figure supplement 1
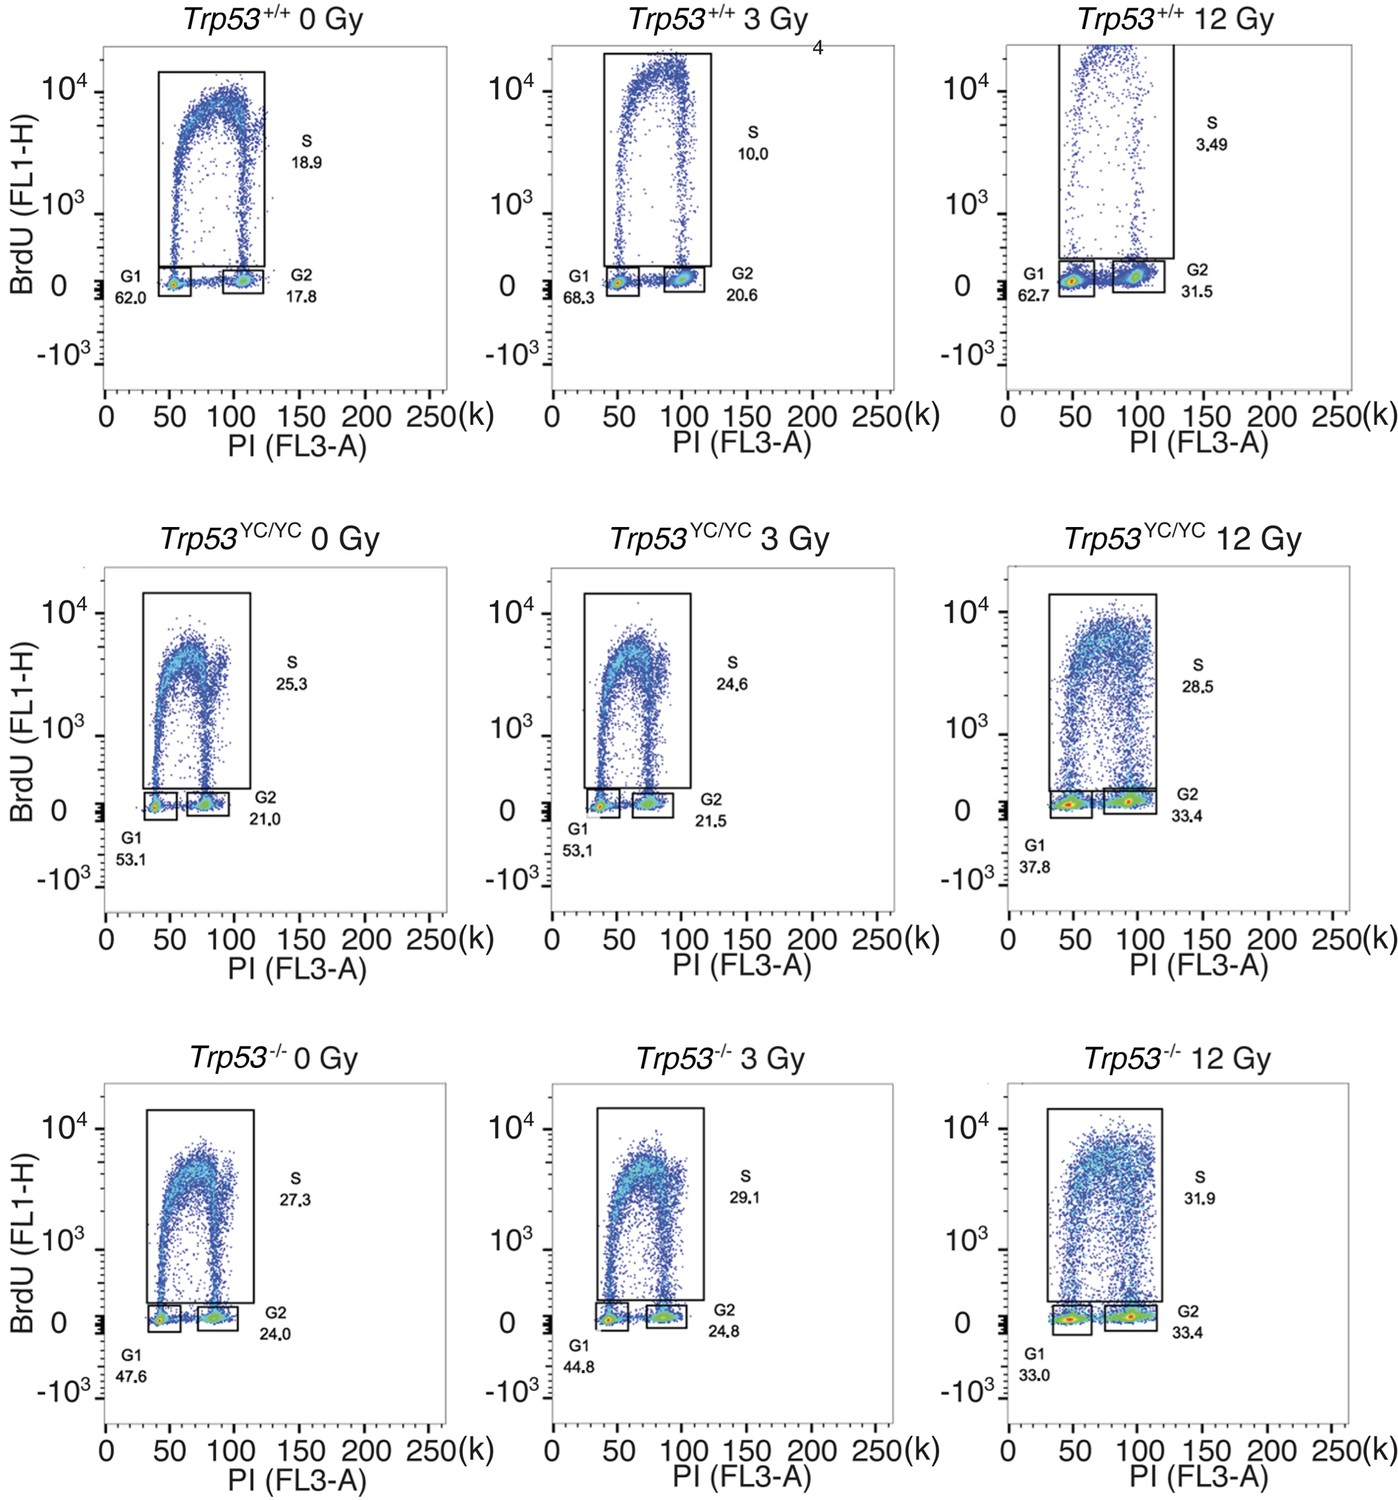
Cell cycle arrest responses of Trp53+/+, Trp53YC/YC, and Trp53-/- mouse embryonic fibroblasts (MEFs).
Asynchronous MEFs were exposed to 0–12 Gy γ-irradiation, then after 24 hr cells were labeled with BrdU for 1 hr and analyzed by FACS. A typical experiment for cells of each genotype and condition is shown, with % cells in G1, S, or G2/M mentioned in each panel.
Figure 2—figure supplement 2
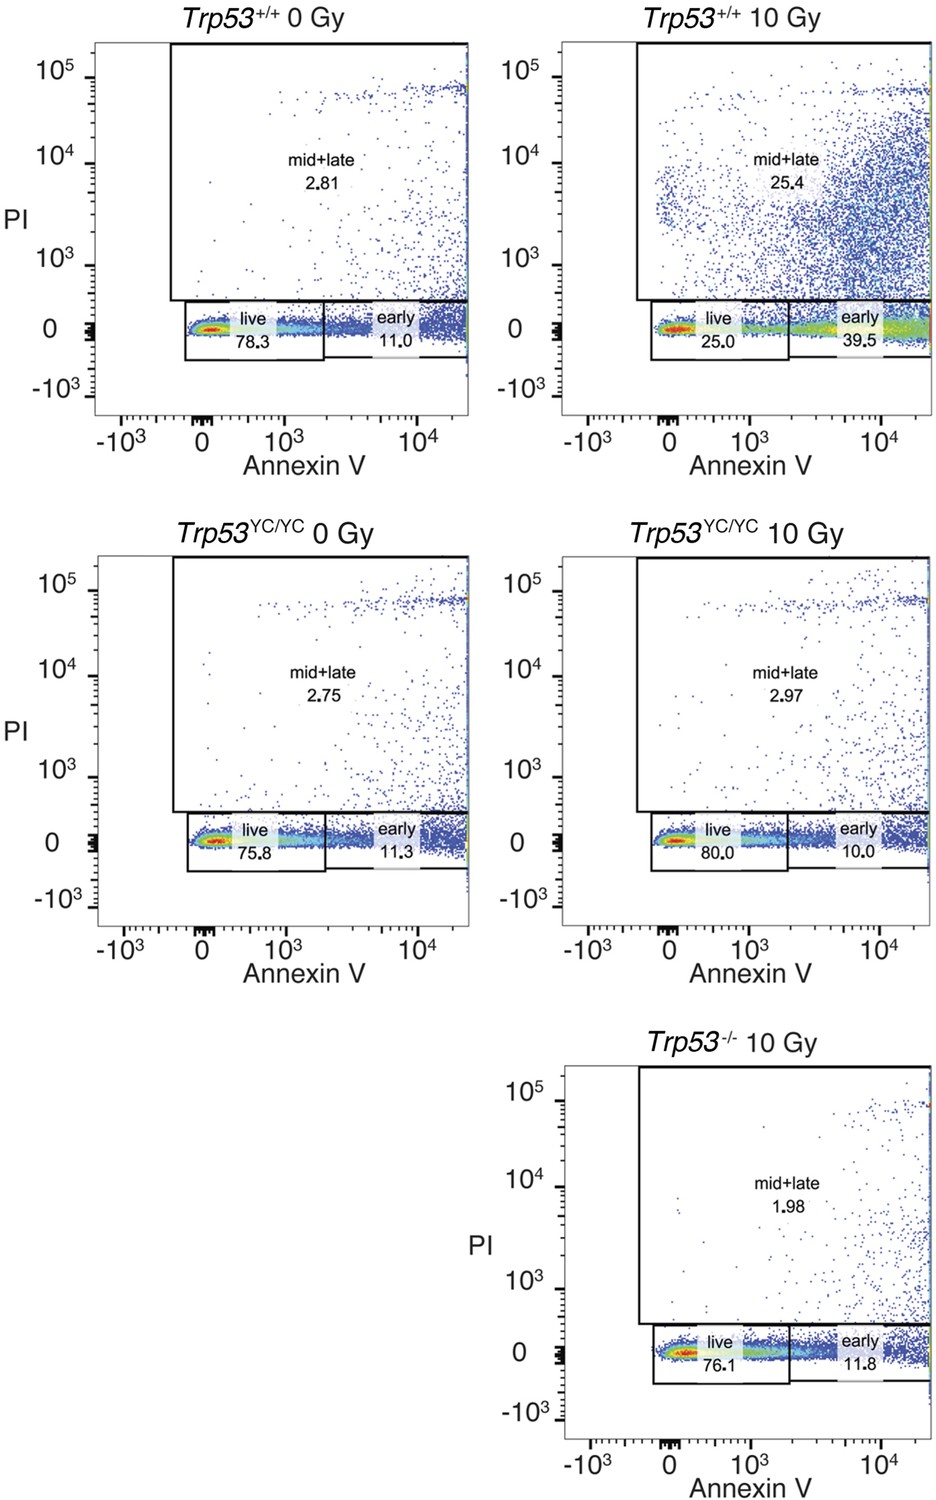
Apoptotic responses of Trp53+/+, Trp53-/-, and Trp53YC/YC thymocytes.
Mice were γ-irradiated (or not) and their thymocytes were recovered and analyzed by FACS after Annexin V-FITC staining. A typical experiment for cells of each genotype and condition is shown. Numbers indicate % cells either alive (live), early apoptotic (early), or mid to late apoptotic (mid + late).
Figure 2—figure supplement 3
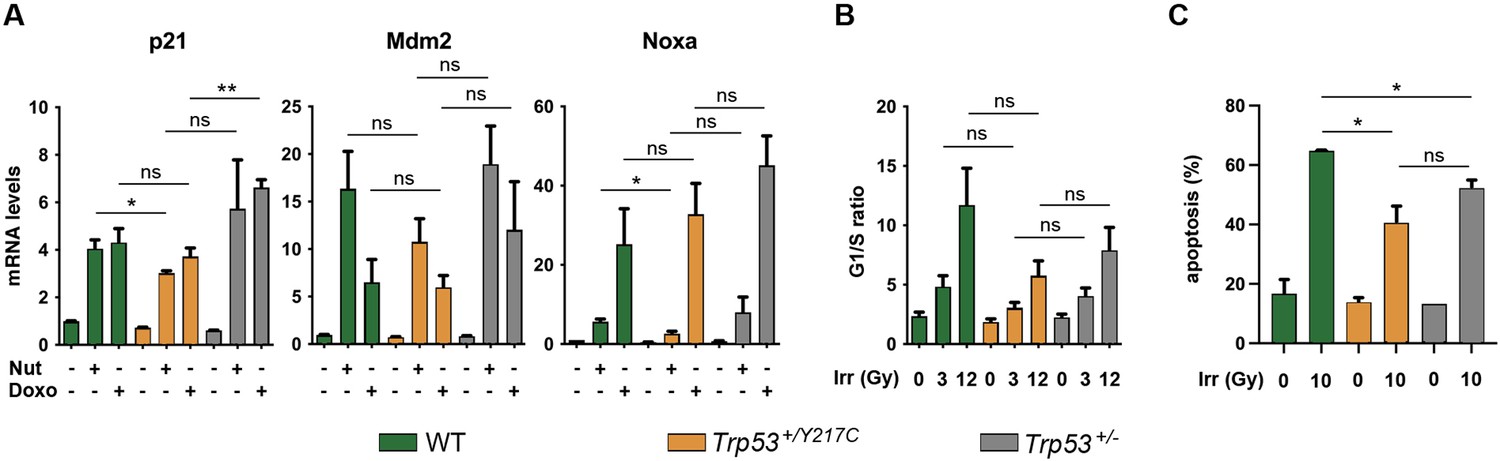
Comparison of stress responses in wildtype (WT), Trp53+/YC, and Trp53+/- cells.
(A) Transactivation of the classical p53 target genes Cdkn1a (alias p21), Mdm2, and Pmaip1 (alias Noxa) in response to Nutlin or Doxorubicin. WT, Trp53+/YC, and Trp53+/- mouse embryonic fibroblasts (MEFs) were treated or not with 10 μM Nutlin 3a (Nut) or 1 μM Doxorubicin (Doxo) for 24 hr, then mRNAs were quantified in ≥4 independent experiments using real-time PCR, with results normalized to control mRNAs and mean RNA amounts in unstressed WT cells assigned a value of 1. Means + SEM are shown. For each condition and gene, a dominant-negative effect (DNE) would lead to significant decrease in transactivation in Trp53+/YC MEFs compared to both WT and Trp53+/- MEFs, a result that was not observed. (B) Cell cycle arrest responses to γ-irradiation. Asynchronous cell populations of WT, Trp53+/YC, and Trp53+/- MEFs were analyzed 24 hr after 0, 3, or 12 Gy γ-irradiation. Means + SEM from three independent experiments. The comparison of cells submitted to identical irradiation doses revealed similar arrest responses in cells of all genotypes. (C) Apoptotic responses to γ-irradiation. WT, Trp53+/YC, and Trp53+/- MEFs age-matched mice were left untreated or submitted to 10 Gy whole-body γ-irradiation, then sacrificed after 4 hr and their thymocytes were stained with Annexin V-FITC and analyzed by FACS. Means + SEM from two independent experiments. The percentage of apoptotic cells was significantly higher in irradiated WT thymocytes compared to irradiated Trp53+/YC or Trp53+/- cells, whereas Trp53+/YC and Trp53+/- cells were not significantly different. **p<0.01, *p<0.05, ns: non-significant by Student’s t-test.
Figure 3 with 1 supplement
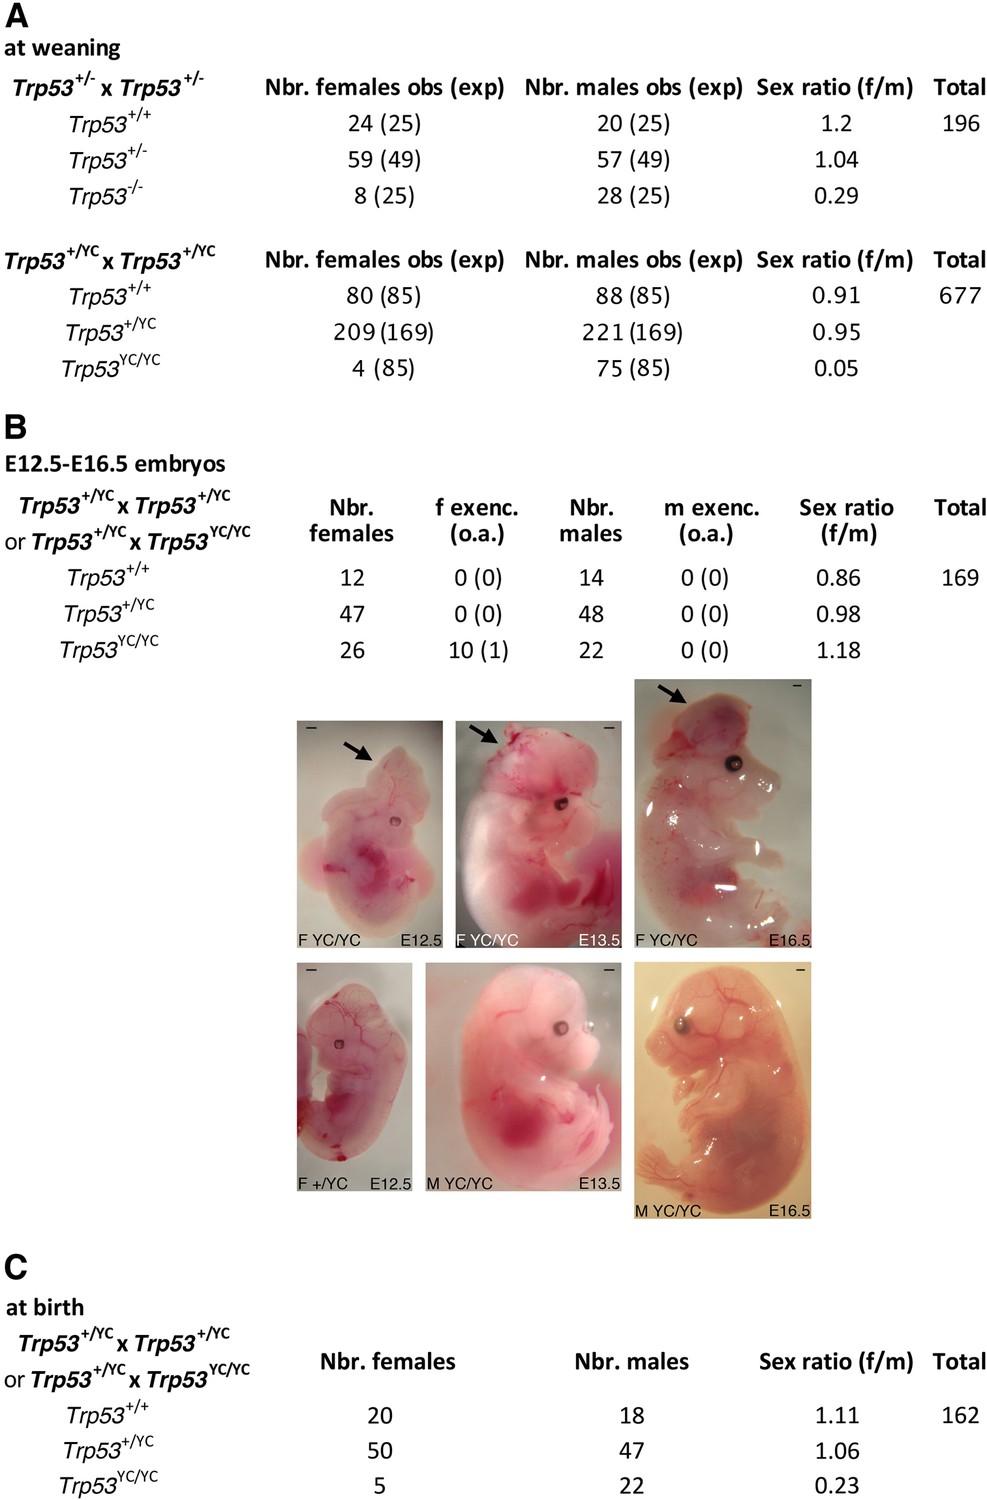
Trp53YC/YC mice exhibit female-specific perinatal lethality.
(A) Distribution of weaned mice obtained from Trp53+/- or Trp53+/YC intercrosses. Obs: observed numbers of mice at weaning (P21); exp: expected numbers assuming a Mendelian distribution without sex distortion; f/m: observed female/male ratios. Consistent with previous reports, the observed distribution of weaned mice from Trp53+/- intercrosses did not conform to values expected for a Mendelian distribution without sex distortion (U=5; χ2=16.31>15.09), indicating a significant deficit in female Trp53-/- mice (top). The distribution of weaned mice from Trp53+/YC intercrosses diverged even more from values for a Mendelian distribution without sex distortion (U=5; χ2=104.23>15.09), due to a striking deficit in female Trp53YC/YC mice (bottom). Differences between the frequencies of Trp53YC/YC (4/677) and Trp53-/- (8/196) females in the progeny, or between the female to male ratios for Trp53YC/YC (4/75) and Trp53-/- (8/28) animals, are statistically significant (p=0.0012 and p=0.0087 in Fisher’s tests, respectively). (B) Exencephaly is frequently observed in p53YC/YC female embryos. Top: the distribution of E12.5–16.5 embryos from heterozygous (Trp53+/YC) intercrosses or heterozygous-homozygous (Trp53+/YC × Trp53YC/YC) crosses is shown. f or m exenc.: number of female or male embryos with exencephaly; o.a.: embryos with other abnormalities. Below, examples of female Trp53YC/YC embryos at E12.5, E13.5, and E16.5 exhibiting exencephaly (arrows) are each shown (center) together with a normal embryo from the same litter (bottom). Scale bars : 1 mm. (C) Distribution of mice at birth from the indicated crosses. Of note, out of five Trp53YC/YC females observed at birth, only one remained alive at weaning age. Thus, the female/male ratio for weaned Trp53YC/YC animals from these crosses was 1/22, a ratio similar to the one observed in A (4/75).
Figure 3—figure supplement 1
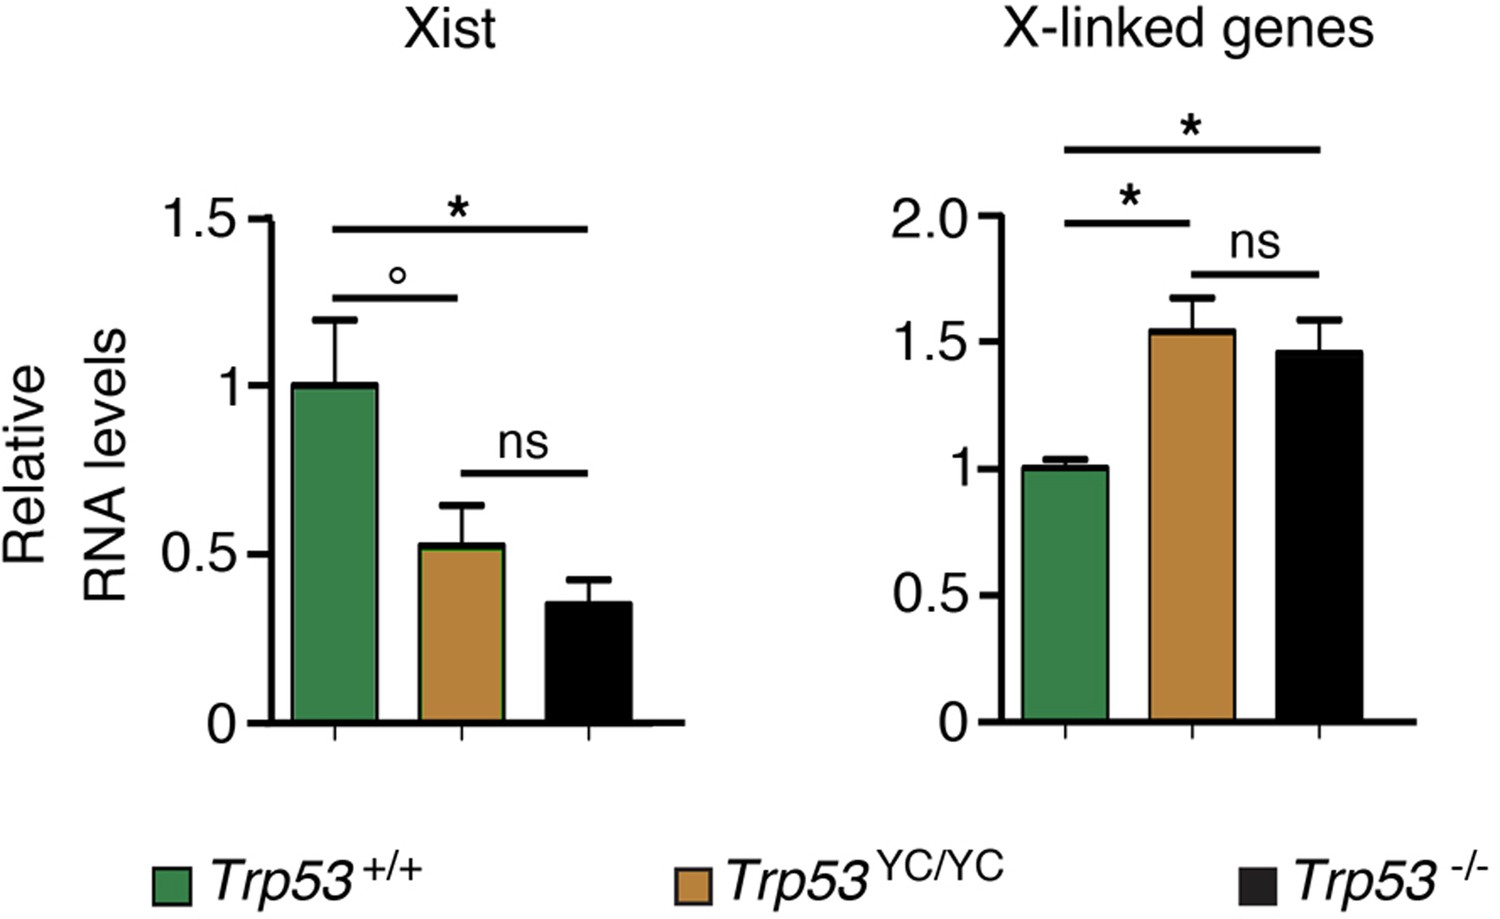
Evidence of aberrant chromosome X inactivation in Trp53YC/YC and Trp53-/- female embryos.
The expression of Xist and three X-linked genes (Maob, Usp9x, and Pls3) was quantified in neurospheres from two Trp53+/+, five Trp53YC/YC, and three Trp53-/- female embryos by using real-time PCR, with results normalized to control mRNAs and mean RNA amounts in wildtype (WT) neurospheres assigned a value of 1. Means + SEM are shown. *p<0.05, °p=0.09, ns: non-significant by Student’s t-tests.
Figure 4 with 3 supplements
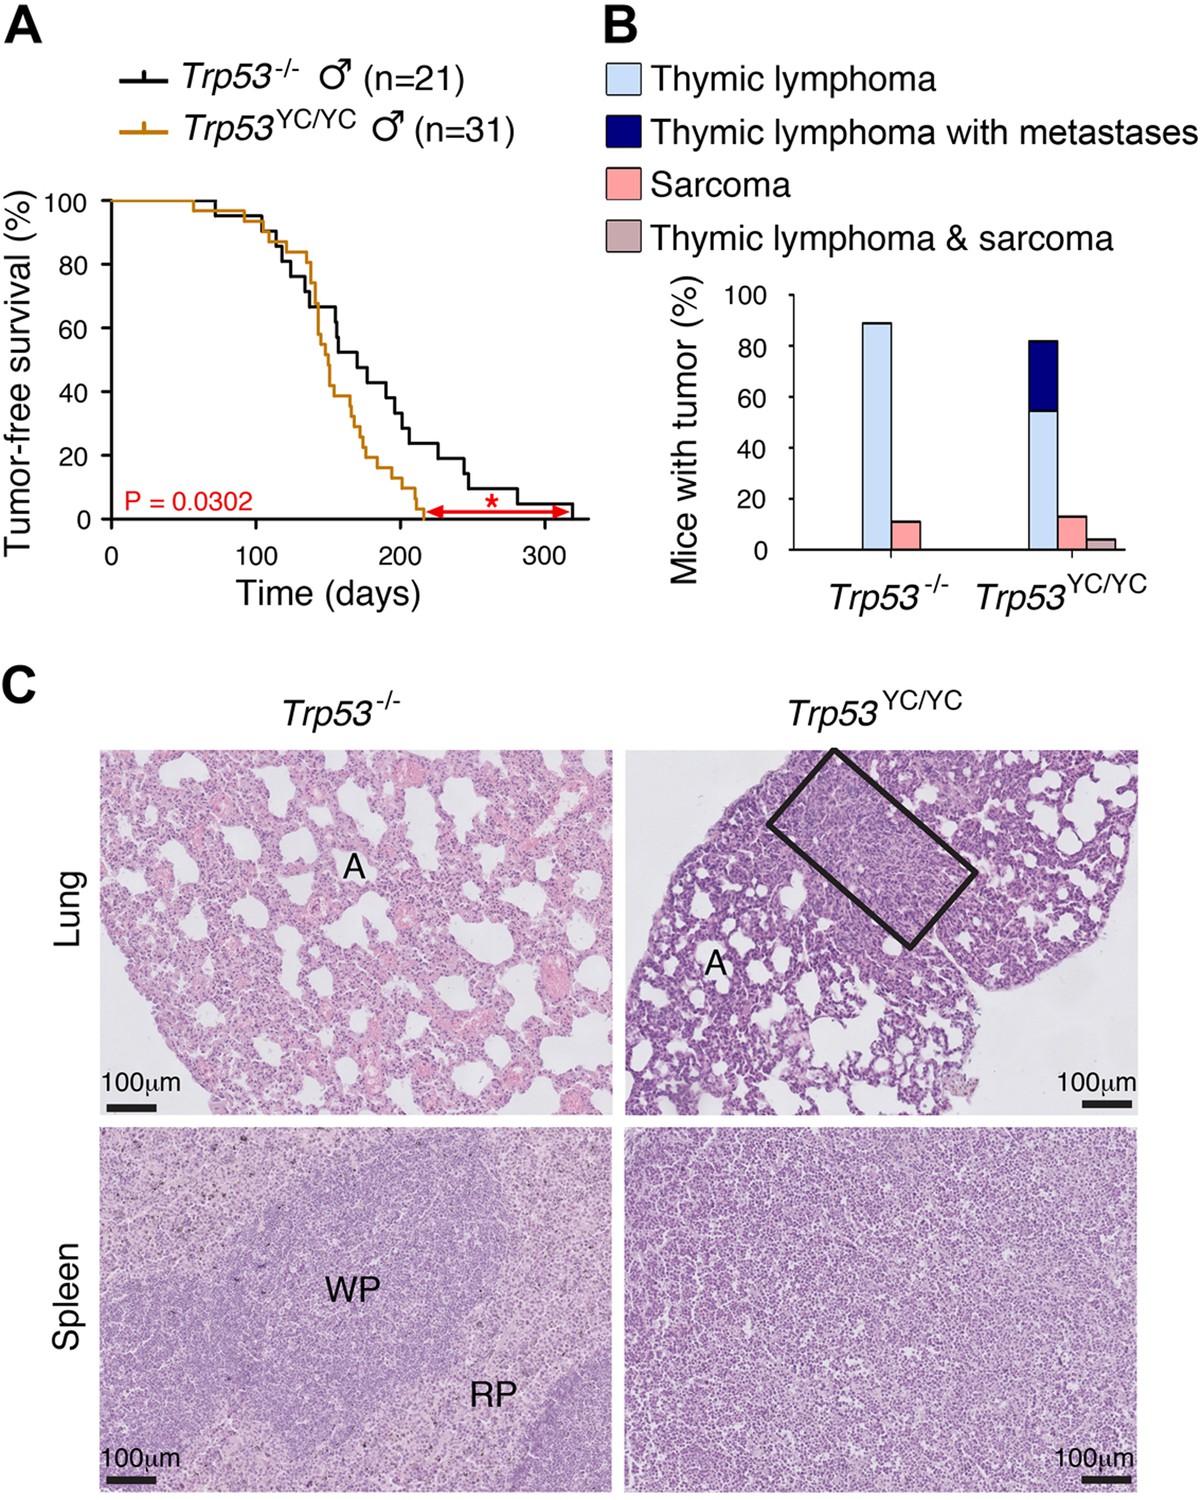
Oncogenic effects of the mutant protein in Trp53YC/YC male mice.
(A–B) In homozygous males, p53Y217C leads to accelerated tumor-induced death (A), and aggressive metastatic tumors (B); n=cohort size. (C) Hematoxylin and eosin (H&E) staining of sections from the lung (top) and spleen (bottom) of Trp53-/- and Trp53YC/YC male mice, showing metastases in Trp53YC/YC animals. Normal organ structures are shown, with ‘A’ indicating pulmonary alveoli, and ‘WP’ and ‘RP’ standing for splenic white and red pulp, respectively. In the lung section of the Trp53YC/YC mouse, the rectangle indicates a lymphoma area. In the spleen section of the Trp53YC/YC mouse, the typical splenic structures are absent due to massive tissue homogenization of the spleen by lymphoma cells.
Figure 4—figure supplement 1
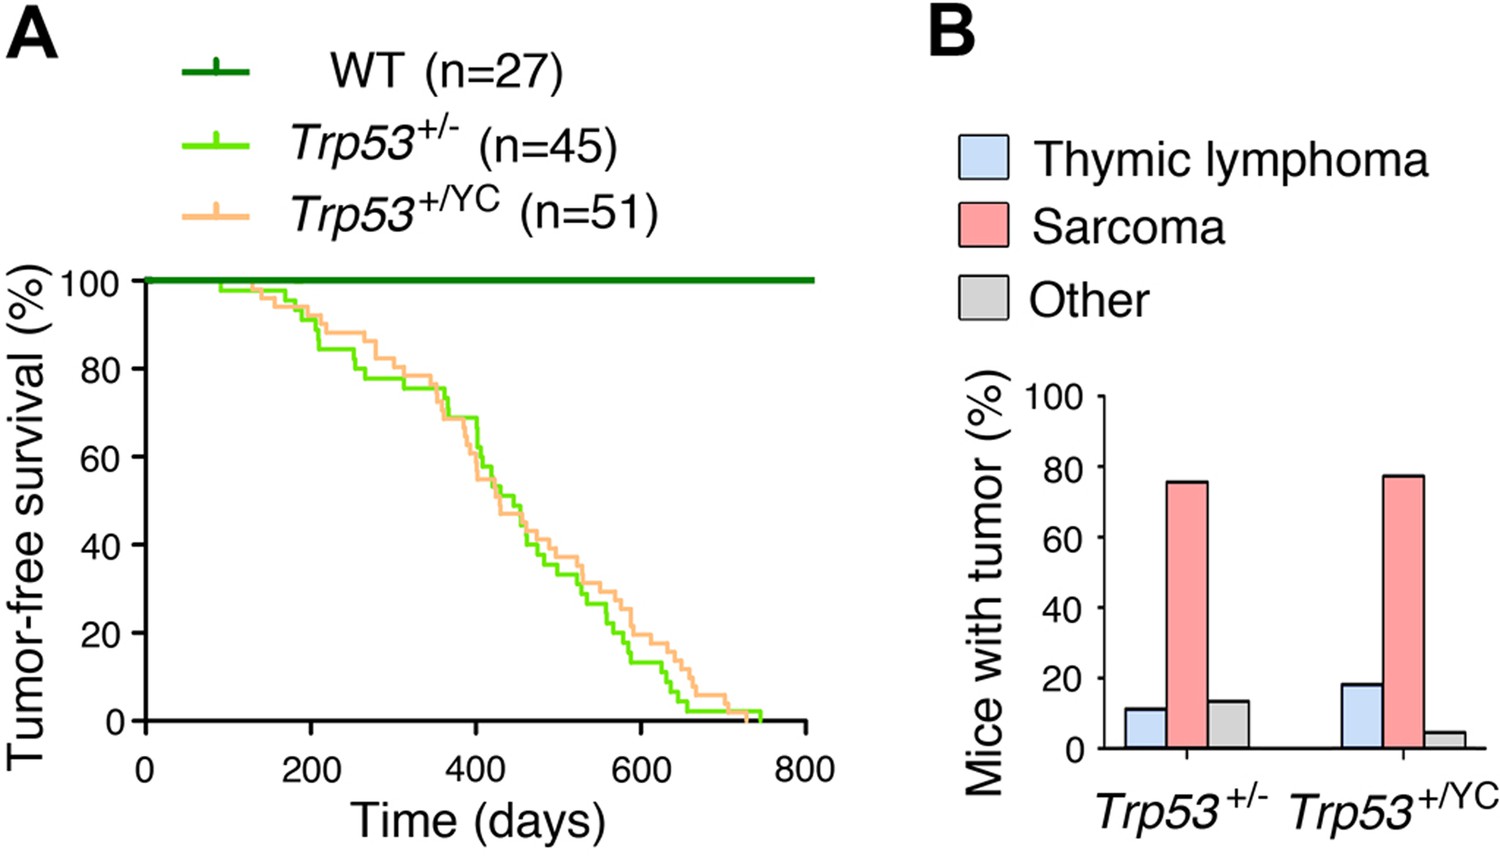
Trp53+/YC and Trp53+/- mice exhibit similar tumor onset and spectra.
No significant difference was observed between heterozygous Trp53+/- and Trp53+/YC mice, neither in spontaneous tumor onset and survival (A), nor in tumor spectra (B); n=cohort size. Mice of both sexes were included in this study.
Figure 4—figure supplement 2
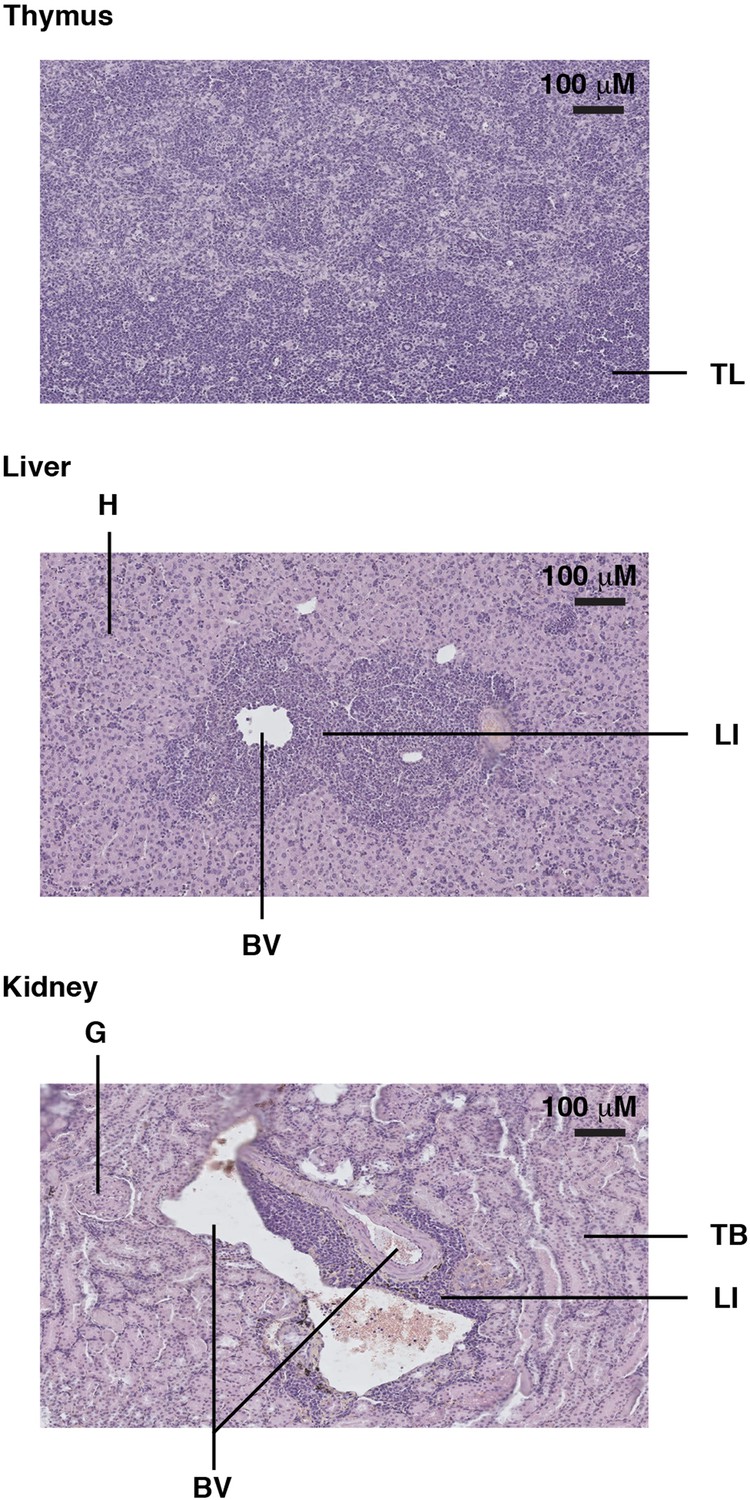
Example of a Trp53YC/YC mouse with a thymic lymphoma and lymphomatous infiltrates in the liver and kidney.
Hematoxylin and eosin (H&E) staining of sections from the thymus (top), liver (middle), and kidney (bottom) of a Trp53YC/YC male mouse, showing tumor lymphocytes (TL) in the thymus and lymphocyte infiltrates (LI) in the liver and kidney, near blood vessels (BV). Hepatocytes (H), kidney tubules (TB), and a glomerulus (G) are also indicated.
Figure 4—figure supplement 3
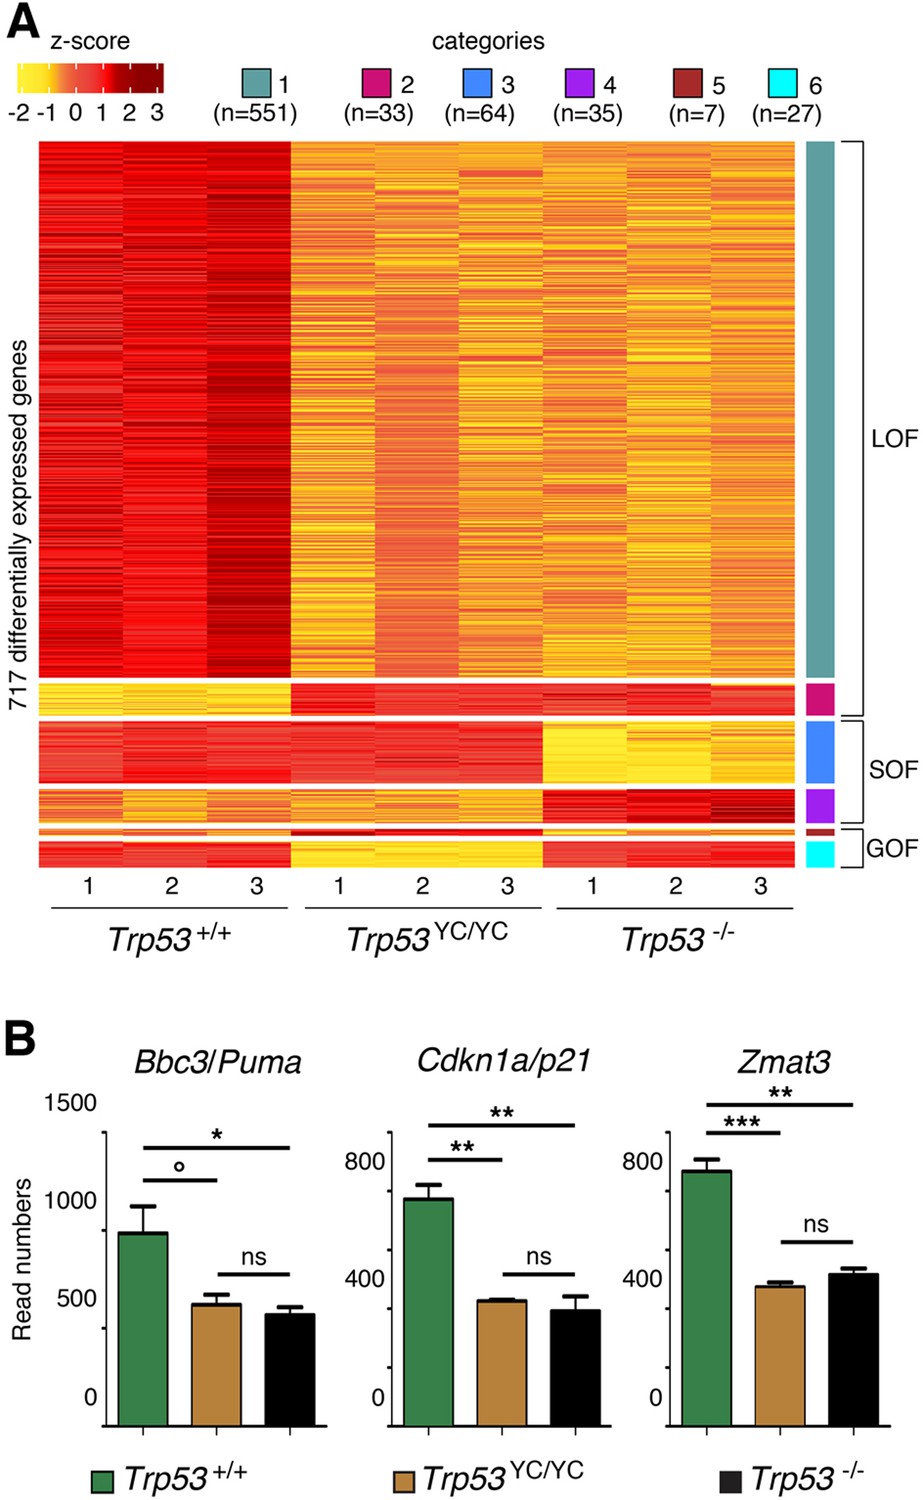
RNA-seq analysis from the thymi of 8-week-old Trp53+/+, Trp53YC/YC, and Trp53-/- male mice.
(A) Heat-map plot, with 717 differentially expressed genes suggestive of a loss of function (LOF), a separation of function (SOF), or a gain of function (GOF) for the p53Y217C mutant, ranked according to log2 fold change (n=number of genes). (B) Evidence of LOF in Trp53YC/YC cells for genes encoding Puma, p21, and Zmat3. Data from three mice per genotype. Means + SEM are shown. ***p<0.001, **p<0.01, *p<0.05, °p=0.07, ns: non-significant by Student’s t-tests.
Figure 5 with 3 supplements
Evidence of inflammation in Trp53YC/YC mice.
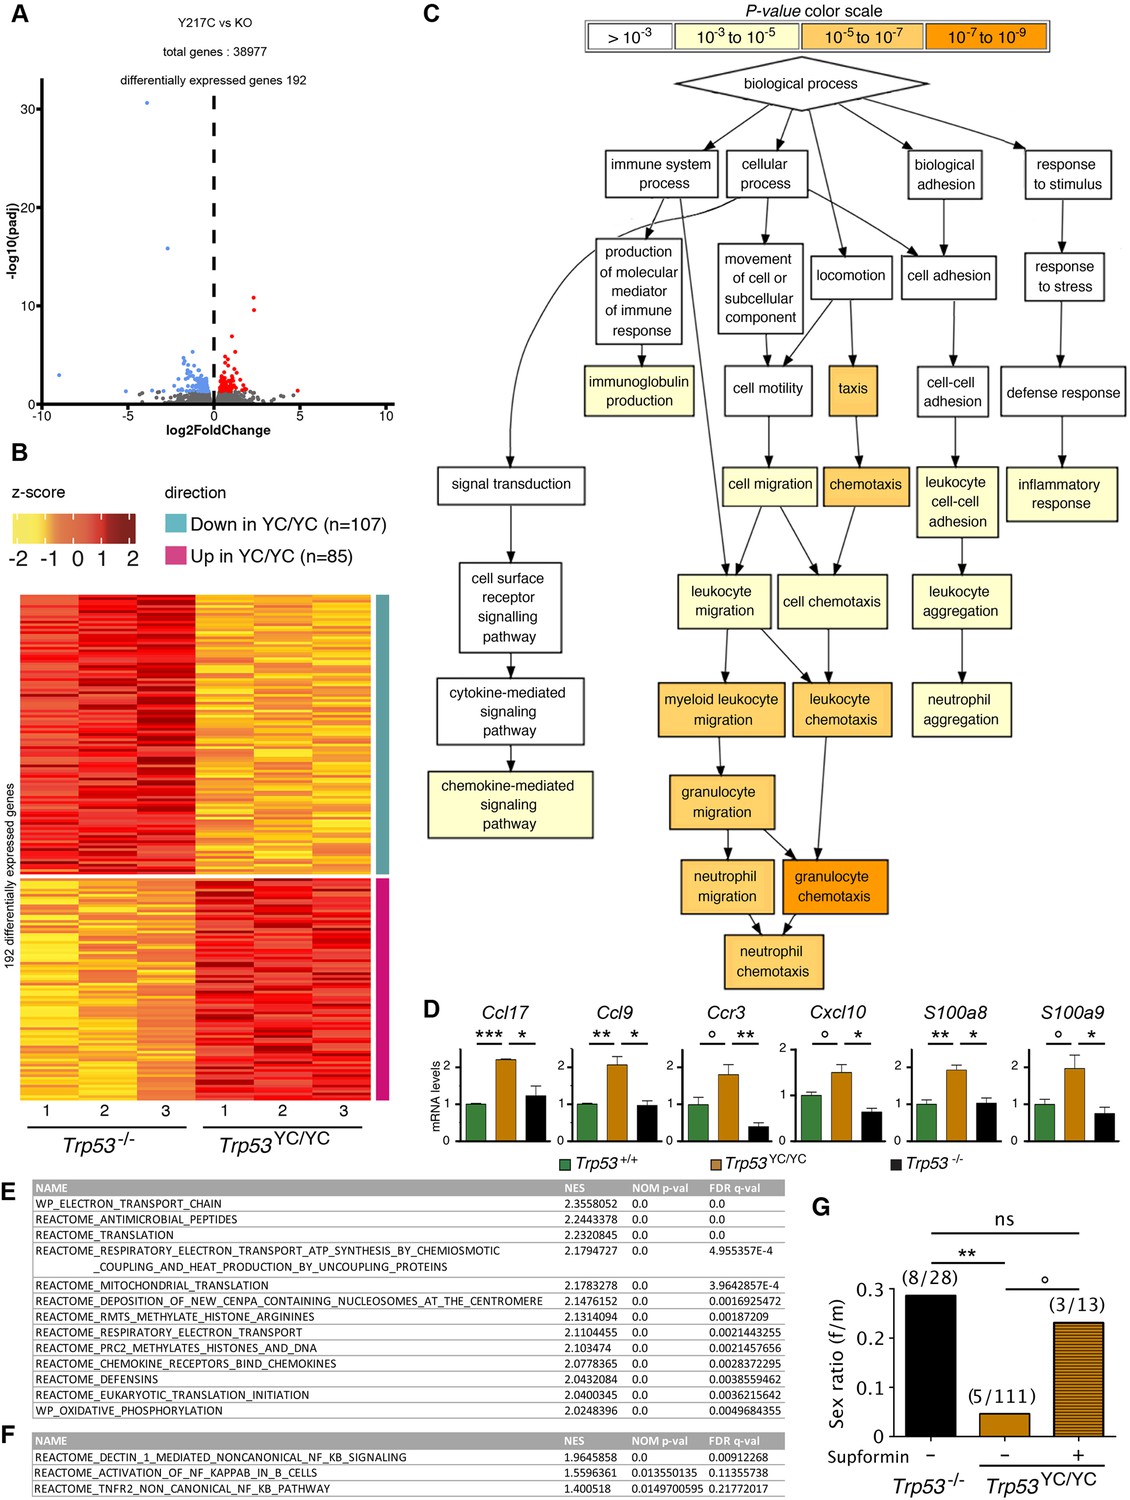
(A–B) RNA-seq analysis of thymi from Trp53YC/YC (n=3) and Trp53-/- (n=3) 8-week-old male mice. Volcano plot (A), with differentially expressed genes (DEGs), downregulated (blue) or upregulated (red) in Trp53YC/YC cells. Unsupervised clustering heat-map plot (B), with 192 DEGs ranked according to log2 fold changes. (C) Gene ontology (GO) analysis of DEGs. Out of 192 DEGs, 141 are associated with at least one GO term, according to the Gene Ontology enRIchment anaLysis and visuaLizAtion tool (GOrilla). For each GO term, enrichment was calculated by comparing with the full list of 19,759 genes associated with a GO term, and results are presented here with a color scale according to p-value of enrichment. This analysis mainly revealed an enrichment for genes associated with white blood cell chemotaxis/migration and inflammation, as shown here. Complete results of the analysis are presented in Figure 5—figure supplement 1. (D) RT-qPCR analysis of the indicated genes in thymi from 8-week-old Trp53+/+, Trp53YC/YC, and Trp53-/- male mice. Means + SEM (n=3 per genotype). ***p<0.001, **p<0.01, *p<0.05, °p<0.075 by Student’s t-test. (E) Gene set enrichment analysis (GSEA) of transcriptomes from Trp53YC/YC and Trp53-/- thymic cells. GSEA identified 13 gene sets enriched in Trp53YC/YC cells with normalized enrichment scores (NES)>2. Nominal p-values (NOM p-val) and false discovery rate q-values (FDR q-val) are indicated. (F) GSEA provides evidence of increased NC-NF-κB signaling in Trp53YC/YC male thymocytes. Results are presented as in (E). (G) Supformin (LCC-12), an anti-inflammatory molecule, increases the female to male ratio in Trp53YC/YC weaned pups. Trp53+/YC females were mated with Trp53YC/YC males, then oral gavage of pregnant females with 5 mg/kg supformin was performed on the 10th and 11th days post-coitum, and their progeny was genotyped at weaning. The female to male (f/m) ratio for Trp53YC/YC weaned pups that were exposed to supformin in utero (+) was compared to the f/m ratios for Trp53-/- or Trp53YC/YC weaned pups never exposed to supformin (-). Exposure to supformin led to a fivefold increase in the proportion of Trp53YC/YC weaned females. **p<0.01, °p=0.056, ns: non-significant by Fisher’s test.
Figure 5—figure supplement 1
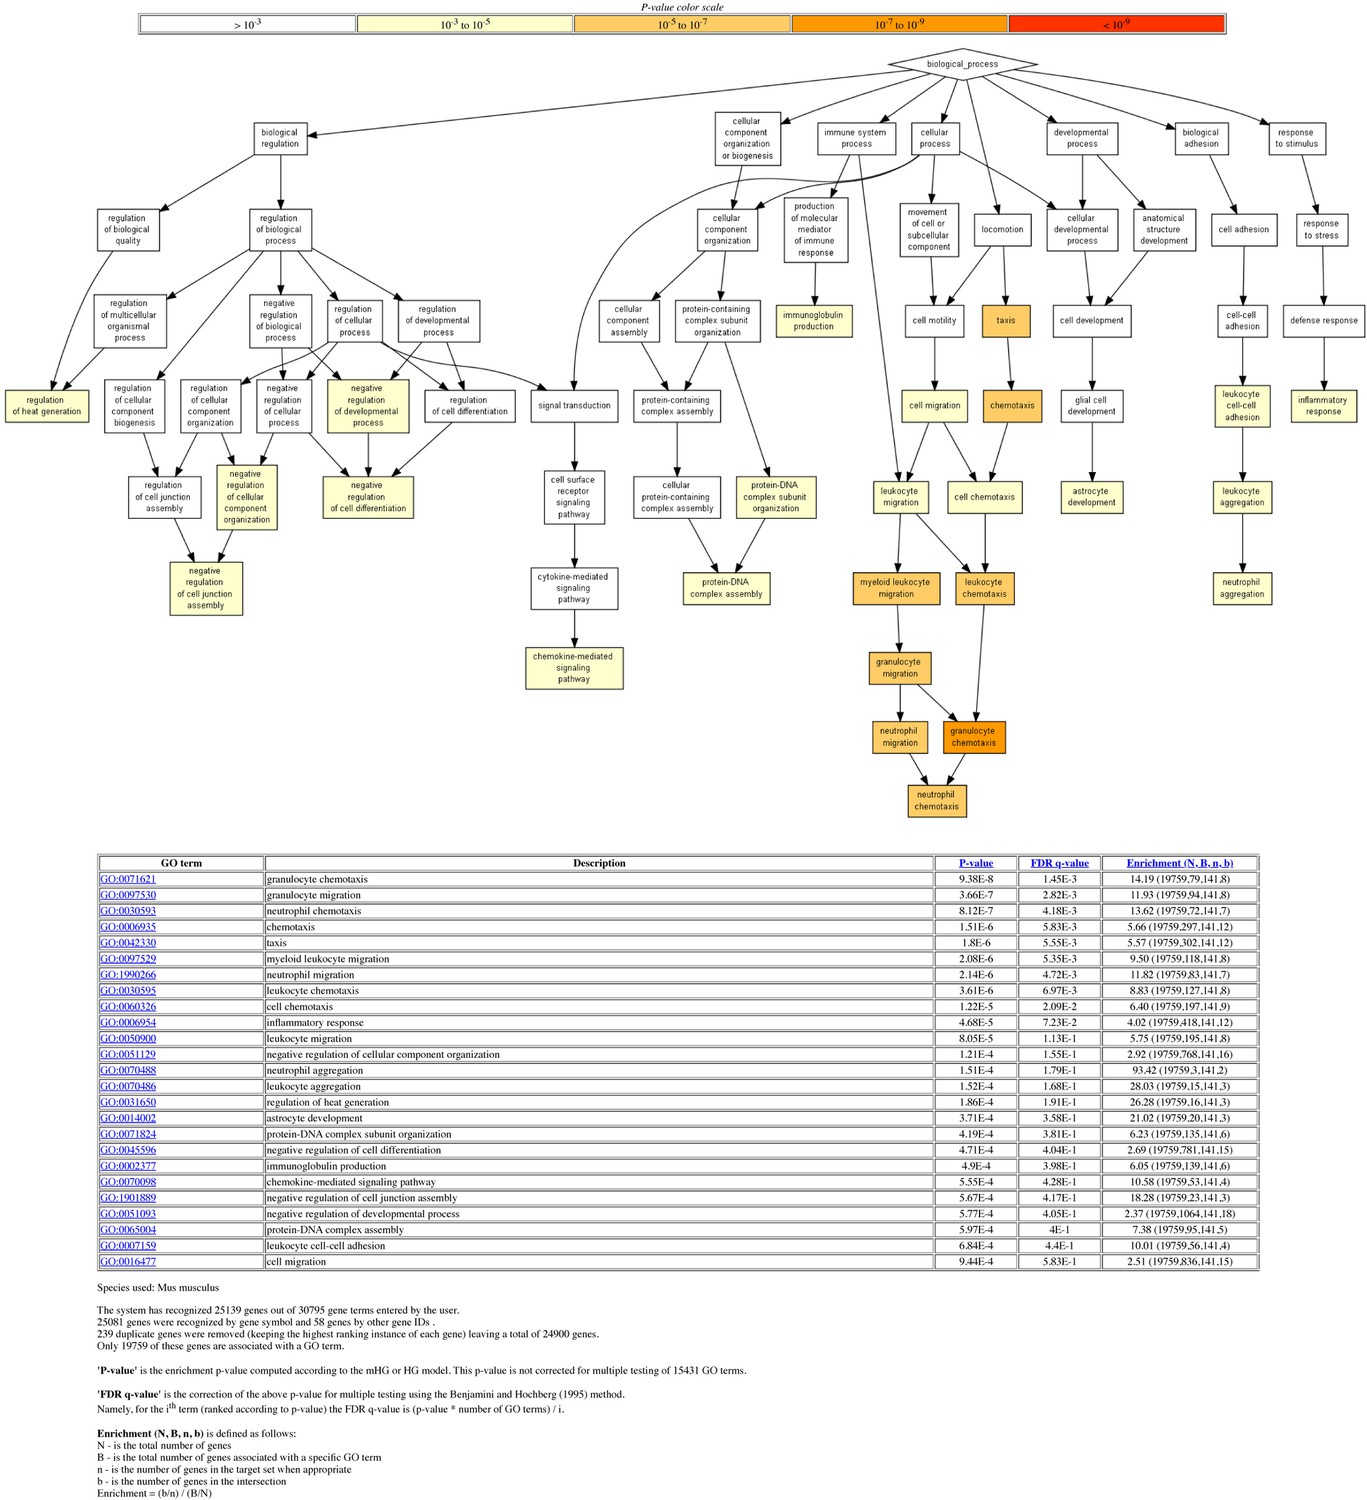
Gene ontology (GO) analysis of differentially expressed genes (DEGs).
The 192 DEGs between Trp53-/- and Trp53YC/YC thymocytes (Figure 5A) were analyzed with the Gene Ontology enRIchment anaLysis and visuaLizAtion tool (GOrilla). Out of 192 genes, 141 were associated with a GO term. For each GO term, enrichment was calculated by comparing with the full list of 19,759 genes associated with a GO term. For example, genes with GO term #0071621 (granulocyte chemotaxis) represent 79/19,759 genes associated with a GO term, but 8/141 of the identified DEGs, which represents a 14.19-fold enrichment.
Figure 5—figure supplement 2
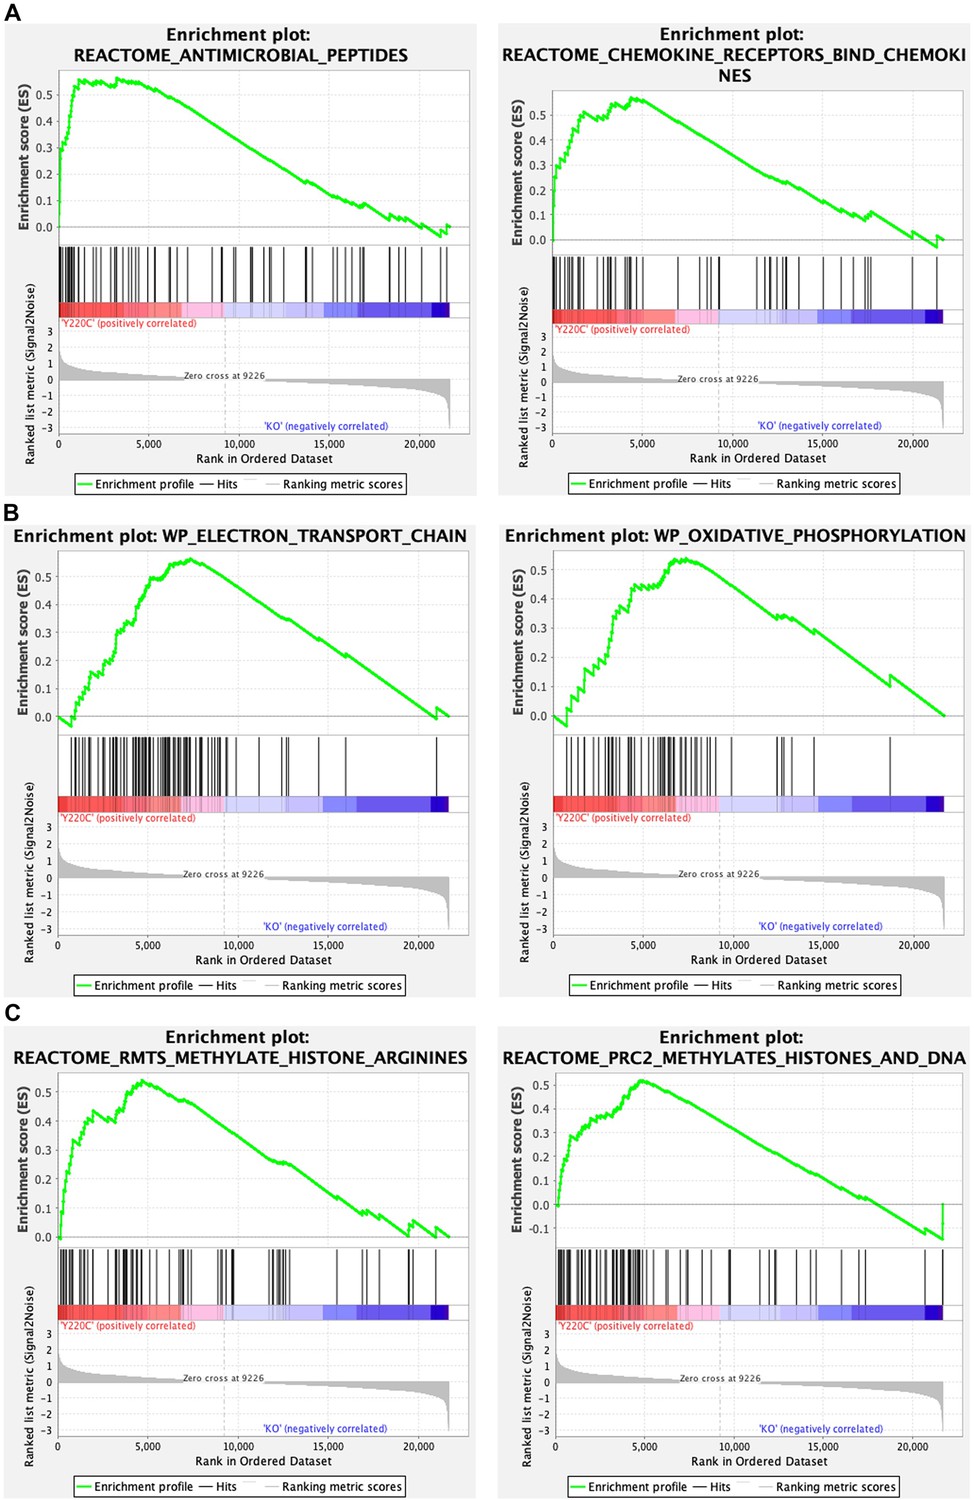
Gene set enrichment analysis (GSEA) of transcriptomes from Trp53Y217C/Y217C (Y220C) and Trp53-/- (KO) thymic cells: examples of GSEA enrichment plots.
Examples of GSEA enrichment plots indicating differences in immune responses (A), mitochondrial function (B), and chromatin plasticity (C) are shown.
Figure 5—figure supplement 3
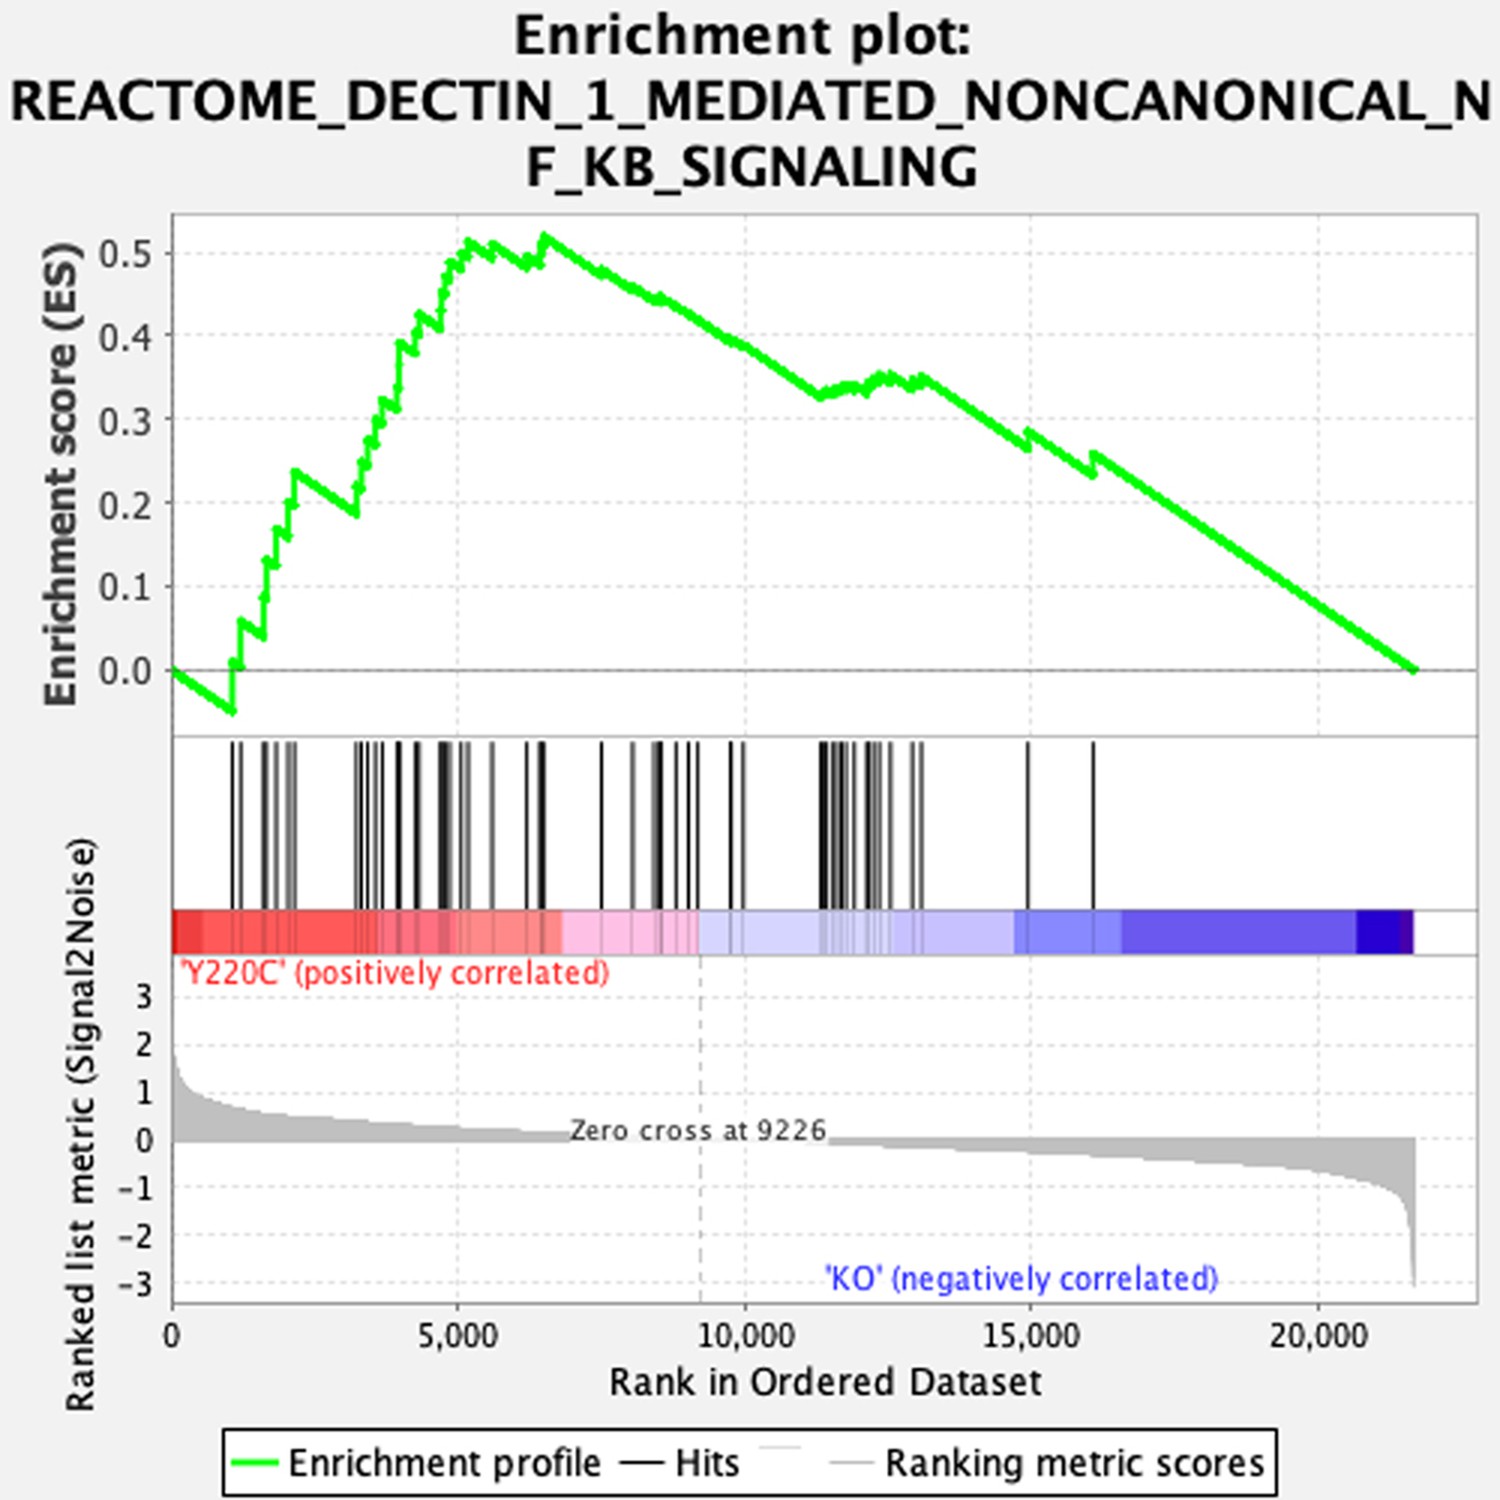
Gene set enrichment analysis (GSEA) enrichment plot showing increased NC-NF-κB signaling in Trp53YC/YC cells.
Transcriptomes from Trp53Y217C/Y217C (Y220C) and Trp53-/- (KO) thymic cells were compared by GSEA.
Tables
Table 1
Viability of Mdm2 or Mdm4 loss in a Trp53YC/YC background.
Mouse distributions from the indicated crosses were determined at weaning. As for Trp53+/YC intercrosses, these crosses yielded a deficit in weaned Trp53YC/YC females compared to Trp53YC/YC males (4/75 from Trp53+/YC intercrosses [Figure 3A]; 0/9 from crosses between Mdm4+/- Trp53+/YC and Mdm4+/- Trp53YC/YC mice; and 0/5 from mating Mdm2+/- Trp53+/YC mice with Mdm2+/- Trp53YC/YC or Mdm2-/- Trp53YC/YC animals). Trp53YC/YC females over Mdm4 or Mdm2 deficient or haploinsufficient backgrounds were also less frequent than their male counterparts, but the female/male ratio for Trp53YC/YC mice over a Mdm4+/- background (4/15) was significantly increased (p=0.04 when 4/75 and 4/15 ratios are compared in a Fisher’s test). Whether or not the female/male ratios for Trp53YC/YC mice were significantly increased over Mdm4-/- (1/6), Mdm2-/- (1/11), or Mdm2+/- (1/11) backgrounds remained uncertain due to limited animal numbers.
| Mdm4+/-Trp53YC/YC × Mdm4+/- Trp53+/YC | Nr. females | Nr. males | Sex ratio (f/m) | Total |
|---|---|---|---|---|
| Mdm4+/+Trp53+/YC | 8 | 11 | 0.73 | 88 |
| Mdm4+/+Trp53YC/YC | 0 | 9 | 0.00 | |
| Mdm4+/-Trp53+/YC | 15 | 19 | 0.79 | |
| Mdm4+/-Trp53YC/YC | 4 | 15 | 0.27 | |
| Mdm4-/-Trp53+/YC | 0 | 0 | NA | |
| Mdm4-/-Trp53YC/YC | 1 | 6 | 0.17 | |
| Mdm2+/-Trp53YC/YC × Mdm2+/-Trp53+/YCor Mdm2-/- Trp53YC/YC × Mdm2+/-Trp53+/YC | Nr. females | Nr. males | Sex ratio (f/m) | Total |
| Mdm2+/+Trp53+/YC | 3 | 0 | NA | 63 |
| Mdm2+/+Trp53YC/YC | 0 | 5 | 0.00 | |
| Mdm2+/-Trp53+/YC | 16 | 15 | 1.07 | |
| Mdm2+/-Trp53YC/YC | 1 | 11 | 0.09 | |
| Mdm2-/-Trp53+/YC | 0 | 0 | NA | |
| Mdm2-/-Trp53YC/YC | 1 | 11 | 0.09 |
Table 2
Evidence of dystocia in pregnant Trp53YC/YC females.
Results of the mating of two (a and b) Trp53YC/YC females (F) with a Trp53+/YC male (M) are shown. Both females were rapidly pregnant after encountering a male, but had to be sacrificed due to extended labor and pain during their first (female a) or third (female b) delivery.
| F Trp53YC/YC amated with M Trp53+/YC | |
|---|---|
| Litter 1 | |
| 1 pup born 23 days after mating was initiated, found dead (partially eaten) | |
| 24 hr later, mother is still in labor | |
| 48 hr later, another pup found dead in cage, the mother appeared in pain and was sacrificed | |
| F Trp53YC/YC bmated with M Trp53+/YC | |
| Litter 1 | |
| 2 pups born 24 days after mating was initiated: 1 found dead, 1 alive (F Trp53+/YC) | |
| Litter 2 | |
| 4 pups, all alive: 1 F Trp53+/YC, 3 M Trp53+/YC | |
| Litter 3 | |
| After extended labor (24 hr) pup fragments were found in cage, the mother in pain was sacrificed with pups still inside the womb |
Table 3
Effects of the Trp53Y217C mutation: a summary.
The comparison between Trp53-/- and Trp53Y217C/Y217C mice is presented. The phenotypes observed in Trp53-/- male (M) and female (F) mice result from p53 loss of function (LOF), whereas those observed in Trp53Y217C/Y217C mice result from p53 LOF as well as additional effects (gain of function [GOF] in bold). The + signs denote the presence of a phenotype. Xi: X chromosome inactivation.
| Trp53-/- (LOF) | Trp53Y217C/Y217C (LOF+GOF) |
| Spontaneous tumors (mostly thymic lymphomas), death in ≤1 year. ++ (M & F) | Spontaneous tumors (mostly thymic lymphomas) with metastases, death in ≤7 months +++ (only M were evaluated due to scarcity of F) inflammation in thymic cells |
| Perinatal lethality + (F only: Xi aberrations) | Perinatal lethality increased +++++ (F only: Xi aberrations and inflammation) F partial rescue by supformin |
| No dystocia (pregnant F) | Dystocia + (pregnant F) |
Key resources table
| Reagent type (species) or resource | Designation | Source or reference | Identifiers | Additional information |
|---|---|---|---|---|
| Gene (Mus musculus) | Trp53 | GenBank | ENSMUSG00000059552 | |
| Strain, strain background (M. musculus, both sexes) | Trp53Y217C (Trp53YC), C57Bl/6J | This paper | ‘Targeting in ES cells and genotyping’ | |
| Strain, strain background (M. musculus, females) | PGK-Cre, C57Bl/6J | Jackson Labs | B6.C-Tg(Pgk1-cre)1Lni/CrsJ | |
| Strain, strain background (M. musculus, both sexes) | Trp53-, C57Bl/6J | Jackson Labs | B6.129S2-Trp53tm1Tyj/J | |
| Strain, strain background (M. musculus, both sexes) | C57Bl/6J | Charles River Labs | ||
| Cell line (M. musculus, both sexes) | WT, Trp53+/YC, Trp53YC/YC, Trp53+/-, Trp53-/- fibroblasts | This paper | Primary fibroblasts from E13.5 embryos | ‘Cells and cell culture reagents’ |
| Cell line (M. musculus, females) | WT, Trp53YC/YC, Trp53-/- neurospheres | This paper | Neurospheres from E14.5 embryos | ‘Cells and cell culture reagents’ |
| Antibody | p53 (Rabbit polyclonal) | Novocastra | Leica NCL-p53-CM5p | 1/2000 |
| Antibody | p53 (Rabbit polyclonal) | Santa Cruz | FL-393 Sc 6243 | 50 μg |
| Antibody | p53 (Goat polyclonal) | R&D Systems | AF-1355 | 1/600 |
| Antibody | Mdm2 (Mouse monoclonal) | Abcam | 4B-2 | 1/500 |
| Antibody | p21 (Mouse monoclonal) | Santa Cruz | F-5 sc6246 | 1/200 |
| Antibody | Actin (Mouse monoclonal) | Santa Cruz | Actin-HRP sc47778 | 1/5000 |
| Antibody | Tubulin (Rabbit polyclonal) | Abcam | ab15568 | 1/1000 |
| Antibody | Nup98 (Rat monoclonal) | Abcam | ab50610 | 1/1000 |
| Antibody | Histone H3 (Rabbit polyclonal) | Abcam | ab1791 | 1/1000 |
| Sequence-based reagent | Trp53 (c) | This paper | Primer for genotyping | GTGTGTTGGCCATCTCTGTG; Figure 1 |
| Sequence-based reagent | Trp53 (d) | This paper | Primer for genotyping | AACCGGACTCAGCGTCTCTA; Figure 1 |
| Sequence-based reagent | Trp53-F | Fajac et al., 2024 | qPCR primer | AAAGGATGCCCATGCTACAGA; Figure 1 |
| Sequence-based reagent | Trp53-R | Fajac et al., 2024 | qPCR primer | TCTTGGTCTTCAGGTAGCTGGAG; Figure 1 |
| Sequence-based reagent | Ccl17-F | This paper | qPCR primer | GCTGGTATAAGACCTCAGTGGAGTGT; Figure 5 |
| Sequence-based reagent | Ccl17-R | This paper | qPCR primer | GCTTGCCCTGGACAGTCAGA; Figure 5 |
| Sequence-based reagent | Ccl9-F | This paper | qPCR primer | GCACAGCAAGGGCTTGAAA; Figure 5 |
| Sequence-based reagent | Ccl9-R | This paper | qPCR primer | CAGGCAGCAATCTGAAGAGTCTT; Figure 5 |
| Sequence-based reagent | S100a8-F | This paper | qPCR primer | TCCTTTGTCAGCTCCGTCTTC; Figure 5 |
| Sequence-based reagent | S100a8-R | This paper | qPCR primer | GACGGCATTGTCACGAAAGAT; Figure 5 |
| Peptide, recombinant protein | Superscript IV | Invitrogen | TF #18090010 | |
| Commercial assay or kit | Nucleospin RNA II | Macherey-Nagel | FS #NZ74095520 | |
| Commercial assay or kit | Power SYBR Green | Applied Biosystems | #4367659 | |
| Commercial assay or kit | Supersignal West Femto | Thermo Fisher | #34096 | |
| Commercial assay or kit | Annexin V-FITC apoptosis staining/ detection kit | Abcam | #Ab14085 | |
| Commercial assay or kit | TruSeq Stranded Total RNA | Illumina | #20020596 | |
| Chemical compound, drug | Nutlin 3a | Sigma-Aldrich | #SML-0580 | |
| Chemical compound, drug | Doxorubicin | Sigma-Aldrich | #D1515 | |
| Chemical compound, drug | Supformin | Solier et al., 2023 | ||
| Software, algorithm | FlowJo | Beckton-Dickinson | RRID:SCR_008520 | 10.10 |
| Software, algorithm | featureCounts | Liao et al., 2014 | ||
| Software, algorithm | DESeq2 R package | Love et al., 2014 | ||
| Software, algorithm | GOrilla | Eden et al., 2009 | ||
| Software, algorithm | GSEA software | Subramanian et al., 2005 | ||
| Software, algorithm | Prism | GraphPad | RRID:SCR_002798 | 5.0 |
Additional files
-
Supplementary file 1
Differentially expressed genes between wildtype (WT), Trp53Y217C/Y217C (YC), and Trp53-/- (KO) thymocytes from age-matched animals.
Most differentially expressed genes correspond to a loss of function (LOF) in the p53Y217C mutant (categories 1 and 2, see Figure 4—figure supplement 3A), but genes corresponding to a separation of function (SOF, categories 3 and 4) or a gain of function (GOF, categories 5 and 6) were also observed.
- https://cdn.elifesciences.org/articles/102434/elife-102434-supp1-v1.xlsx
-
Supplementary file 2
A DESeq analysis of RNA-seq data from Trp53-/- (KO) and Trp53Y217C/Y217C (YC) thymi revealed 192 differentially expressed genes.
As shown in Figure 5B, 107 genes (in bold) were less expressed and 85 genes were more expressed in Trp53YC/YC cells compared to Trp53-/- cells.
- https://cdn.elifesciences.org/articles/102434/elife-102434-supp2-v1.xlsx
-
Supplementary file 3
Ccl17, Ccl9, Ccr3, Cxcl10, S100a8, and S100a9 are associated with gene ontology (GO) terms of white blood cell migration/chemotaxis and inflammation.
- https://cdn.elifesciences.org/articles/102434/elife-102434-supp3-v1.xlsx
-
Supplementary file 4
Distribution of weaned pups after mating Trp53+/YC females with Trp53YC/YC males and oral gavage of pregnant females with supformin.
Due to the gavage of pregnant mothers, all the pups born in this experiment were exposed to supformin in utero (SIU+).
- https://cdn.elifesciences.org/articles/102434/elife-102434-supp4-v1.xlsx
-
Supplementary file 5
Primers used in this study.
- https://cdn.elifesciences.org/articles/102434/elife-102434-supp5-v1.docx
-
MDAR checklist
- https://cdn.elifesciences.org/articles/102434/elife-102434-mdarchecklist1-v1.docx
Download links
A two-part list of links to download the article, or parts of the article, in various formats.
Downloads (link to download the article as PDF)
Open citations (links to open the citations from this article in various online reference manager services)
Cite this article (links to download the citations from this article in formats compatible with various reference manager tools)
Oncogenic and teratogenic effects of Trp53Y217C, an inflammation-prone mouse model of the human hotspot mutant TP53Y220C
eLife 13:RP102434.
https://doi.org/10.7554/eLife.102434.3


