High-resolution deep mutational scanning of the melanocortin-4 receptor enables target characterization for drug discovery
- Octant, Inc, United States
- Department of Human Genetics and Department of Computational Medicine, University of California, Los Angeles, United States
- Howard Hughes Medical Institute, United States
Figures
Figure 1 with 2 supplements
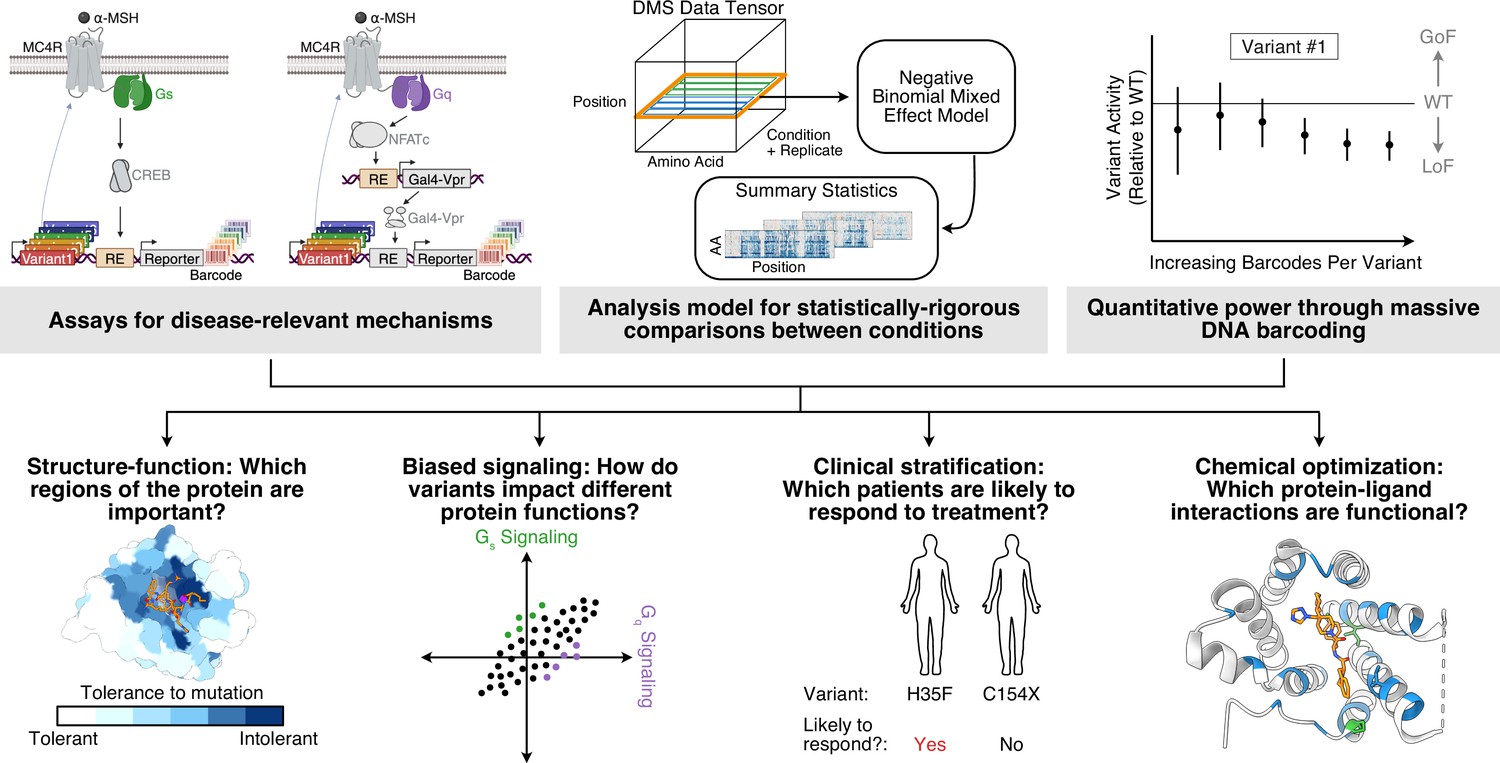
Highly quantitative Deep Mutational Scanning (DMS) methods for drug discovery applications.
Top: DMS experimental and analysis methods improvements reported in this paper. Bottom: Questions commonly encountered in drug discovery and development that can be addressed by improved DMS methodology. Panel A created with BioRender.com.
Figure 1—figure supplement 1
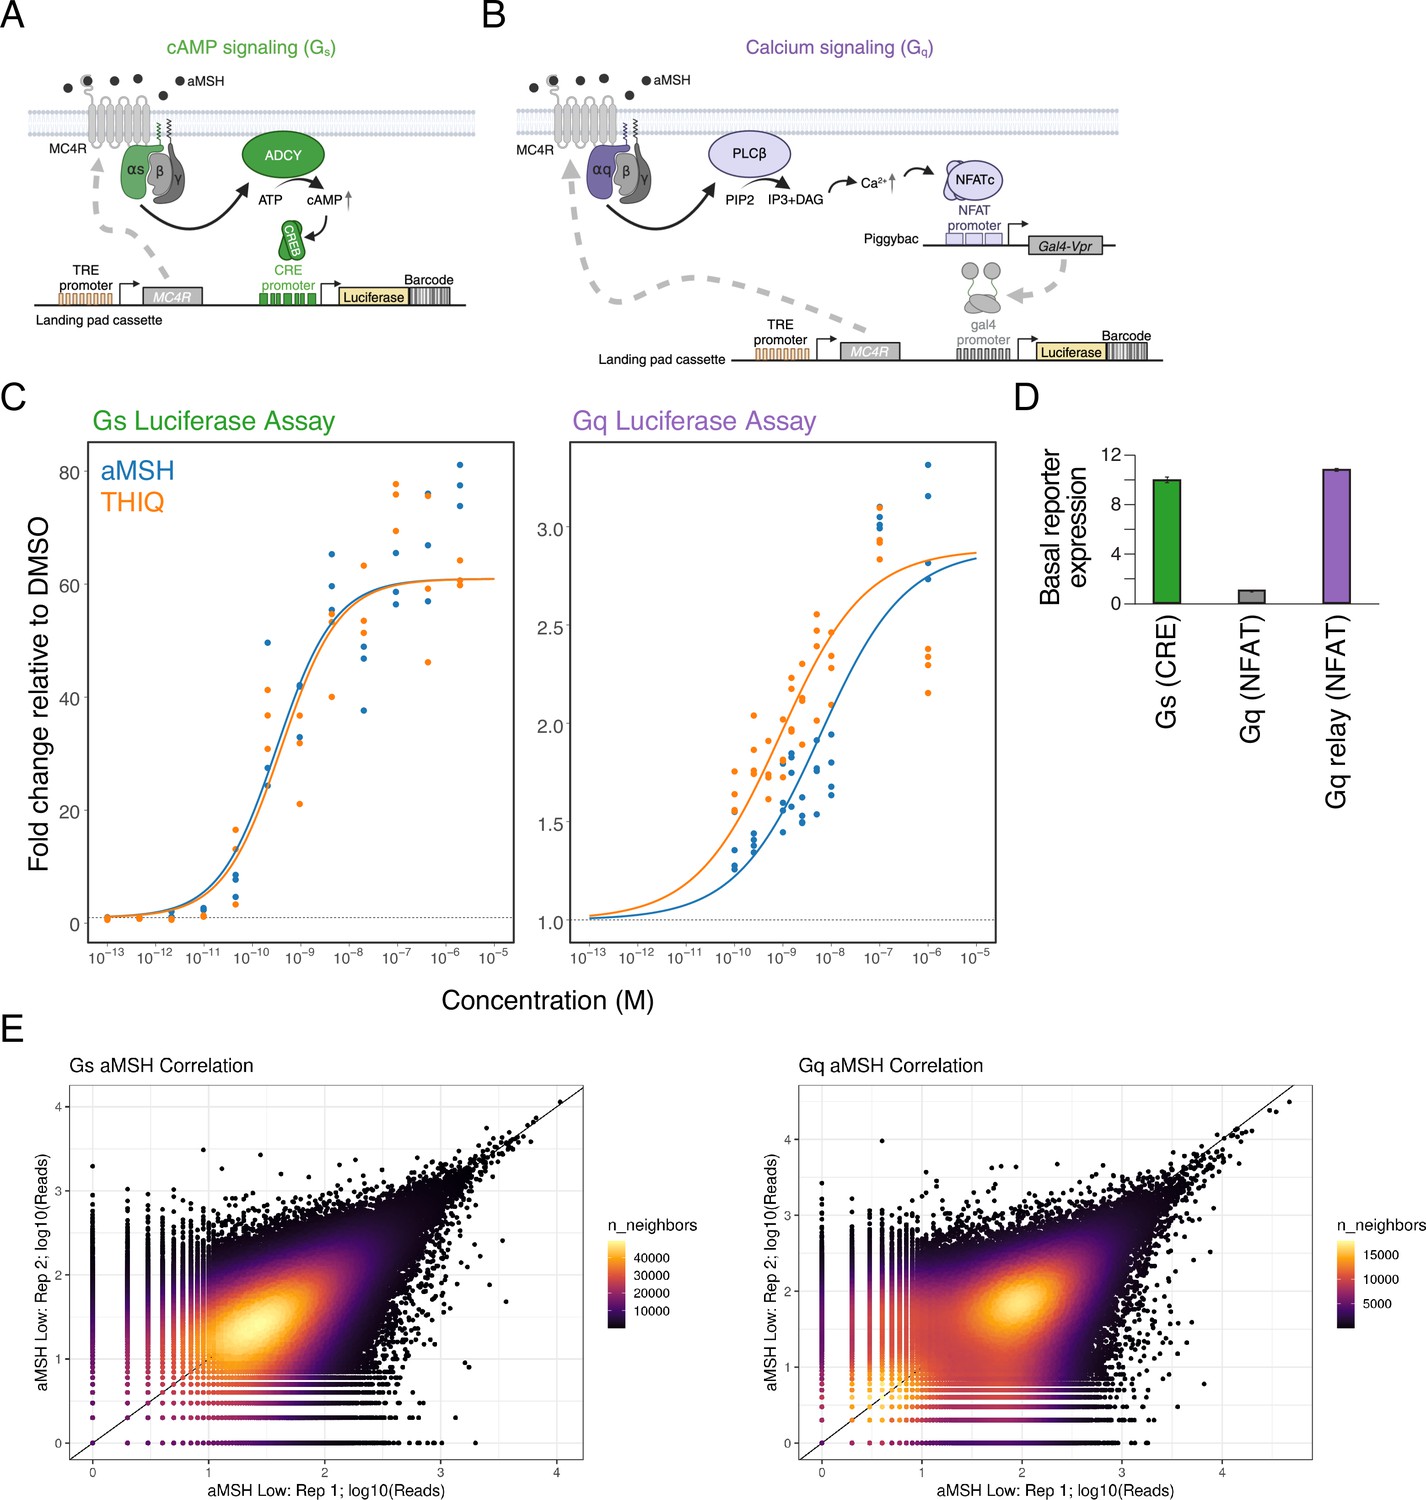
Methods development detail.
(A, B) Detailed cartoons of reporters for cAMP (Gs) signaling (A) and calcium (Gq) signaling (B). Panel A and B created with BioRender.com. (C) Luciferase assays used to determine agonist (α-MSH and THIQ) dose ranges for the DMS experiments. For each reporter (Gs, Gq), we fit a three-parameter log-logistic with the bottom of the curve fixed to the DMSO mean. We shared the slope and Emax parameter between α-MSH and THIQ, and let the EC50 parameter vary between the drugs. (D) Basal reporter gene expression for the Gs (CRE) reporter, the Gq (NFAT) reporter, and the Gq relay (NFAT) reporter. Error bars are +/- (E) Correlation of sequence read counts of each barcode for two experimental replicates each of the Gs (left) and Gq (right) DMS assays.
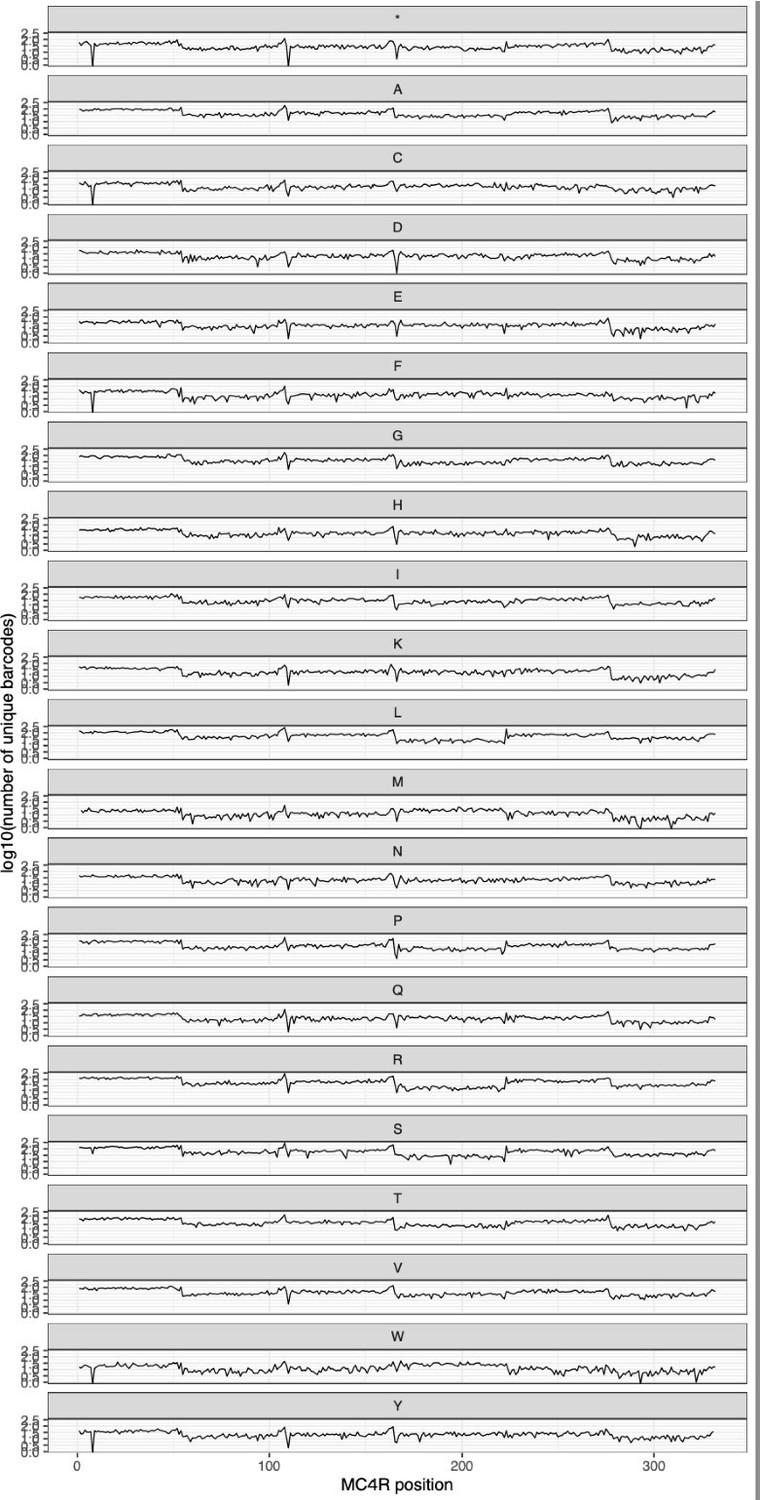
Figure 1—figure supplement 2
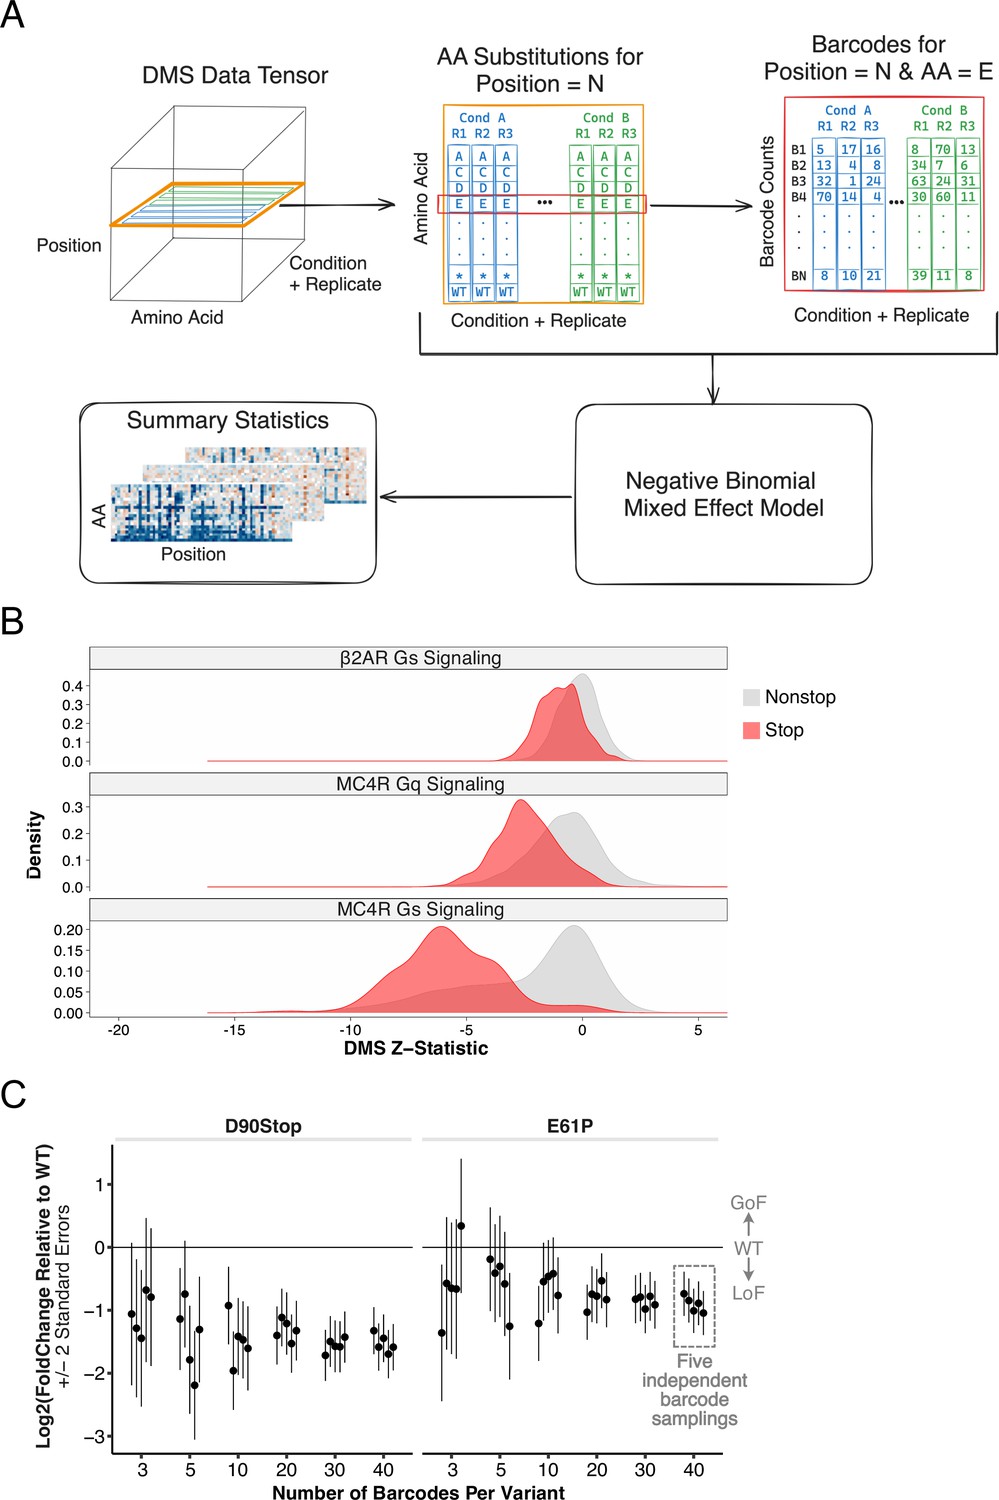
Analysis method and barcoding detail.
(A) Schematic for analysis method. DMS data can be represented as a tensor, with dimensions for Position in the protein, Amino Acid substitution, and Condition + Replicate. Within the Condition + Replicate dimension, there are multiple drugs (i.e. α-MSH and THIQ) and multiple signaling pathways (i.e. Gs and Gq). Furthermore, each amino acid substitution has multiple barcodes associated with it. Our negative binomial mixed-effect model takes all of this structure into account to produce summary statistics that are the basis of our comparisons. (B) Distribution of Z-statistics for stop codons versus all other variant effects from published β2AR (Jones et al., 2020) and MC4R (this study) DMS assays assessing Gs or Gq signaling activity. (C) Downsampling simulation from the MC4R data showing the effect of number of barcodes per variant on the estimation of log2 fold change relative to wild type. Here we show two representative positions in the α-MSH low condition, randomly downsampled a fixed number of barcodes associated with that variant. We repeated that process for five independent samplings, and ran the resulting data through our model resulting in parameter estimates. Increasing the number of barcodes per variant decreases the magnitude of the error bars (+/-2 standard errors).
Figure 2 with 3 supplements
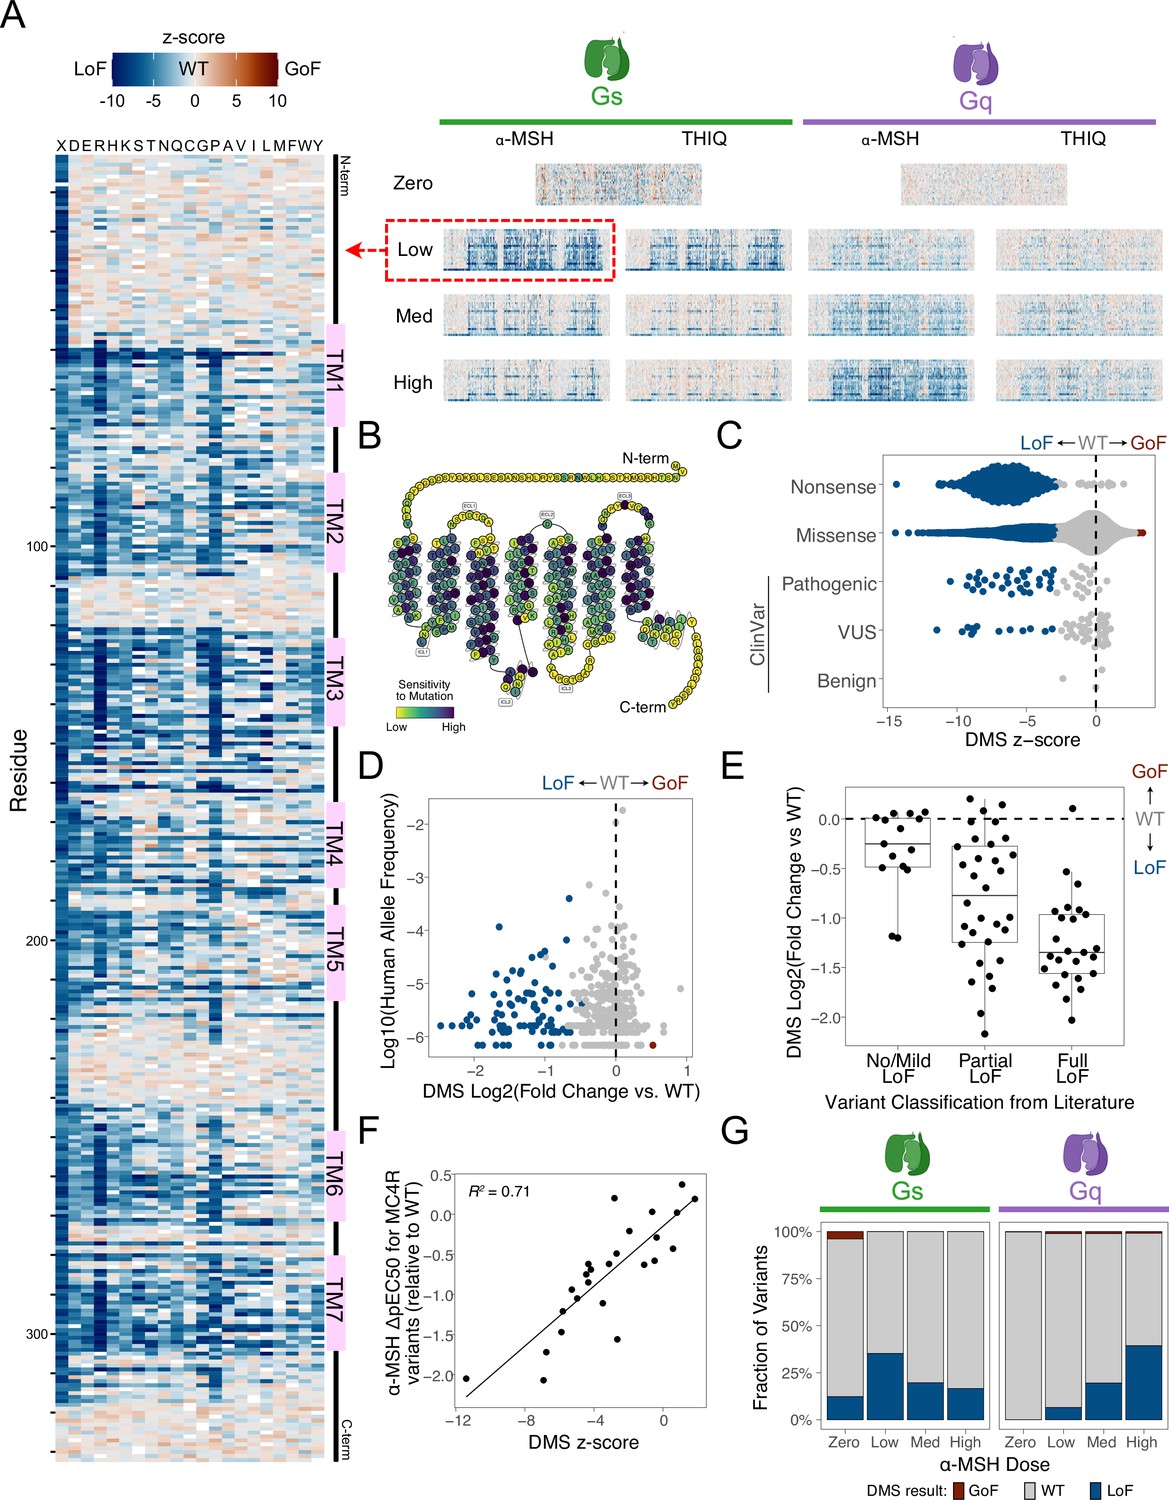
Effect of 6633 missense and nonsense variants on MC4R signaling functions.
(A) Heatmaps showing the functional effects (z-scores) for nearly all possible amino acid substitutions (6633 of 6640) on MC4R activity for two GPCR signaling functions (Gs and Gq) under a variety of conditions. Heatmaps showing results (both z-score and log2[fold change of variant activity over wild-type]) for all experimental conditions are shown in Figure 2—figure supplements 1 and 2. The results of the Gs assay with low α-MSH stimulation are highlighted on the left (and in Panels B-F). TM: transmembrane domain; GoF: gain-of-function; LoF: loss-of-function; WT: wild-type activity (B) A modified snake plot (adapted from https://gpcrdb.org/) showing the sensitivity of each MC4R residue to mutation (defined as the mean log2[fold change variant activity over wild-type] divided by sqrt(sum(standard error^2)) after excluding nonsense variants). (C) Z-scores for each variant (point), broken out by variant type and clinical (ClinVar) classification. Blue indicates statistically significant LoF, brown is significant GoF (significance threshold: FDR <1%). VUS: variant of uncertain significance. (D) Functional effect (log2[fold change of variant activity over wild-type], x-axis) for all human variants relative to the frequency of the allele in the in the human population (y-axis, gnomAD global population, from Chen et al., 2024). (E) DMS results for human MC4R variants (y-axis) relative to previous functional classifications in the literature (x-axis, from Huang et al., 2017) (F) DMS results (z-scores, x-axis) compared to change in α-MSH potency (relative to WT) of 25 MC4R variants made to the orthosteric binding site for α-MSH (y-axis, cAMP accumulation assay results from Zhang et al., 2021). (G) Fractions of MC4R variants that result in LoF, GoF, or WT activity for eight unique experimental conditions.
Figure 2—figure supplement 1
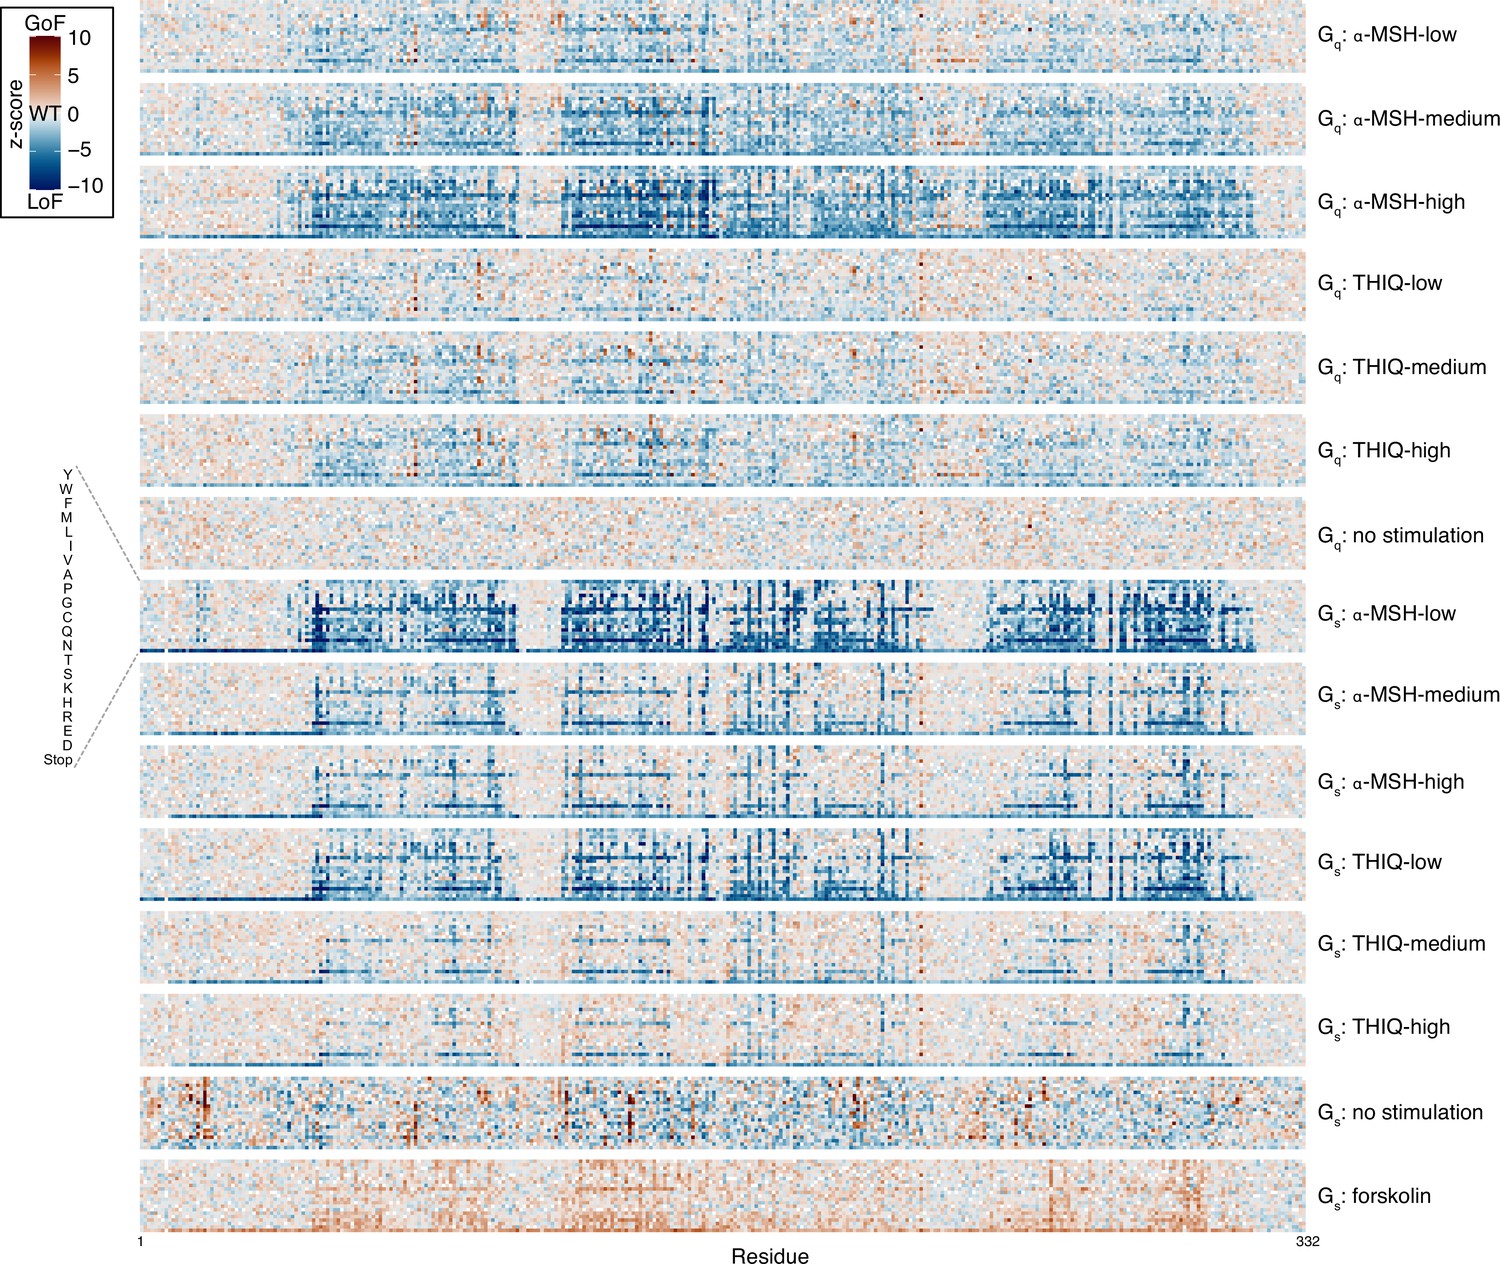
Results (z-scores) of MC4R Deep Mutational Scans across all agonist stimulation conditions.
Shown are z-scores indicating the effect of each variant (y-axis) at each position (x-axis) relative to wild-type. GoF: gain-of-function; LoF: loss-of-function, WT: wild-type.
Figure 2—figure supplement 2
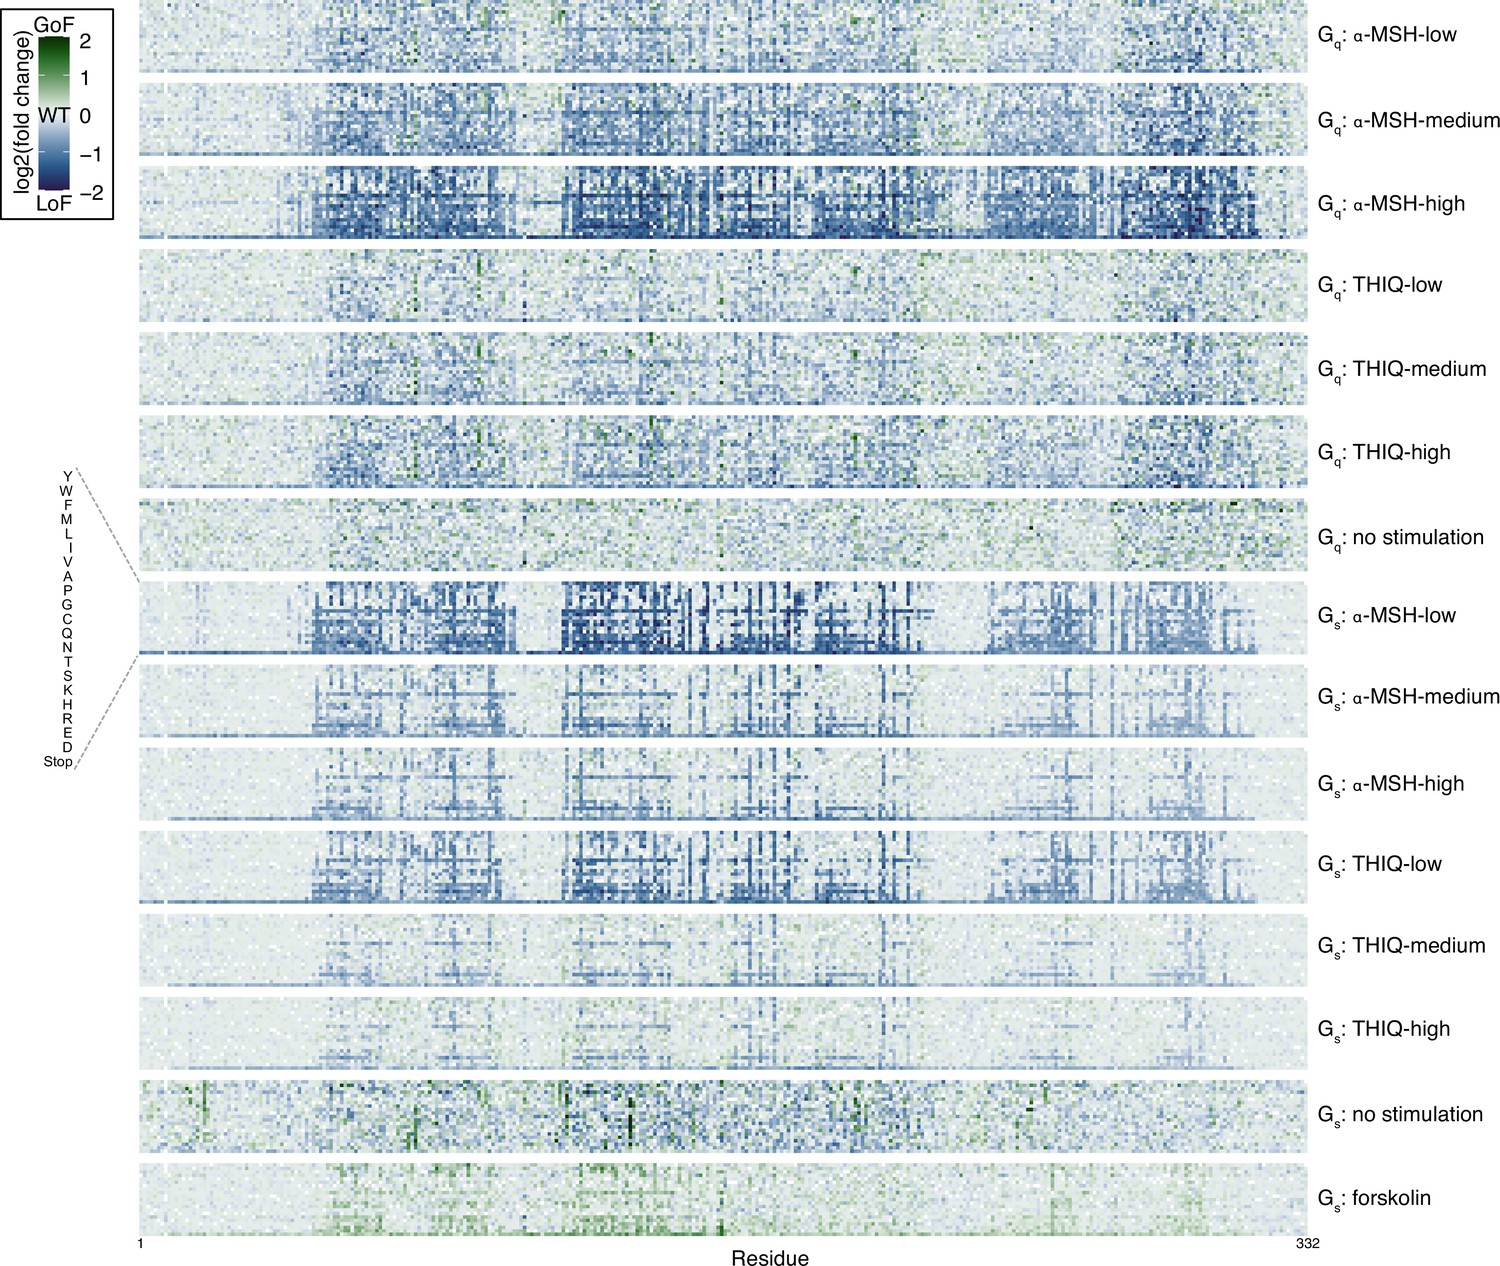
Results (log2[fold change]) of MC4R Deep Mutational Scans across all agonist stimulation conditions.
Shown are the log2(fold change) values of each variant (y-axis) at each position (x-axis) relative to wild-type. GoF: gain-of-function; LoF: loss-of-function, WT: wild-type.
Figure 2—figure supplement 3
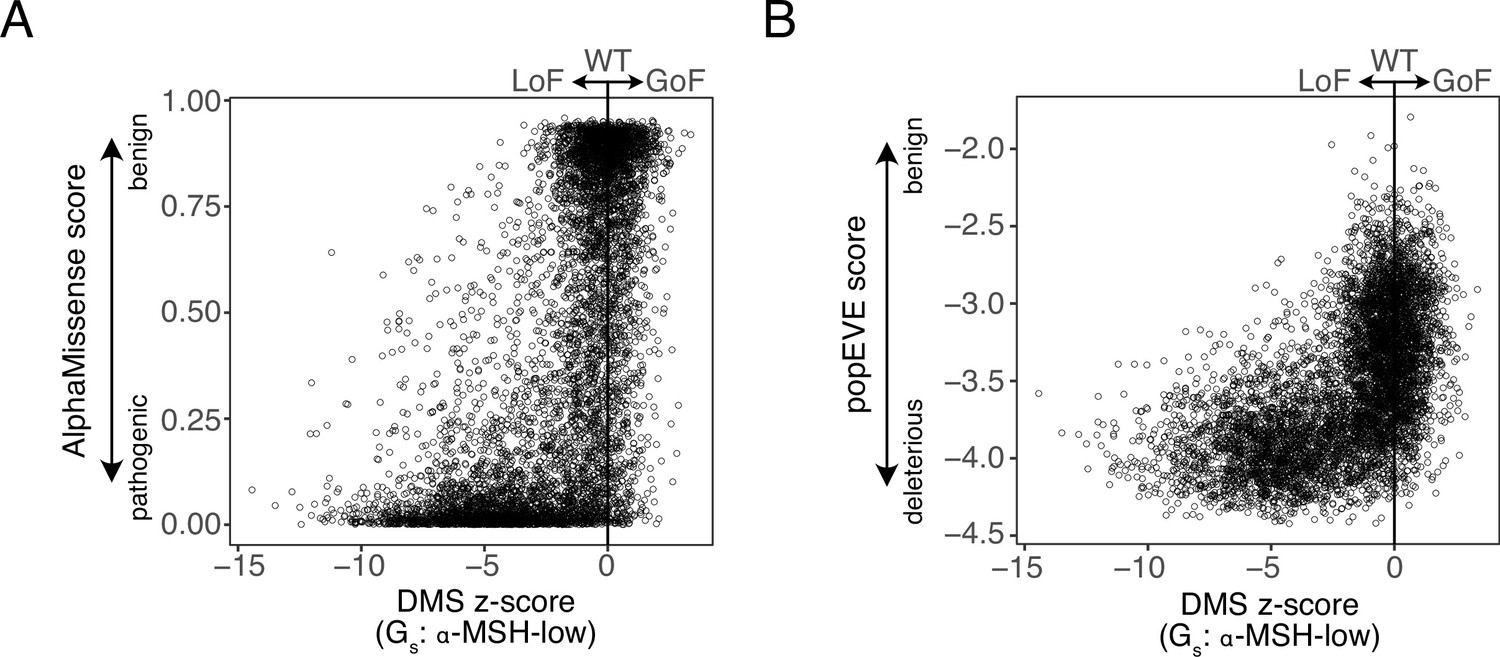
MC4R Deep Mutational Scans are consistent with variant effect predictions.
(A, B) Shown are z-scores for each MC4R variant (x-axis) from the Gs-α-MSH-low (forskolin normalized) DMS condition relative to the AlphaMissense (A) or popEve (B) score of the variant. GoF: gain-of-function; LoF: loss-of-function, WT: wild-type.
Figure 3 with 1 supplement
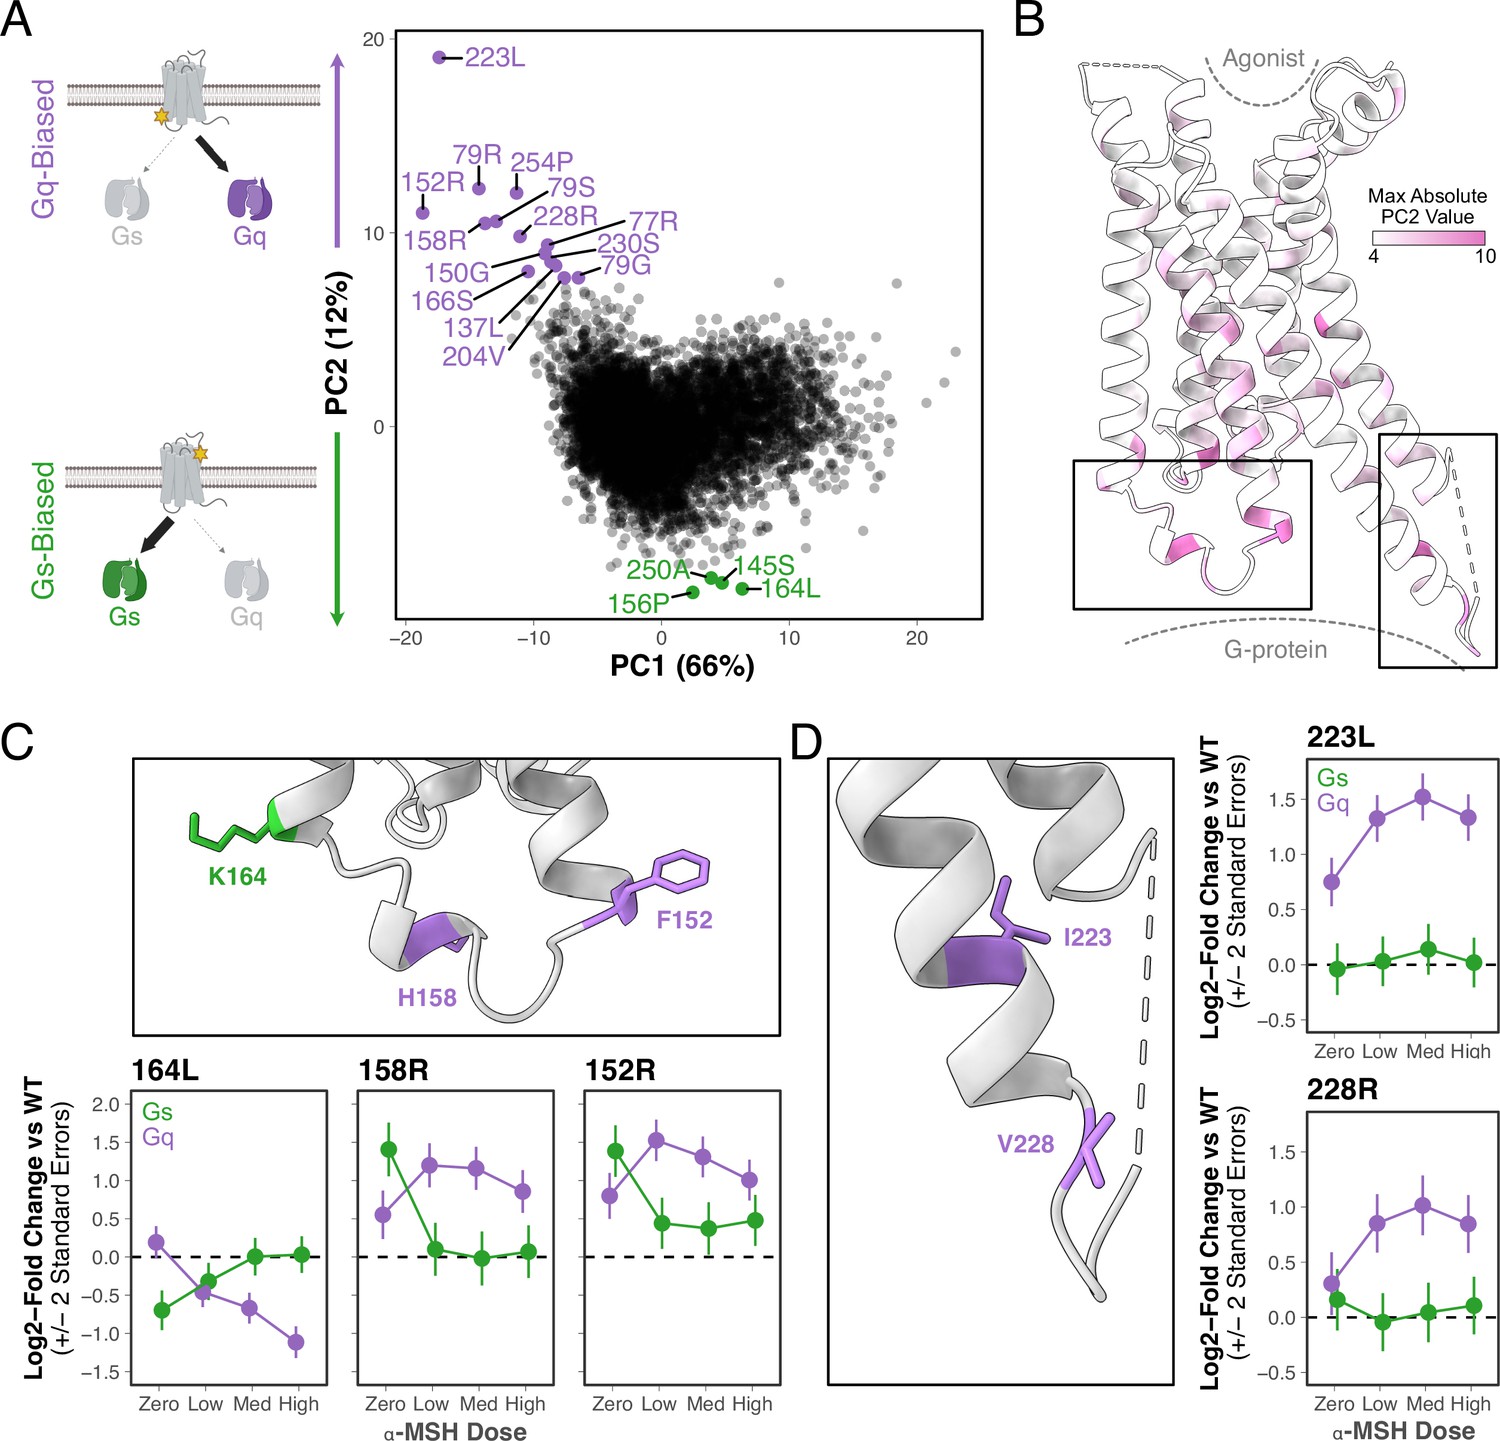
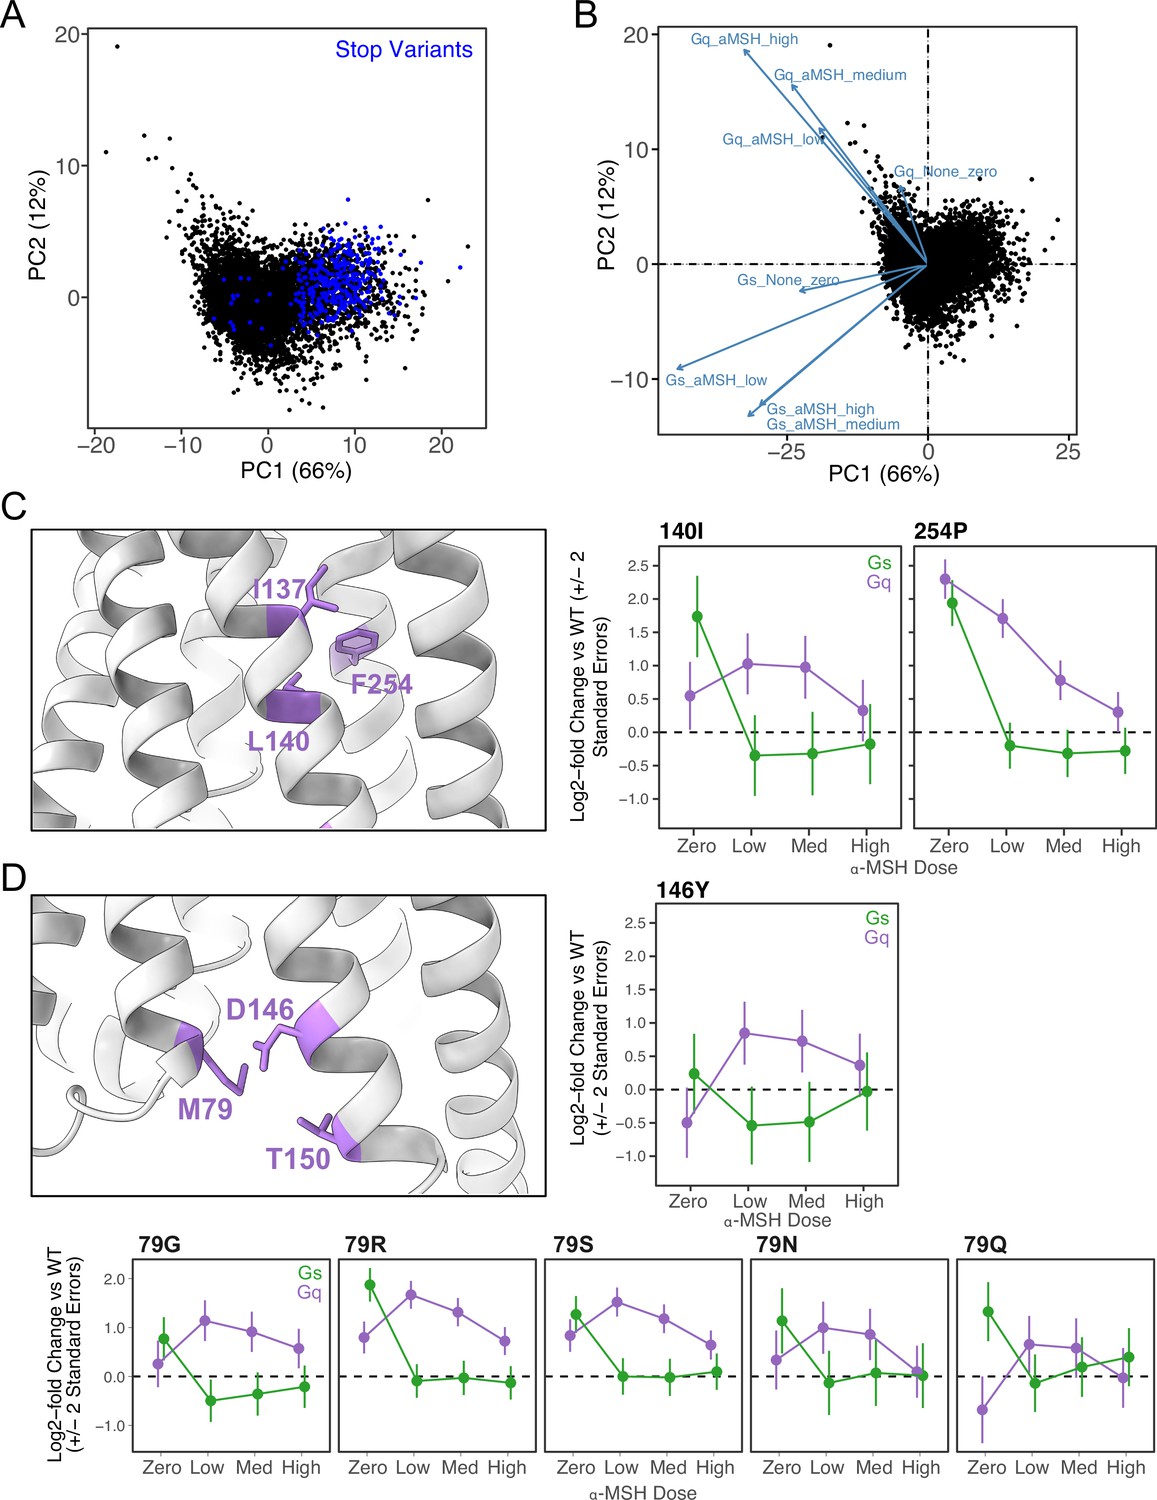
Systematic identification of variants that have biased effects on MC4R signaling.
(A) Principal component analysis of eight MC4R DMS conditions (Gs and Gq signaling each at four α-MSH stimulation doses: zero, low, medium, high, see Supplementary file 1a). Each point indicates a unique variant, with those exhibiting extreme Gq or Gs bias colored in purple and green, respectively. PC, principal component. Panel A created using BioRender.com. (B) Ribbon structure of MC4R showing the maximum absolute PC2 value for each residue position. (C) Top: Closeup of MC4R structure shown in bottom left box in B, highlighting positions where variants result in Gs (green) or Gq (purple) bias. Bottom: MC4R signaling activity (log2[fold change of variant activity relative to wild-type]) for three selected variants across α-MSH doses. Error bars are +/-2 standard errors. Med: medium; WT: wild-type (D) Left: Closeup of MC4R structure shown in bottom right box in B, highlighting positions where variants result in Gs or Gq bias as in C. Right: MC4R signaling activity for select variants as in C.
Figure 3—figure supplement 1
Variants with differential effects on Gs and Gq signaling.
(A) PCA of z-scores from all Gs and Gq assays using no, low, medium, and high α-MSH. Each point represents a variant, with stop codon variants colored in blue and supporting that PC1 is driven by variants that are LoF in both Gs and Gq assays versus those that retain activity in one or both assays. (B) Same PCA as A but with arrows showing how each of the incorporated datasets is contributing to the components. This supports that PC2 is driven by differences in Gs and Gq signaling. (C, D) Additional examples of variants that have differential effects on Gs and Gq signal, as in Figure 3C and D. Left: Closeup of MC4R structure showing positions of interest in purple. Right/Bottom: MC4R signaling activity (log2[fold change of variant activity relative to wild-type]) for selected variants across α-MSH doses. Error bars are+/-2 standard errors. Med: medium; WT: wild-type.
Figure 4 with 1 supplement
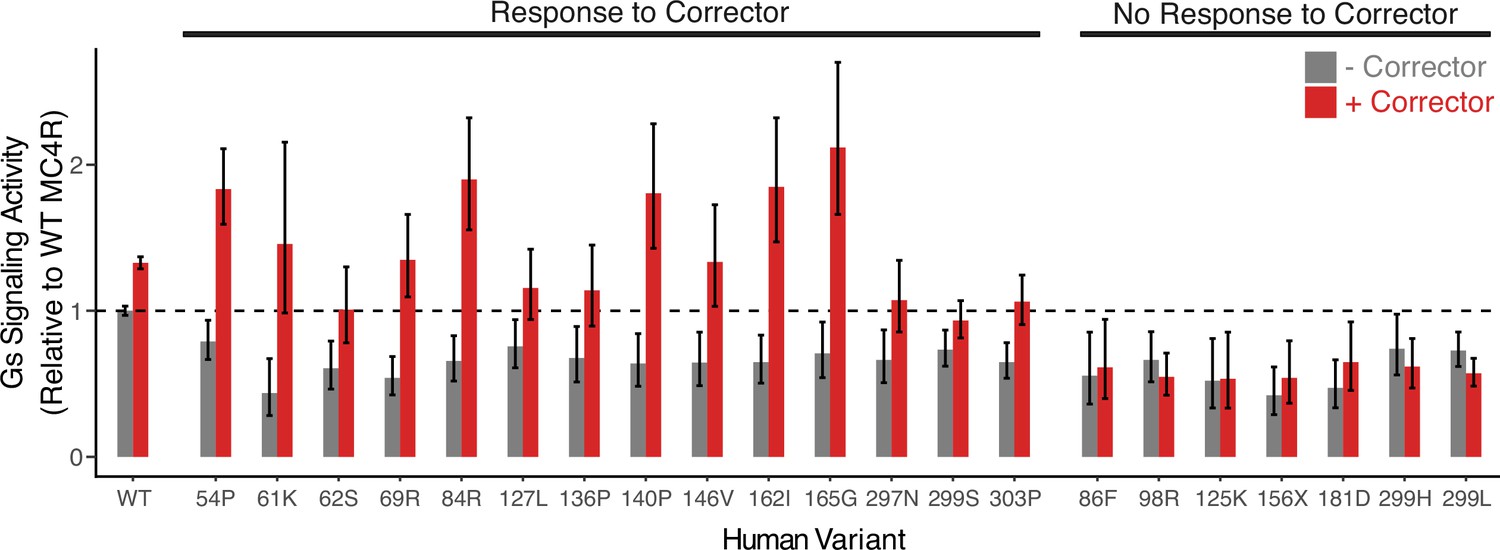
Corrector therapy rescues the activity of a subset of human MC4R variants.
Gs signaling activity of 21 selected MC4R variant alleles (of 6633 tested) with (red) and without (gray) Ipsen 17, a small molecule corrector that has been shown to restore the activity of misfolded MC4R. Bars represent the activity of the variant allele normalized to that of WT MC4R in the no corrector condition, and error bars are +/-two standard errors.
Figure 4—figure supplement 1
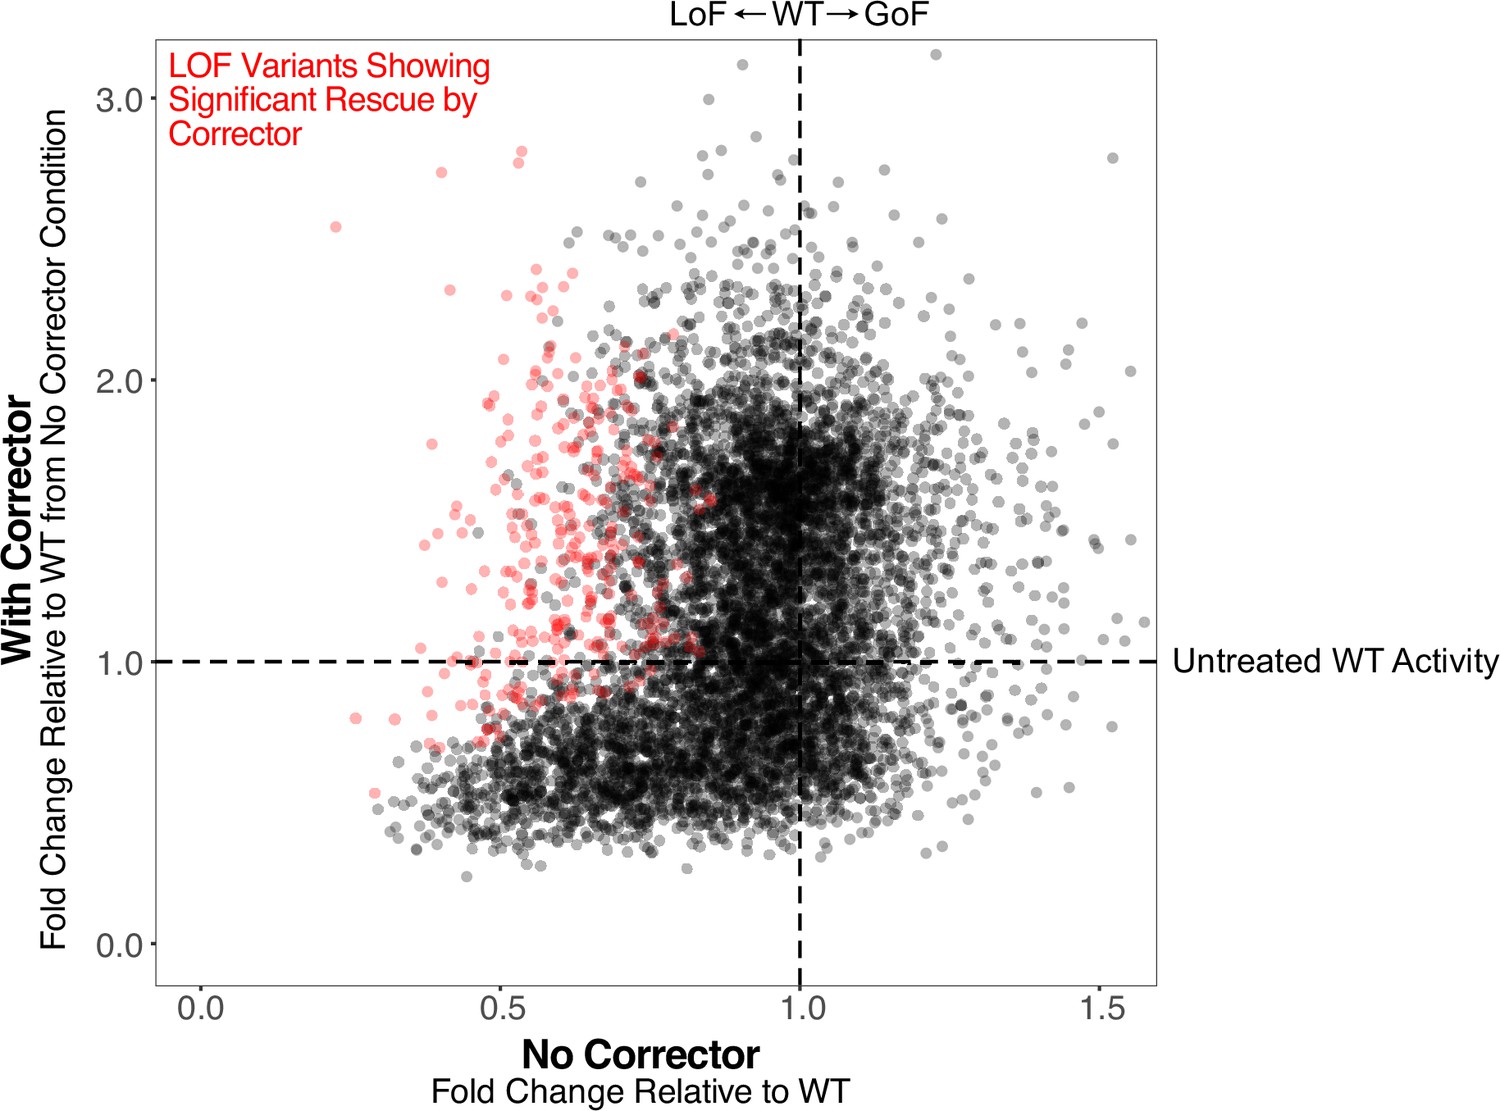
Identification of variants that respond to corrector treatment.
Scatter plot showing activity of each MC4R variant in Gs signaling assay upon stimulation with 1 μM α-MSH (>EC99) in the absence of corrector (x-axis) versus upon treatment with 1 μM Ipsen 17 followed by stimulation with 1 μM α-MSH (>EC99) (y-axis). Each point represents a variant, with those in red classified as both (1) loss-of-function in the absence of corrector and (2) functionally rescued in the Ipsen 17 treatment condition (see Materials and methods for details).
Figure 5 with 1 supplement
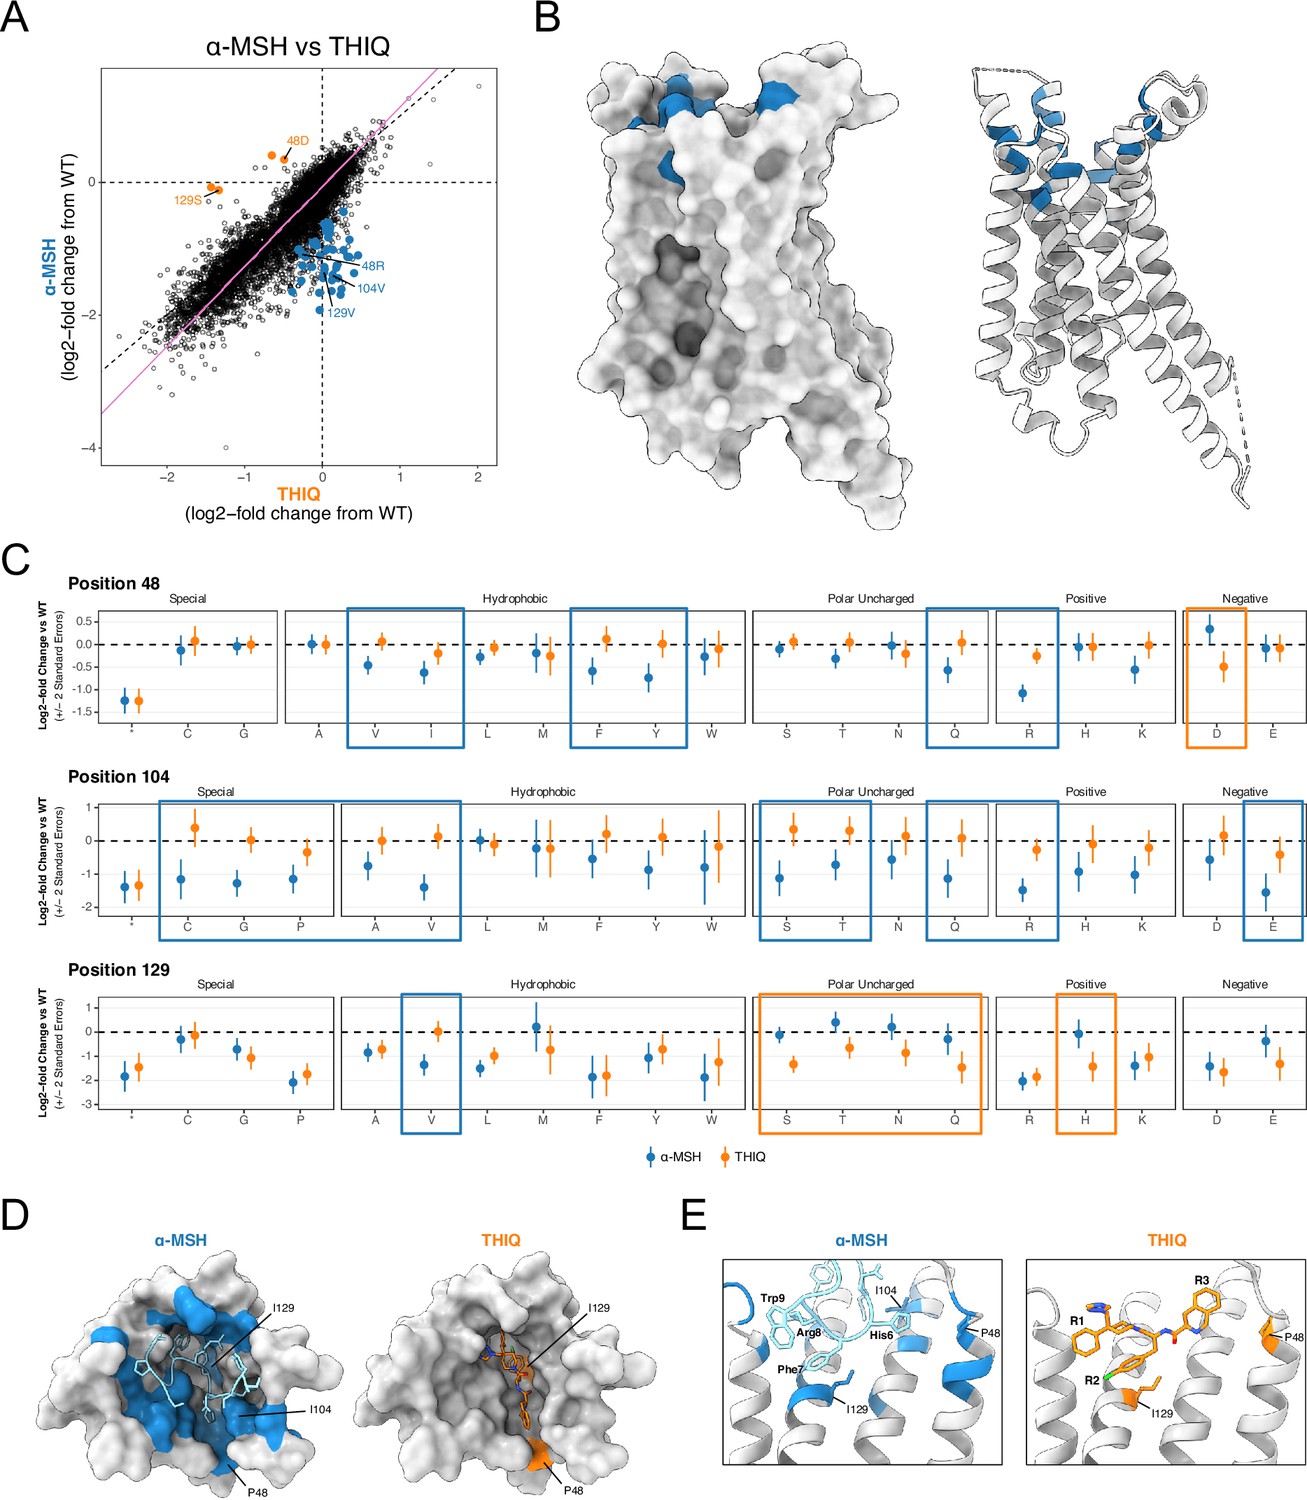
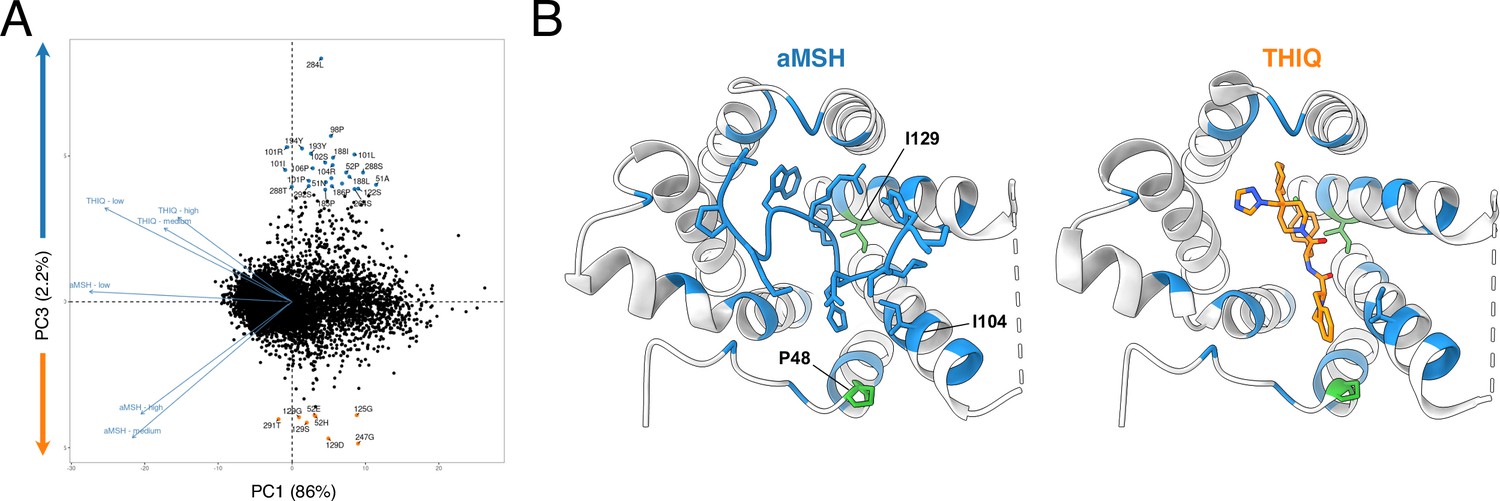
Systematic identification of functional protein-ligand interactions.
(A) Bayesian meta-regression of the α-MSH and THIQ datasets at low agonist concentration for Gs reveals variants that differentially affect MC4R activation by each agonist. Statistically significant effects are colored by which agonist condition they impaired (α-MSH, blue; THIQ, orange, FDR <0.05). Variants at positions 48, 104, and 129 are labeled. (B) Side-views of MC4R structure in surface (left) and ribbon (right) view show clustering of variants from A that specifically abrogate α-MSH but not THIQ activation (blue) in the extracellular orthosteric binding site. (C) Effect of all possible variants at residues 48, 104, and 129 at low concentration of α-MSH (blue) and THIQ (orange). Variants that disproportionately affect activation by only one agonist are boxed by respective color. Error bars are +/-2 standard errors. (D) Top-down surface views of MC4R (PDB: 7f58) with bound α-MSH (left, blue; PDB: 7f53) or THIQ (right, orange; PDB: 7f58). Positions are colored by whether variants at that position uniquely perturb activation by α-MSH (blue) or THIQ (orange). (E) Zoomed view of the MC4R binding pocket with α-MSH bound (left) or THIQ bound (right). Structures are colored as in (D). Residues that form the HFRW motif of α-MSH and functional groups R1, R2, and R3 of THIQ are labeled in bold. Residues 48, 104, and 129 are shown in stick form.
Figure 5—figure supplement 1
Variants that differentially impact activation by peptide versus small molecule agonists.
(A) PCA of z-scores from all Gs signaling assays with no, low, medium, and high concentrations of α-MSH or THIQ. Each point represents a variant colored by whether it uniquely abrogates signaling in the α-MSH (blue) or THIQ (orange) condition(s). (B) Top-down ribbon view of MC4R with bound α-MSH (left, blue; PDB: 7f53) or THIQ (right, orange; PDB: 7f58). MC4R residues are colored by whether variants at a given position disrupt activation uniquely by α-MSH (blue), THIQ (orange), both (green), or neither (gray). Residues 48, 104, and 129 are shown in stick form.
Author response image 1

Author response image 2
Tables
Appendix 1—key resources table
| Reagent type (species) or resource | Designation | Source or reference | Identifiers | Additional information |
|---|---|---|---|---|
| gene (H. sapien) | MC4R | Uniprot:P32245 | ||
| genetic reagent | Gs luciferase | this study | ||
| genetic reagent | Gq relay | this study | ||
| cell line (H. sapien) | HEK293T | ATCC | ||
| chemical compound, drug | Ipsen 17 | WuXi AppTec | CAS:852803-39-5 | Custom synthesis |
| chemical compound, drug | Forskolin | Sigma Aldrich | CAS:66575-29-9 | |
| chemical compound, drug | a-MSH | ApexBio | CAS:581-05-5 | |
| chemical compound, drug | THIQ | MedChemExpress | CAS:312637-48-2 | |
| software, algorithm | umi_tools | Smith et al., 2017 | ||
| software, algorithm | cutadapt | Martin, 2011 | ||
| software, algorithm | STAR | Dobin et al., 2013 | ||
| software, algorithm | samtools | Li et al., 2009 | ||
| software, algorithm | FLASH2 | Magoč and Salzberg, 2011 |
Additional files
-
Supplementary file 1
Supplementary tables.
(a) Experimental conditions across all DMS assays. (b) Functional effects of >200 human MC4R variants. (c) Oligo sequences used in this study.
- https://cdn.elifesciences.org/articles/104725/elife-104725-supp1-v1.xlsx
-
MDAR checklist
- https://cdn.elifesciences.org/articles/104725/elife-104725-mdarchecklist1-v1.pdf
Download links
A two-part list of links to download the article, or parts of the article, in various formats.
Downloads (link to download the article as PDF)
Open citations (links to open the citations from this article in various online reference manager services)
Cite this article (links to download the citations from this article in formats compatible with various reference manager tools)
High-resolution deep mutational scanning of the melanocortin-4 receptor enables target characterization for drug discovery
eLife 13:RP104725.
https://doi.org/10.7554/eLife.104725.3


