SAM transmethylation pathway and adenosine recycling to ATP are essential for systemic regulation and immune response
- Department of Molecular Biology and Genetics, Faculty of Science, University of South Bohemia, Czech Republic
- Laboratory of Analytical Biochemistry and Metabolomics, Institute of Entomology, Biology Centre, Czech Academy of Sciences, Czech Republic
- Department of Applied Chemistry, Faculty of Agriculture and Technology, University of South Bohemia, Czech Republic
Figures
Figure 1
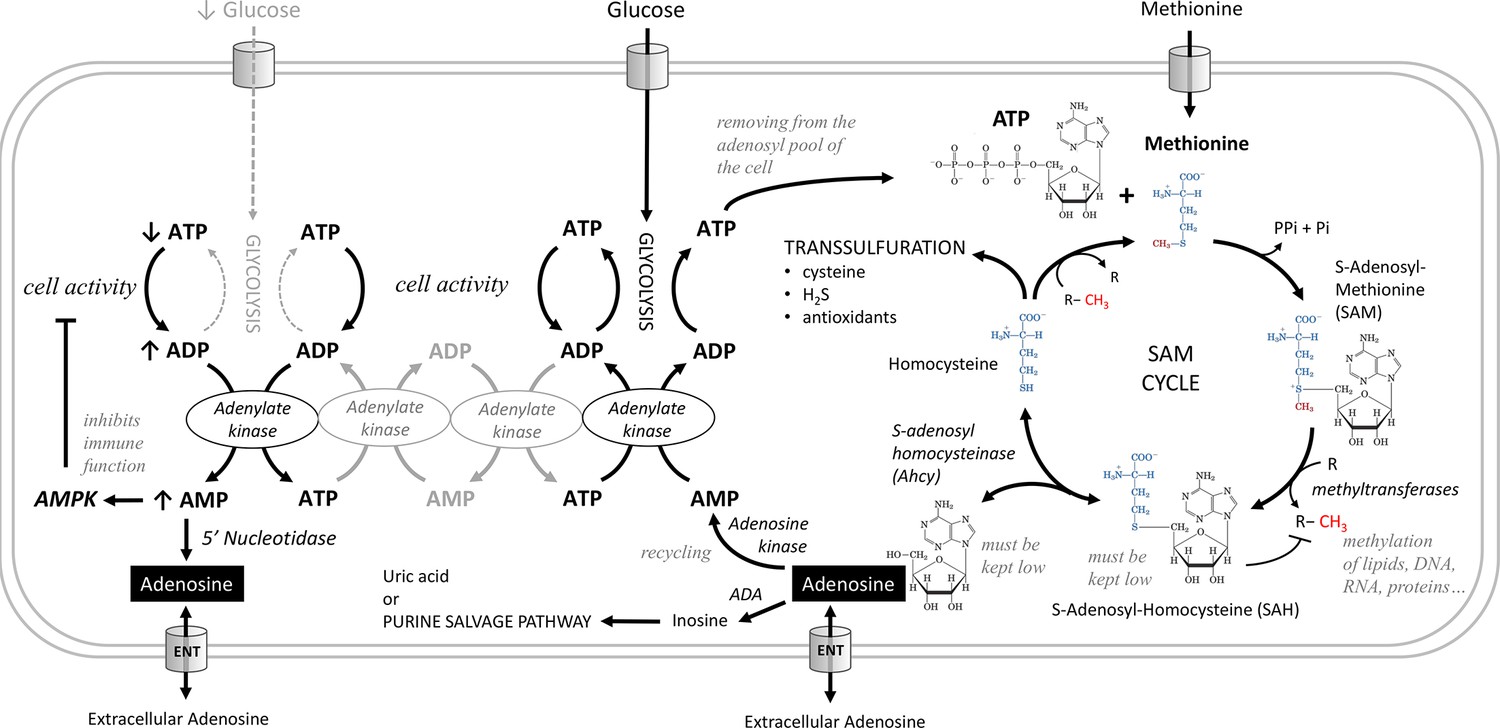
Metabolic pathways producing adenosine.
Adenosine can be produced from AMP by 5'-nucleotidase. AMP increases during metabolic stress, when cells use adenylate kinase to make one ATP and one AMP from two ADP molecules. Increased AMP activates AMP-activated protein kinase (AMPK), which suppresses energy-consuming processes in the cell and activates energy-producing processes, or is converted to adenosine, which can be released from cells via the equilibrative nucleoside transporter (ENT). In the S-adenosylmethionine (SAM) transmethylation pathway, the combination of ATP and methionine produces SAM, the major methyl group donor (red) for the majority of methylations that occur in the cell. During methylation, SAM is converted to S-adenosylhomocysteine (SAH), which is rapidly converted to homocysteine and adenosine by adenosylhomocysteinase (Ahcy), as it would otherwise block further methylation. Ahcy works bidirectionally, and for the ‘SAM to homocysteine +adenosine’ direction to dominate, homocysteine and adenosine must be rapidly metabolized or cleared from the cell. Homocysteine is remethylated back to methionine or further metabolized via the transsulfuration pathway (source of cysteine, H2S, and antioxidants). The catabolism of adenosine to inosine is mediated by adenosine deaminase (ADA) or recycled to AMP by adenosine kinase which becomes ATP through adenylate kinase, glycolysis or oxidative phosphorylation. Another possible source of adenosine is RNA degradation, which is not shown in this scheme.
Figure 2 with 3 supplements
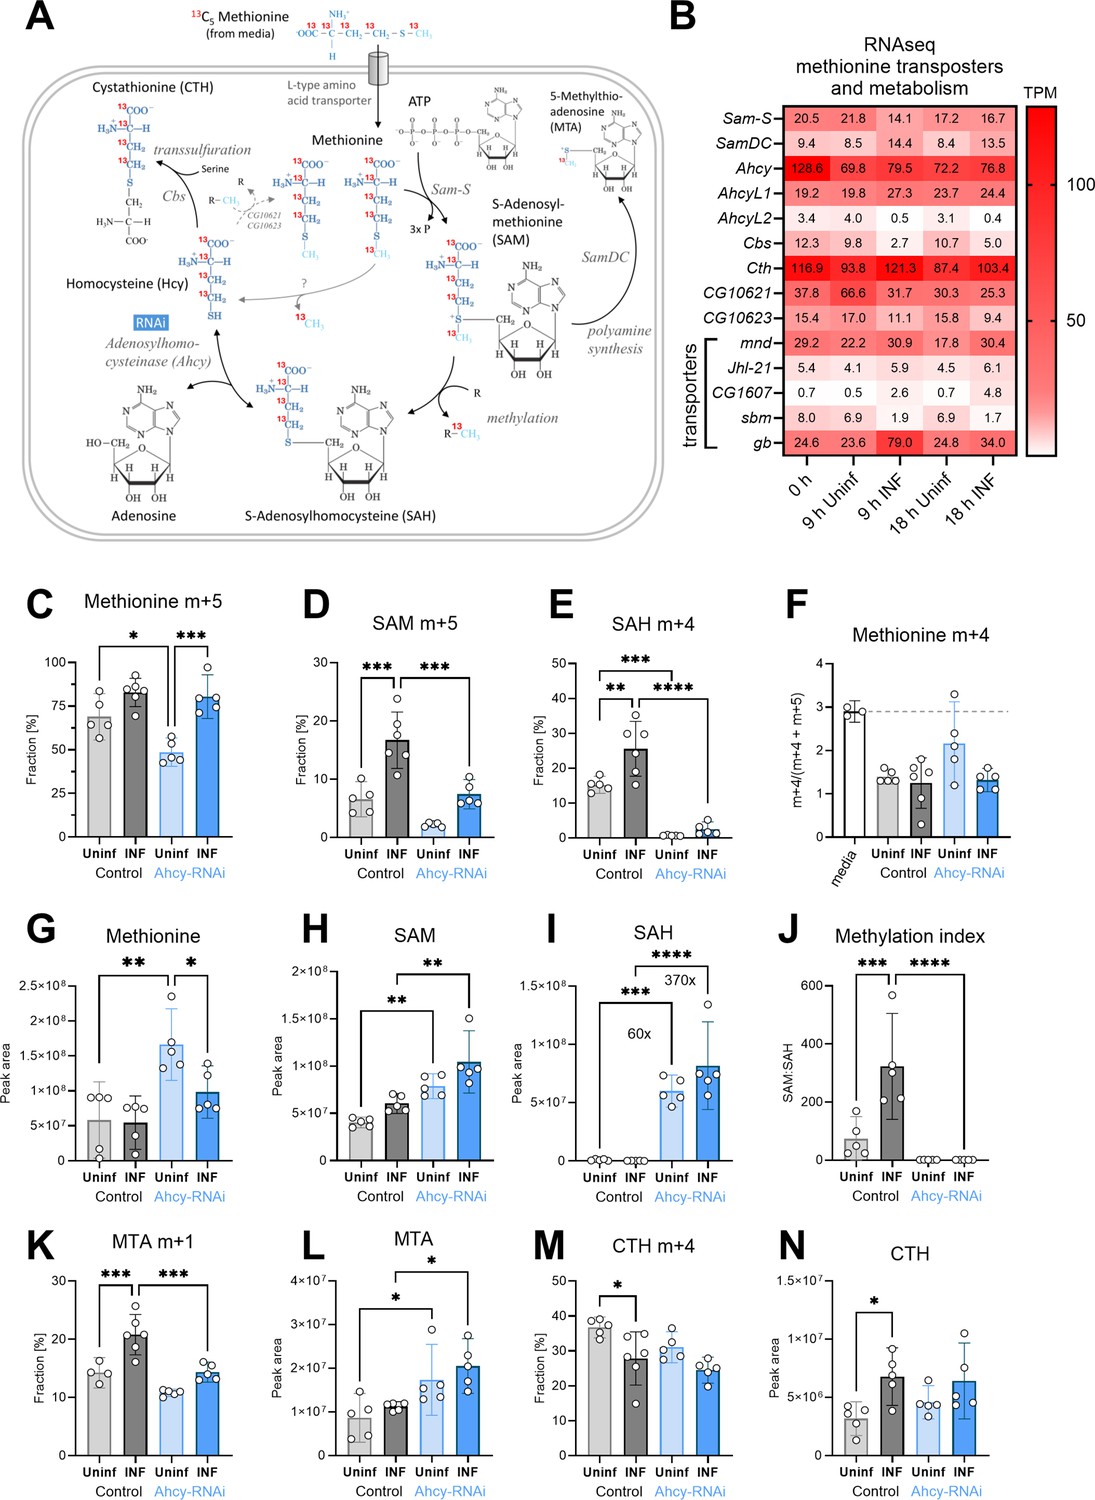
Analysis of the SAM transmethylation pathway in larval hemocytes by ex vivo stable 13C isotope tracing.
(A) Schematic representation of the SAM transmethylation pathway with polyamine synthesis and transsulfuration branches and labeling with L-methionine-13C5 from media (red 13 represents the labeled carbon). Light blue CH3 represents the methyl group used during transmethylation or remethylation. Enzymes and processes are italicized. RNAi in blue rectangle represents adenosylhomocysteinase knockdown. (B) Expression heat map (bulk RNAseq) of methionine transporters and enzymes in circulating hemocytes from uninfected (Uninf) and infected (INF) third instar larvae collected at 0, 9 and 18 hpi (0 hpi = 72 hr after egg laying). Means of 6 replicates (10 replicates in case of 18 hr INF) shown in each cell are transcripts per million (TPM) - for comparison, only 20% of genes in RNAseq show expression higher than 15 TPM (data in Figure 2—source data 1 and Supplementary file 3). (C-E,K,M) 13C-labeling of metabolites in hemocytes, which were incubated ex vivo for 20 min in media containing 0.33 µM L-methionine-13C5. The graphs show the fraction of the compound with one (m+1), four (m+4), or five (m+5) 13C-labeled carbons – methionine m+5 (C), S-adenosylmethionine (SAM) m+5 (D), S-adenosylhomocysteine (SAH) m+4 (E), 5-methylthioadenosine (MTA) m+1 (K) and cystathionine (CTH) m+4 (M). (F) Methionine m+4 portion of total labeled methionine (m+4 and m+5) in media representing the labeling impurity of used methionine (white bar setting threshold - dashed line), and in hemocyte samples. (G-I,L,N) Total levels of methionine (G), SAM (H), SAH (I), MTA (L), and CTH (N) in hemocytes shown as the mean metabolite amounts expressed by the normalized peak area. (J) Methylation index calculated as the ratio of SAM:SAH levels (peak areas in H and I). (C-N) Bars represent mean values with 95% CI of uninfected (Uninf, light grey) and infected (INF, dark grey) control and uninfected (Uninf, light blue) and infected (INF, dark blue) Ahcy-RNAi samples; each dot represents one biological replicate (numerical values in Figure 2—source data 1 and Supplementary file 1); asterisks represent significant differences between samples tested by ordinary one-way ANOVA Tukey’s multiple comparison test (*p<0.05, **p<0.01, ***p<0.001, ****p<0.0001).
-
Figure 2—source data 1
The MS Excel file containing the raw data/numerical values used to generate the plots in the figure.
- https://cdn.elifesciences.org/articles/105039/elife-105039-fig2-data1-v1.xlsx
Figure 2—figure supplement 1
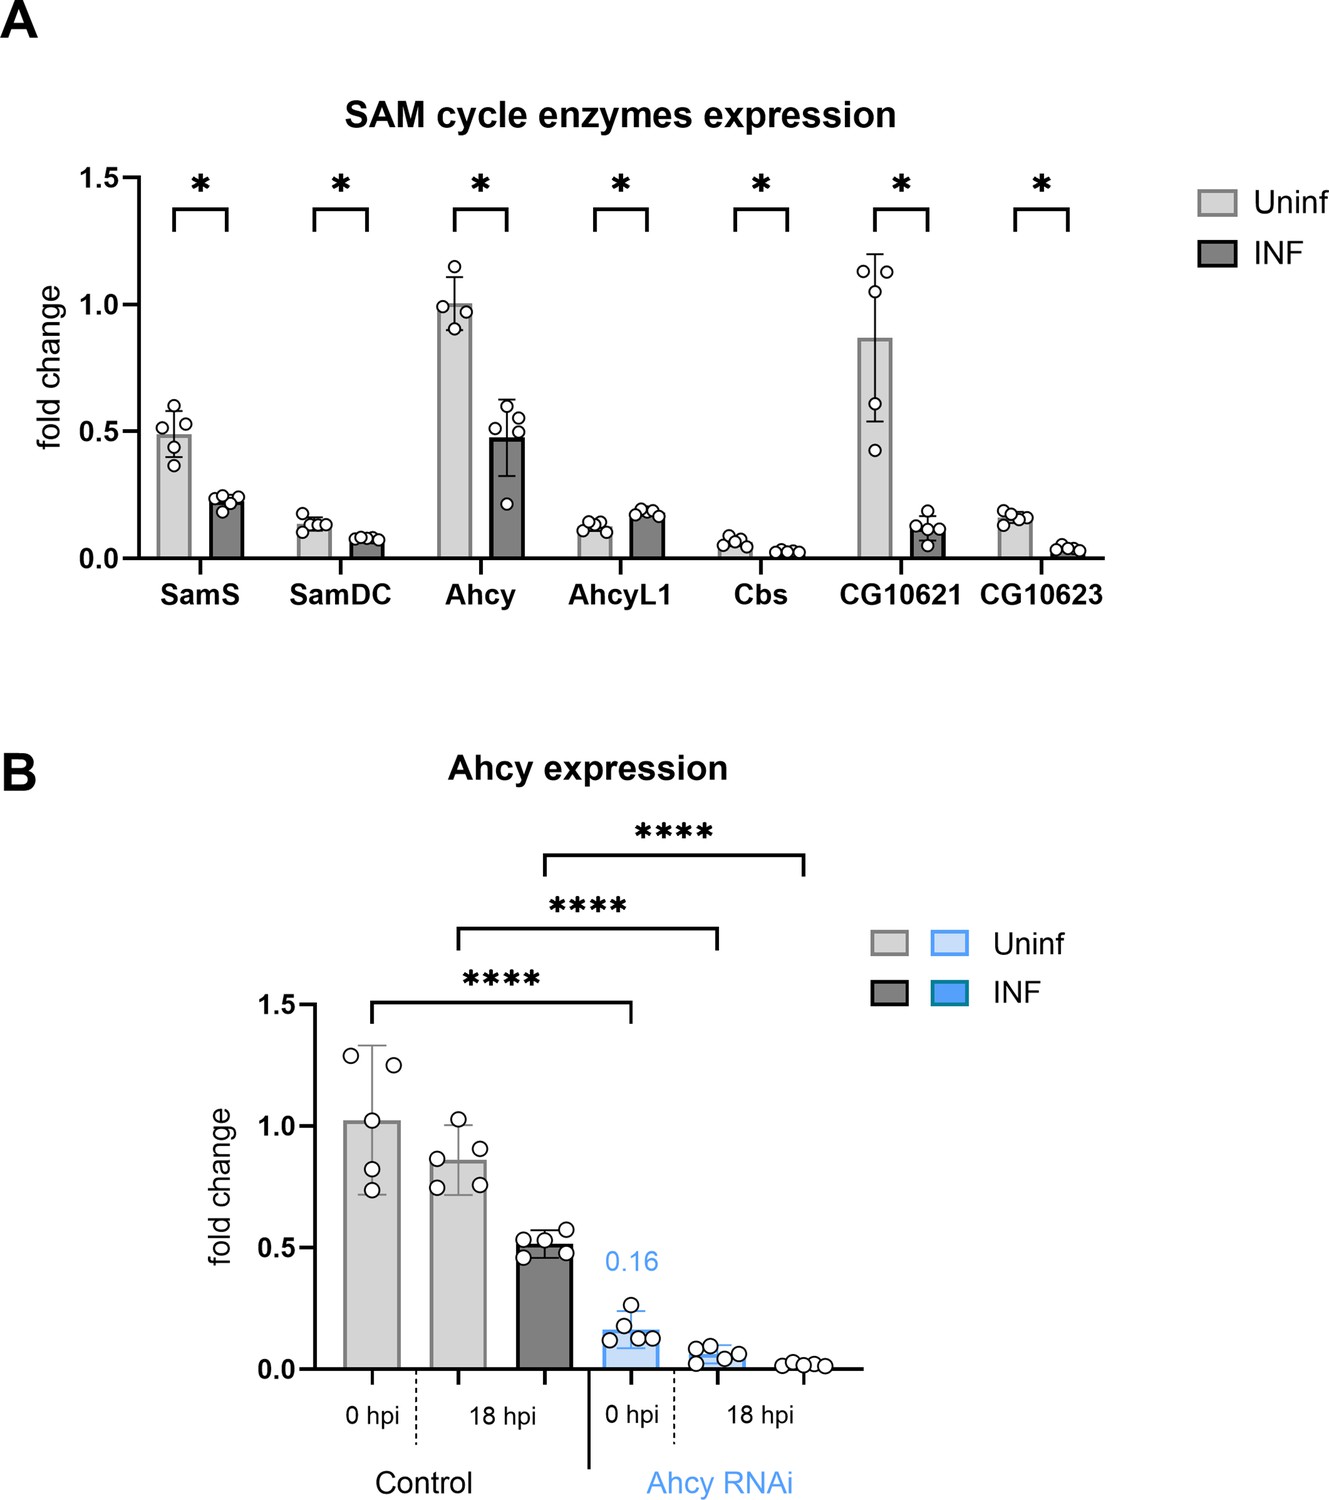
Expression of SAM transmethylation pathway enzymes and Ahcy RNAi.
(A) Expression analysis of enzymes in the SAM transmethylation pathway in circulating hemocytes from uninfected (Uninf; light gray) and infected (INF; dark gray) third instar larvae collected at 18 hpi by RT-qPCR. Bars show fold change compared to uninfected Ahcy samples (expression levels were normalized to RpL32 expression in each sample), each dot represents a biological replicate. Asterisks indicate significant differences between samples tested by multiple unpaired t-test. (B) Analysis of Ahcy knockdown efficiency at 0 and 18 hpi by RT-qPCR. RNAi was specifically induced in hemocytes by SrpD-Gal4 tubP-GAL80ts driven expression of UAS-Ahcy-RNAiHMS05799 in larvae maintained at 18 °C for the first 3 days of development and then transferred to 25 °C. RNAi reduces Ahcy expression to 16% of control at the onset of infection (0 hr). Bars represent means with 95% CI of uninfected (Uninf, light gray) and infected (INF, dark gray) control (driver crossed to P{CaryP}Msp300attP40 control without RNAi) and uninfected (Uninf, light blue) and infected (INF, dark blue) Ahcy-RNAi samples; each dot represents a biological replicate (numerical values in Figure 2—figure supplement 1—source data 1); asterisks indicate significant differences between samples tested by ordinary one-way ANOVA Tukey’s multiple comparison test (****p<0.0001).
-
Figure 2—figure supplement 1—source data 1
The MS Excel file containing the raw data/numerical values used to generate the plots in the figure.
- https://cdn.elifesciences.org/articles/105039/elife-105039-fig2-figsupp1-data1-v1.xlsx
Figure 2—figure supplement 2
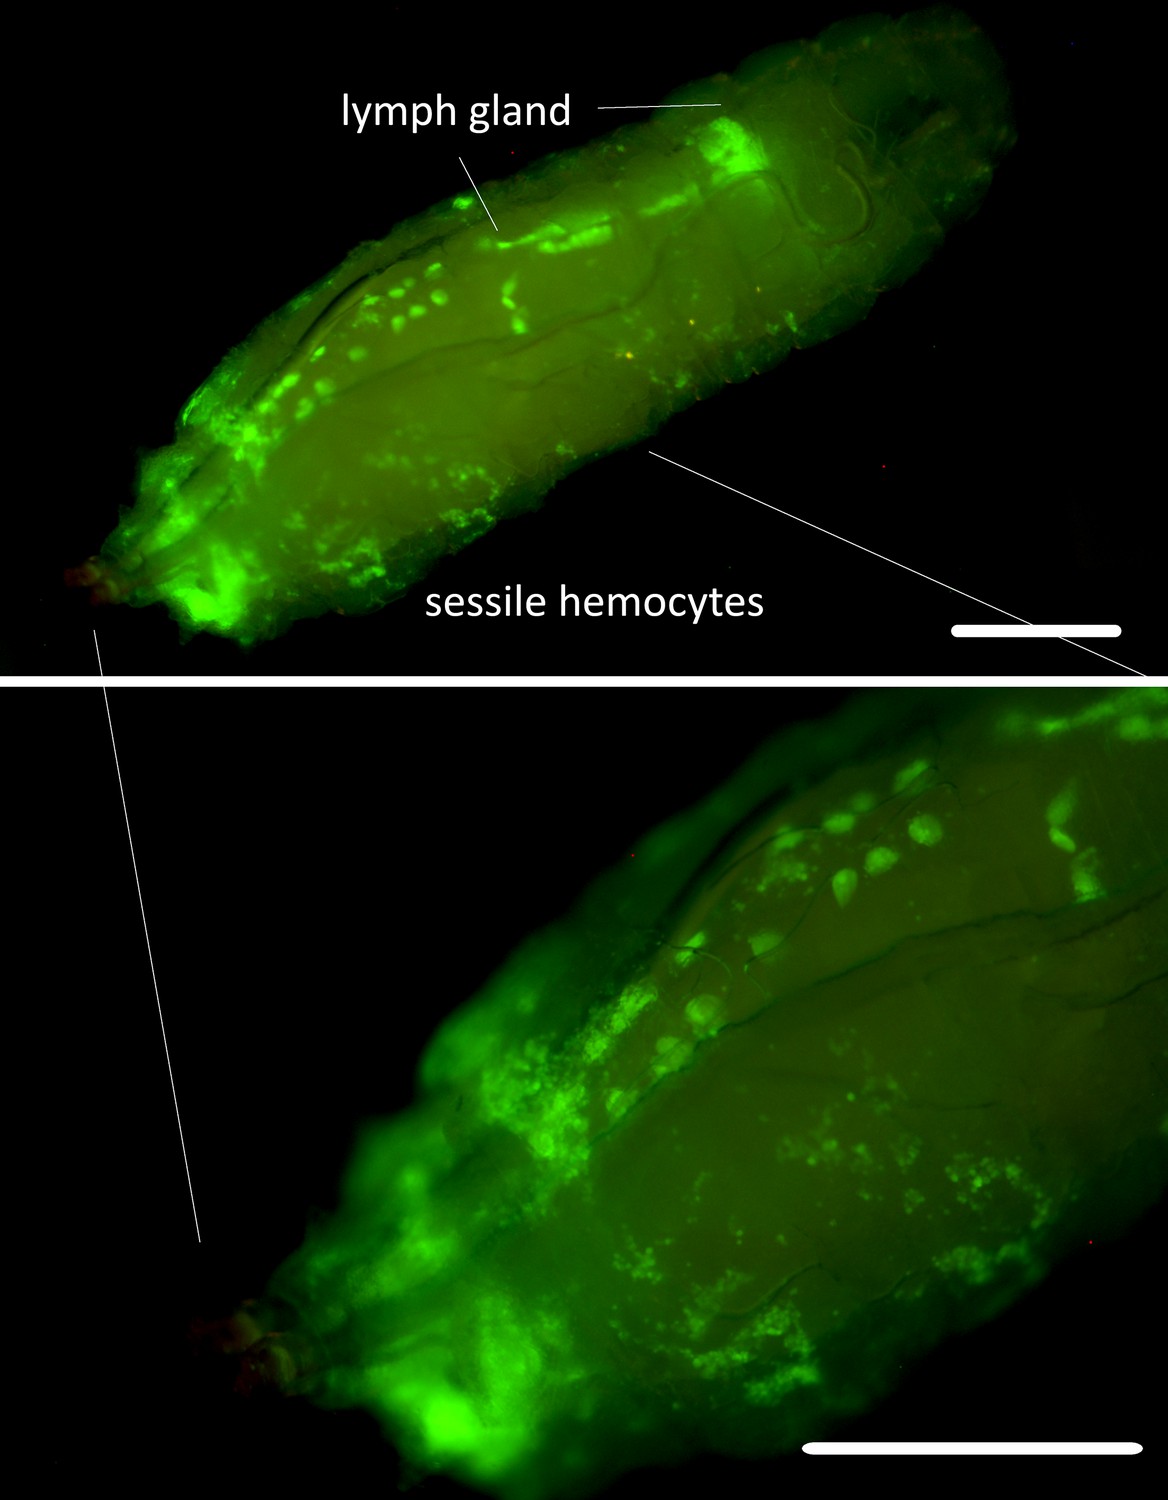
Srp-Gal4 Gal80 driver expression.
SrpD-Gal4 tubP-GAL80ts driven expression of UAS-GFP in 3rd-instar larvae maintained at 18 °C for the first 3 days of development and then transferred to 25 °C. GFP expression is detected in all lobes of lymph gland, pericardial cells and circulating and sessile hemocytes. Scale bar 250 µm.
Figure 2—figure supplement 3
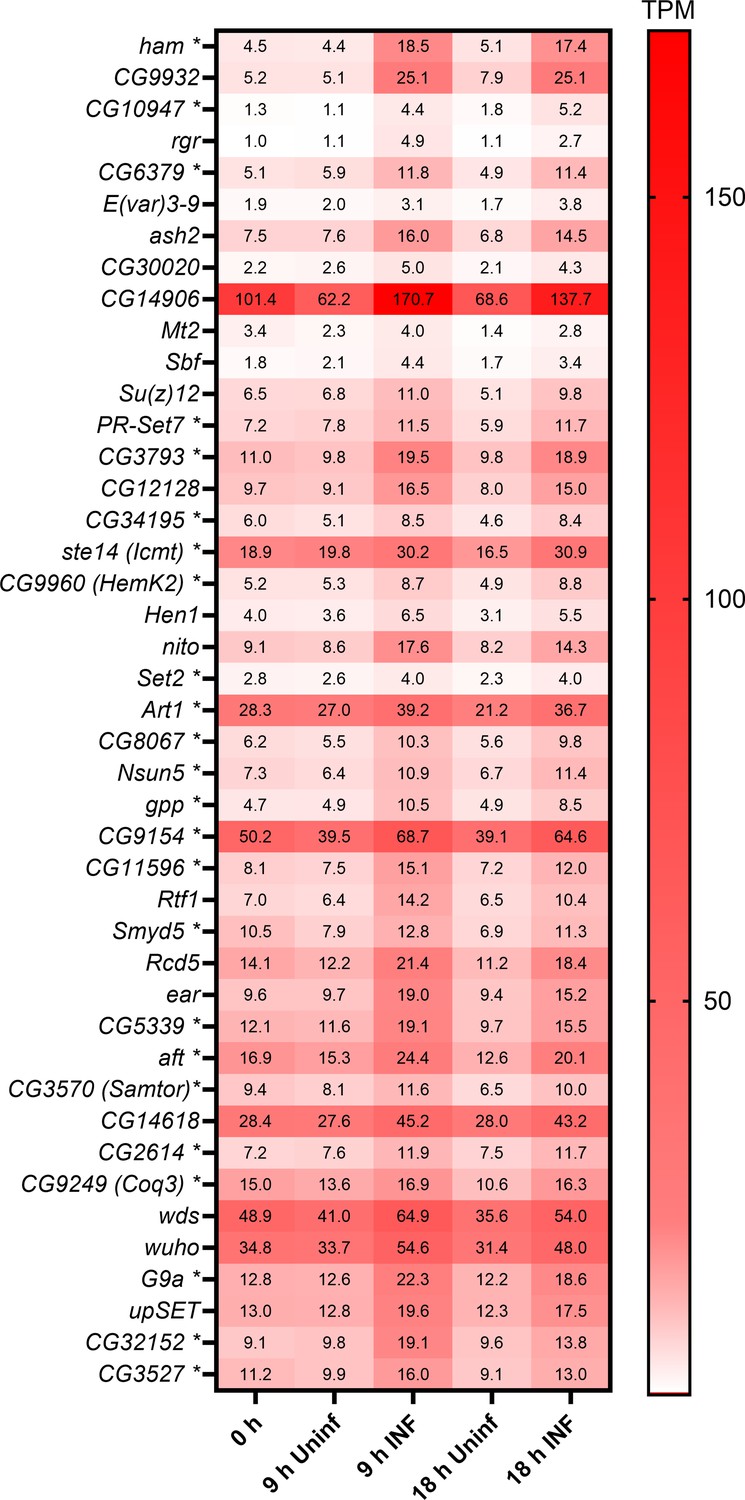
Expression of selected methyltransferases.
Expression heat map (bulk RNAseq) of 43 selected Drosophila methyltransferases in circulating hemocytes from uninfected (Uninf) and infected (INF) third instar larvae collected at 0, 9, and 18 hpi (0 hpi = 72 hr after egg laying). Means of 6 replicates (10 replicates in case of 18 hr INF) shown in each cell are transcripts per million (TPM) - for comparison, only 20% of genes in RNAseq show expression higher than 15 TPM (data in Figure 2—figure supplement 3—source data 1 and Supplementary file 3). These 43 selected methyltransferases out of 200 (Supplementary file 2) all significantly increase expression upon infection at both 9 and 18 hr (statistical data in Figure 2—figure supplement 3—source data 1). Asterisks after gene names indicate SAM-dependent methyltransferases as categorized in Flybase; some of the unlabeled genes may still belong to SAM-dependent methyltransferases.
-
Figure 2—figure supplement 3—source data 1
The MS Excel file containing the raw data/numerical values used to generate the plots in the figure.
- https://cdn.elifesciences.org/articles/105039/elife-105039-fig2-figsupp3-data1-v1.xlsx
Figure 3
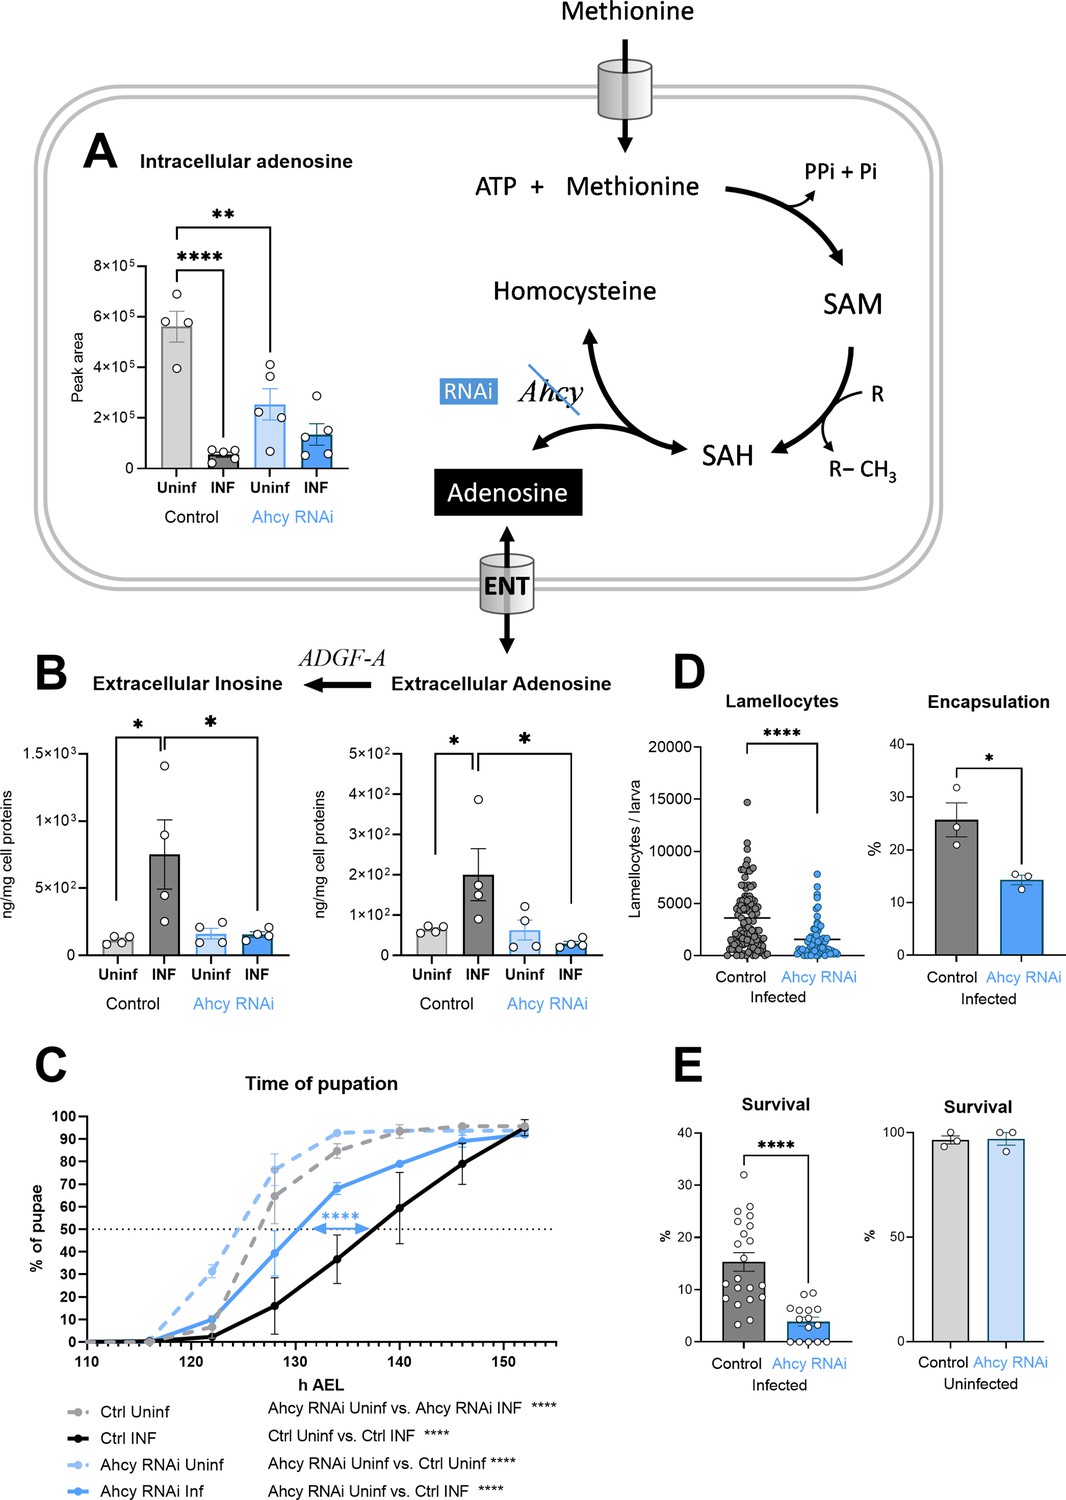
Generation of adenosine in the SAM transmethylation pathway and its systemic effects.
(A) Levels of intracellular adenosine in hemocytes shown as the mean metabolite amount expressed by the normalized peak area at 20 hpi. Infection significantly decreases the level in control hemocytes (uninfected - Uninf - light gray vs. infected - INF - dark gray). Hemocyte-specific adenosylhomocysteinase knockdown (Ahcy RNAi; uninfected - Uninf - light blue and infected - INF - dark blue) significantly decreases intracellular adenosine in the uninfected state. (B) Levels of extracellular adenosine (right), released from hemocytes ex vivo after 20 min, and extracellular inosine (left) generated by adenosine deaminase ADGF-A. While infection leads to increased release of adenosine and generated inosine in the control (gray), no such increase is detected with Ahcy RNAi (blue). (C) Pupation is delayed upon infection in control larvae (n=270, uninfected dashed gray line and n=240, infected solid black line) but significantly less in hemocyte-specific Ahcy RNAi larvae (n=260, uninfected dashed blue line and n=265, infected solid blue line). Lines represent percentages of pupae at hours after egg laying (h AEL); rates were compared using Log-rank survival analysis. (D) The number of lamellocytes as well as encapsulation efficiency is significantly lower in infected Ahcy-RNAi (blue) larvae compared to infected control (gray). (E) Percentage of infected larvae surviving to adulthood is significantly lower in Ahcy-RNAi (blue) compared to control (gray) while the survival of uninfected individuals is not affected. (A,B,E) Bars represent means with SEM of uninfected (Uninf, light gray) and infected (INF, dark gray) control and uninfected (Uninf, light blue) and infected (INF, dark blue) Ahcy-RNAi samples; each dot represents a biological replicate; (D) dots represent the number of lamellocytes in a larva and the line mean; numerical values are in Figure 3—source data 1 and Supplementary file 1; asterisks represent significant differences between samples tested and unpaired t test (*p<0.05, **p<0.01, ***p<0.001, ****p<0.0001).
-
Figure 3—source data 1
The MS Excel file containing the raw data/numerical values used to generate the plots in the figure.
- https://cdn.elifesciences.org/articles/105039/elife-105039-fig3-data1-v1.xlsx
Figure 4
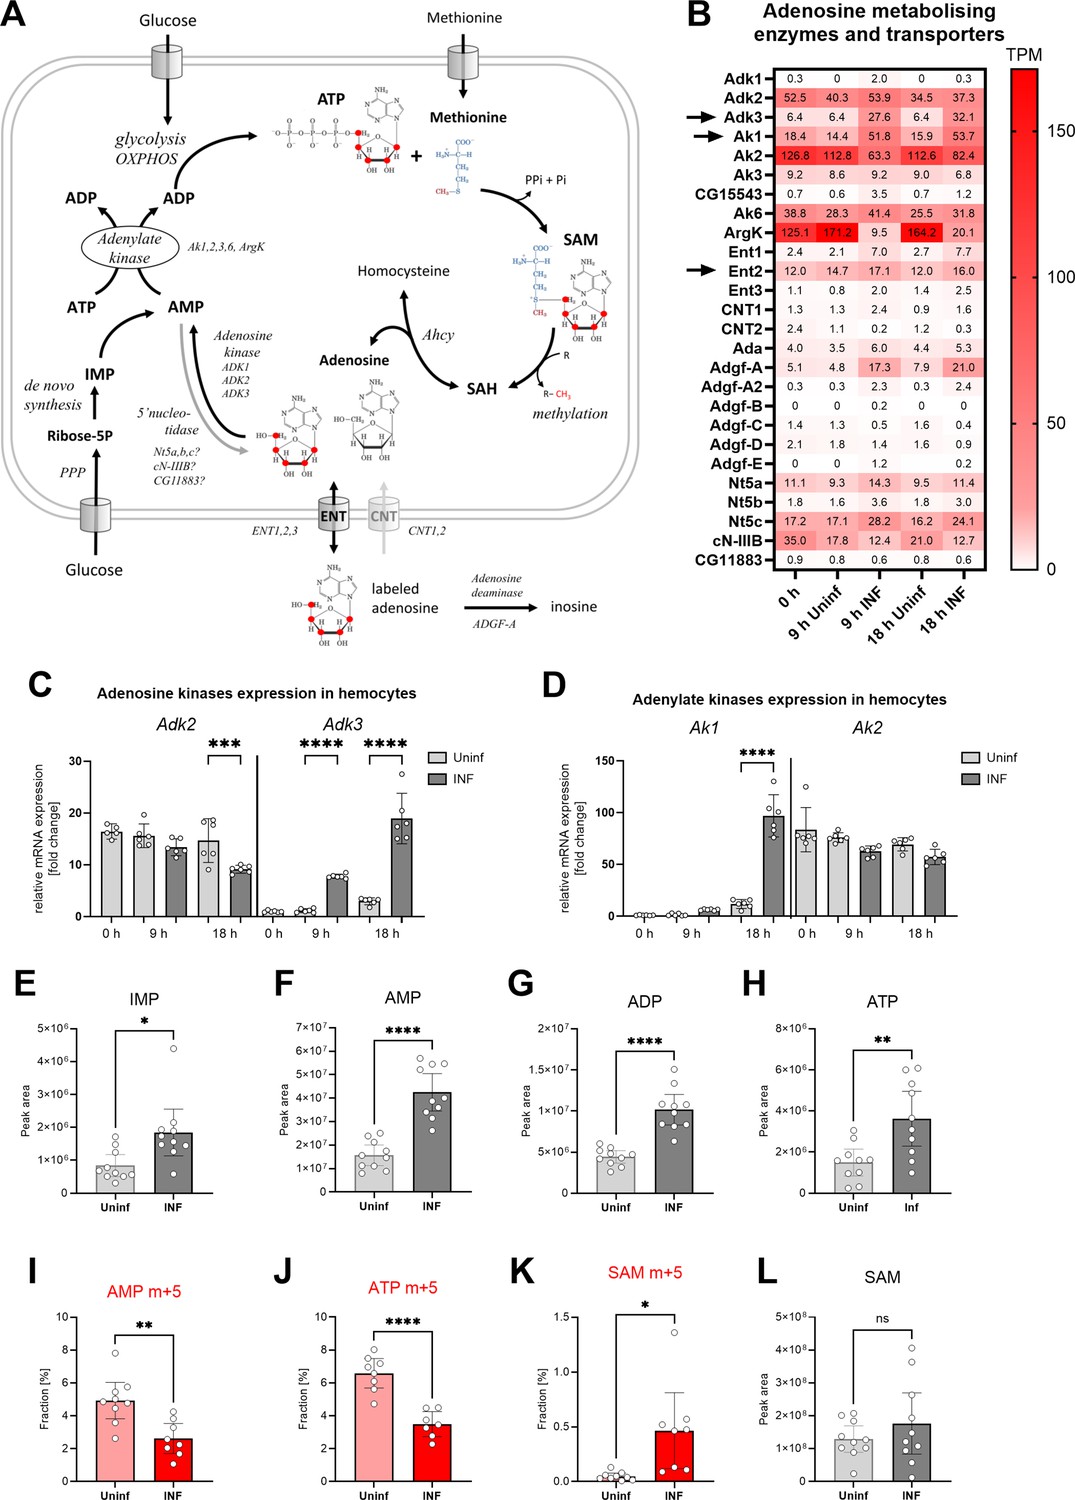
Analysis of adenosine recycling to SAM in larval hemocytes by ex vivo stable 13C isotope tracing.
(A) Schematic representation of the SAM transmethylation pathway, de novo purine synthesis and adenosine recycling to ATP and SAM and labeling with adenosine-13C5 from media (red 13 represents the labeled carbon). Enzymes and processes are italicized. (B) Expression heat map (bulk RNAseq) of adenosine metabolizing enzymes and transporters in circulating hemocytes from uninfected (Uninf) and infected (INF) third instar larvae collected at 0, 9, and 18 hpi (0 hpi = 72 hr after egg laying). Means of 6 replicates (10 replicates in case of 18 hr INF) shown in each cell are transcripts per million (TPM) - for comparison, only 20% of genes in RNAseq show expression higher than 15 TPM (data in Figure 4—source data 1 and Supplementary file 3). (C, D) Expression analysis of adenosine kinases Adk2, 3 (C) and adenylate kinases Ak1, 2 (D) in circulating hemocytes from uninfected (Uninf) and infected (INF) third instar larvae collected at 0, 9, and 18 hpi by RT-qPCR. Bars show fold change compared to 0 hr Adk3 samples (expression levels were normalized to RpL32 expression in each sample), each dot represents a biological replicate. (E-H, L) Total levels of IMP (E), AMP (F), ADP (G), ATP (H) and S-adenosylmethionine - SAM (L) in hemocytes shown as the mean metabolite amounts expressed by the normalized peak area. (I-K) 13C-labeling of metabolites in hemocytes, which were incubated ex vivo for 20 min in media containing 10 µM adenosine-13C5. The graphs show the fraction of the compound with five 13C-labeled carbons – AMP m+5 (I), ATP m+5 (J) and SAM m+5 (K). (C-L) Bars represent mean values with 95% CI of uninfected (Uninf, light gray or pink) and infected (INF, dark gray or red) samples; each dot represents a biological replicate (numerical values in Figure 4—source data 1 and Supplementary file 1); asterisks represent significant differences between samples tested by tested by ordinary one-way ANOVA Sidak’s multiple comparison test (C,D) and unpaired t test (E-L) (*p<0.05, **p<0.01, ***p<0.001, ****p<0.0001).
-
Figure 4—source data 1
The MS Excel file containing the raw data/numerical values used to generate the plots in the figure.
- https://cdn.elifesciences.org/articles/105039/elife-105039-fig4-data1-v1.xlsx
Figure 5 with 1 supplement
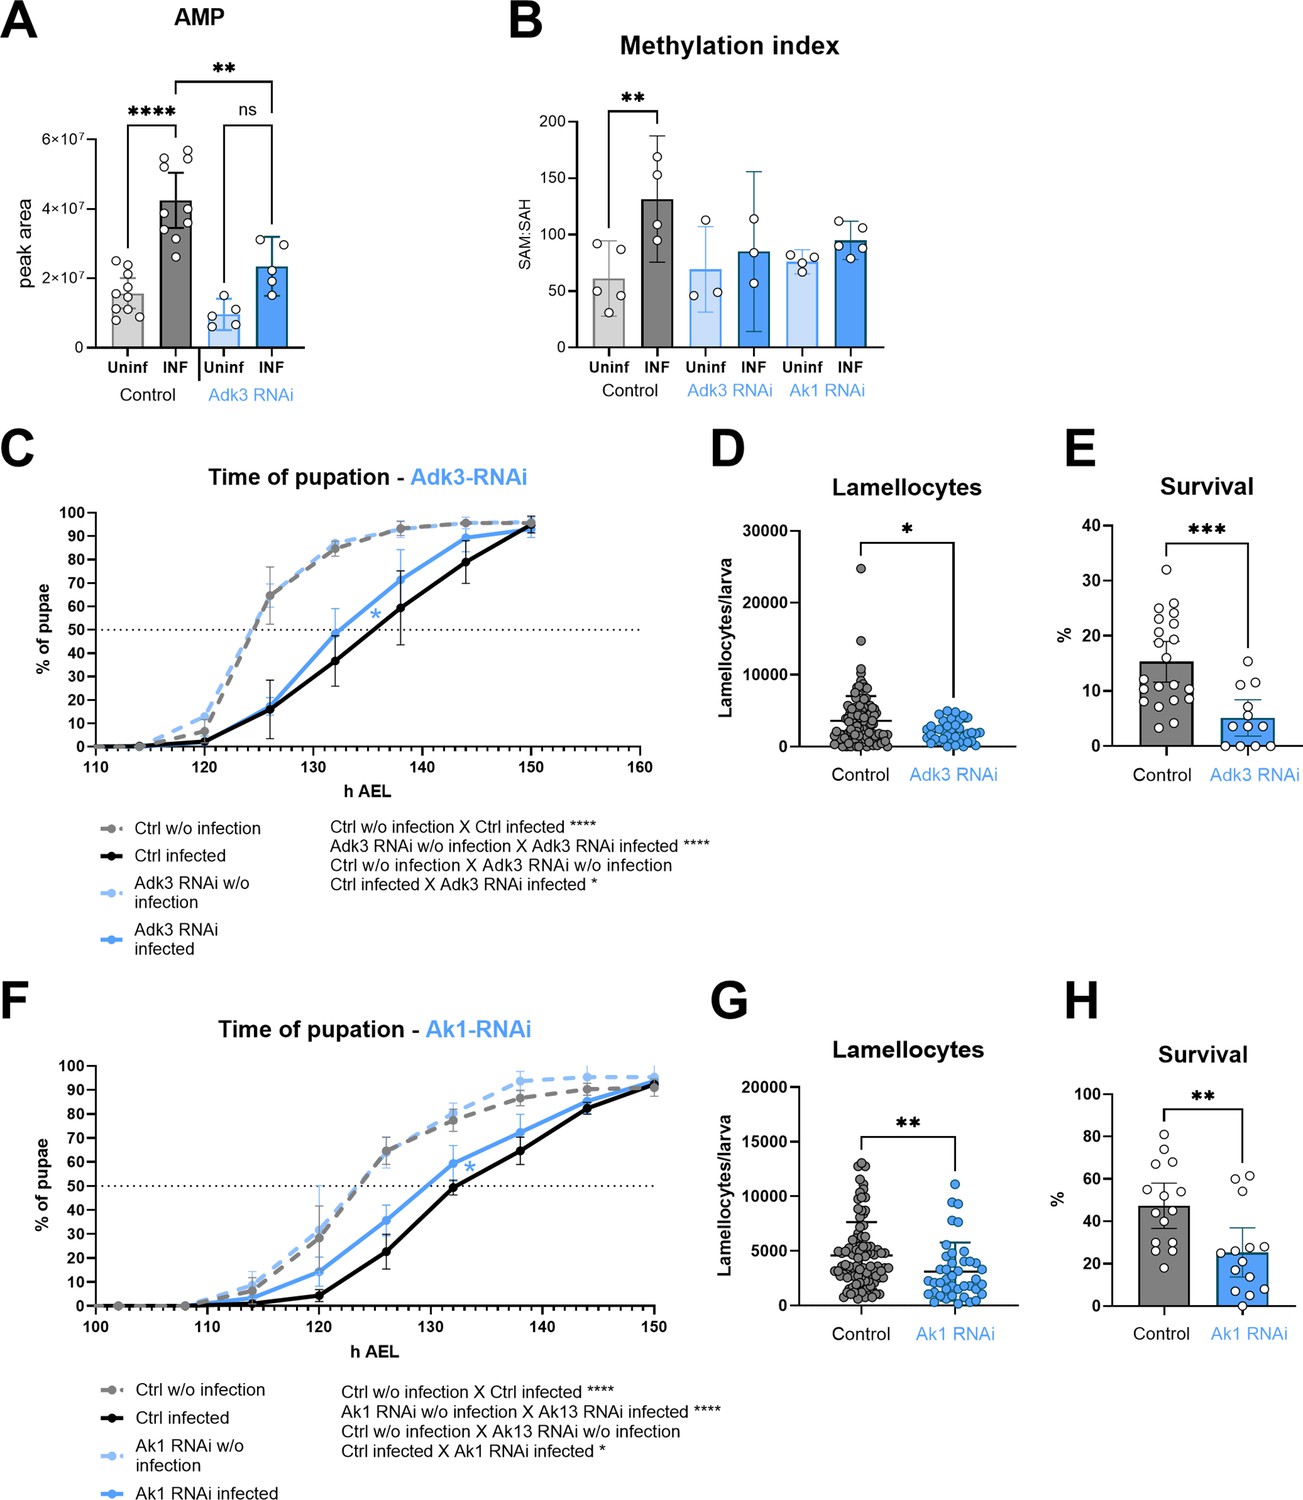
Silencing of adenosine kinase and adenylate kinase in hemocytes affects the SAM transmethylation pathway and immune response.
(A) Total levels of AMP in hemocytes shown as the mean metabolite amounts expressed by the normalized peak area. Infection significantly increases the AMP level in control hemocytes (uninfected - Uninf - light gray vs. infected - INF - dark gray). Hemocyte-specific adenosine kinase Adk3 knockdown (Adk3 RNAi; uninfected - Uninf - light blue and infected - INF - dark blue) significantly decreases AMP during infection compared to control. (B) Methylation index, calculated as the ratio of SAM:SAH levels (peak areas; numerical values in Figure 5—source data 1 and Supplementary file 1), in control (uninfected - Uninf - light gray and infected - INF - dark gray) and in hemocyte-specific Adk3-RNAi and adenylate kinase Ak1-RNAi (uninfected - Uninf - light blue and infected - INF - dark blue). (C) Pupation is delayed (10 hr) upon infection in control larvae (n=270, uninfected dashed gray line and n=240, infected solid black line) but significantly less (7 hr) in hemocyte-specific Adk3 RNAi larvae (n=275, uninfected dashed blue line and n=275, infected solid blue line). (D) The number of lamellocytes is significantly lower in infected Adk3-RNAi (blue) larvae compared to infected control (gray). (E) Percentage of infected larvae surviving to adulthood is significantly lower in Adk3-RNAi (blue) compared to control (gray). (F) Pupation is delayed (9 hr) upon infection in control larvae (n=225, uninfected dashed gray line and n=270, infected solid black line) but significantly less (6 hr) in hemocyte-specific Ak1 RNAi larvae (n=195, uninfected dashed blue line and n=225, infected solid blue line). (G) The number of lamellocytes is significantly lower in infected Ak1-RNAi (blue) larvae compared to infected control (gray). (H) Percentage of infected larvae surviving to adulthood is significantly lower in Ak1-RNAi (blue) compared to control (gray). (A,B,D,E,G,H) Bars/lines represent mean values with 95% CI of uninfected (Uninf, light grey) and infected (INF, dark grey) control and uninfected (Uninf, light blue) and infected (INF, dark blue) Adk3-RNAi or Ak1-RNAi samples; each dot represents one biological replicate (numerical values in Figure 5—source data 1 and Supplementary file 1); asterisks represent significant differences between samples tested by unpaired t-test or ordinary one-way ANOVA Tukey’s multiple comparison test (*p<0.05, **p<0.01, ***p<0.001, ****p<0.0001). (C,F) Lines represent percentages of pupae at hours after egg laying (h AEL); rates were compared using Log-rank survival analysis.
-
Figure 5—source data 1
The MS Excel file containing the raw data/numerical values used to generate the plots in the figure.
- https://cdn.elifesciences.org/articles/105039/elife-105039-fig5-data1-v1.xlsx
Figure 5—figure supplement 1
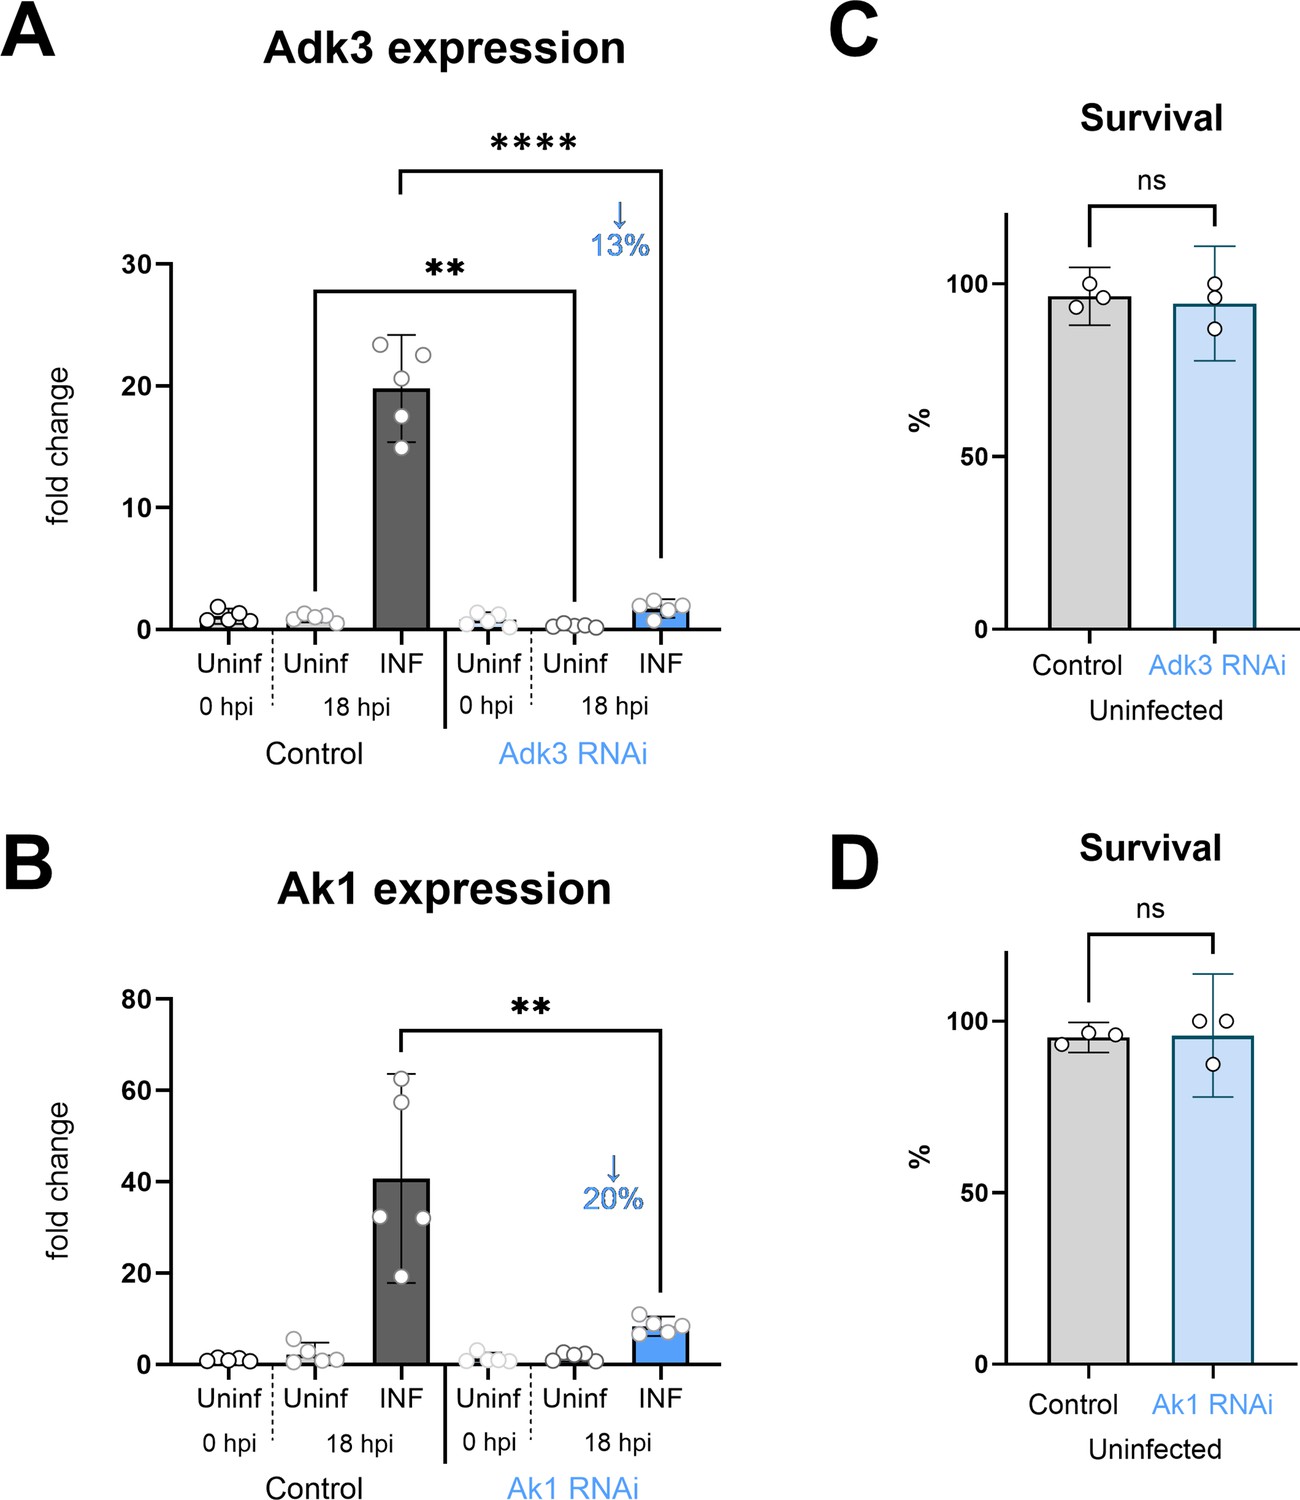
Adenosine kinase Adk3 and adenylate kinase Ak1 knockdown efficiency in hemocytes.
Analysis of Adk3 (A) and Ak1 (B) knockdown efficiency at 0 and 18 hpi by RT-qPCR. RNAi was specifically induced in hemocytes by SrpD-Gal4 tubP-GAL80ts driven expression of Adk3-RNAiHMC06354 or UAS-Ak1-RNAiGL00177 in larvae maintained at 18 °C for the first 3 days of development and then transferred to 25 °C. RNAi reduces Adk3 expression to 13% and Ak1 expression to 20% of control during infection (18 hpi). Bars represent means with 95% CI of uninfected (Uninf, light gray) and infected (INF, dark gray) control (driver crossed to P{CaryP}Msp300attP40 or P{CaryP}attP2 control without RNAi) and uninfected (Uninf, light blue) and infected (INF, dark blue) Ahcy-RNAi samples; each dot represents a biological replicate (numerical values in Figure 5—figure supplement 1—source data 1); asterisks indicate significant differences between samples tested by ordinary one-way ANOVA Tukey’s multiple comparison test (****p<0.0001). Development and survival to adulthood is not affected either by SrpD-Gal4 tubP-GAL80ts driven expression of Adk3-RNAiHMC06354 (C) or UAS-Ak1-RNAiGL00177(D).
-
Figure 5—figure supplement 1—source data 1
The MS Excel file containing the raw data/numerical values used to generate the plots in the figure.
- https://cdn.elifesciences.org/articles/105039/elife-105039-fig5-figsupp1-data1-v1.xlsx
Figure 6
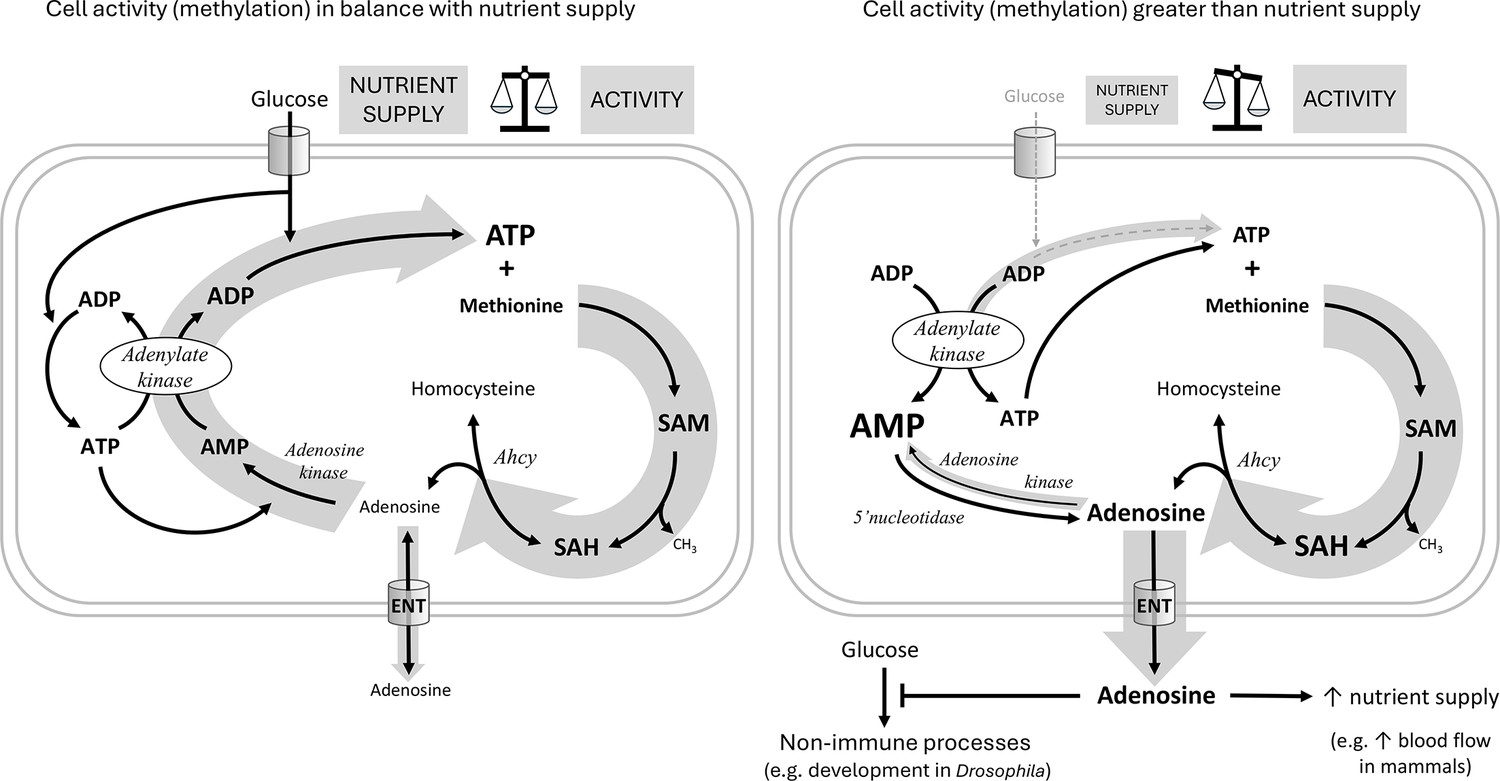
Hypothetical role of adenosine as a sensor of the balance between cell activity and nutrient supply.
The hypothetical scheme shows an immune cell with either sufficient (left) or insufficient (right) nutrient supply for the given cellular activity. For each individual transmethylation event using S-adenosylmethionine (SAM) as a methyl group donor and producing S-adenosylhomocysteine (SAH), S-adenosylhomocysteinase (Ahcy) generates one molecule of adenosine (and homocysteine). Adenosine thus reflects the sum of all SAM transmethylations in the cell and may be considered as a proxy for cell activity (thick gray arrow on the right). If there are enough nutrients (cell on the left) to maintain high levels of ATP, adenosine can be recycled first to AMP by adenosine kinase, which requires the first ATP, then to ADP by adenylate kinase, which requires the second ATP, and finally to ATP by glycolysis (or oxidative phosphorylation) using glucose (the gray arrow on the left as thick as the one on the right expresses the balance). Recycled ATP can then enter the next round of transmethylation with methionine to form SAM. If there are not enough nutrients (cell on the right, thin gray arrow on the left) to regenerate ATP from ADP, ATP is produced from two ADP molecules by adenylate kinase, simultaneously generating AMP. Accumulated AMP prevents adenosine recycling by adenosine kinase (thin gray arrow on the left), and on the contrary, more adenosine can be produced from AMP by 5’nucleotidase. In this case, adenosine is pushed out of the cell (thick gray arrow down) via the equilibrative nucleoside transporter (ENT) and becomes an extracellular signaling molecule. Extracellular adenosine can, for example, suppress the development of Drosophila larvae or increase blood flow in mammals to provide more nutrients to immune cells.
Tables
Key resources table
| Reagent type (species) or resource | Designation | Source or reference | Identifiers | Additional information |
|---|---|---|---|---|
| Gene (Drosophila melanogaster) | Ahcy | GenBank | FLYB: FBgn0014455 | |
| Gene (Drosophila melanogaster) | Ak1 | GenBank | FLYB: FBgn0022709 | |
| Gene (Drosophila melanogaster) | Adk3 | GenBank | FLYB: FBgn0026602 | |
| Genetic reagent (Drosophila melanogaster) | UAS-Ahcy-RNAi | Bloomington Drosophila Stock Center | BDSC: 67848 FLYB: FBti0186788 | |
| Genetic reagent (Drosophila melanogaster) | UAS-Adk3-RNAi | Bloomington Drosophila Stock Center | BDSC: 67755 FLYB: FBti0185498 | |
| Genetic reagent (Drosophila melanogaster) | UAS-Adk2-RNAi | Bloomington Drosophila Stock Center | BDSC: 35167 FLYB: FBti0144142 | |
| Genetic reagent (Drosophila melanogaster) | UAS-Ak1-RNAi | Bloomington Drosophila Stock Center | BDSC: 35582 FLYB: FBti0144266 | |
| Genetic reagent (Drosophila melanogaster) | P{CaryP}attP2 | Bloomington Drosophila Stock Center | BDSC: 36303 FLYB: FBst0036303 | |
| Genetic reagent (Drosophila melanogaster) | P{CaryP}Msp300attP40 | Bloomington Drosophila Stock Center | BDSC: 36304 FLYB: FBst0036304 | |
| Genetic reagent (Drosophila melanogaster) | SrpD-Gal4 | Crozatier | FLYB: FBtp0020112 | |
| Genetic reagent (Drosophila melanogaster) | P{tubP-GAL80ts}2 | Bloomington Drosophila Stock Center | BDSC: 7017 FLYB: FBti0027797 | |
| Biological sample (Leptopilina boulardi) | Leptopilina boulardi | Crozatier | NCBI:txid63433, RRID:NCBITaxon_63433 | |
| Sequence-based reagent | Ahcy Fw | This paper | PCR primers | AAGCTGTCGCACAAATGGCG |
| Sequence-based reagent | Ahcy Rev | This paper | PCR primers | GCACGTTGTGCACCAGGAAC |
| Sequence-based reagent | AhcyL1 Fw | This paper | PCR primers | GGCGAGACGGAAGAGGACT |
| Sequence-based reagent | AhcyL1 rev | This paper | PCR primers | AGAGAGCTGATAGAGACGGTG |
| Sequence-based reagent | Adk2 Fw | This paper | PCR primers | AACTTCACCATCGATCACCTGG |
| Sequence-based reagent | Adk2 Rev | This paper | PCR primers | TAGGAACGGTCGCTGTTTGG |
| Sequence-based reagent | Adk3 Fw | This paper | PCR primers | CTGGACATGGAGAAACTCAACC |
| Sequence-based reagent | Adk3 Rev | This paper | PCR primers | AAAGAAGAGCGCGTCTGTGC |
| Sequence-based reagent | Ak1 Fw | This paper | PCR primers | CTCGGCATTGATCGTAAGGG |
| Sequence-based reagent | Ak1 Rev | This paper | PCR primers | CGATCTGGCGCTGTACTTTG |
| Sequence-based reagent | Ak2 Fw | This paper | PCR primers | GCTGAGAAGCTCGACACATTG |
| Sequence-based reagent | Ak2 Rev | This paper | PCR primers | CTCCAGTGACATCGTCCGTC |
| Sequence-based reagent | Ak3 Fw | This paper | PCR primers | GATCCAGCGATTCTTGACCC |
| Sequence-based reagent | Ak3 Rev | This paper | PCR primers | CGGATAACCGAGGTAGGCAAC |
| Sequence-based reagent | ArgK Fw | This paper | PCR primers | ATGGAGATGATGCGGAGATG |
| Sequence-based reagent | ArgK Rev | This paper | PCR primers | TCGACGACCACTTCCTGTTC |
| Sequence-based reagent | Cbs Fw | This paper | PCR primers | AGATTACGCCCAACATCCTCG |
| Sequence-based reagent | Cbs Rev | This paper | PCR primers | AATGCGGTCCTTCACTGATCC |
| Sequence-based reagent | CG10621 Fw | This paper | PCR primers | CATCGAGCTGATAAAGAACACGG |
| Sequence-based reagent | CG10621 Rev | This paper | PCR primers | AATGGAGGCAATGATCAAAGGG |
| Sequence-based reagent | CG20623 Fw | This paper | PCR primers | ATGCCAAATTCTGGGTCTCCC |
| Sequence-based reagent | CG20623 Rev | This paper | PCR primers | AAAGGGGTCACGAATAGTGGG |
| Sequence-based reagent | RpL32 Fw | This paper | PCR primers | AAGCTGTCGCACAAATGGCG |
| Sequence-based reagent | RpL32 Rev | This paper | PCR primers | GCACGTTGTGCACCAGGAAC |
| Sequence-based reagent | SamDC Fw | This paper | PCR primers | CAACGGTGACGATGATCTGC |
| Sequence-based reagent | SamDC Rev | This paper | PCR primers | AGTTTTAAGGATCCATCGTCGC |
| Sequence-based reagent | SamS Fw | This paper | PCR primers | CAAATCAGCGACGCTATCTTGG |
| Sequence-based reagent | SamS Rev | This paper | PCR primers | TGTCTCACGAACAACCTTCTGG |
| Chemical compound | L-methionine-13C5 | Sigma-Aldrich | 908339 | |
| Chemical compound | adenosine-13C5 | Cambridge Isotope Laboratories | CLM-3678 |
Additional files
-
Supplementary file 1
Metabolomics and stable 13C isotope tracing in circulating hemocytes during parasitoid wasp infection.
MS Excel sheets with stable 13C isotope tracing experiments. List of metabolites, their characterizations, identification, HPLC/HRMS parameters is on the first sheet [List of Metabolites]. Data from the following experiments are in individual sheets (values are raw or normalized areas under respective chromatographic peaks): [S1] Peak area of metabolites of interest for control and Ahcy RNAi hemocytes. [S2] – Combination of quantitative analysis (ng/sample) and peak area of metabolites of interest for control and Ahcy RNAi hemocytes incubated with 13C5 methionine. [S3] Peak area of metabolites of interest for control and Adk3 RNAi and Ak1 RNAi. [S4] Combination of quantitative analysis (ng/sample) and peak area of metabolites of interest for control and Adk3 RNAi and Ak1 RNAi hemocytes incubated with 13C5 adenosine. Raw data are available at figshare (https://doi.org/10.6084/m9.figshare.27291300.v1).
- https://cdn.elifesciences.org/articles/105039/elife-105039-supp1-v1.xlsx
-
Supplementary file 2
Methyltransferases gene expression analysis by bulk RNAseq of circulating hemocytes.
MS Excel sheets with expression of genes selected from Supplementary file 3, representing methyltransferases according to Flybase database.
- https://cdn.elifesciences.org/articles/105039/elife-105039-supp2-v1.xlsx
-
Supplementary file 3
Gene expression analysis by bulk RNAseq of circulating hemocytes.
MS Excel sheets with gene expression in circulating hemocytes. RNA was extracted 72 hours after (egg laying = time of infection = 0 hours, 81 hours after egg laying = 9 hours post infection/hpi and 90 hours after egg laying = 18 hpi), from hemocytes of the third instar w1118 larvae. This table was published in Kazek et al., 2024. Raw data are available at The European Nucleotide Archive under Study accession number: PRJEB74490 (secondary acc: ERP159178) (https://www.ebi.ac.uk/ena/browser/view/PRJEB74490).
- https://cdn.elifesciences.org/articles/105039/elife-105039-supp3-v1.xlsx
-
MDAR checklist
- https://cdn.elifesciences.org/articles/105039/elife-105039-mdarchecklist1-v1.docx
Download links
A two-part list of links to download the article, or parts of the article, in various formats.
Downloads (link to download the article as PDF)
Open citations (links to open the citations from this article in various online reference manager services)
Cite this article (links to download the citations from this article in formats compatible with various reference manager tools)
SAM transmethylation pathway and adenosine recycling to ATP are essential for systemic regulation and immune response
eLife 13:RP105039.
https://doi.org/10.7554/eLife.105039.3


