Teichoic acids in the periplasm and cell envelope of Streptococcus pneumoniae
- Univ. Grenoble Alpes, CNRS, CEA, IBS, France
- Univ. Grenoble Alpes, CNRS, DPM, France
- Molecular Microbiology and Structural Biochemistry, Université de Lyon, CNRS, France
Figures
Figure 1 with 1 supplement
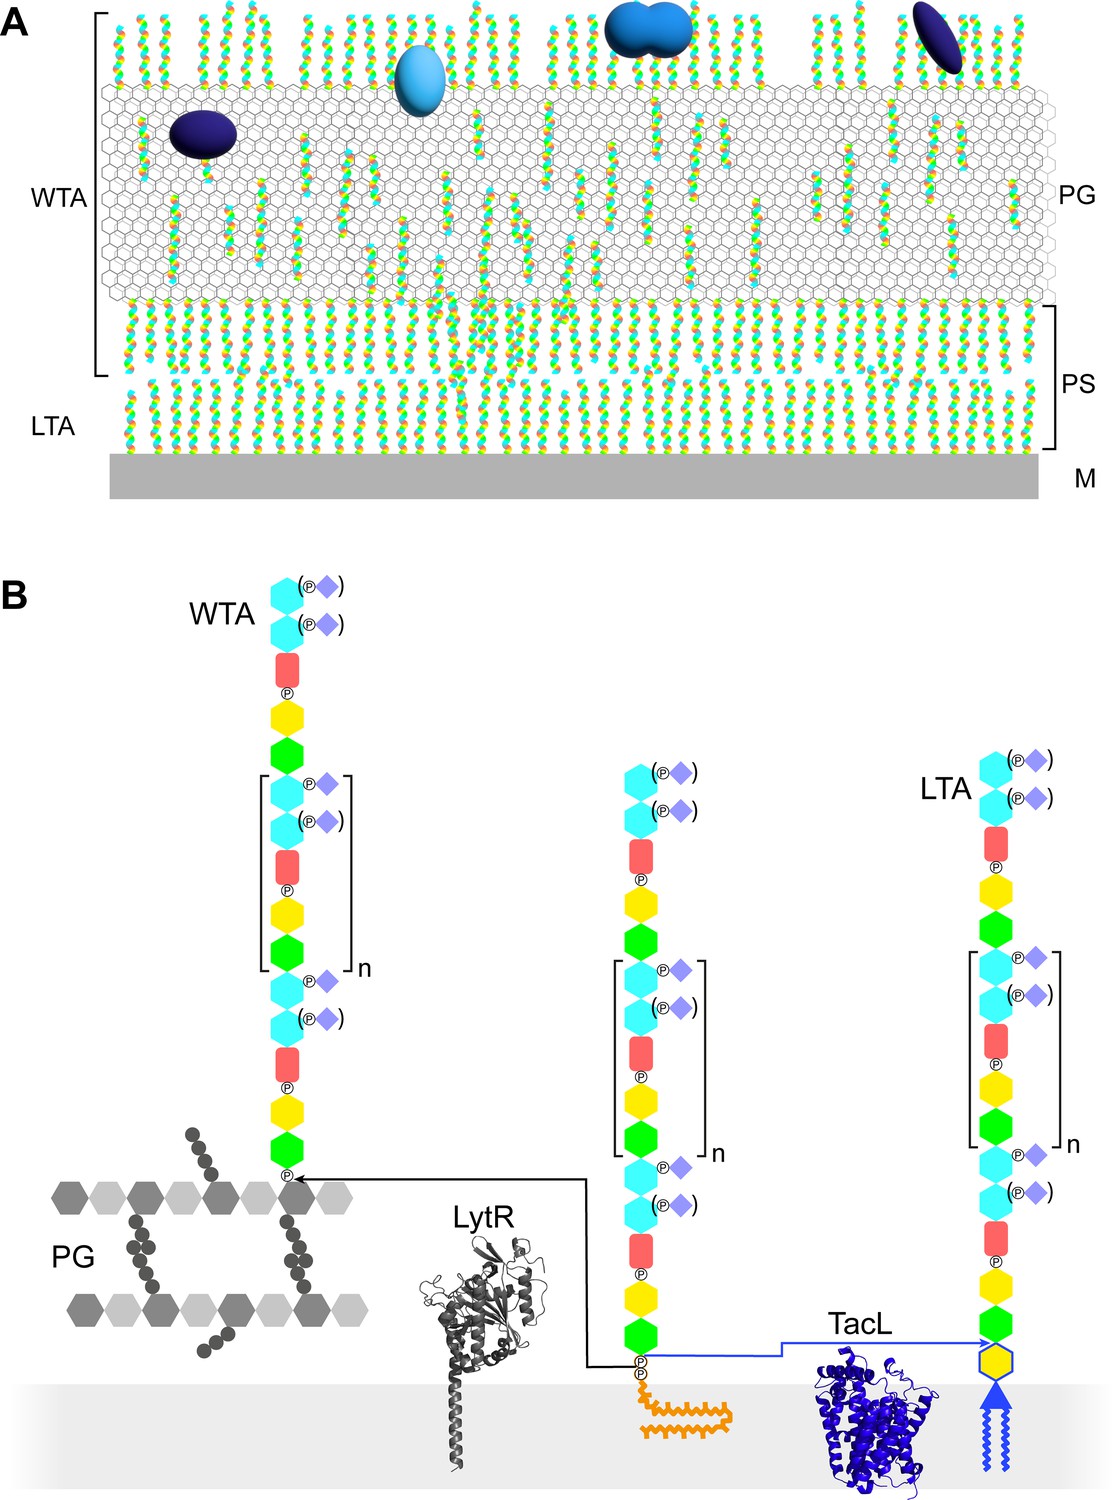
Models of the functions and structures of teichoic acids (TA) in S. pneumoniae.
(A) TA (multicolored rods) attached to the membrane (M) or to the peptidoglycan (PG) exclude each other to maintain a periplasmic space (PS) as proposed by Erickson, 2021. The sizes of the molecules are not to scale and their density in the different locations is arbitrary. Additional functions arise from the presentation of various choline-binding proteins (blue). (B) Polymerized TA attached to undecaprenyl pyrophosphate are transferred at the cell surface onto PG by the phosphotransferase LytR to form wall teichoic acids (WTA); or onto DGlcp-DAG by TacL to form lipoteichoic acids (LTA). The enzymes are depicted by their AlphaFold models. The most abundant TA species have 6 repeating units (n = 4).
Figure 1—figure supplement 1
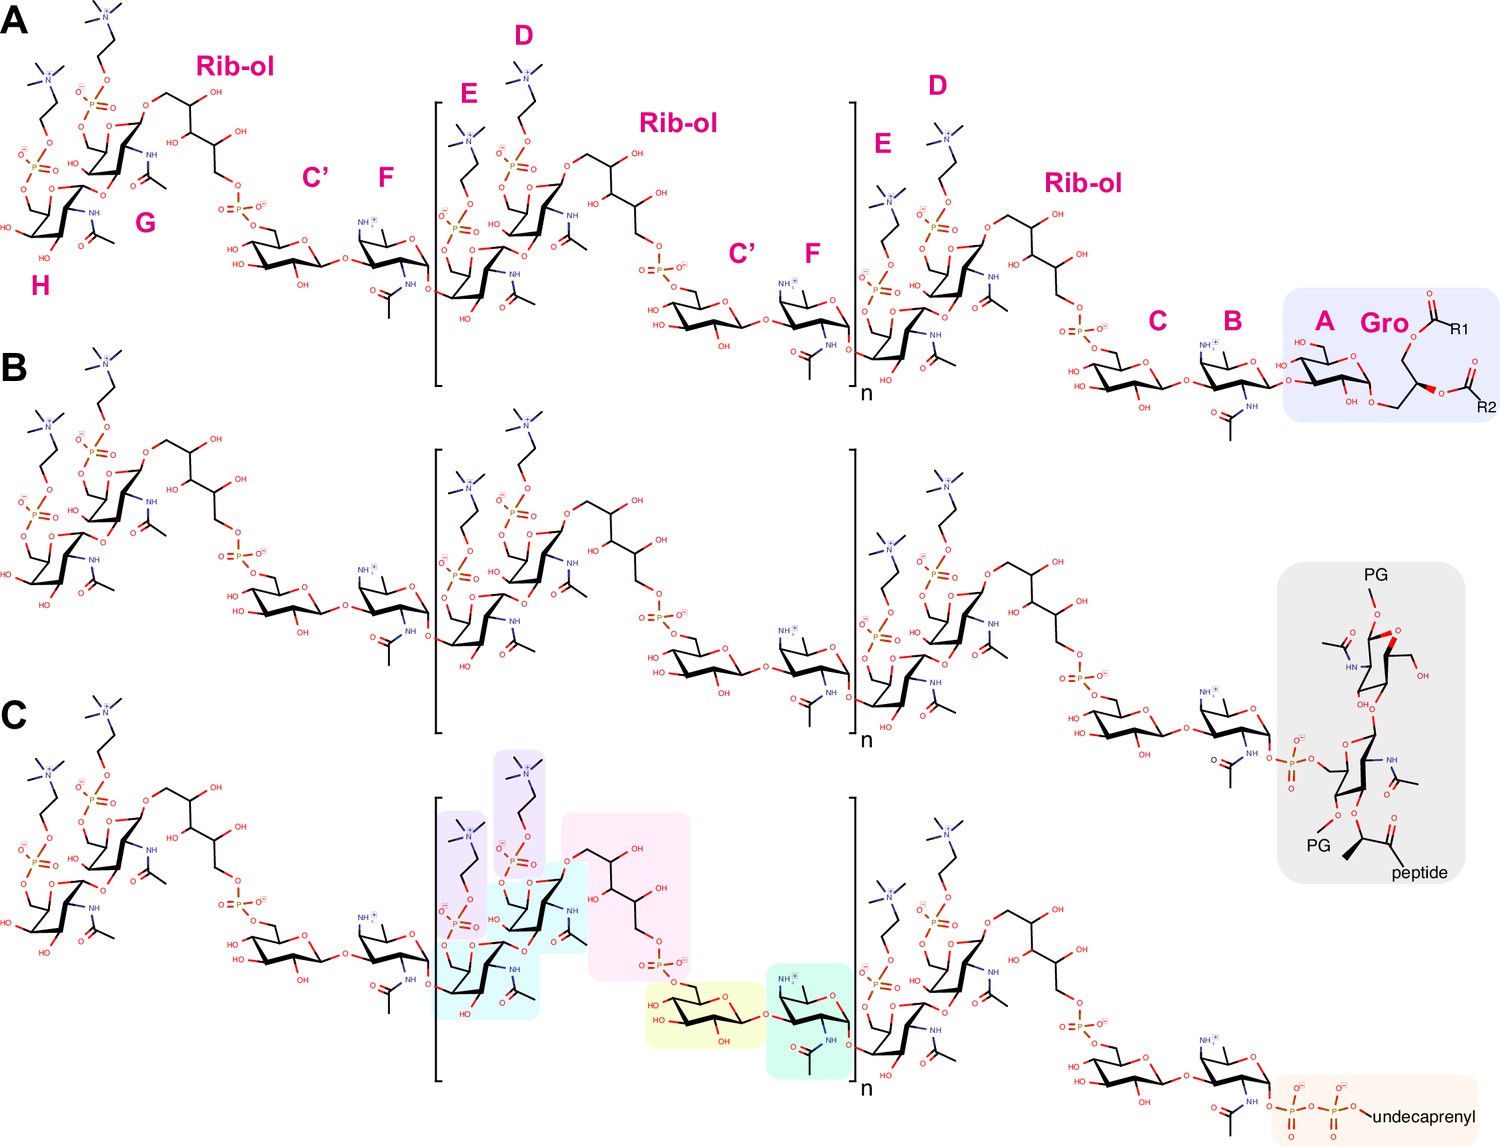
Chemical structure of TA.
Chemical structure of (A) lipoteichoic acids (LTA), (B) wall teichoic acids (WTA), and (C) the membrane-bound precursor. The constituent of the repeating unit are in green the acetamido-4-amino-6-deoxygalactopyranose (AATGalpNAc), in yellow the glucopyranose (DGlcp), in pink the ribitol-5-phosphate, in cyan the N-acetylgalactosamine (DGalpNAc), in purple the phosphocholine. One or both phosphocholine residues can be absent on the terminal unit. Some units may also lack the phosphocholine on the proximal DGalpNAc. The most abundant species have 6 repeating units (n = 4). LTA are β-1-linked to monoglucosyldiacylglycerol (blue). WTA are α-1-linked via a phosphodiester to position 6 of a N-acetyl muramic acid of the peptidoglycan (PG, gray). The precursors remain attached to an undecaprenyl pyrophosphate (orange). The one-letter nomenclature of constituents proposed by Gisch et al., 2013 is given in magenta around the LTA.
Figure 2 with 3 supplements
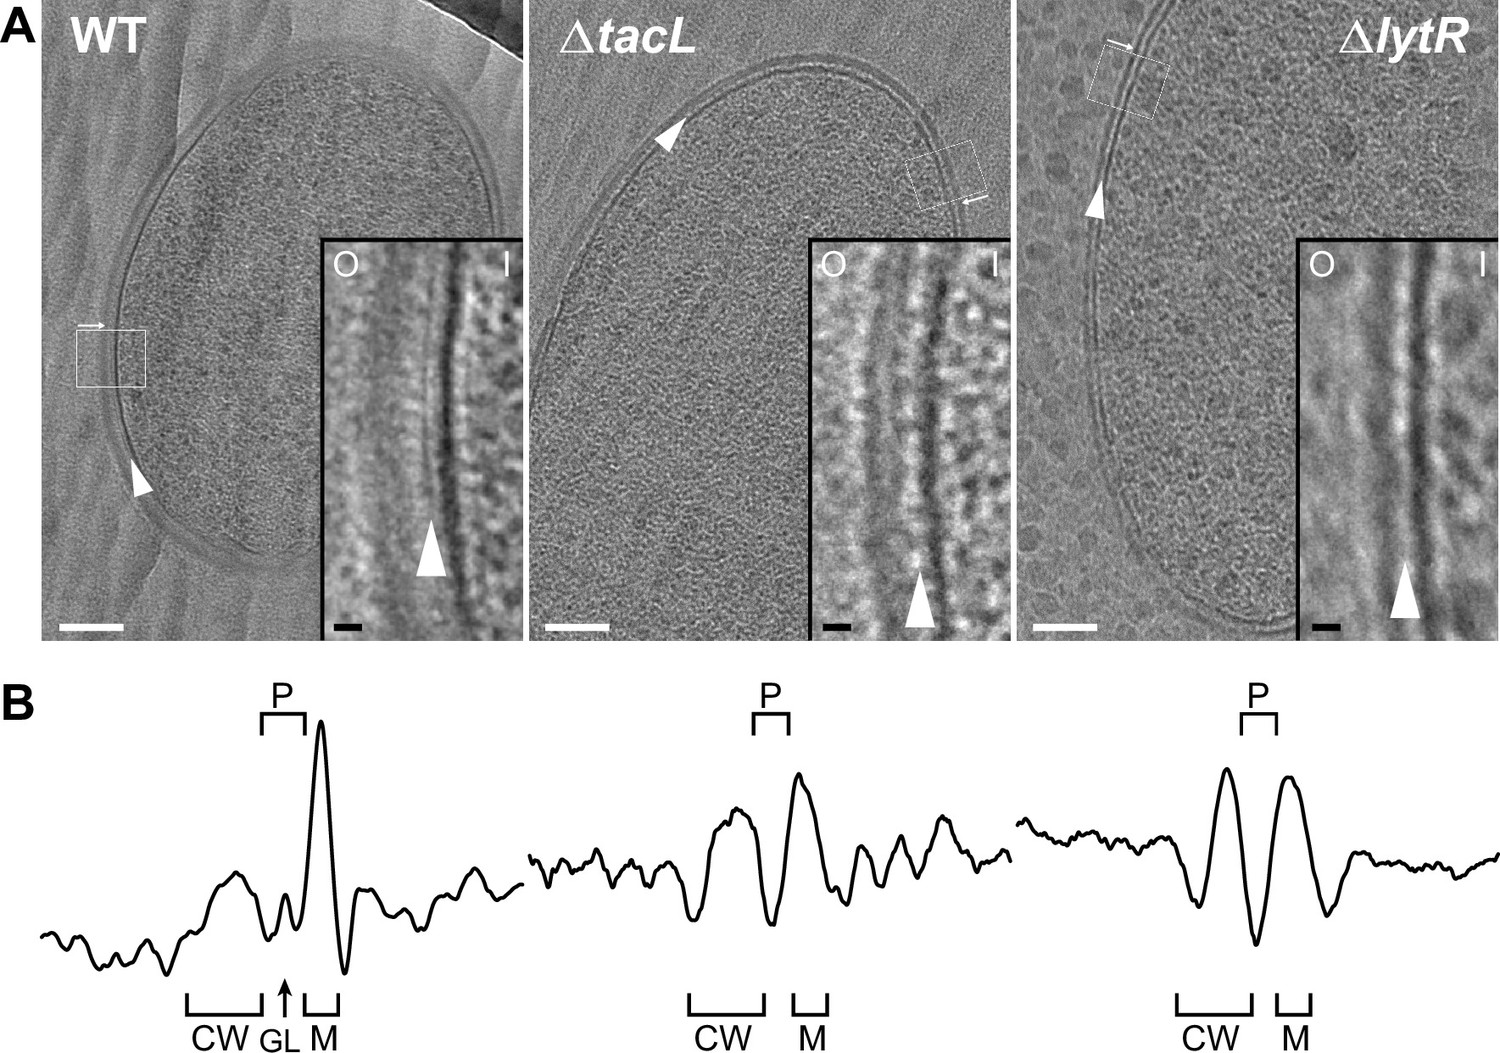
Electron micrographs of wild type (WT), ΔtacL, and ΔlytR strains.
(A) CEMOVIS micrographs allowing full view (white scale bar, 100 nm) and zoom (black scale bar, 10 nm) of WT and mutant strains. O and I signal the outer and inner sides of the cell envelope. A periplasmic space can be observed in all three strains. A granular layer is seen as a thin black line in the periplasmic space (arrowheads) of WT cells, whereas it is not observed in the ΔlytR and ΔtacL strains. (B) Corresponding pixel intensity profile of the cell envelope is shown for each strain. The intensity profiles were measured perpendicularly to the cell surface in regions boxed in white, and show variations in the density of the envelope ultrastructure. CW, cell wall; P, periplasm; GL, granular layer; M, membrane.
Figure 2—figure supplement 1
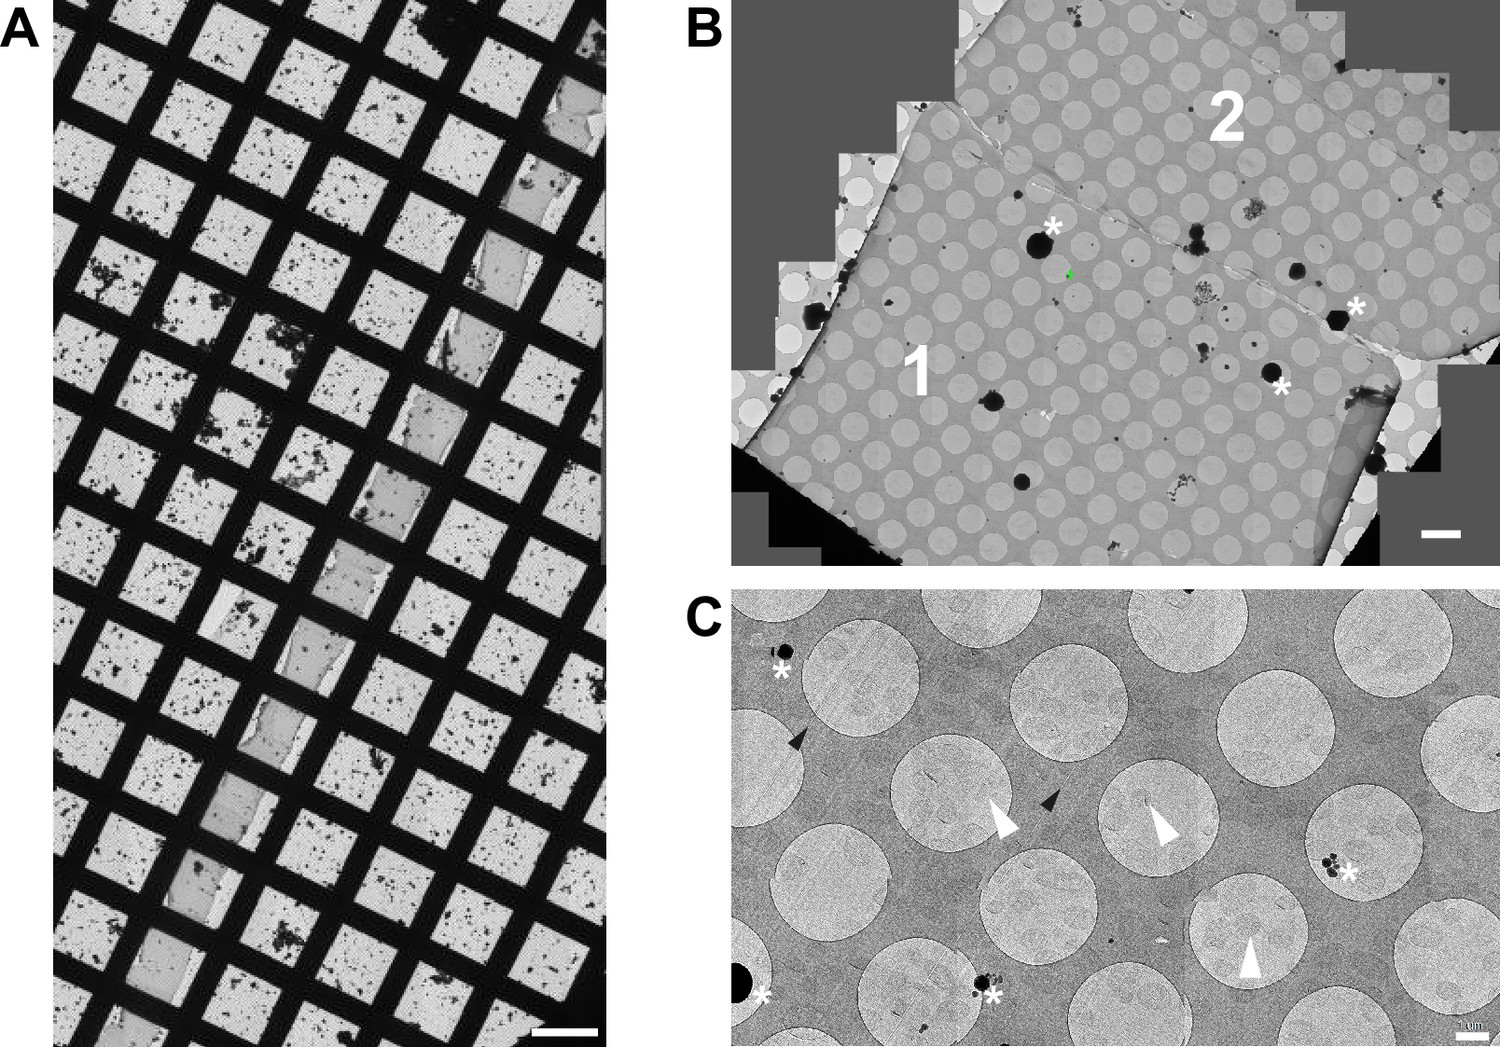
Low-magnification CEMOVIS images of S. pneumoniae ΔtacL cells.
(A) The ribbon spans the entire EM grid. Scale bar, 100 µm. (B) Stitching of several acquisitions areas showing one cryo-section (Brown et al., 2013) and half of a second one (Denapaite et al., 2012) inside the ribbon. Scale bar, 5 µm. (C). Cells are uniformly distributed in the section. Representative acquisition areas, where cells are located at the center of a hole in the carbon, are pointed with a white arrowhead. Scale bar, 1 µm. Black arrowheads: knife marks; asterisks: ice contamination. Some crevasses can be observed but the section is devoid of cracks and very low ice contamination is present on the surface. Knife marks along the cutting direction of the knife cannot be avoided, although compression artifact is rather limited as the cells preserve a round shape. Thus, it can be said reasonably that the sections are exploitable and that artifacts induced by cryo-sectioning do not impair image interpretation and ultrastructure measurement.
Figure 2—figure supplement 2
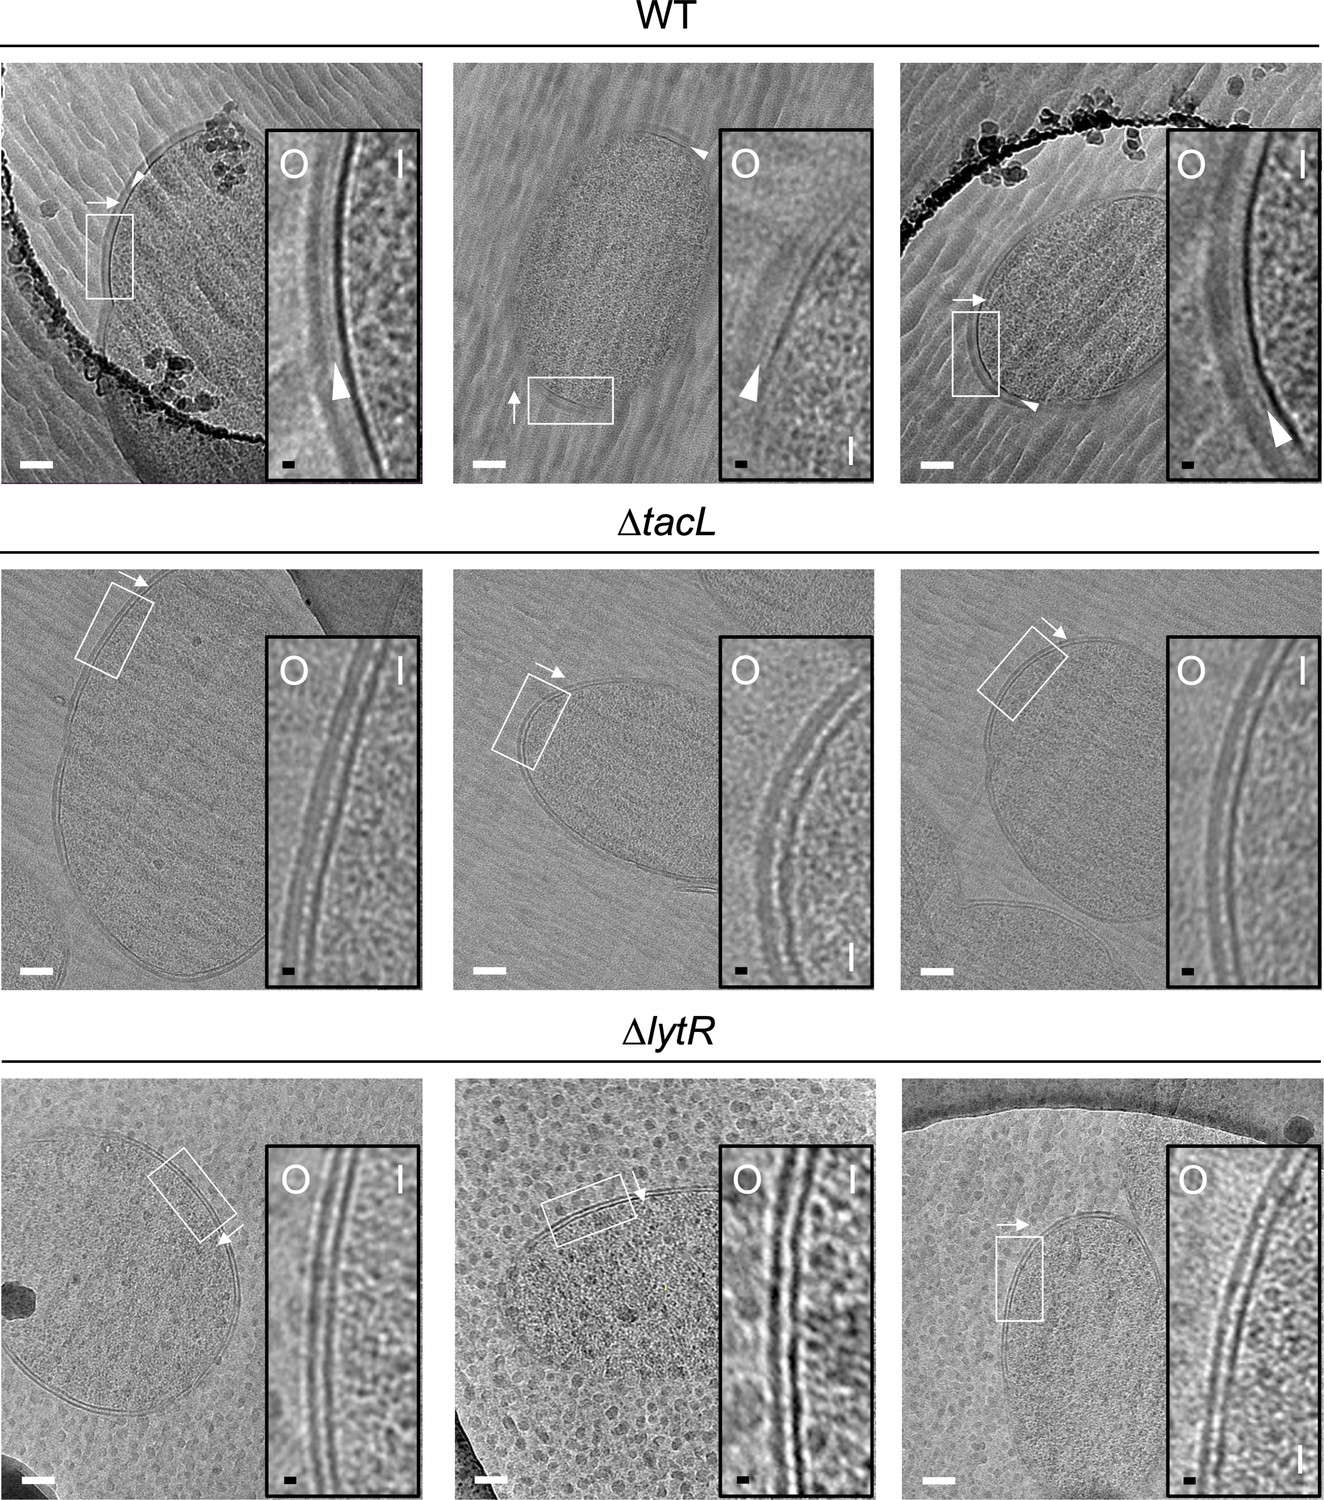
Electron micrographs of wild type (WT), ΔtacL, and ΔlytR strains.
CEMOVIS micrographs allowing full view (white scale bar, 100 nm) and zoom (black scale bar, 10 nm) of WT and mutant strains. O and I signal the outer and inner sides of the cell envelope. A periplasmic space can be observed in all three strains. A granular layer is seen as a thin black line in the periplasmic space (arrowheads) of WT cells, whereas it is not observed in the ΔlytR and ΔtacL strains.
Figure 2—figure supplement 3
Electron micrographs of pneumococcal cell envelope.
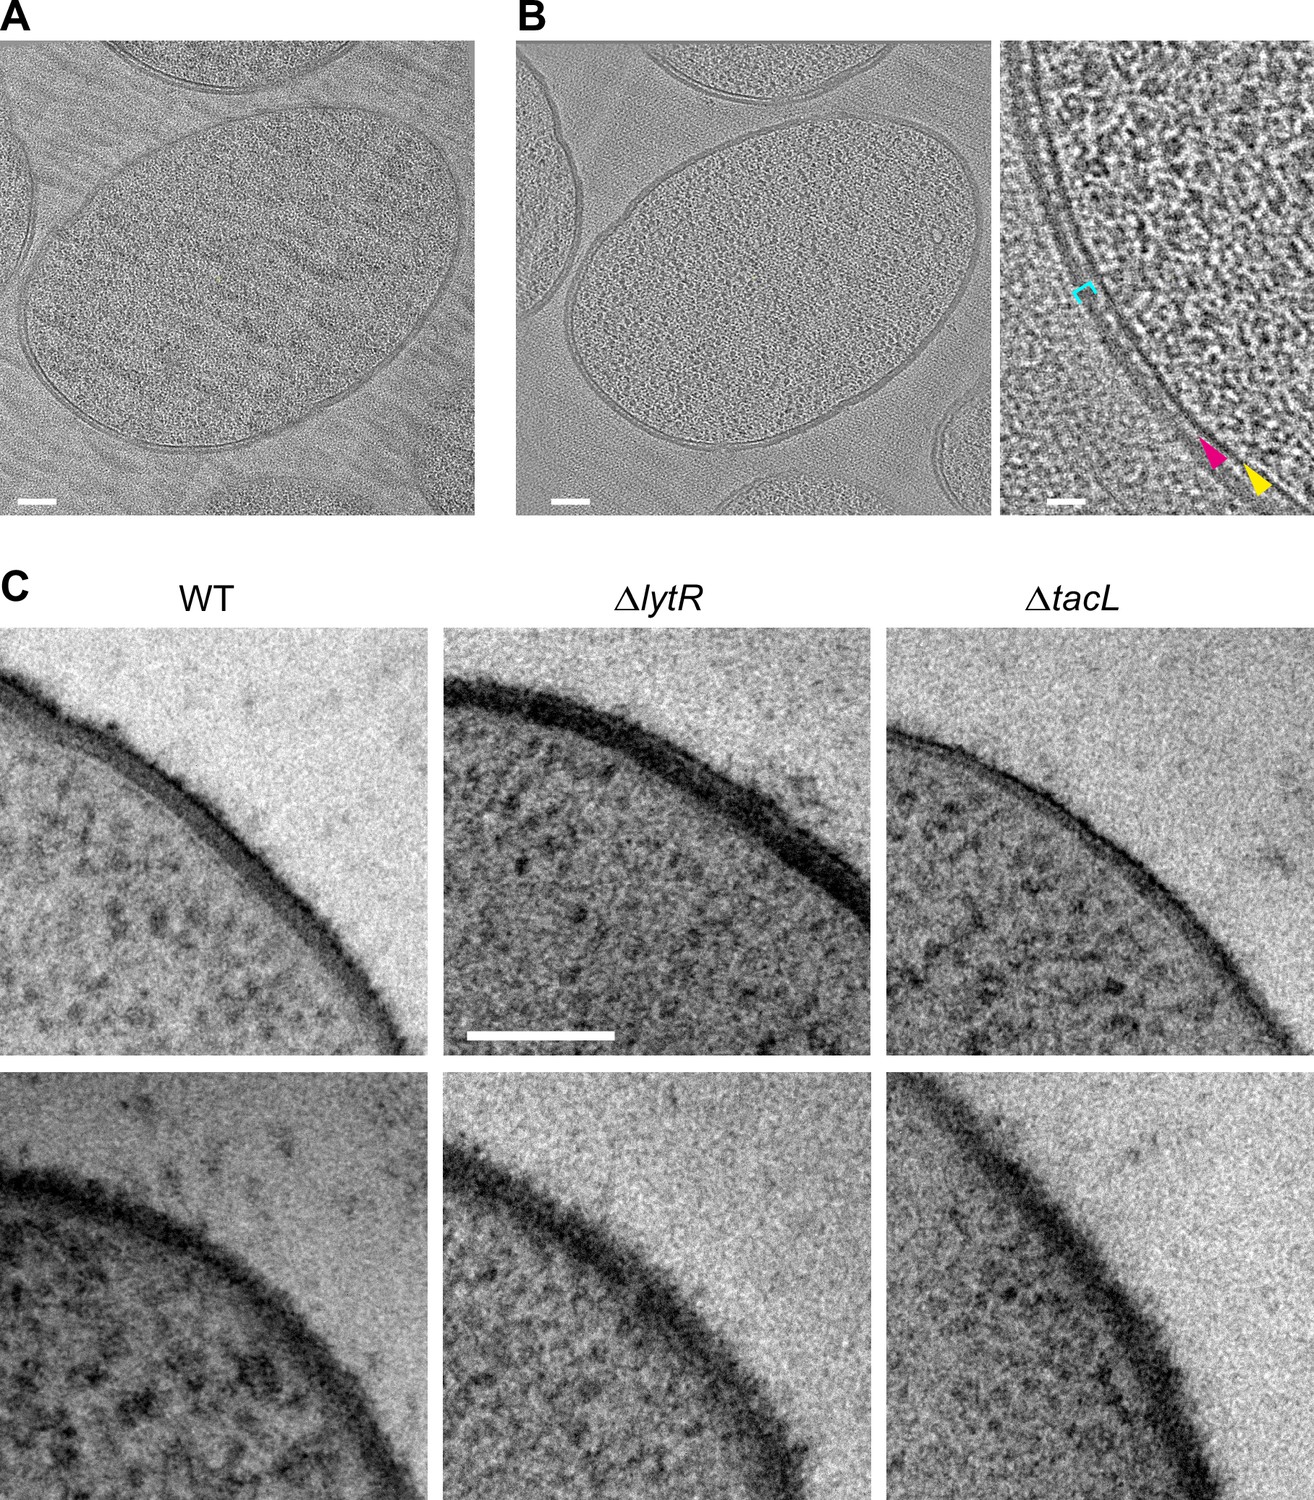
(A, B) CETOVIS of a ΔtacL cell section. (A) Raw image of a tilt series. (B) Full view (scale bar, 100 nm) and zoom (scale bar, 20 nm) of a slice through the cryo-electron tomogram. Yellow arrow, membrane; magenta arrow; periplasmic space; cyan bracket, peptidoglycan. A reduction in the thickness of the periplasmic space and peptidoglycan layer is observed throughout the volume. No granular layer is detected in the volume. (C) TEM micrographs of stained freeze-substituted thin sections of the cell envelope of wild type (WT), ΔlytR, and ΔtacL cells. The appearance varies depending on the angle between the cell envelope and the section plane. Two examples are shown for each strain. No consistent difference could be discerned between the strains. Scale bar, 100 nm.
Figure 3 with 2 supplements
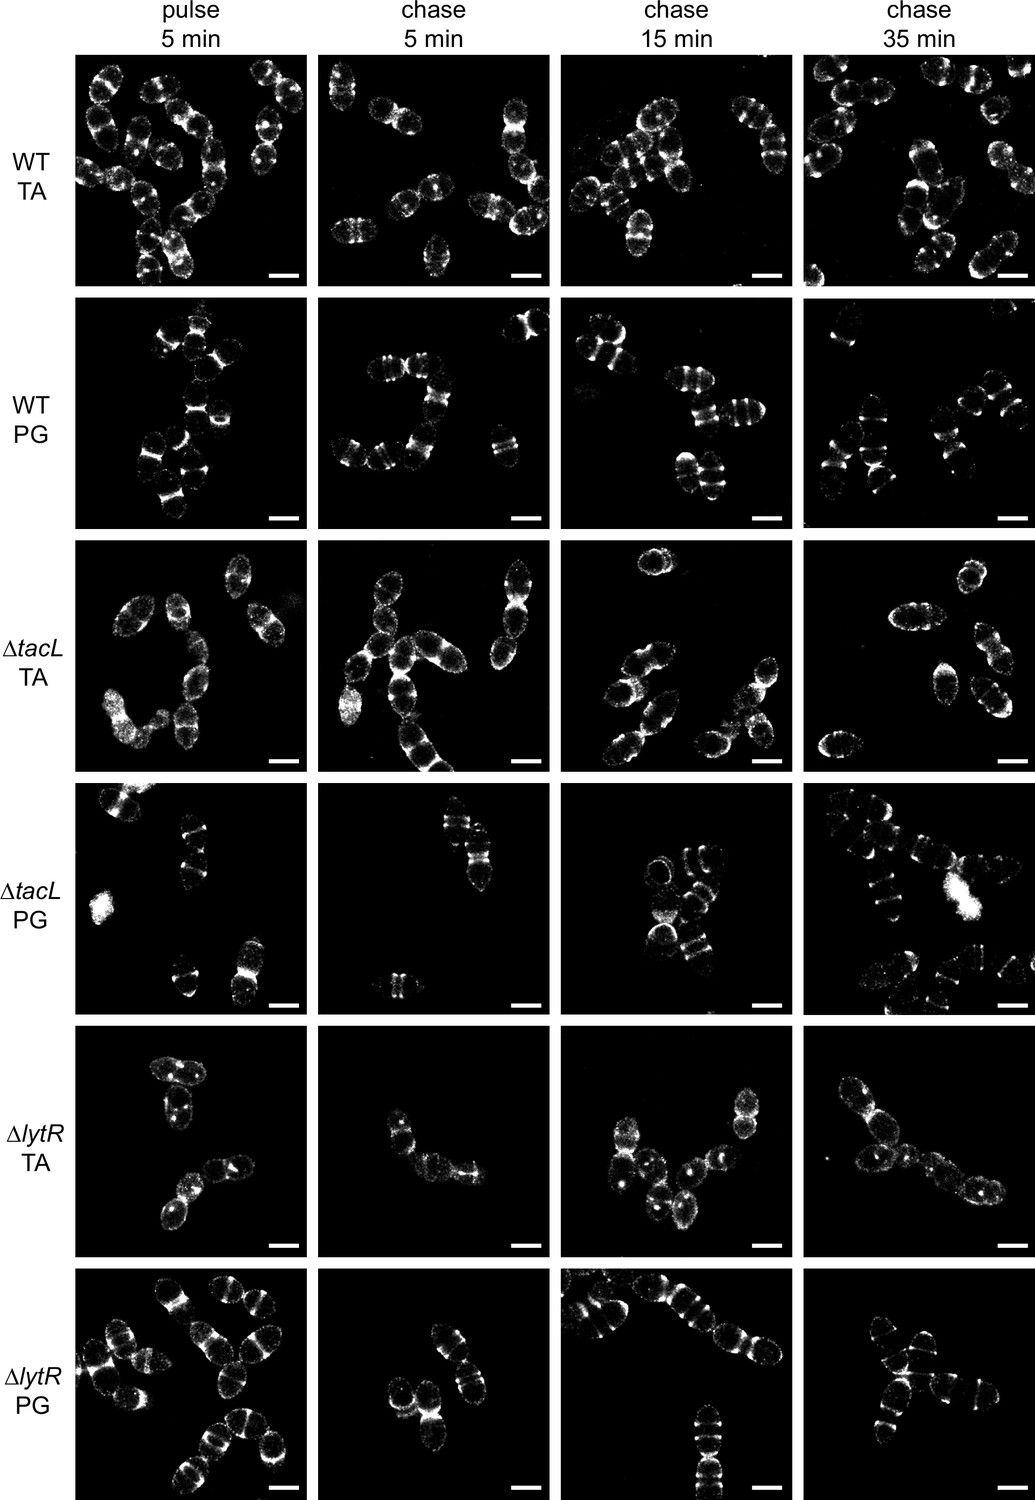
Super-resolved direct stochastic optical reconstruction microscopy (dSTORM) imaging of teichoic acids (TA) incorporated in growing wild type (WT), ΔtacL, and ΔlytR cells after a 5-min pulse of metabolic labeling with 1.5 mM aCho followed by a chase, and subsequent secondary fluorescent labeling by click chemistry using DBCO-AF647.
For comparison, the same pulse–chase procedure was applied to reveal the newly synthesized peptidoglycan (PG) with a metabolic labeling using 2 mM azido-D-Ala-D-Ala. Scale bars are 1 µm. Corresponding conventional and bright-field images are shown in Figure 3—figure supplement 2.
Figure 3—figure supplement 1
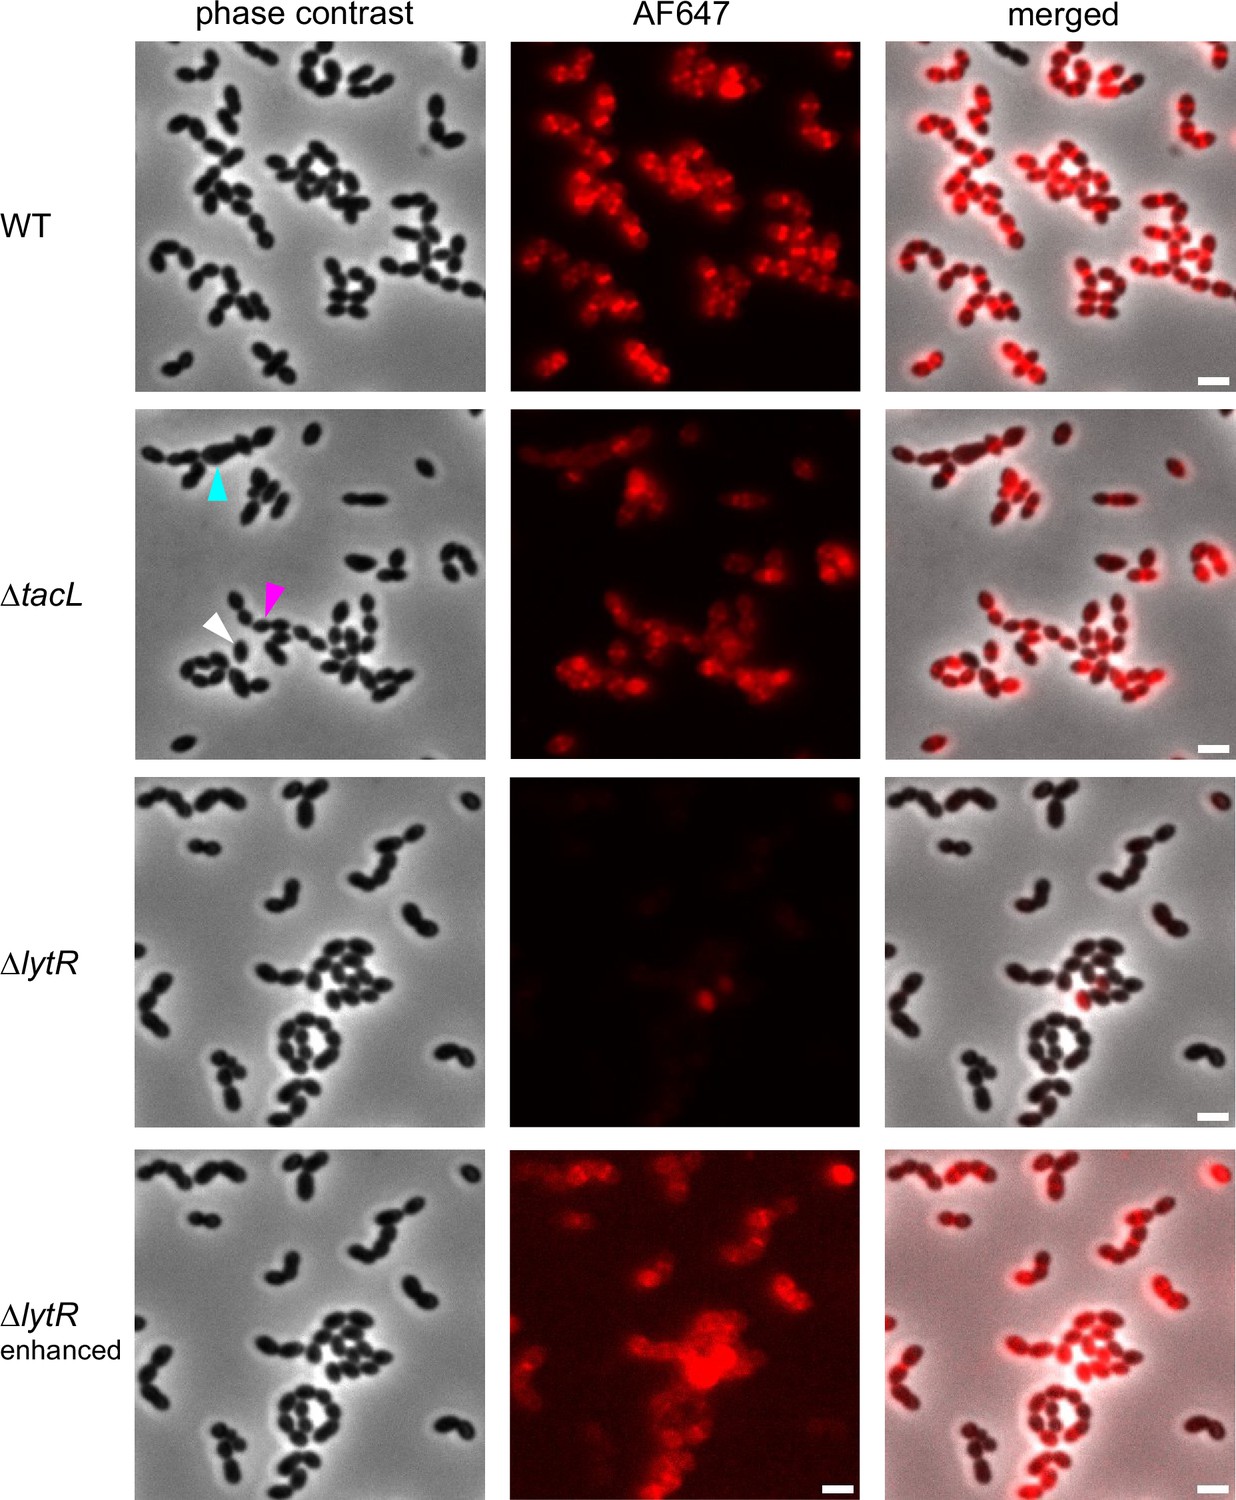
Fluorescence microscopy of wild type (WT), ΔtacL, and ΔlytR cells grown in BHI and pulse-labeled with 1.5 mM aCho for 5 min prior to fixation and secondary click-labeling with DBCO-AF647.
The three top rows are with the same imaging settings. The fluorescent signal of the bottom row was enhanced. Scale bars, 2 µm.
Figure 3—figure supplement 2
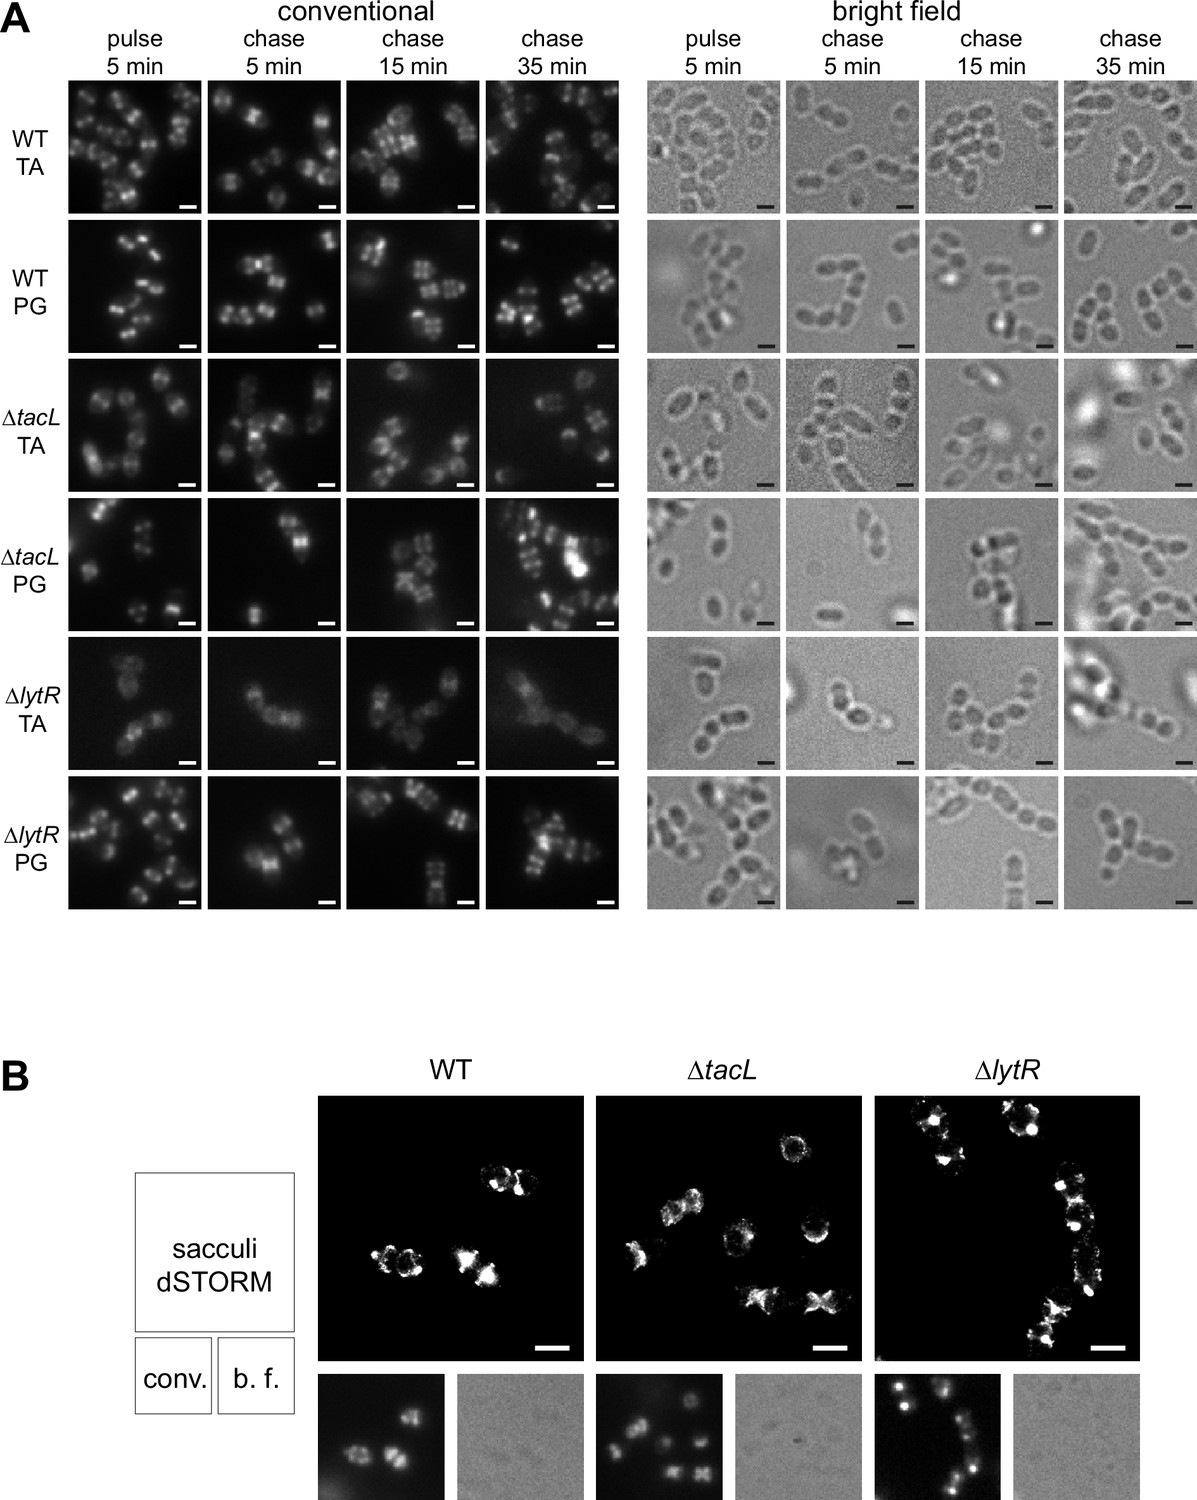
Fluorescence microscopy of TA labeling.
(A) Corresponding conventional and bright-field microscopy images of the pulse–chase experiments shown by direct stochastic optical reconstruction microscopy (dSTORM) imaging in Figure 3. Newly synthesized teichoic acids (TA) were revealed in growing wild type (WT), ΔtacL, and ΔlytR cells by a 5-min pulse of metabolic labeling with 1.5 mM aCho followed by a chase, and secondary fluorescent labeling with clickable DBCO-AF647. For comparison, the same pulse–chase procedure was applied to reveal the newly synthesized peptidoglycan with a metabolic labeling using 1.5 mM azido-D-Ala-D-Ala. (B) dSTORM imaging (with corresponding conventional and bright-field images at half scale) of sacculi prepared from cells pulse-labeled during 5 min and chased for 15 min. Labeled TA in sacculi were revealed by secondary fluorescent labeling with clickable DBCO-AF647. Scale bars, 1 µm.
Figure 4 with 6 supplements
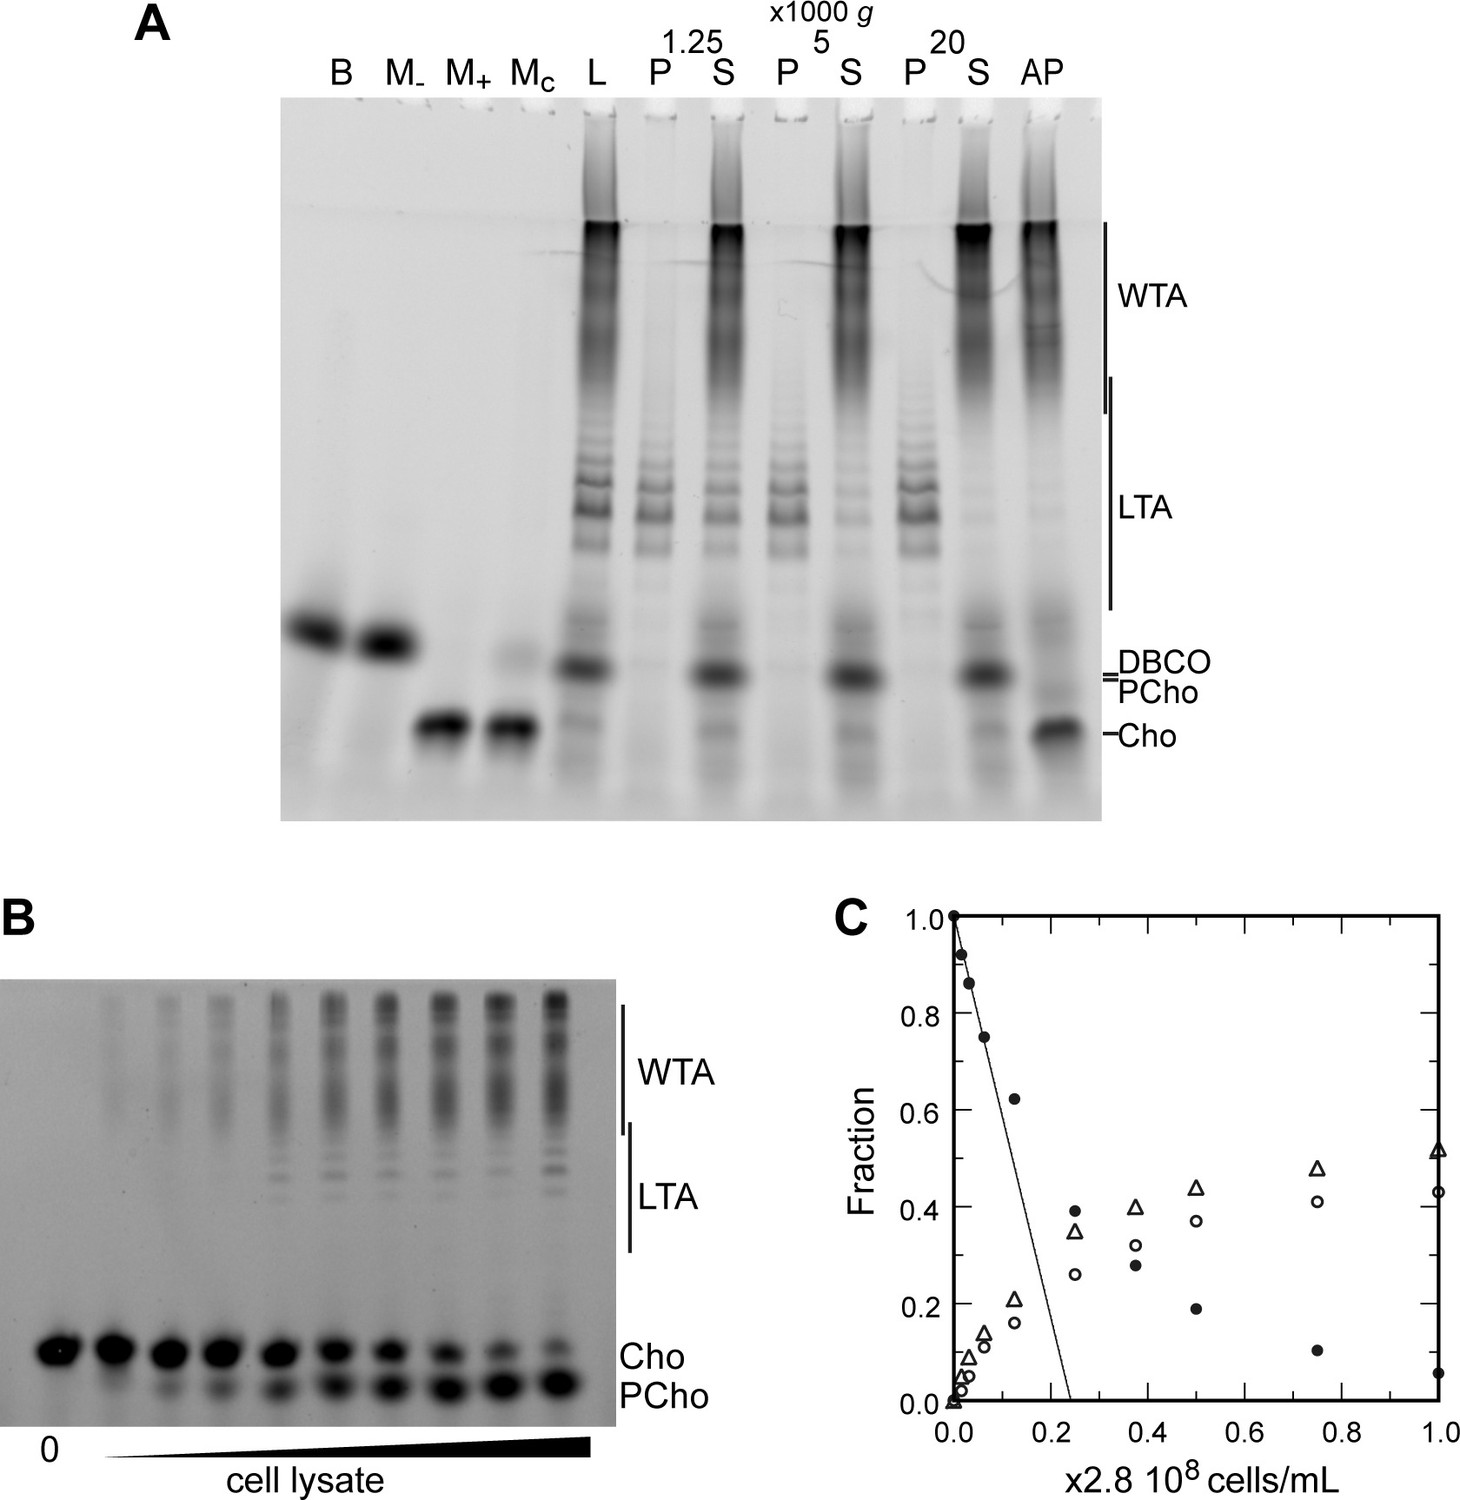
Electrophoretic analysis of TA.
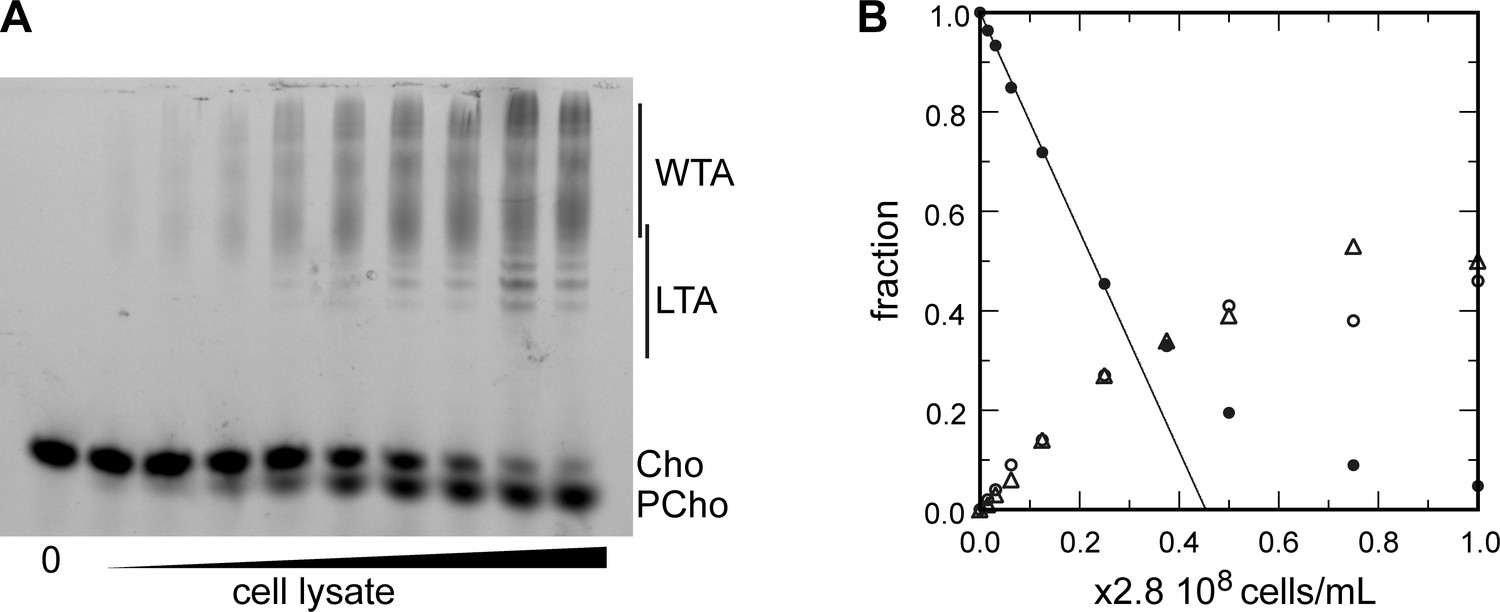
(A) Polyacrylamide gel electrophoresis of fluorescently labeled teichoic acids (TA) demonstrating separation of lipoteichoic acids (LTA) and wall teichoic acids (WTA) by centrifugation. Labeled compounds were revealed by UV transillumination. TA were labeled by growing wild type (WT) cells in C-medium in the presence of 200 µM aCho. Cells were lysed overnight with lysozyme, mutanolysin and LytA and the azido-groups were modified by reaction with 25 µM DBCO-AF488. The lysate was centrifuged for 2 min at 1250, 5000, or 20,000 × g. The pellets were resuspended in the initial volume. An aliquot of the 20,000 × g supernatant was treated with alkaline phosphatase. The buffer with the lysing enzymes, the medium with and without aCho and the culture supernatant were similarly incubated with 25 µM DBCO-AF488. B, lysis buffer with enzymes; M−, C-medium without aCho; M+, C-medium with aCho; MC, culture supernatant; L, lysate; P, pellet; S, supernatant; AP, alkaline phosphatase-treated. The control samples (B, M−, M+, and MC were loaded at one-fourth the volume of the cellular samples). Labels on the right side of the gel identify species coupled to the fluorophore AF488. (B, C) Titration of cellular TA. WT cells were grown for two generation in the presence of aCho prior to cell lysis. DBCO-AF488 (1.9 µM) was incubated for 24 hr with varying amounts of cell lysate corresponding to up to 2.9 × 10⁸ cells⋅ml−1. The remaining DBCO-AF488 was blocked by addition of 100 mM aCho, and the various species were separated by polyacrylamide (17%) gel electrophoresis (B). The bands were quantified and the relative amount of the various species were plotted against the cell concentration (C). Black circles, blocked DBCO-AF488; open circle, phosphocholine; open triangle, TA. A linear regression of the DBCO-AF488 points at low cellular concentration was applied to obtain the titration point as the intercept of the cell concentration axis.
Figure 4—figure supplement 1
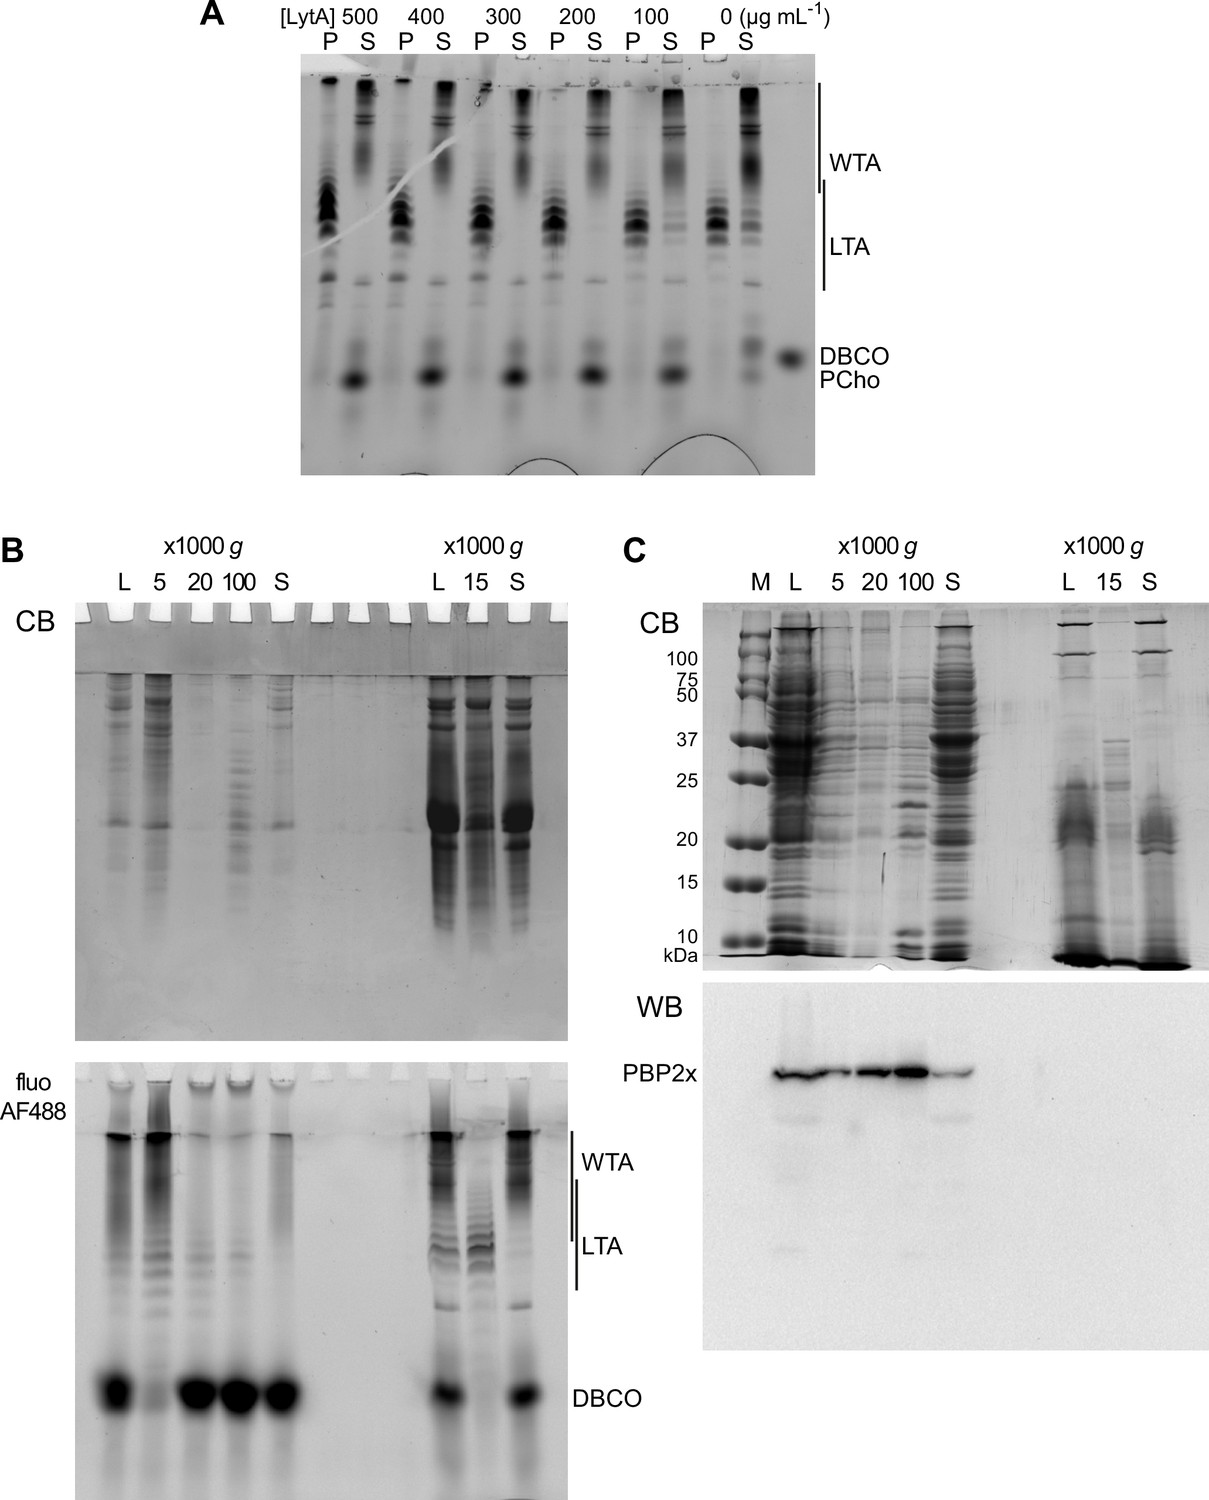
Electrophoretic analysis of TA and membrane preparations.
(A) Effect of the concentration of added recombinant LytA on the sedimentation of lipoteichoic acids (LTA). Wild type (WT) cells grown in C-medium with 200 µM aCho were click-labeled with DBCO-AF488 and lysed overnight with mutanolysin, lysozyme, and various concentrations of recombinant LytA. Lysates were centrifuged at 20,000 × g for 2 min. The pellets were resuspended in one-fourth the initial volume and samples were analyzed by gel electrophoresis. Fluorescently labeled compounds were revealed by UV transillumination. (B) Pelleting of labeled LTA-containing membranes from WT cells at different centrifugation speeds after spheroplast lysis (left lanes) and after direct enzymatic lysis (right lanes). A culture of WT cells in C-medium with 200 µM aCho was divided in two. One half was treated and fractionated by centrifugation according to Flores-Kim et al., 2019; Flores-Kim et al., 2022, prior to click-labeling overnight with 25 µM DBCO-AF488. The other half of the culture was click-labeled with 25 µM DBCO-AF488 and lysed overnight with mutanolysin, lysozyme, and LytA, prior to fractionation by centrifugation. Pellets at the indicated relative centrifugal forces were resuspended in one-half the initial volume. (C) Sedimentation of WT cell membranes, lysed by microfluidics (left lanes) or after direct enzymatic lysis (right lanes), analyzed by sodium dodecyl sulfate (SDS)–PAGE in a 12% acrylamide gel with a Tris-glycine buffer system. A 1-l culture of WT cells in BHI was harvested and resuspended in 25 ml of 50 mM Tris pH 8, 150 mM NaCl, 2× complete protease inhibitors, and 2 mM EDTA. Twenty ml of the resuspension were submitted to five passes through an LM20 Microfluidizer at 18 kpsi, and 5 ml were processed by direct enzymatic digestion. Pellets at the indicated relative centrifugal forces were resuspended in one-fifth the initial volume. M, molecular mass markers, L, whole lysate; P, pellet; S, supernatant; CB, Coomassie blue staining; fluo AF488, UV transillumination; WB PBP2x, western blot with anti-PBP2x serum.
Figure 4—figure supplement 2

Polyacrylamide gel electrophoresis of click-labeled teichoic acids (TA), aCho, and the clickable fluorophore DBCO-AF488 with (A) 12% (wt/vol) and (B) 17% acrylamide.
Three lanes on the left of the gels: wild type (WT) cells were grown in C-medium in the presence of 200 µM aCho prior to lysis and secondary labeling with 10 µM DBCO-AF488 overnight at room temperature. Samples were further incubated 4 hr with either 1000 U⋅ml−1 alkaline phosphatase (AP), nothing (−), or 10 mM additional aCho. Six lanes on the right of gels. In either 50 mM Tris pH 8, 150 mM NaCl or C-medium, and 20 µM DBCO-AF488 were incubated at room temperature for 4 hr with either 0, 10 mM, or 200 µM aCho. Prior to gel loading, samples were supplemented with 8% glycerol, 0.8% sodium dodecyl sulfate (SDS), 8 mM DTT, and trace of bromophenol blue. The migration position of the fluorophore-triazole-linked species are indicated on the left or on the gels by symbols (PCho^, phospho-choline; Cho*, choline). The position of the DBCO-AF488 reagent is indicated on the right or on the gel with the symbol #.
Figure 4—figure supplement 3
Coomassie staining of TA analysis gels.
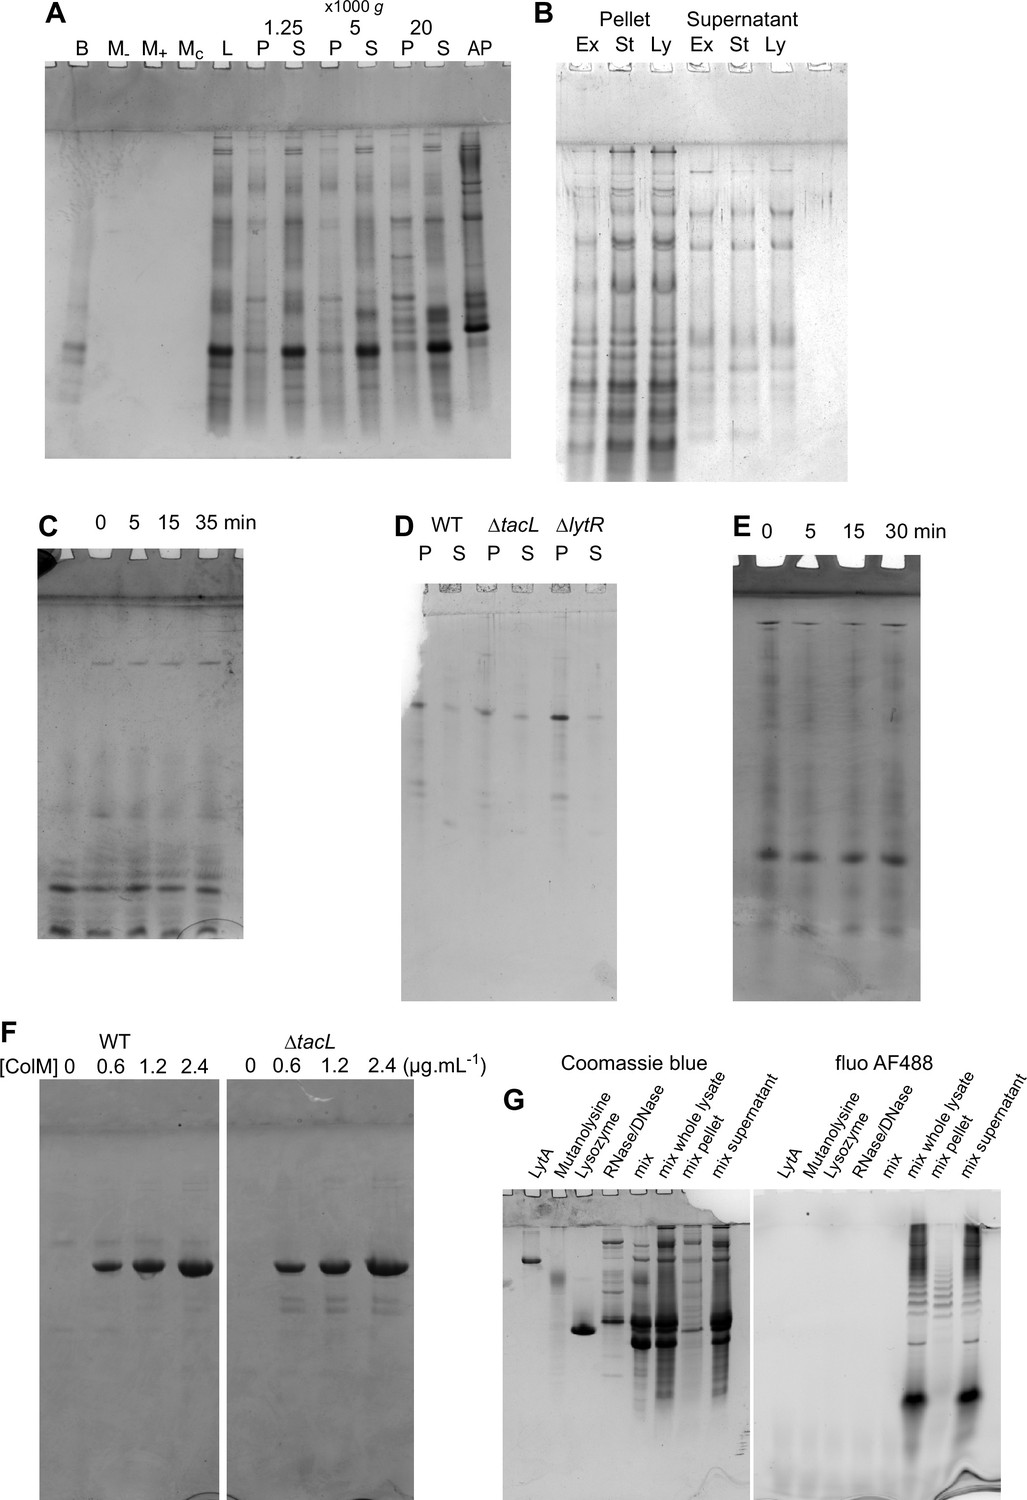
(A–F) Protein Coomassie staining of teichoic acids (TA) analysis gels presented in Figures 4A—6A, B, E. (G) Coomassie staining of a gel showing the enzymes used during cell lysis, individually, mixed, and in the context of TA labeling and cell lysis and fractionation. The resulting protein profile was found to be variable, due to protease contamination from the commercial mutanolysin.
Figure 4—figure supplement 4
Characterization of the cell lysate fractionation by sedimentation.
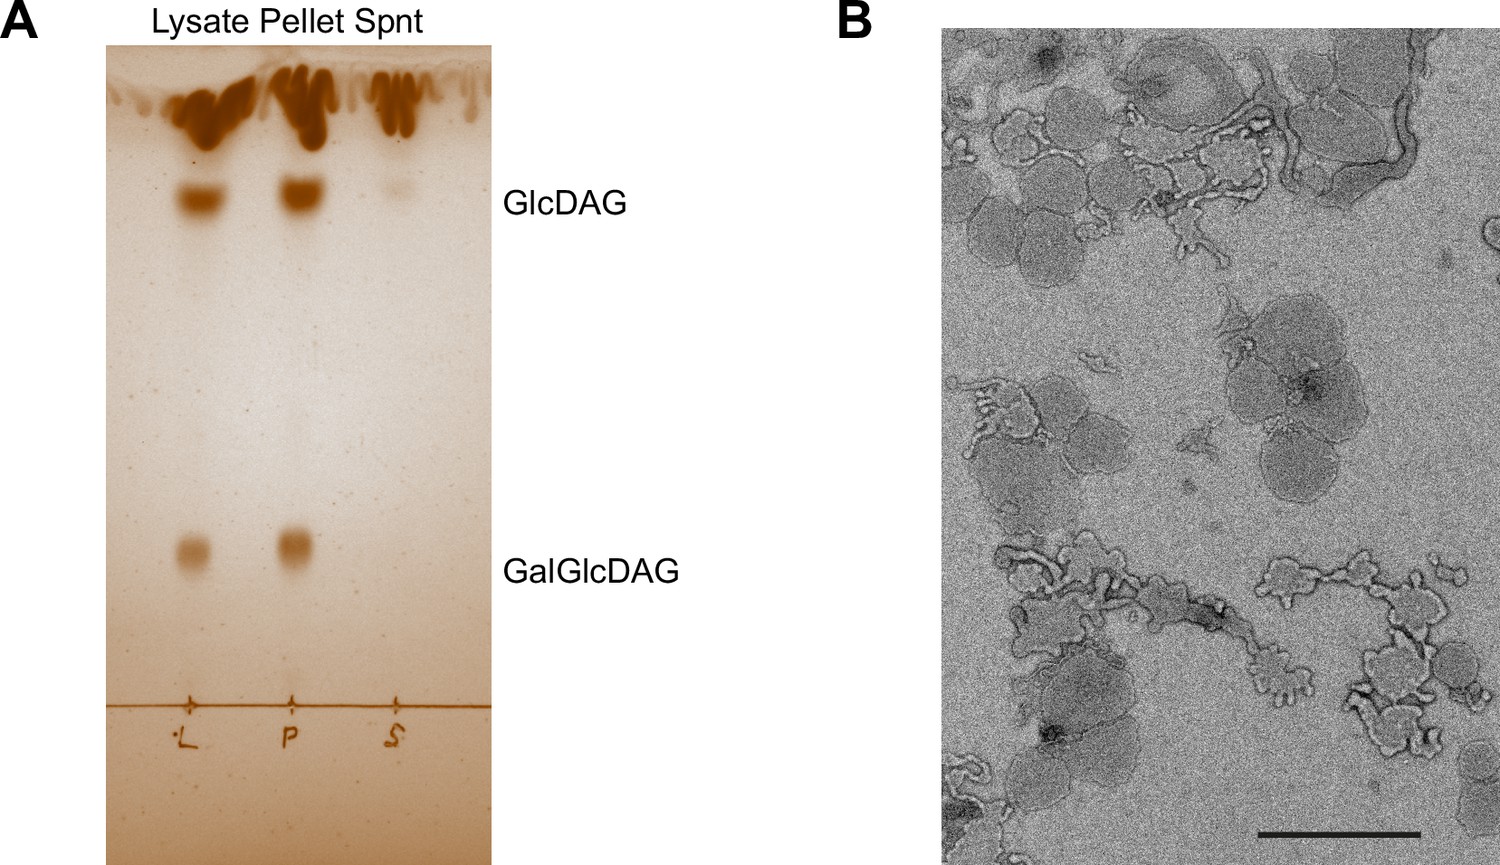
(A) Iodine vapor-stained thin layer chromatography of lipids extracted from wild type (WT) cell lysate, the resuspended low-speed centrifugation pellet and the supernatant (Spnt) of the lysate. Lipids were tentatively identified according to Meiers et al., 2014. GlcDAG, mono-glucosyl-diacyl-glycerol (DGlcp-DAG); GalGlcDAG, galactosyl-glucosyl-diacyl-glycerol (DGalp-DGlcp-DAG). (B) Negative stain electron micrograph of the resuspended low-speed centrifugation pellet. Magnification was ×4800. Scale bar, 1 µm.
Figure 4—figure supplement 5
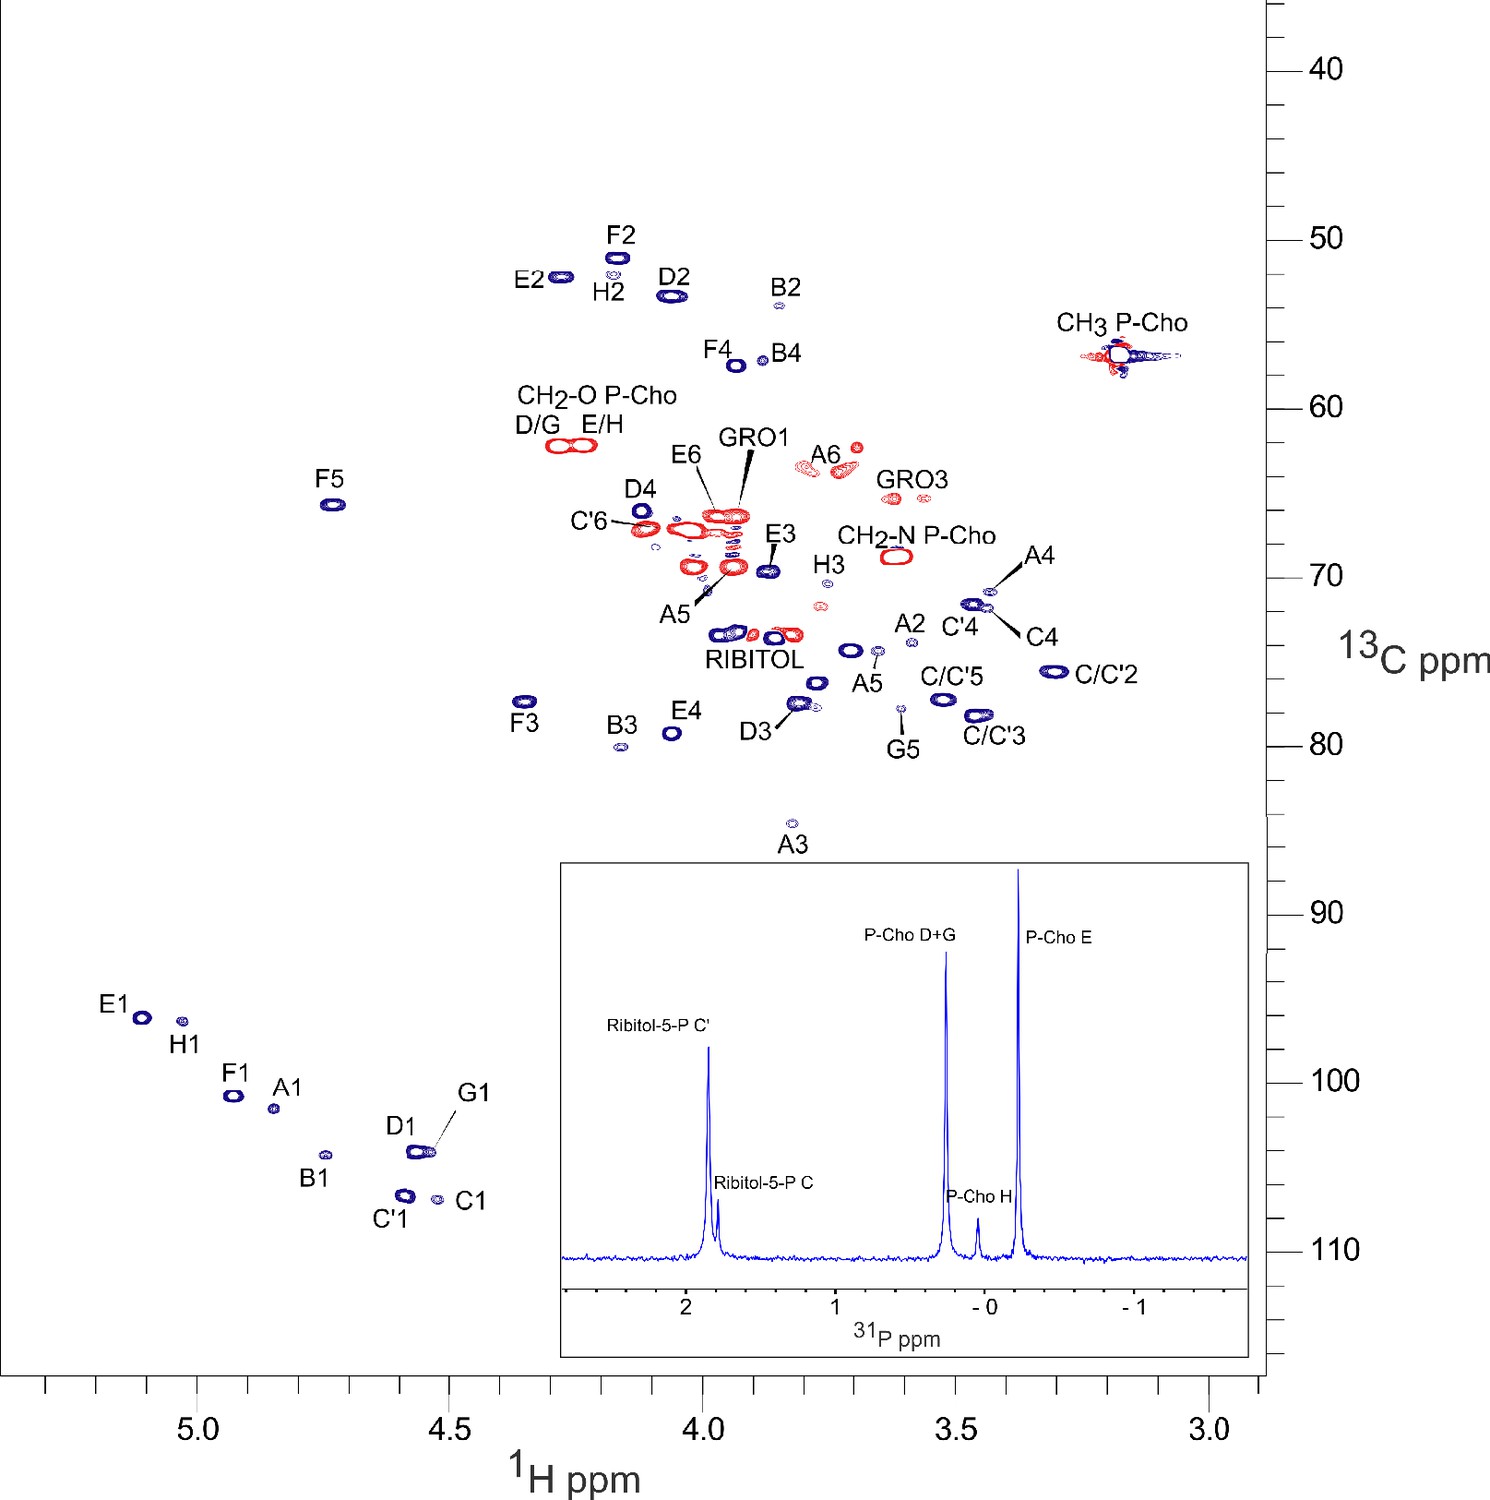
NMR spectra of S. pneumoniae lipoteichoic acids (LTA) obtained by low-speed centrifugation of cell lysate.
The main panel is 13C-1H HSQC (constant-time) spectrum; 13C nuclei that are coupled to either zero or two other carbons (red) and those coupled to one or three other carbons (dark blue), exhibit opposite signs. The inset is 31P 1D spectrum. The peak nomenclature is that proposed by Gisch et al., 2013. Peaks A1 to A6, GRO1 GRO3 are originating from the lipid anchor DGlcp-DAG of LTA.
Figure 4—figure supplement 6
Titration of cellular TA.
(A, B) Titration of cellular teichoic acids (TA). Wild type (WT) cells were grown for two generations in the presence of aCho. DBCO-AF488 (3.7 µM) was incubated for 24 hr with varying amount of cell lysate corresponding to up to 2.9 × 10⁸ cells⋅ml–1. The remaining DBCO-AF488 was blocked by addition of 100 mM aCho, and the various species were separated by polyacrylamide gel electrophoresis. (A) The gel was imaged by transillumination with UV light. (B) The bands were quantified and the relative amount of the various species were plotted against the cell concentration. Black circles, blocked DBCO-AF488; open circle, phospho-choline; open triangle, TA. A linear regression of the DBCO-AF488 points at low cellular concentration was applied to obtain the titration point as the intercept of the cell concentration axis.
Figure 5 with 1 supplement
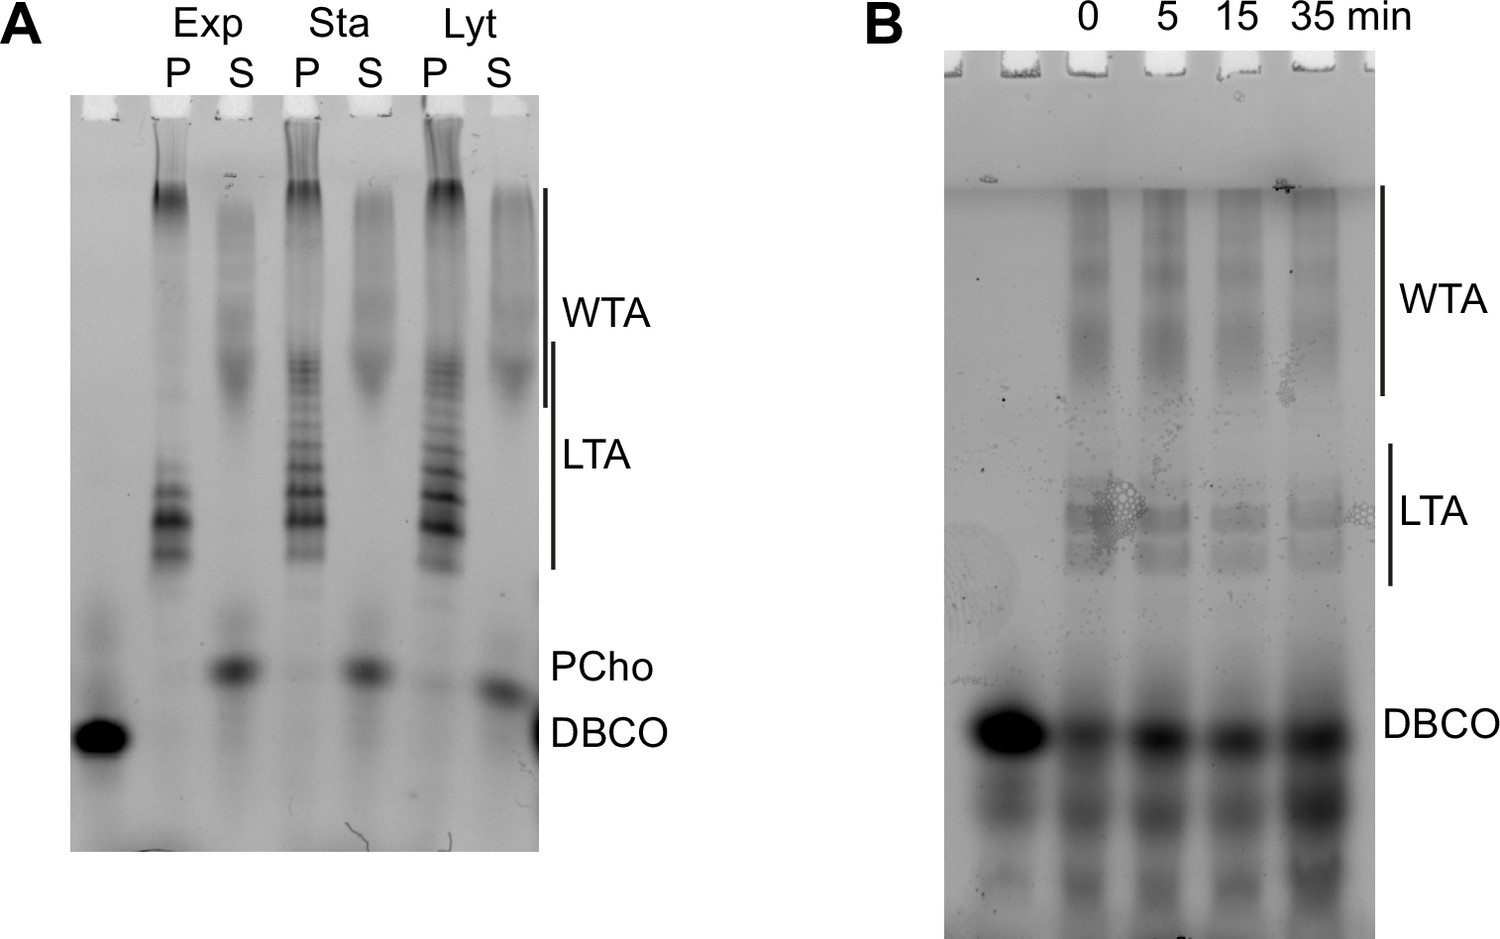
Modification of teichoic acids (TA) length in different growth phases.
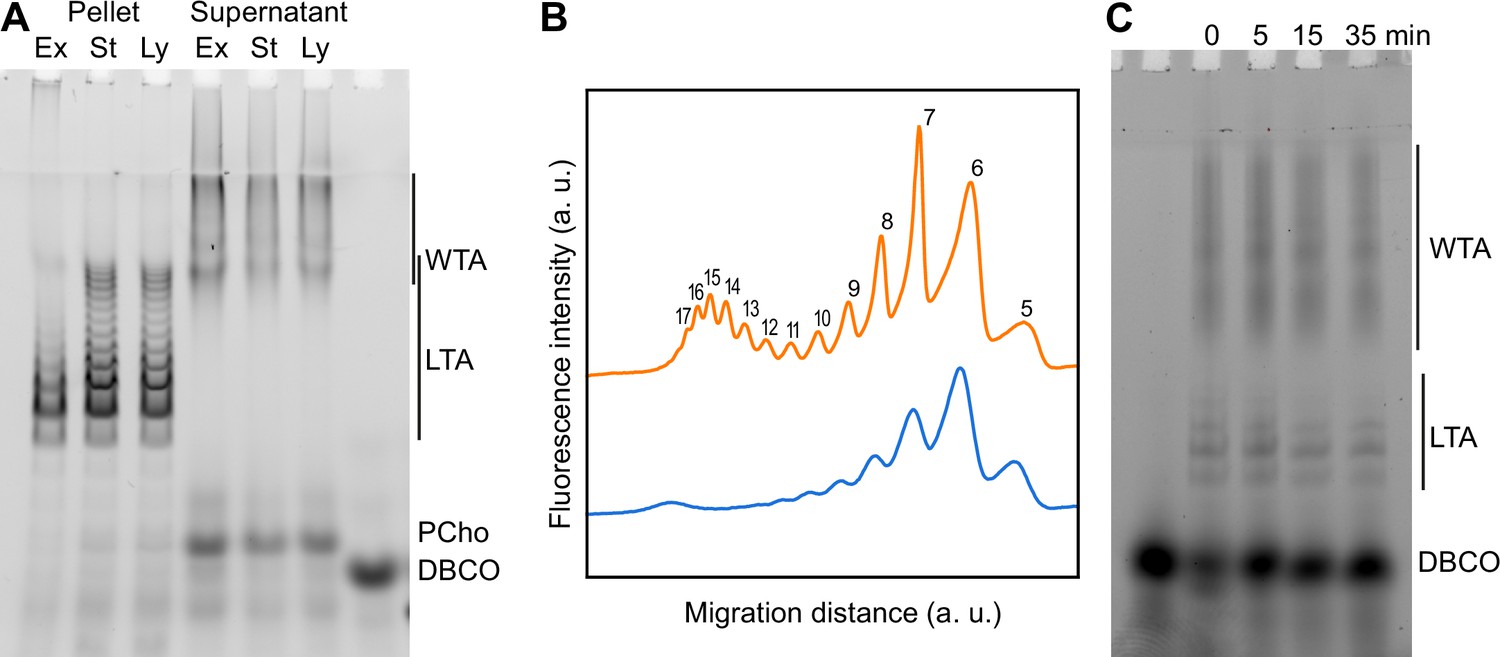
(A) Wild type (WT) cells grown in C-medium containing 200 µM aCho were harvested during the exponential growth phase (Ex), at the onset of the stationary phase (St), and during the autolysis (Ly). TA were fluorescently click-labeled with DBCO-AF488 and cells were completely lysed by the addition of peptidoglycan (PG) hydrolases prior to centrifugation. Lipoteichoic acids (LTA) are found in the pellet (P) whereas wall teichoic acids (WTA) are observed in the supernatant (S). The amounts of cells at the different culture stages were normalized. The LTA samples are eightfold concentrated compared to the WTA samples. Fluorescently labeled TA were revealed by UV transillumination after sodium dodecyl sulfate (SDS)–polyacrylamide electrophoresis. (B) Densitometric profiles of the fluorescent intensities of exponential (blue) and stationary phase samples (orange) shown in (A). (C) Electrophoretic analysis of TA of WT cells grown in C-medium with 0.1% yeast extract and pulse-labeled for 5 min with 200 µM aCho, and chased by further growth in the same medium without added aCho for the indicated duration.
Figure 5—figure supplement 1
Modification of teichoic acids (TA) during growth.
(A) ΔlytA cells grown in C-medium containing 200 µM aCho were harvested during the exponential growth phase (Ex), at the onset of the stationary phase (St), and during the autolysis (Ly). TA were fluorescently click-labeled with DBCO-AF488 and cells were completely lysed by the addition of peptidoglycan hydrolases prior to centrifugation. Lipoteichoic acids (LTA) are found in the pellet (P) whereas wall teichoic acids (WTA) are observed in the supernatant (S). The amounts of cells at the different culture stages were normalized. The LTA samples are eightfold concentrated compared to the WTA samples. Fluorescently labeled TA were revealed by UV transillumination after sodium dodecyl sulfate (SDS)–PAGE. (B) Electrophoretic analysis of TA of wild type (WT) cells grown in BHI and pulse-labeled for 5 min with the addition of 1.5 mM aCho, and chased by further growth in the same medium without added aCho for the indicated duration.
Figure 6 with 2 supplements
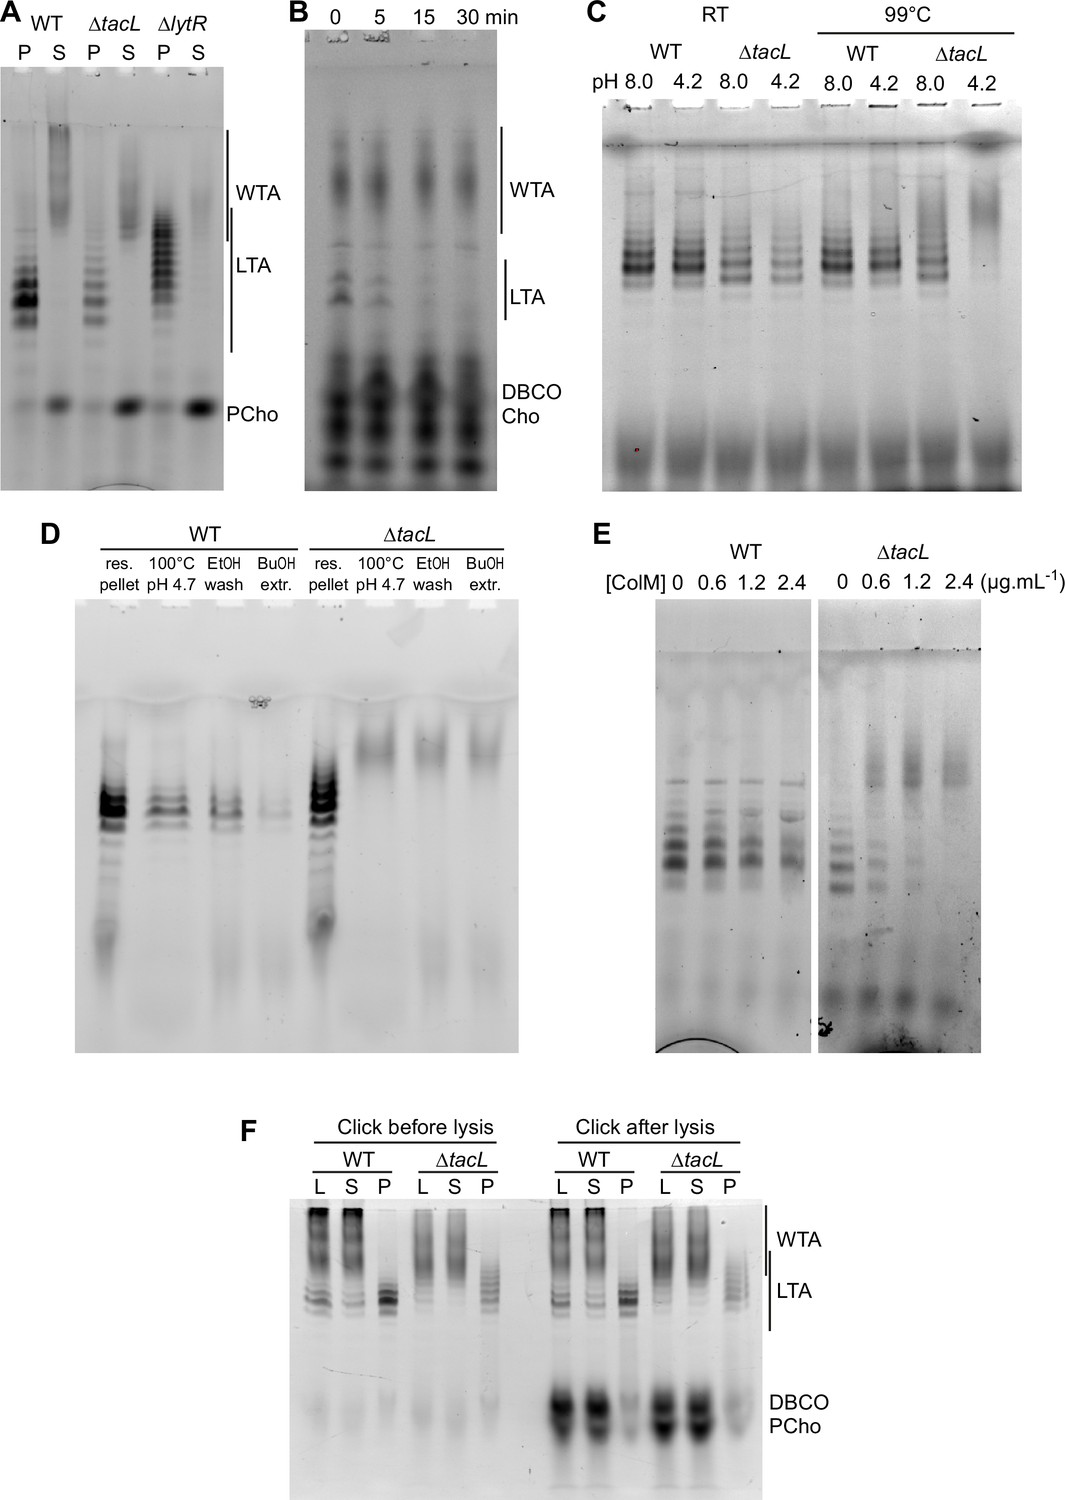
Electrophoretic analysis of labeled TA.
(A) Electrophoretic analysis of teichoic acids (TA) from the wild type (WT) strain, or deleted of the gene encoding the glycosyltransferase TacL, or the phosphotransferase LytR. Cells were grown in C-medium with no choline and 200 µM aCho, prior to cell lysis with peptidoglycan (PG) hydrolases and secondary labeling with DBCO-AF488. Lysates were fractionated by centrifugation and the pellets were resuspended in one fourth the initial volume: P, pellet; S, supernatant. (B–E) Identification of sedimented TA from lysates of ΔtacL cells as undecaprenyl pyrophosphate bound precursors. (B) Pulse–chase labeling experiment of TA in strain ΔtacL. Cells grown in BHI were exposed to 1.5 mM aCho for 10 min (pulse), prior to washing and further incubation in the same media without aCho (chase) for various time prior to cell lysis and secondary labeling with DBCO-AF488. Samples were treated with alkaline phosphatase prior to electrophoresis. (C) Pellets containing labeled TA from WT and ΔtacL cells were resuspended in a Tris- or ammonium acetate-buffered solution at pH 8 or pH 4.2 and incubated for 3 hr at room temperature or 99°C prior to electrophoresis. (D) Labeled TA from WT and ΔtacL cells were submitted to the first steps of the traditional procedure of lipoteichoic acids (LTA) isolation: boiling in 4% sodium dodecyl sulfate (SDS) in a citrate-buffered solution at pH 4.7, lyophilization and ethanol wash of the lyophilizate, butanol extraction and retention of the aqueous fraction. (E) Labeled sedimented TA from WT and ΔtacL cells were incubated overnight without or with various concentrations of recombinant P. aeruginosa colicin M prior to electrophoretic separation. (F) To probe on which side of the plasma membrane the TA are positioned, secondary click-labeling with DBCO-AF488 was performed prior or after cell lysis of WT and ΔtacL cells grown in C-medium in the presence of 0.2 mM aCho. L, whole lysate; S, supernatant of 20,000 × g, 2-min centrifugation; P, pellet resuspended in one-fourth initial volume.
Figure 6—figure supplement 1
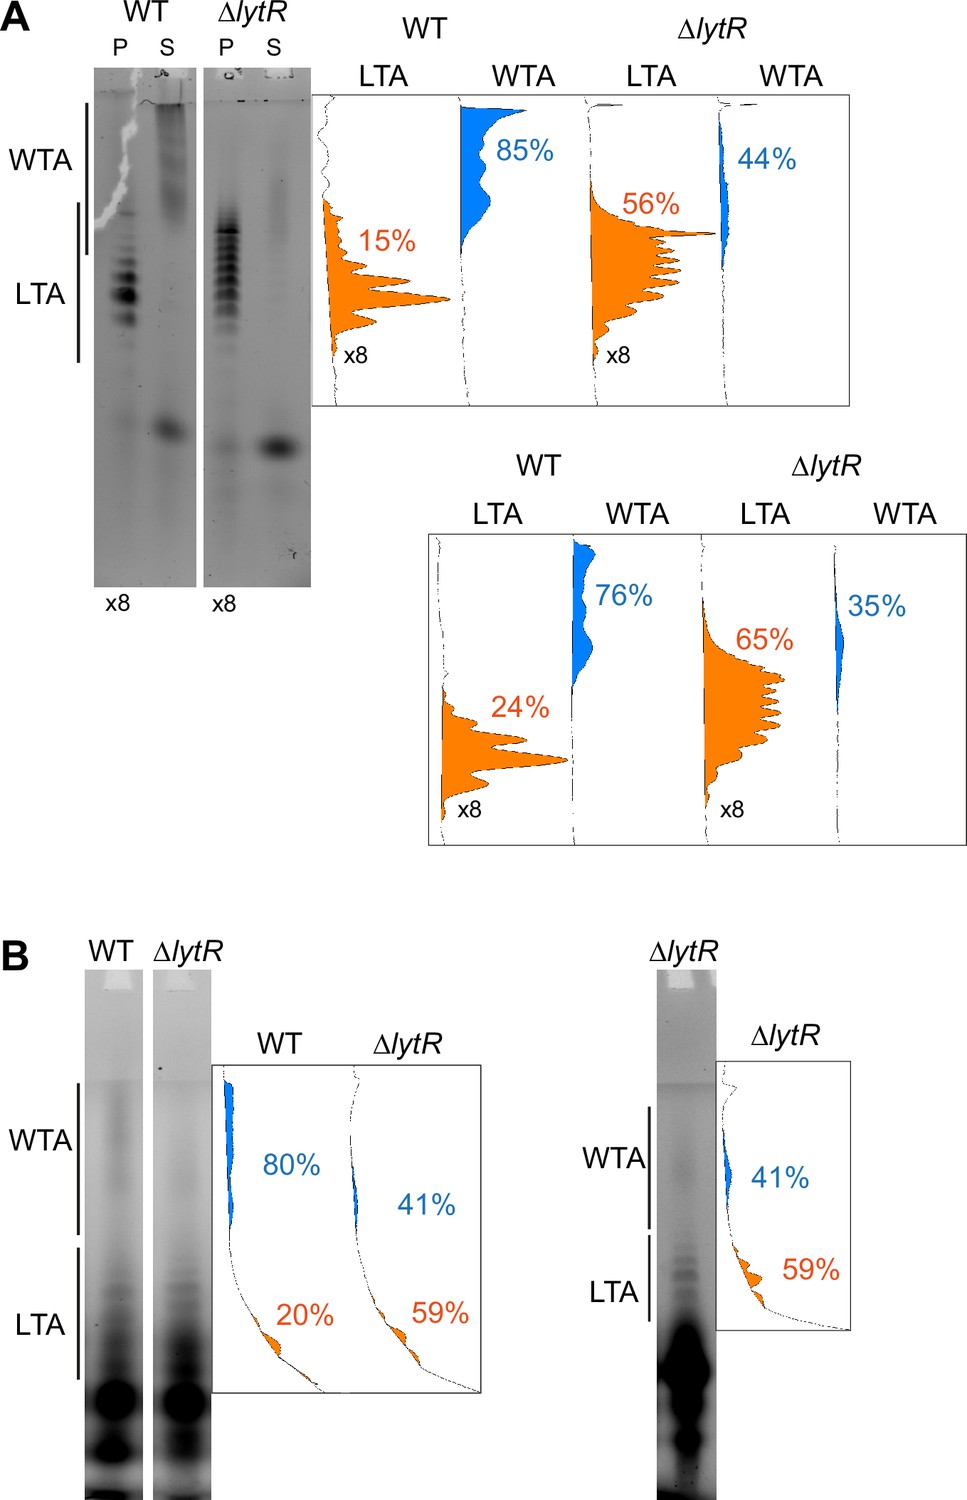
Quantification of the relative amount of wall teichoic acids (WTA) and lipoteichoic acids (LTA) in the ΔlytR strain.
The in-gel fluorescence was measured using ImageJ with unsaturated images. The densitometry down the migration lanes is shown on the right. The relative surface areas corresponding to the fluorescence intensity are shown for the LTA (in orange) and WTA (in blue). (A) Cells were grown in C-medium with 200 µM aCho and treated as in the experiment shown in Figure 6A, the quantification of which is shown in the lower graphs. Note that the pellets samples were fourfold concentrated. (B) Cells were grown in BHI and labeled during 5 min with 1.5 mM aCho as in Figure 6B.
Figure 6—figure supplement 2
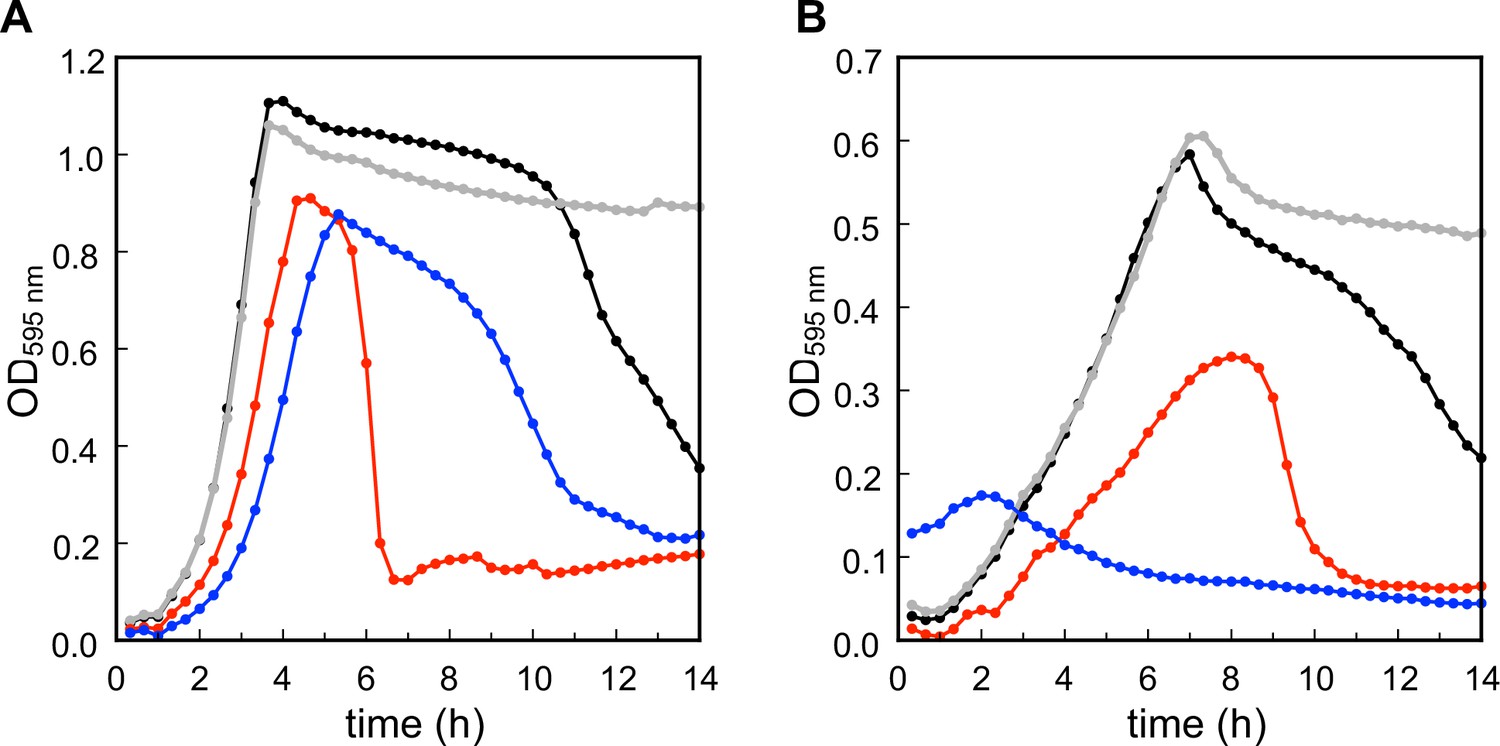
Growth of the S. pneumoniae wild type (WT) (black), ΔlytA (gray), ΔtacL (red), and ΔlytR (blue) strains in BHI (A) and C-medium containing 200 µM choline (B).
Tables
Table 1
Dimensions of cell envelope structures measured on CEMOVIS images.
*p=0.05 can be removed from the footnote (twice).
| Strain | Mean thickness (nm) ± SD (nb of measurements)a | Ratio of thicknessCW/PS | GL dist. from membraneb(nm) ± SD | |||
|---|---|---|---|---|---|---|
| CW | PS | GL | ||||
| WT | 15.9 ± 2.5 (Trouve et al., 2021b) | 10.8 ± 1.4 (Trouve et al., 2021b) | 3.2 ± 0.8 (Trouve et al., 2021b) | 1.5 | 5.0 ± 0.8 (Trouve et al., 2021b) | |
| ΔtacL | 13.5 ± 3.7 (Trouve et al., 2021b)c **/d ** | 6.9 ± 2.3 (Trouve et al., 2021b)c **/d # | NA | 1.95c **/d ** | NA | |
| ΔlytR | 10.2 ± 1.7 (Trouve et al., 2021b)c **/d ** | 7.7 ± 2.0 (Trouve et al., 2021b)c **/d # | NA | 1.32c #/d ** | NA | |
| a Values in nm are presented as mean values ± standard deviations (with numbers of measurements in parentheses). They have been measured using images with a pixel size of 3.7 Å. NA, not applicable. b Measured from the outer surface of the cytoplasmic membrane to the inner most side of the GL. c ANOVA test was performed between corresponding structures of WT and mutant cells. #, no statistical difference; *p = 0.05; **p = 0.01. d ANOVA test was performed between corresponding structures of ΔlytR and ΔtacL cells. #, no statistical difference; *p = 0.05; **p = 0.01. | ||||||
Key resources table
| Reagent type (species) or resource | Designation | Source or reference | Identifiers | Additional information |
|---|---|---|---|---|
| Strain, strain background (S. pneumoniae) | WT | Gift from J.-P. Claverys, Toulouse, France | sspCM246 | R800, rpsL1, Δcps, adr+, StrR |
| Strain, strain background (S. pneumoniae) | ΔtacL | This study | sspCM514 | R800, rpsL1, ΔtacL, Δcps, adr+, StrR |
| Strain, strain background (S. pneumoniae) | ΔlytR | This study | sspCM493 | R800, rpsL1, ΔlytR, Δcps, adr+, StrR |
Additional files
Download links
A two-part list of links to download the article, or parts of the article, in various formats.
Downloads (link to download the article as PDF)
Open citations (links to open the citations from this article in various online reference manager services)
Cite this article (links to download the citations from this article in formats compatible with various reference manager tools)
Teichoic acids in the periplasm and cell envelope of Streptococcus pneumoniae
eLife 14:RP105132.
https://doi.org/10.7554/eLife.105132.3


