Evaluating mesenchymal stem cell therapy for sepsis with preclinical meta-analyses prior to initiating a first-in-human trial
- The Ottawa Hospital, Canada
- The Ottawa Hospital Research Institute, Canada
- University of Ottawa, Canada
- The University of Edinburgh, United Kingdom
- University of Calgary, Canada
- St. Michaels Hospital, The University of Toronto, Canada
- University of British Columbia, Canada
Figures
Figure 1
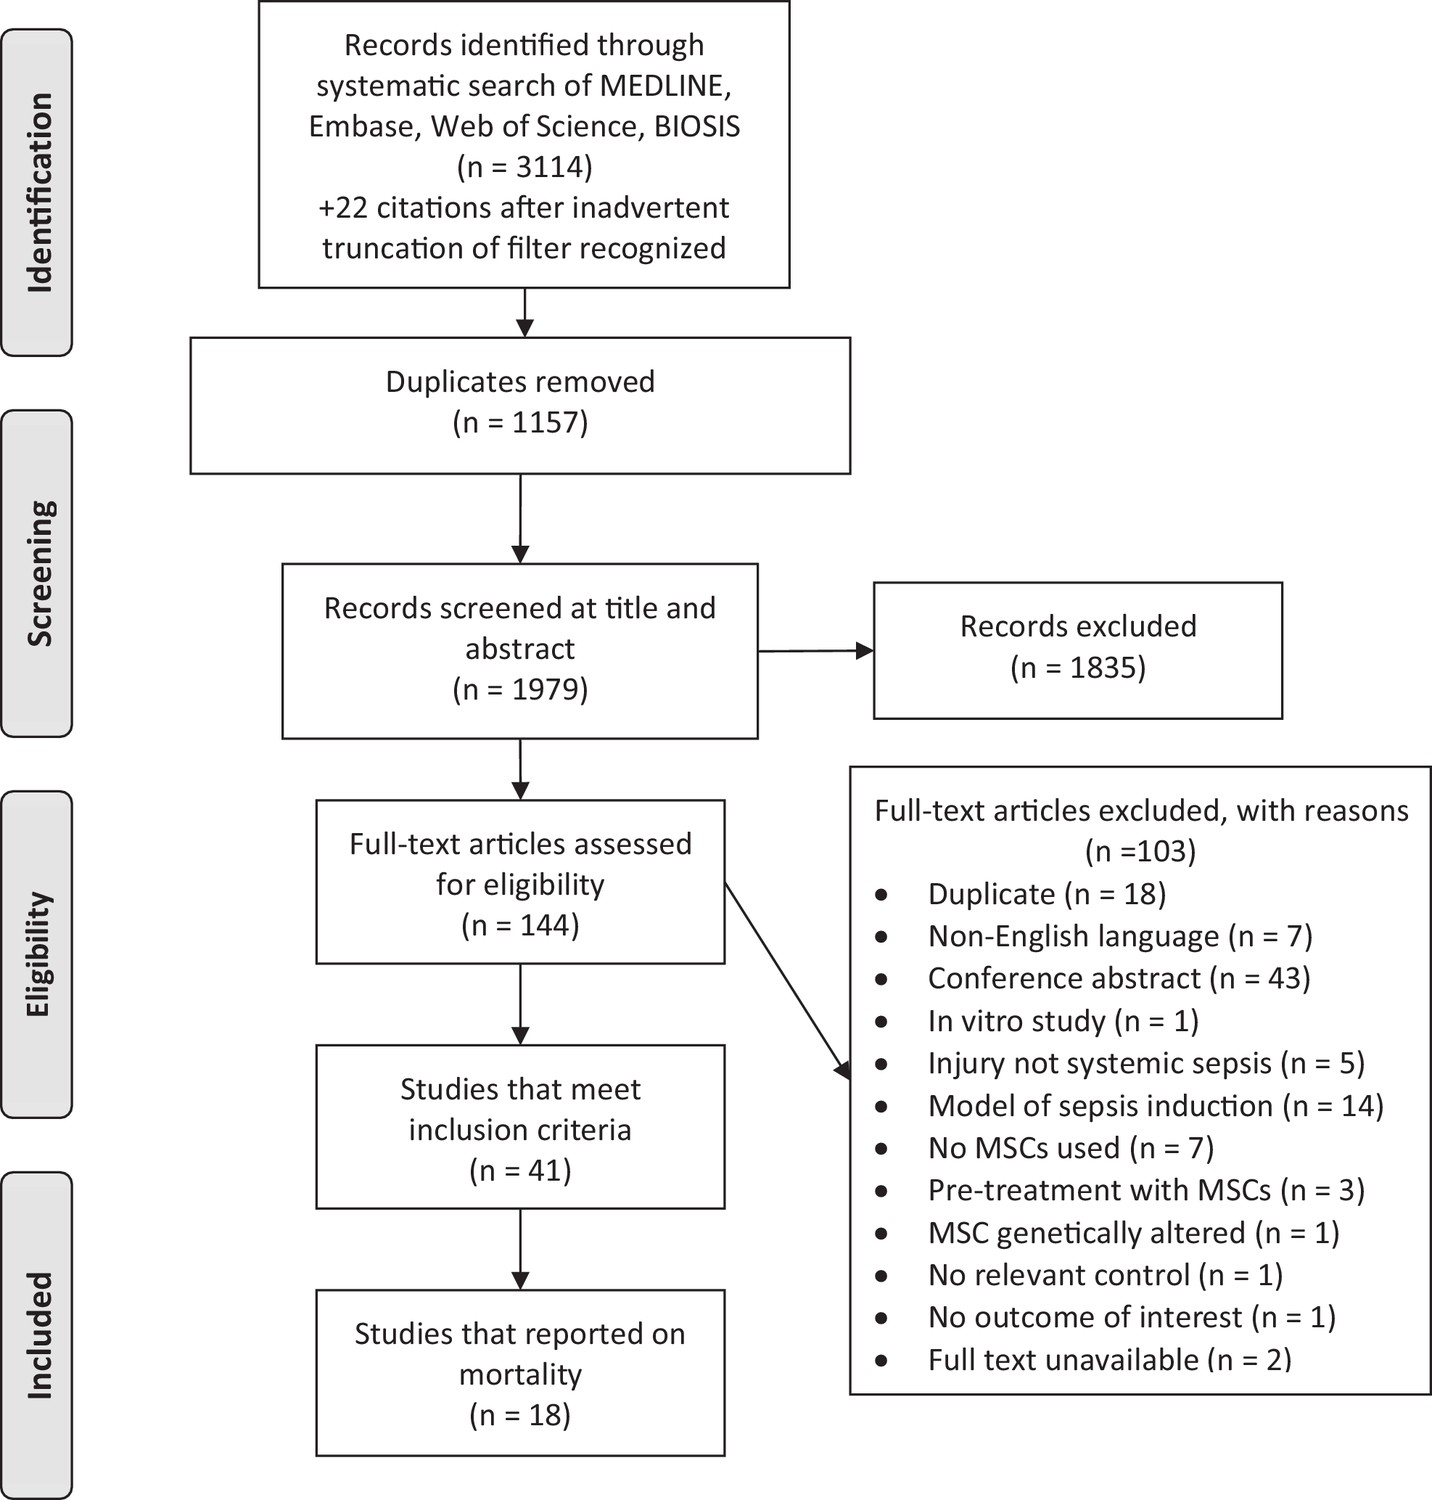
Preferred reporting items for systematic reviews and meta-analysis (PRISMA) flow diagram for study selection.
https://doi.org/10.7554/eLife.17850.003
Figure 2 with 11 supplements
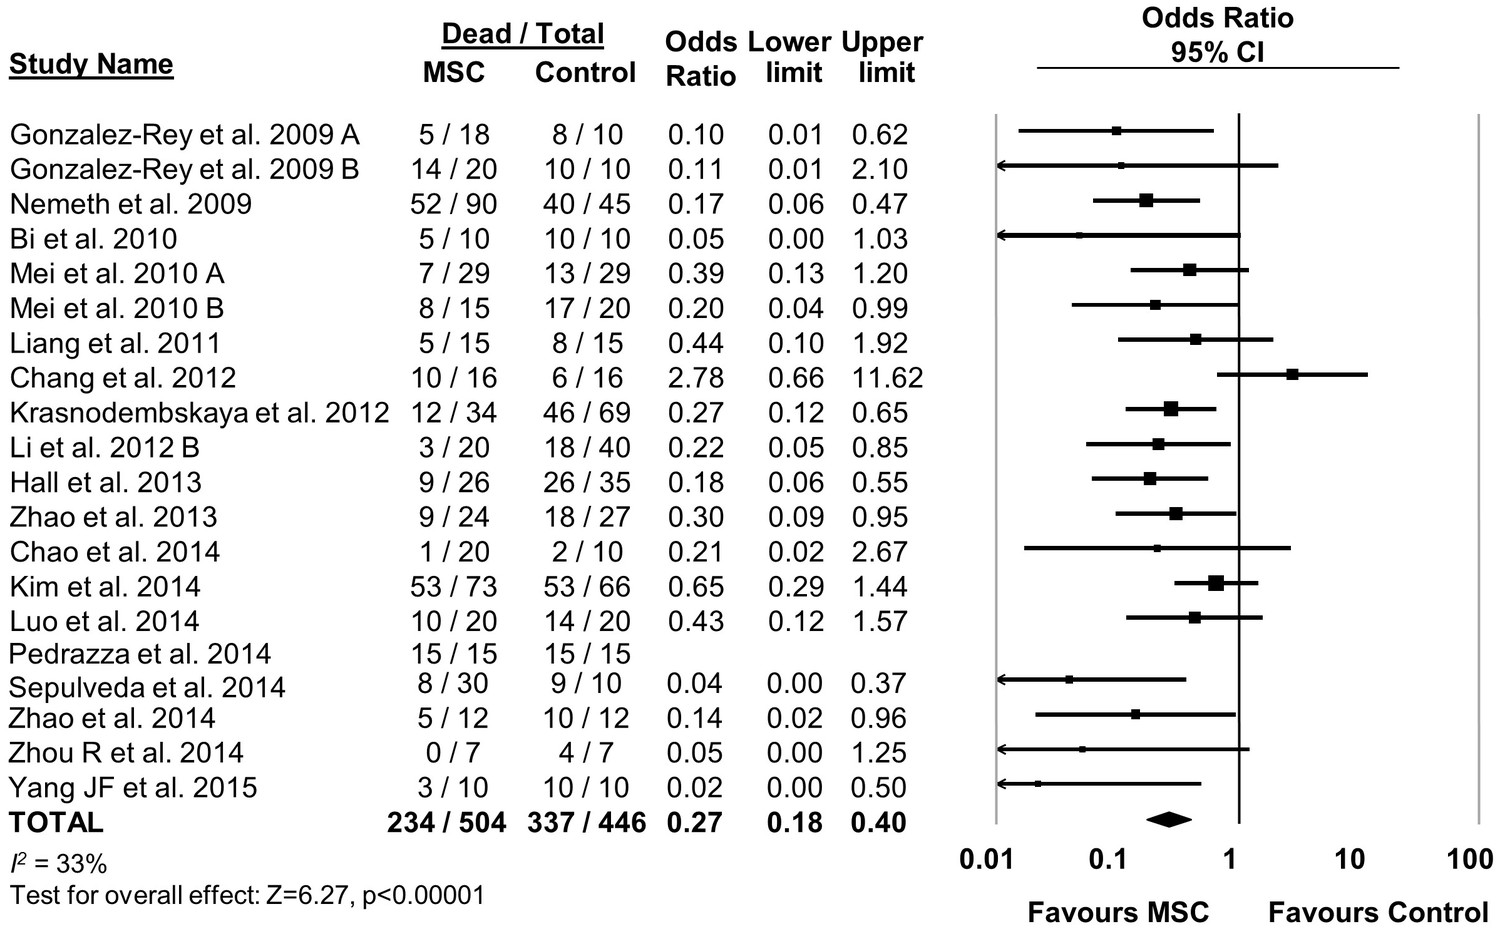
Forest plot summarizing effects of mesenchymal stromal cell (MSC) therapy on mortality in preclinical models of sepsis and endotoxemia.
Point estimates (odds ratio) and 95% confidence intervals (CI) are depicted for individual studies; size of point estimate depicts relative contribution to pooled effect. A pooled meta-analytic summary (random effects model) of overall effect of MSC therapy on mortality is depicted by the diamond at the bottom of the plot (vertical points represent odds ratio point estimate and horizontal points represent 95% CIs). Heterogeneity is represented with the I2 statistic. Data from Pedrazza et al. (2014) was included in total counts but not included in meta-analysis due to 100% mortality in both study arms.
Figure 2—figure supplement 1
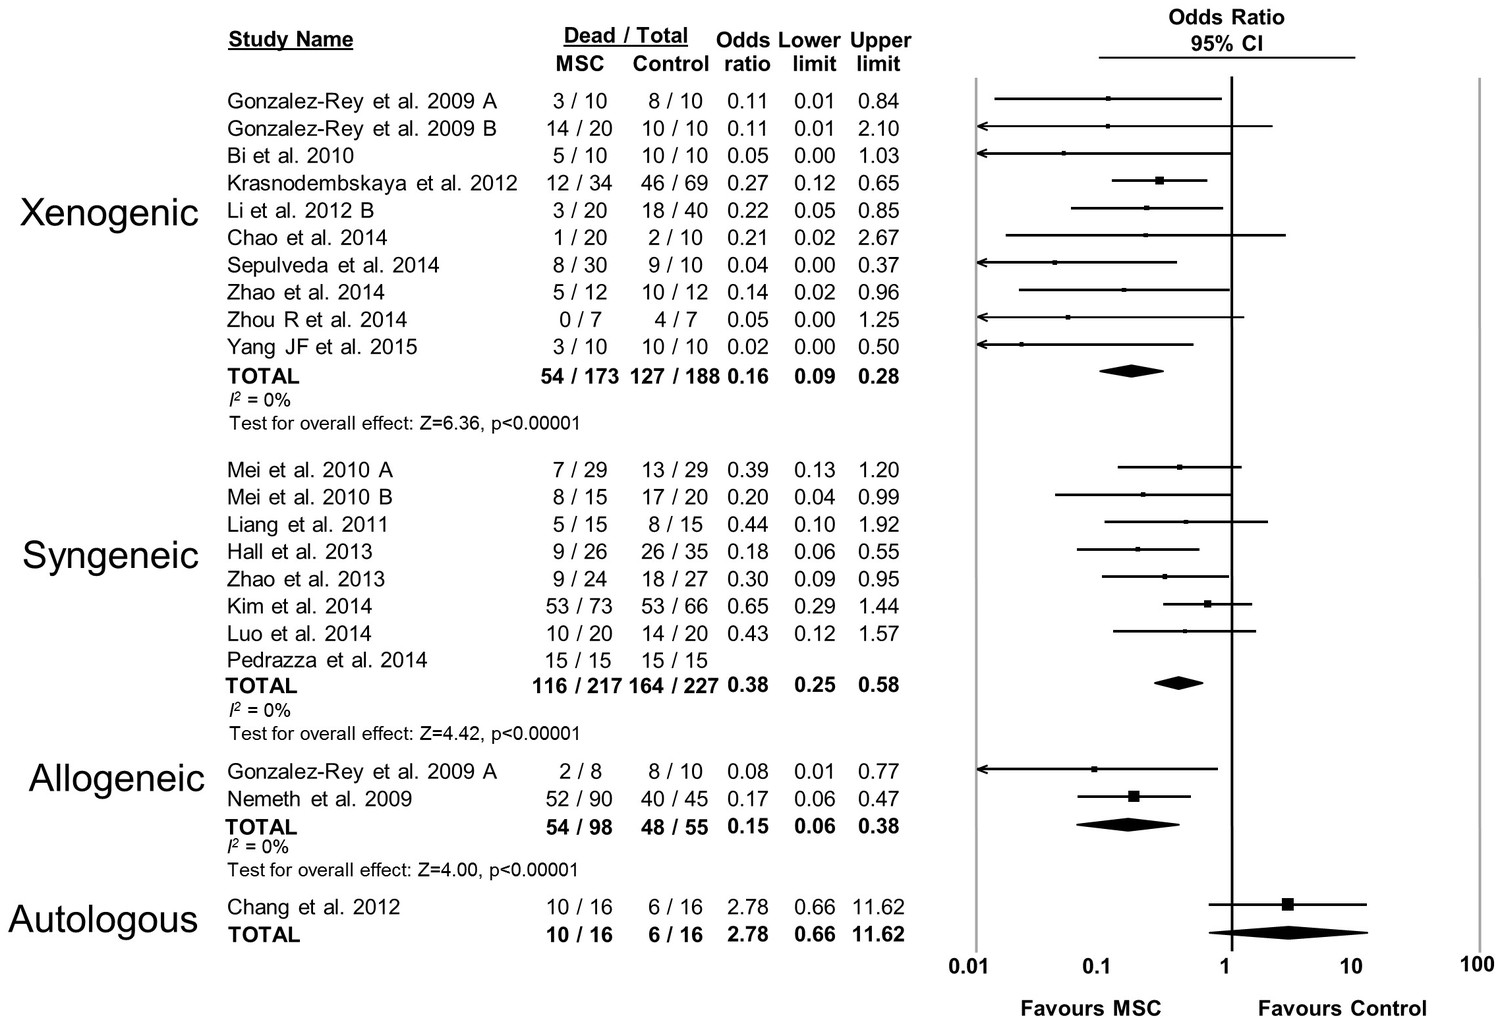
Forest plot summarizing relationship of compatibility of donor mesenchymal stromal cell (MSC) with recipient animal (xenogenic vs syngeneic vs allogeneic vs autologous) on mortality in preclinical models of sepsis and endotoxemia.
Point estimates (odds ratio) and 95% confidence intervals (CI) are depicted for individual studies; size of point estimate depicts relative contribution to pooled effect. A pooled meta-analytic summary (random effects model) of overall effect is depicted by the diamond at the bottom of each subgroup (vertical points represent odds ratio point estimate and horizontal points represent 95% CIs). Heterogeneity is represented with the I2 statistic. Data from Pedrazza et al 2014 was included in total counts but not included in meta-analysis due to 100% mortality in both study arms.
Figure 2—figure supplement 2
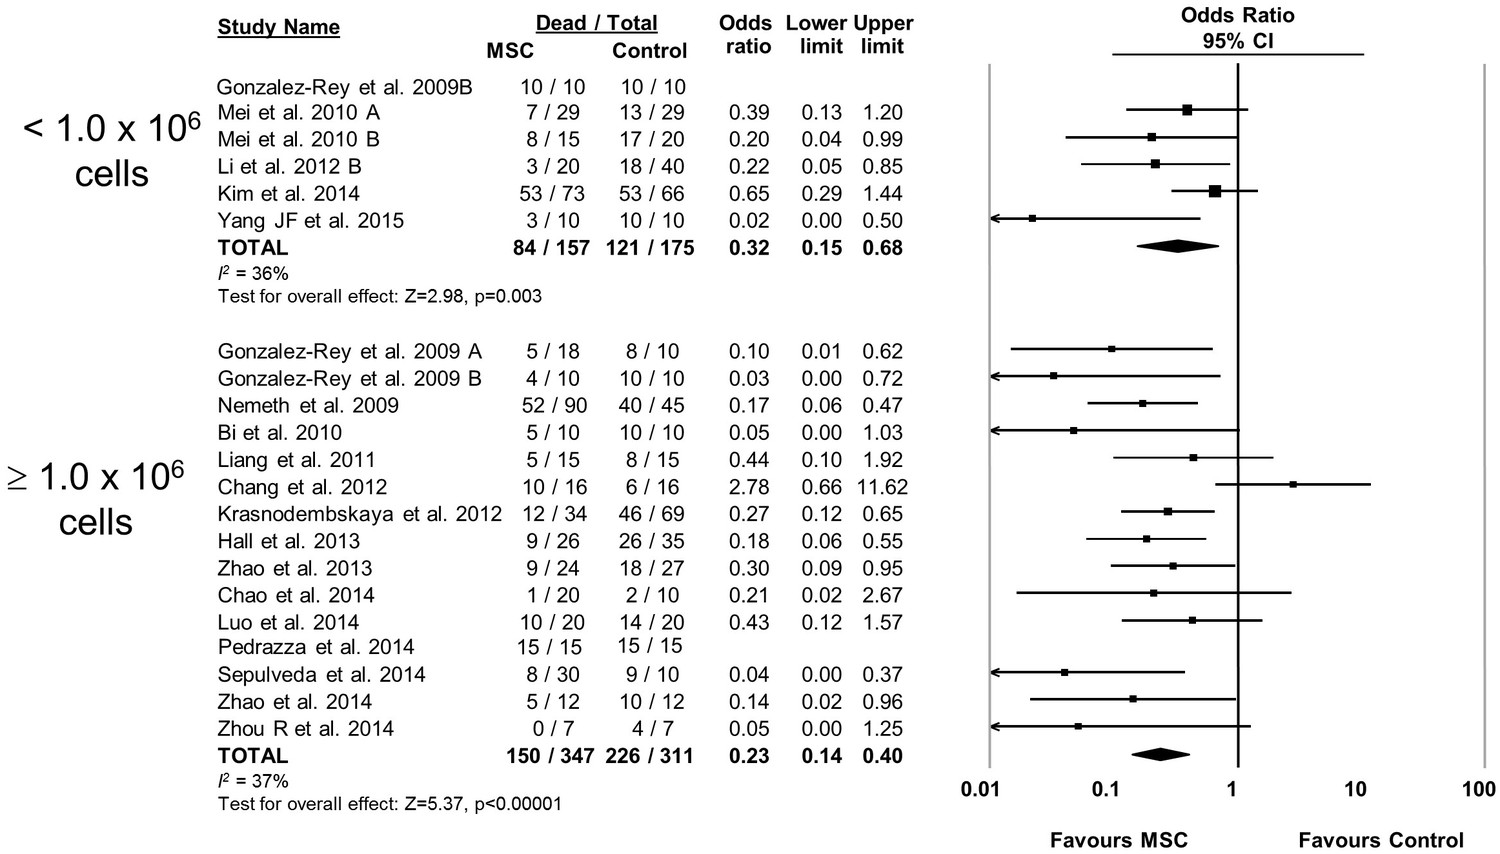
Forest plot summarizing relationship of mesenchymal stromal cell (MSC) dose on mortality in preclinical models of sepsis and endotoxemia.
Point estimates (odds ratio) and 95% confidence intervals (CI) are depicted for individual studies; size of point estimate depicts relative contribution to pooled effect. A pooled meta-analytic summary (random effects model) of overall effect is depicted by the diamond at the bottom of each subgroup (vertical points represent odds ratio point estimate and horizontal points represent 95% CIs). Heterogeneity is represented with the I2 statistic. Data from Pedrazza et al 2014 was included in total counts but not included in meta-analysis due to 100% mortality in both study arms.
Figure 2—figure supplement 3
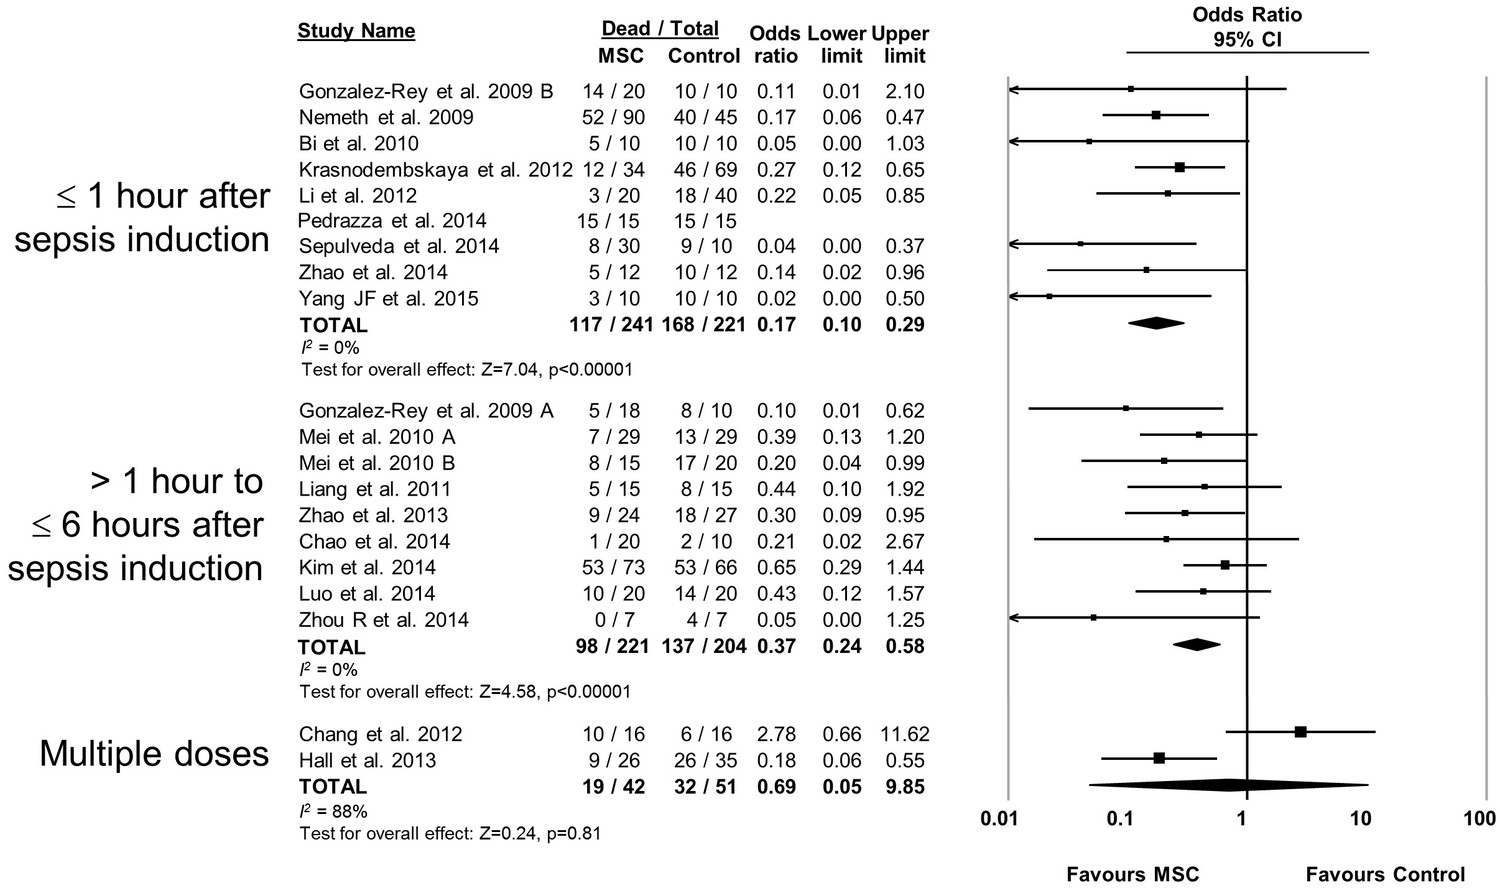
Forest plot summarizing relationship of mesenchymal stromal cell (MSC) therapy timing of administration on mortality in preclinical models of sepsis and endotoxemia.
Point estimates (odds ratio) and 95% confidence intervals (CI) are depicted for individual studies; size of point estimate depicts relative contribution to pooled effect. A pooled meta-analytic summary (random effects model) of overall effect is depicted by the diamond at the bottom of each subgroup (vertical points represent odds ratio point estimate and horizontal points represent 95% CIs). Heterogeneity is represented with the I2 statistic. Data from Pedrazza et al 2014 was included in total counts but not included in meta-analysis due to 100% mortality in both study arms.
Figure 2—figure supplement 4
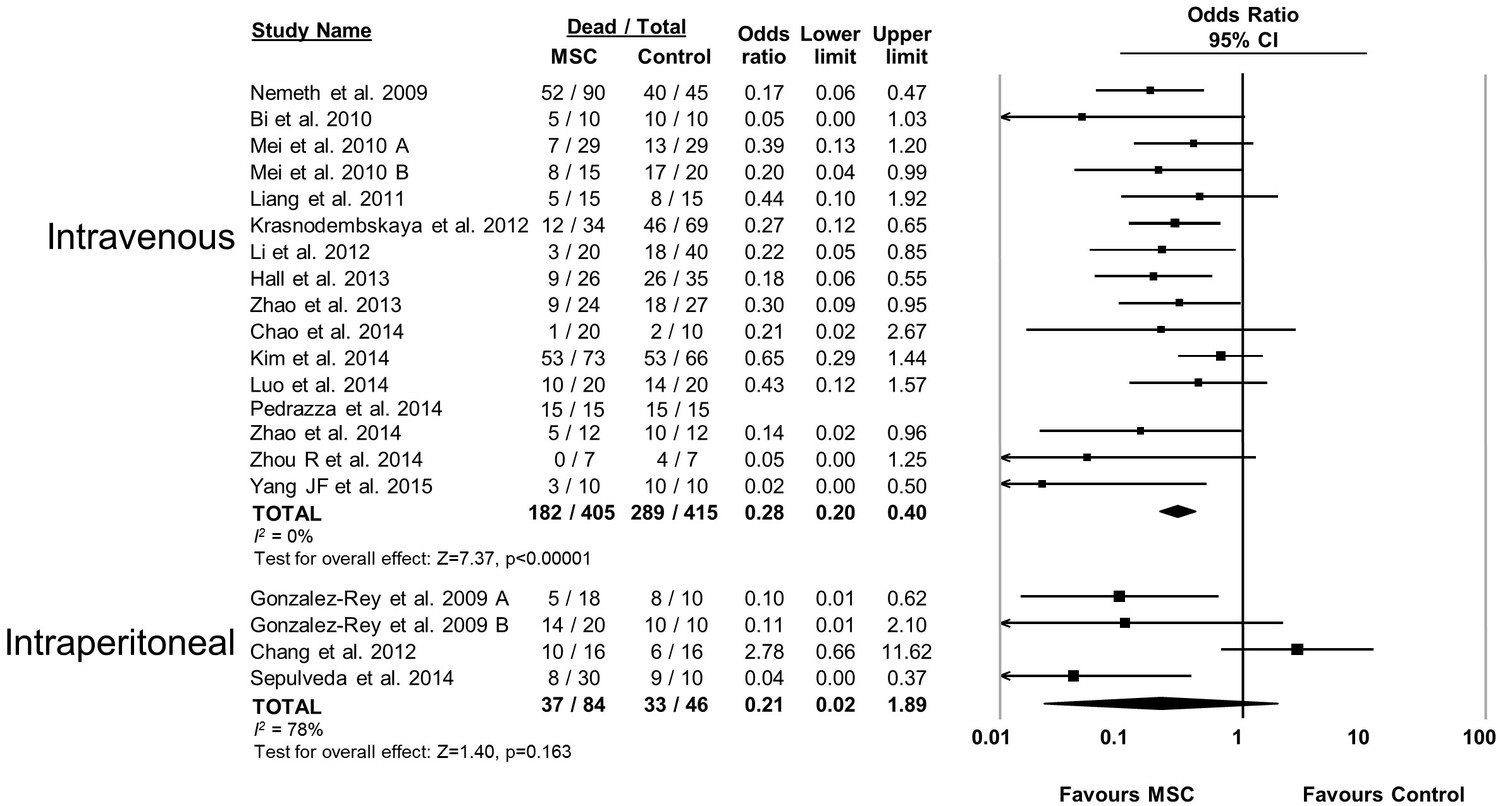
Forest plot summarizing relationship of mesenchymal stromal cell (MSC) administration route (intravenous vs intraperitoneal) on mortality in preclinical models of sepsis and endotoxemia.
Point estimates (odds ratio) and 95% confidence intervals (CI) are depicted for individual studies; size of point estimate depicts relative contribution to pooled effect. A pooled meta-analytic summary (random effects model) of overall effect is depicted by the diamond at the bottom of each subgroup (vertical points represent odds ratio point estimate and horizontal points represent 95% CIs). Heterogeneity is represented with the I2 statistic. Data from Pedrazza et al 2014 was included in total counts but not included in meta-analysis due to 100% mortality in both study arms.
Figure 2—figure supplement 5
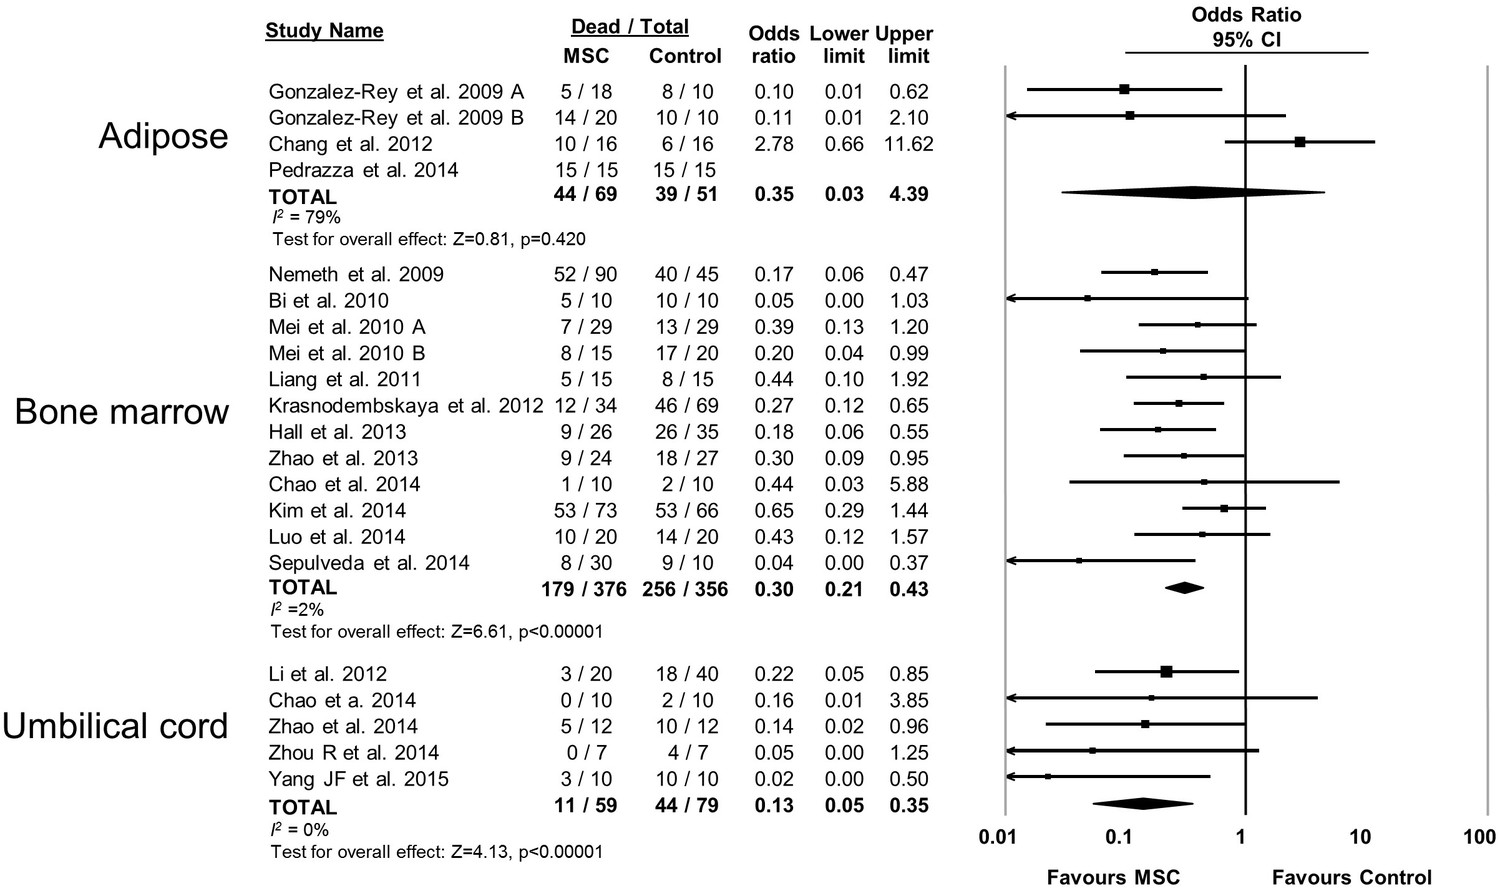
Forest plot summarizing relationship of mesenchymal stromal cell (MSC) tissue source (adipose vs bone marrow vs umbilical cord tissue) on mortality in preclinical models of sepsis and endotoxemia.
Point estimates (odds ratio) and 95% confidence intervals (CI) are depicted for individual studies; size of point estimate depicts relative contribution to pooled effect. A pooled meta-analytic summary (random effects model) of overall effect is depicted by the diamond at the bottom of each subgroup (vertical points represent odds ratio point estimate and horizontal points represent 95% CIs). Heterogeneity is represented with the I2 statistic. Data from Pedrazza et al 2014 was included in total counts but not included in meta-analysis due to 100% mortality in both study arms.
Figure 2—figure supplement 6
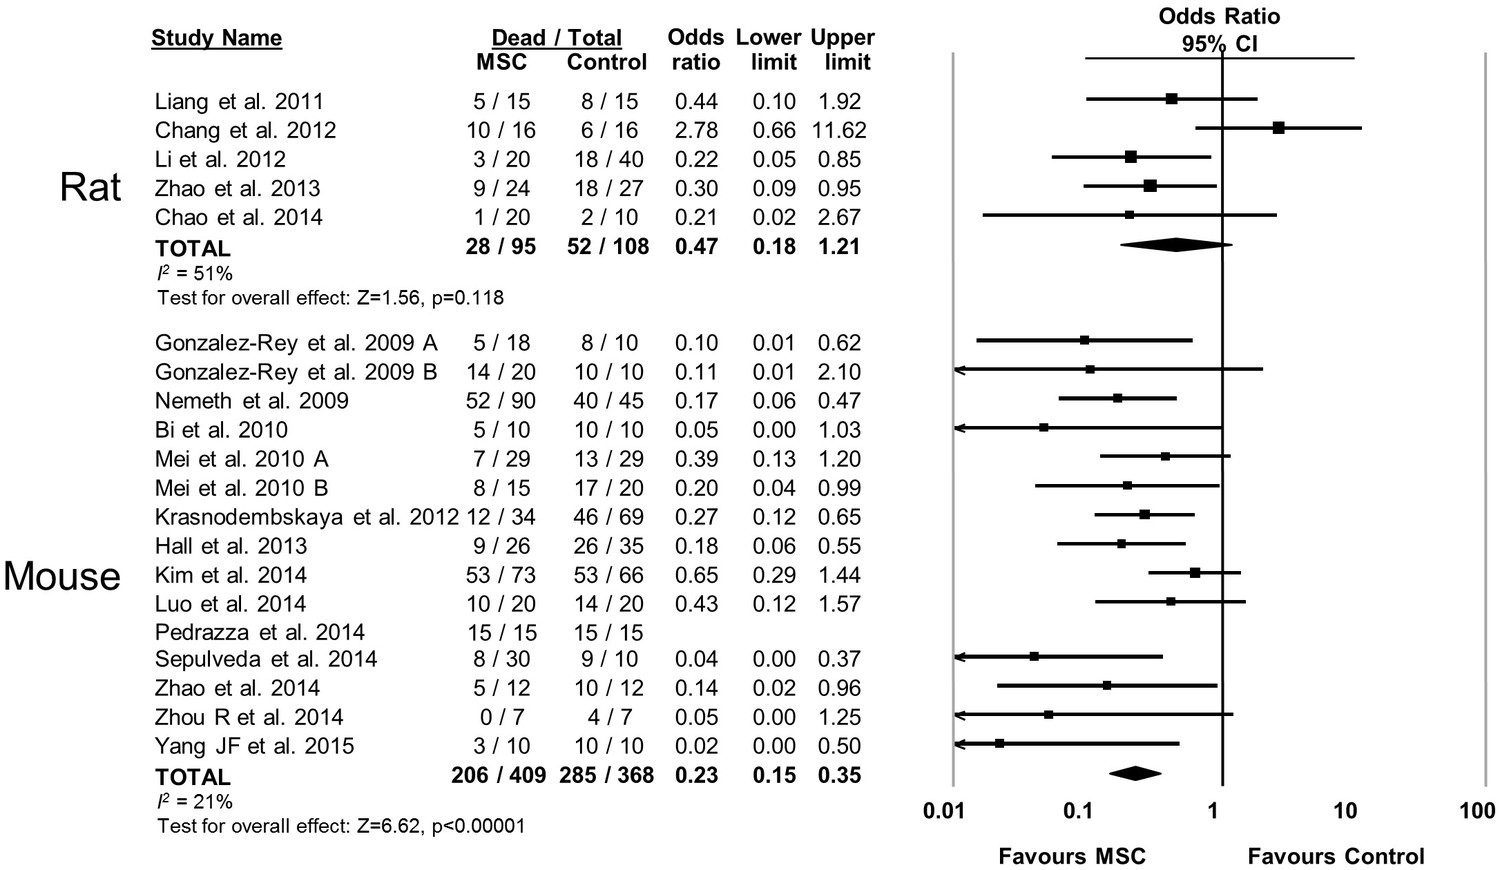
Forest plot summarizing relationship of animal species (rat vs mouse) on mortality in preclinical models of sepsis and endotoxemia treated with mesenchymal stromal cells (MSCs).
Point estimates (odds ratio) and 95% confidence intervals (CI) are depicted for individual studies; size of point estimate depicts relative contribution to pooled effect. A pooled meta-analytic summary (random effects model) of overall effect is depicted by the diamond at the bottom of each subgroup (vertical points represent odds ratio point estimate and horizontal points represent 95% CIs). Heterogeneity is represented with the I2 statistic. Data from Pedrazza et al 2014 was included in total counts but not included in meta-analysis due to 100% mortality in both study arms.
Figure 2—figure supplement 7
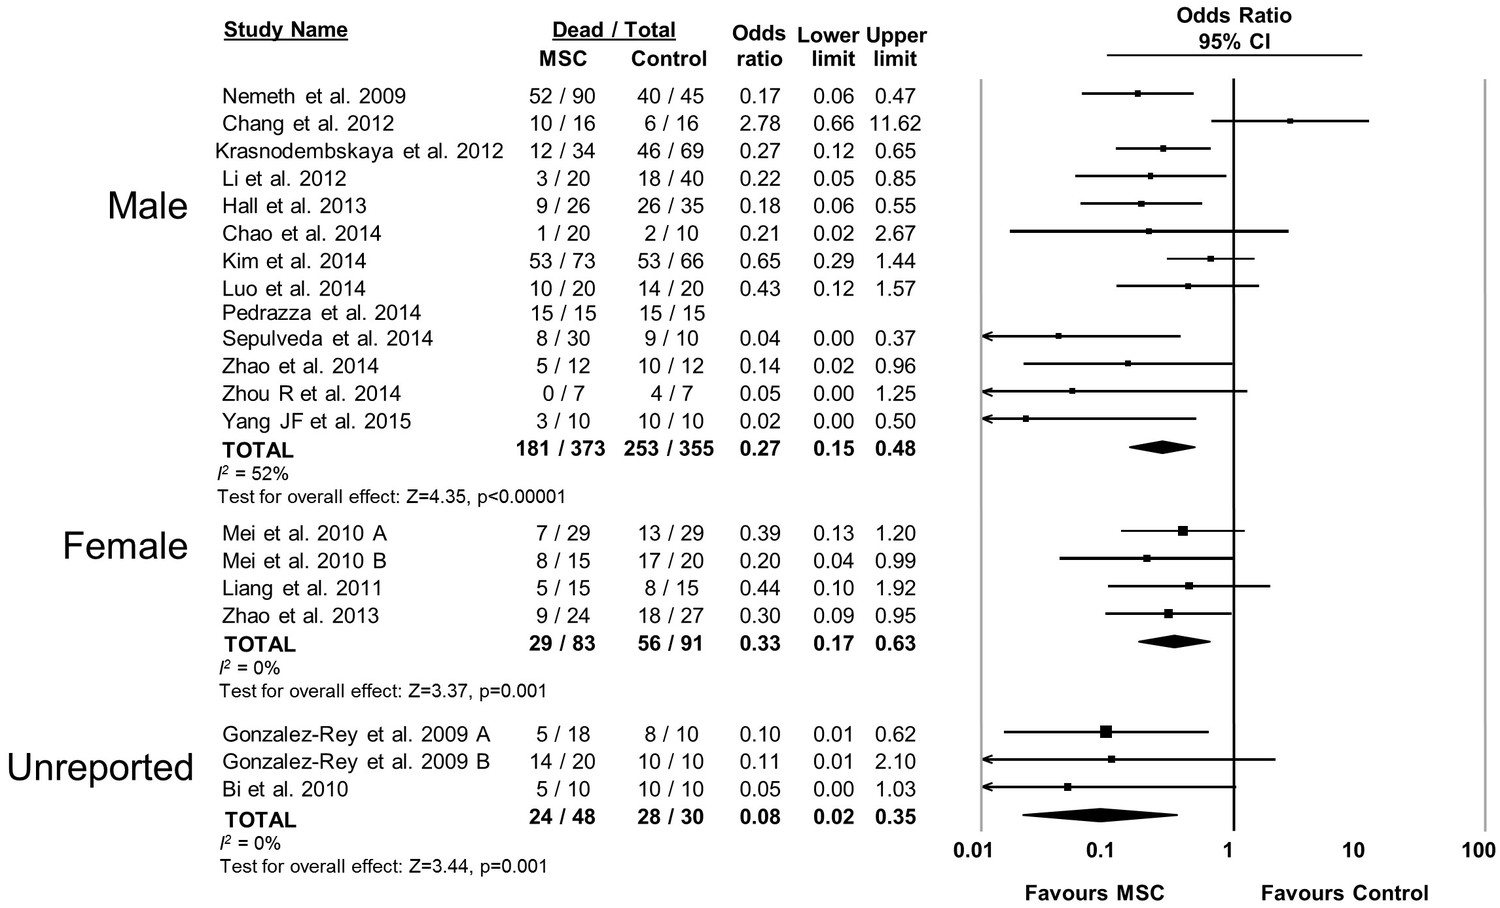
Forest plot summarizing relationship of animal sex (male vs female vs unreported) on mortality in preclinical models of sepsis and endotoxemia treated with mesenchymal stromal cells (MSCs).
Point estimates (odds ratio) and 95% confidence intervals (CI) are depicted for individual studies; size of point estimate depicts relative contribution to pooled effect. A pooled meta-analytic summary (random effects model) of overall effect is depicted by the diamond at the bottom of each subgroup (vertical points represent odds ratio point estimate and horizontal points represent 95% CIs). Heterogeneity is represented with the I2 statistic. Data from Pedrazza et al 2014 was included in total counts but not included in meta-analysis due to 100% mortality in both study arms.
Figure 2—figure supplement 8
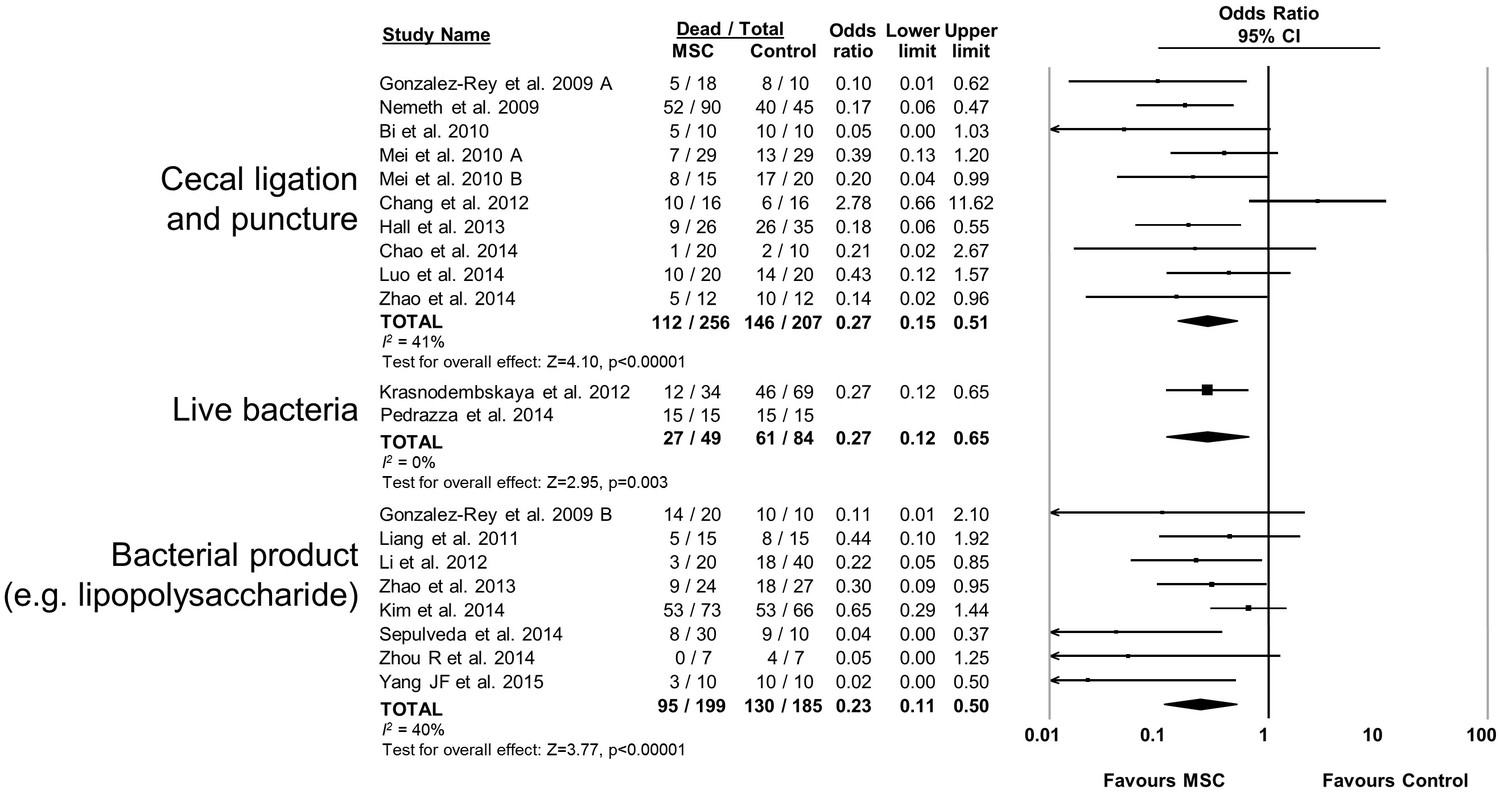
Forest plot summarizing relationship of preclinical models of sepsis and endotoxemia (cecal ligation and puncture vs live bacteria administration vs bacterial product such as lipopolysaccharide) on mortality following treatment with mesenchymal stromal cells (MSCs).
Point estimates (odds ratio) and 95% confidence intervals (CI) are depicted for individual studies; size of point estimate depicts relative contribution to pooled effect. A pooled meta-analytic summary (random effects model) of overall effect is depicted by the diamond at the bottom of each subgroup (vertical points represent odds ratio point estimate and horizontal points represent 95% CIs). Heterogeneity is represented with the I2 statistic. Data from Pedrazza et al 2014 was included in total counts but not included in meta-analysis due to 100% mortality in both study arms.
Figure 2—figure supplement 9
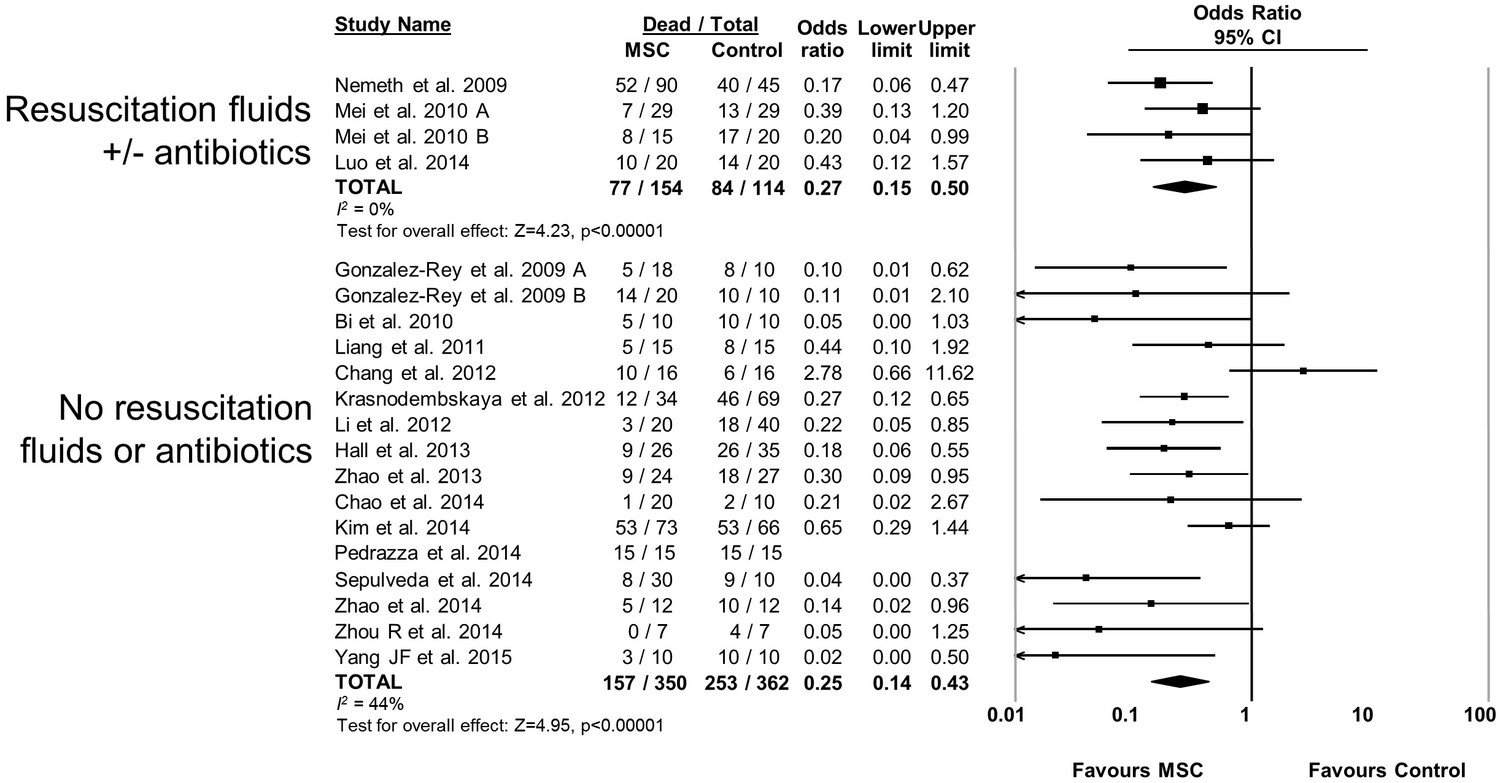
Forest plot summarizing relationship of resuscitation (fluids +/- antibiotics vs no resuscitation) on mortality in preclinical models of sepsis and endotoxemia treated with mesenchymal stromal cells (MSCs).
Point estimates (odds ratio) and 95% confidence intervals (CI) are depicted for individual studies; size of point estimate depicts relative contribution to pooled effect. A pooled meta-analytic summary (random effects model) of overall effect is depicted by the diamond at the bottom of each subgroup (vertical points represent odds ratio point estimate and horizontal points represent 95% CIs). Heterogeneity is represented with the I2 statistic. Data from Pedrazza et al 2014 was included in total counts but not included in meta-analysis due to 100% mortality in both study arms.
Figure 2—figure supplement 10
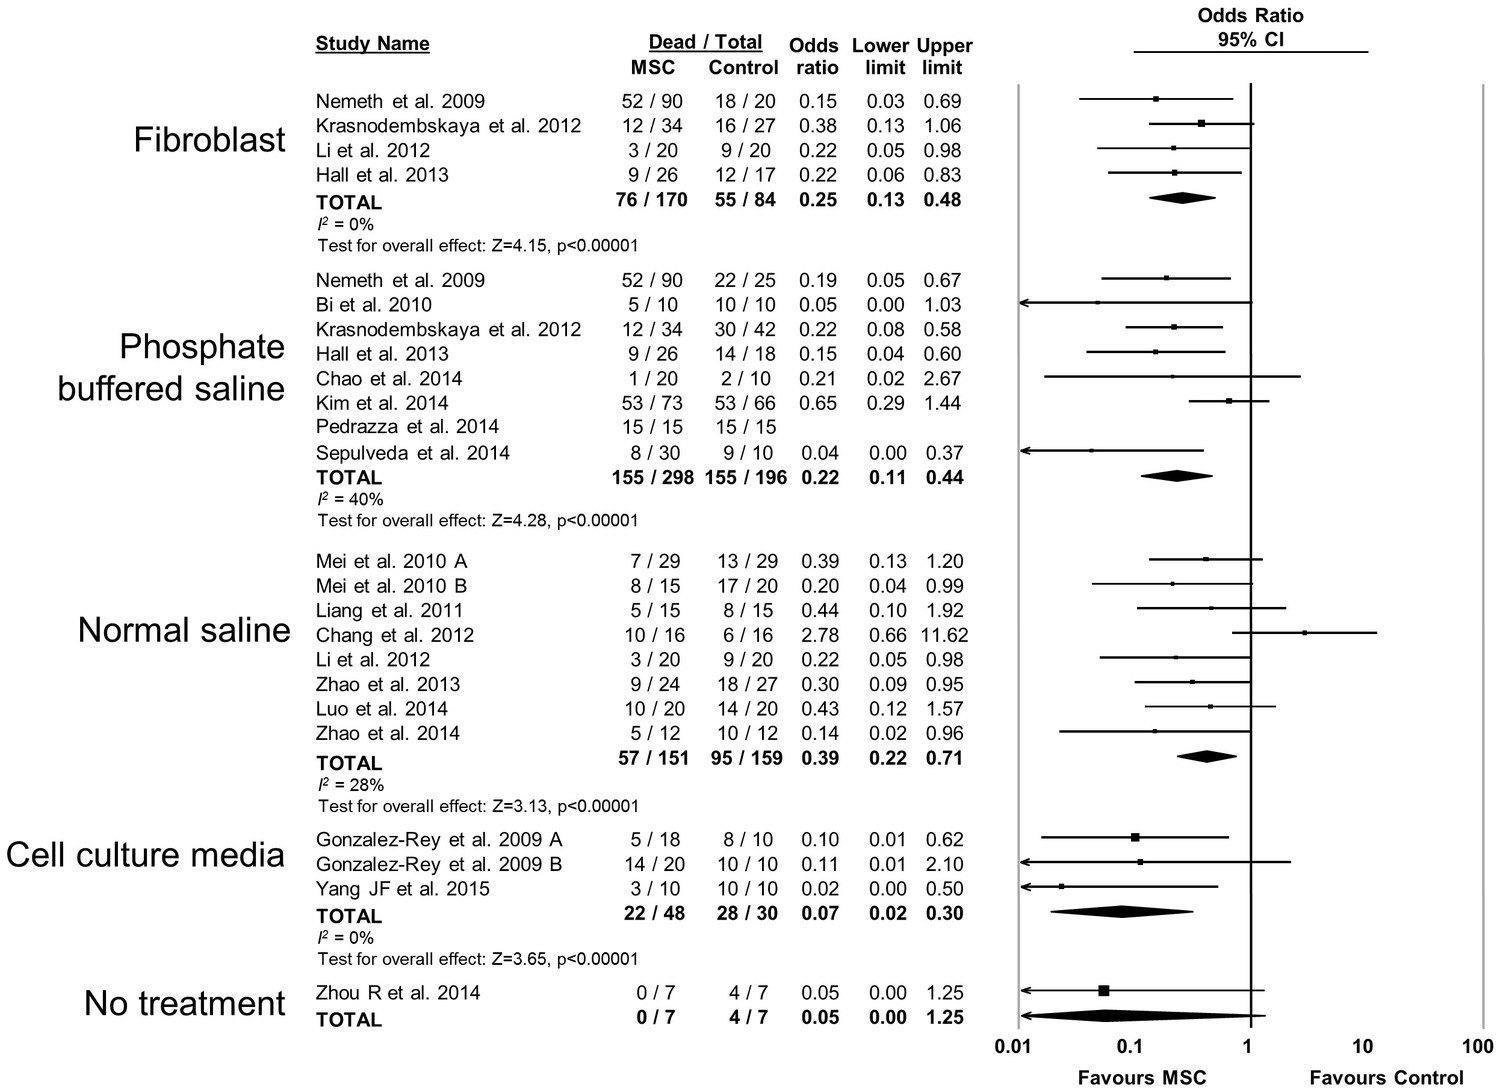
Forest plot summarizing relationship of comparison (control) treatment on mortality in preclinical models of sepsis and endotoxemia treated with mesenchymal stromal cells (MSCs).
Point estimates (odds ratio) and 95% confidence intervals (CI) are depicted for individual studies; size of point estimate depicts relative contribution to pooled effect. A pooled meta-analytic summary (random effects model) of overall effect is depicted by the diamond at the bottom of each subgroup (vertical points represent odds ratio point estimate and horizontal points represent 95% CIs). Heterogeneity is represented with the I2 statistic. Data from Pedrazza et al 2014 was included in total counts but not included in meta-analysis due to 100% mortality in both study arms.
Figure 2—figure supplement 11
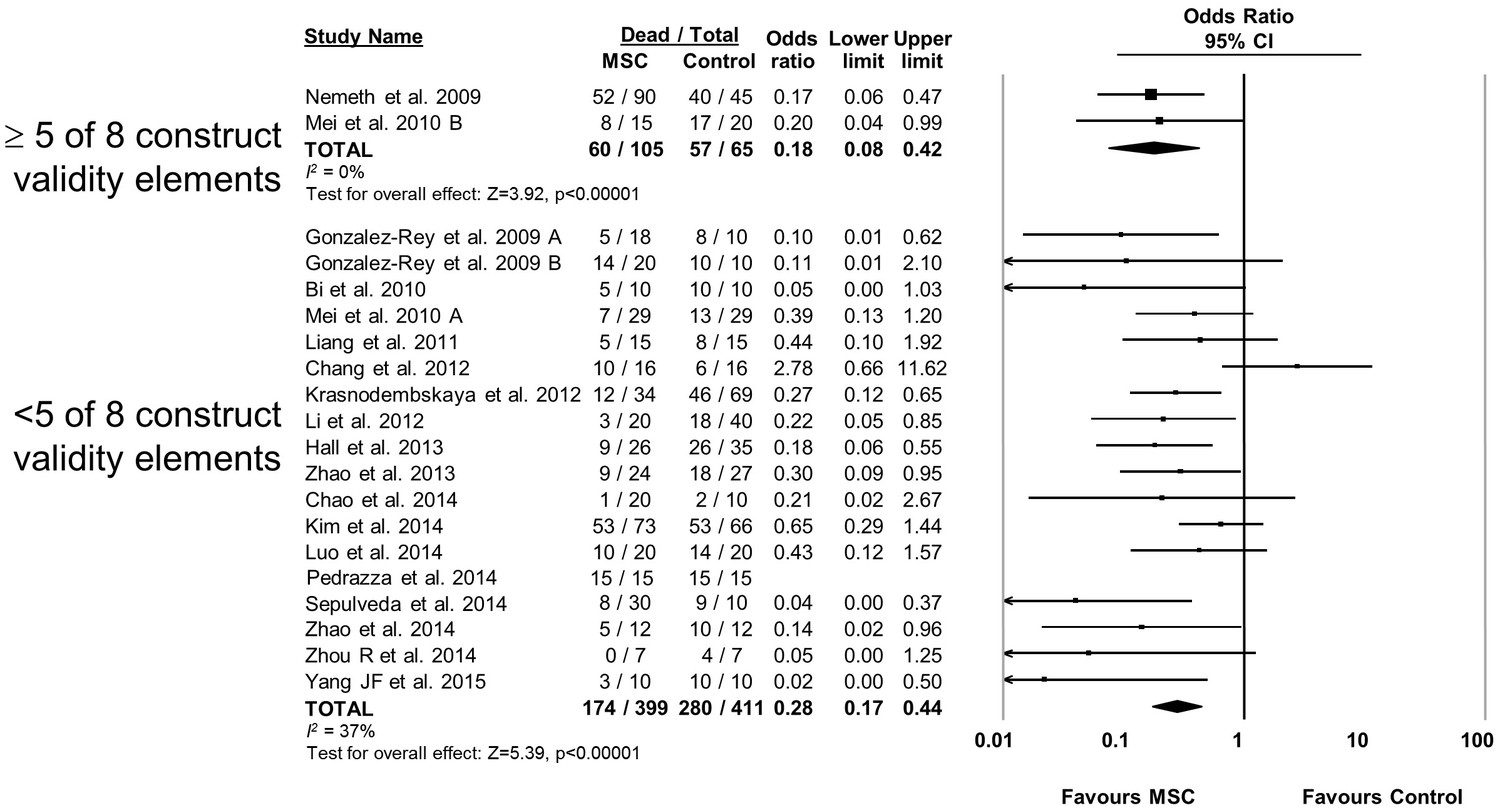
Forest plot summarizing relationship of adherence to elements of construct validity on mortality in preclinical models of sepsis and endotoxemia treated with mesenchymal stromal cells (MSCs).
Subgroups are studies that adhered to a majority of elements suggested to increase construct validity (≥5 of 8; see text for details of elements) vs those that did not adhere to majority. Point estimates (odds ratio) and 95% confidence intervals (CI) are depicted for individual studies; size of point estimate depicts relative contribution to pooled effect. A pooled meta-analytic summary (random effects model) of overall effect is depicted by the diamond at the bottom of each subgroup (vertical points represent odds ratio point estimate and horizontal points represent 95% CIs). Heterogeneity is represented with the I2 statistic. Data from Pedrazza et al 2014 was included in total counts but not included in meta-analysis due to 100% mortality in both study arms.
Figure 3
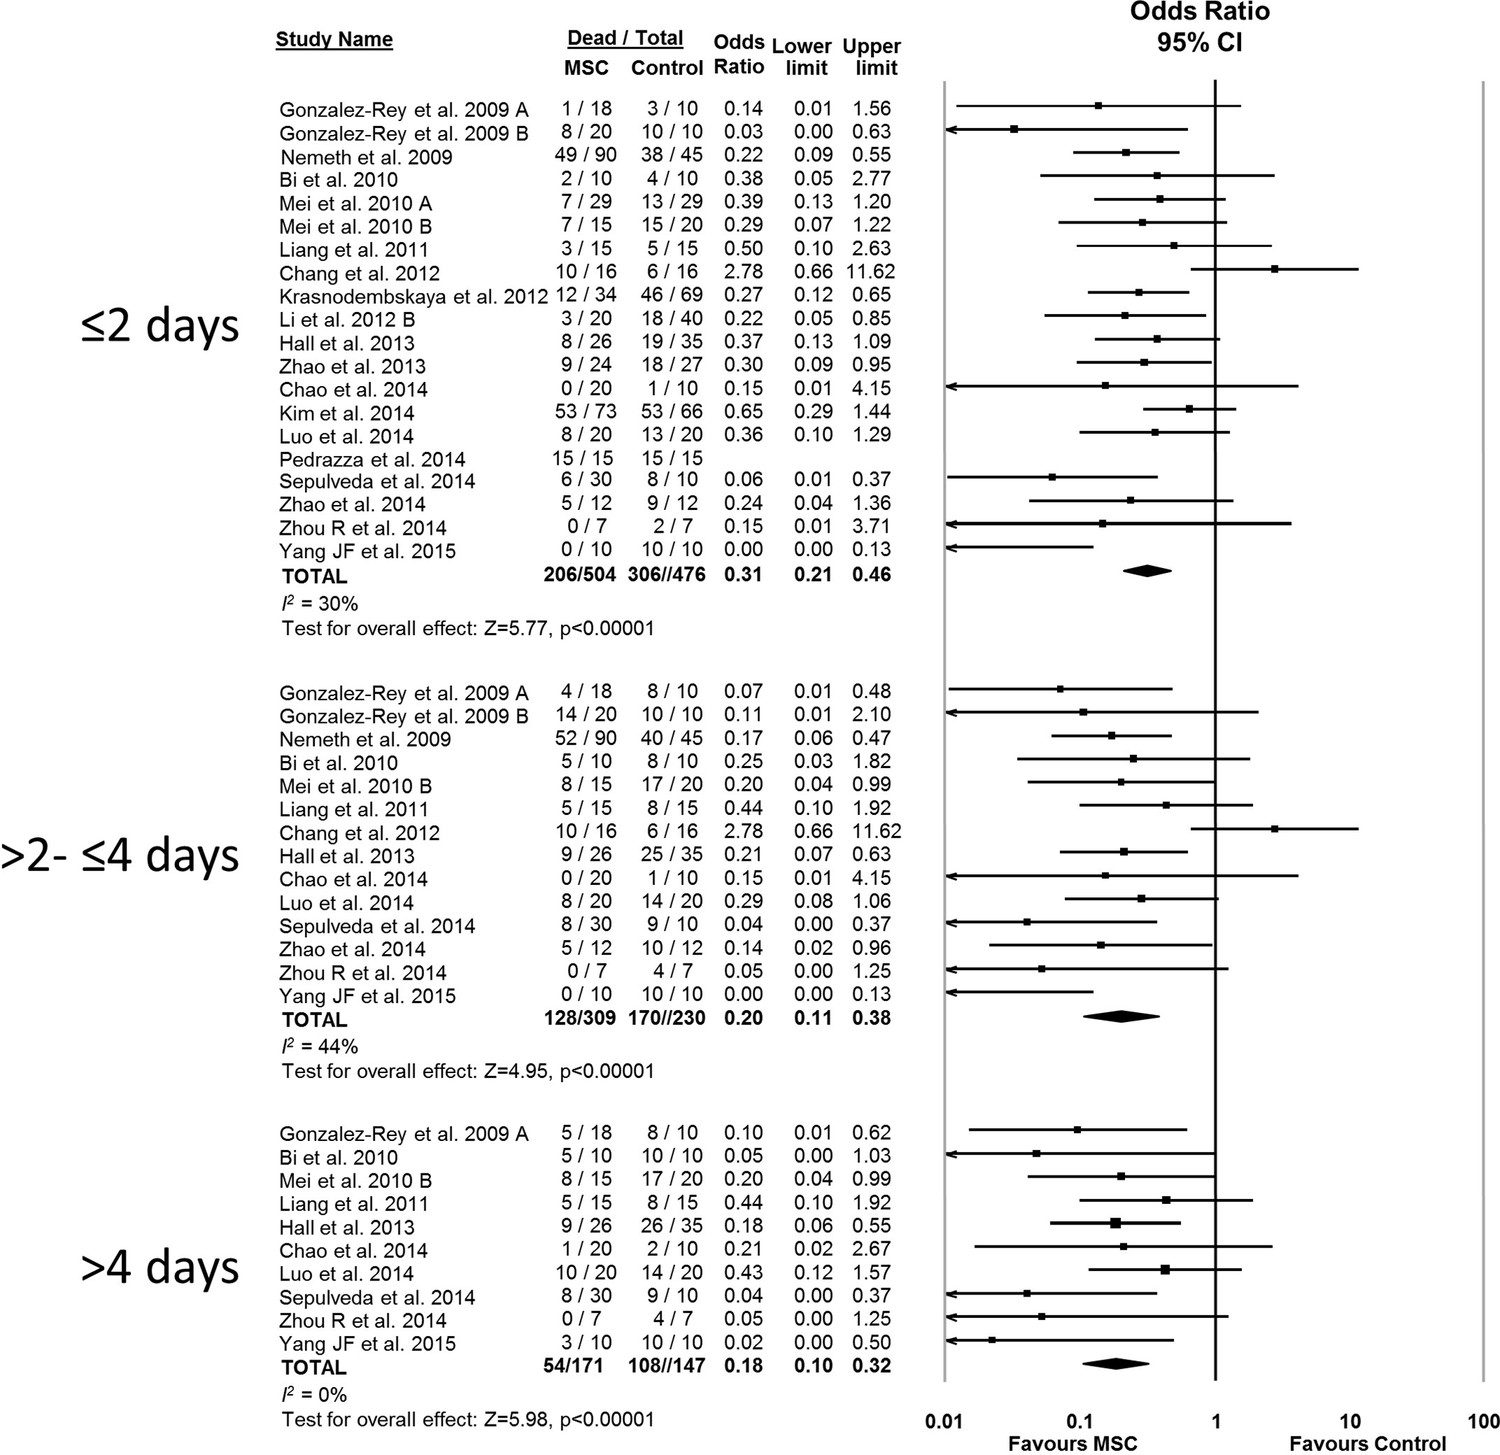
Forest plot summarizing relationship of mesenchymal stromal cell (MSC) therapy on mortality over time in preclinical models of sepsis and endotoxemia (outcome windows: ≤2 days, >2 to ≤ 4 days, > 4 days).
Point estimates (odds ratio) and 95% confidence intervals (CI) are depicted for individual studies; size of point estimate depicts relative contribution to pooled effect. A pooled meta-analytic summary (random effects model) of overall effect of MSC therapy on mortality is depicted by the diamond at the bottom of each time interval (vertical points represent odds ratio point estimate and horizontal points represent 95% CIs). Heterogeneity is represented with the I2 statistic. Data from Pedrazza et al. (2014) was included in total counts but not included in meta-analysis due to 100% mortality in both study arms.
Figure 4
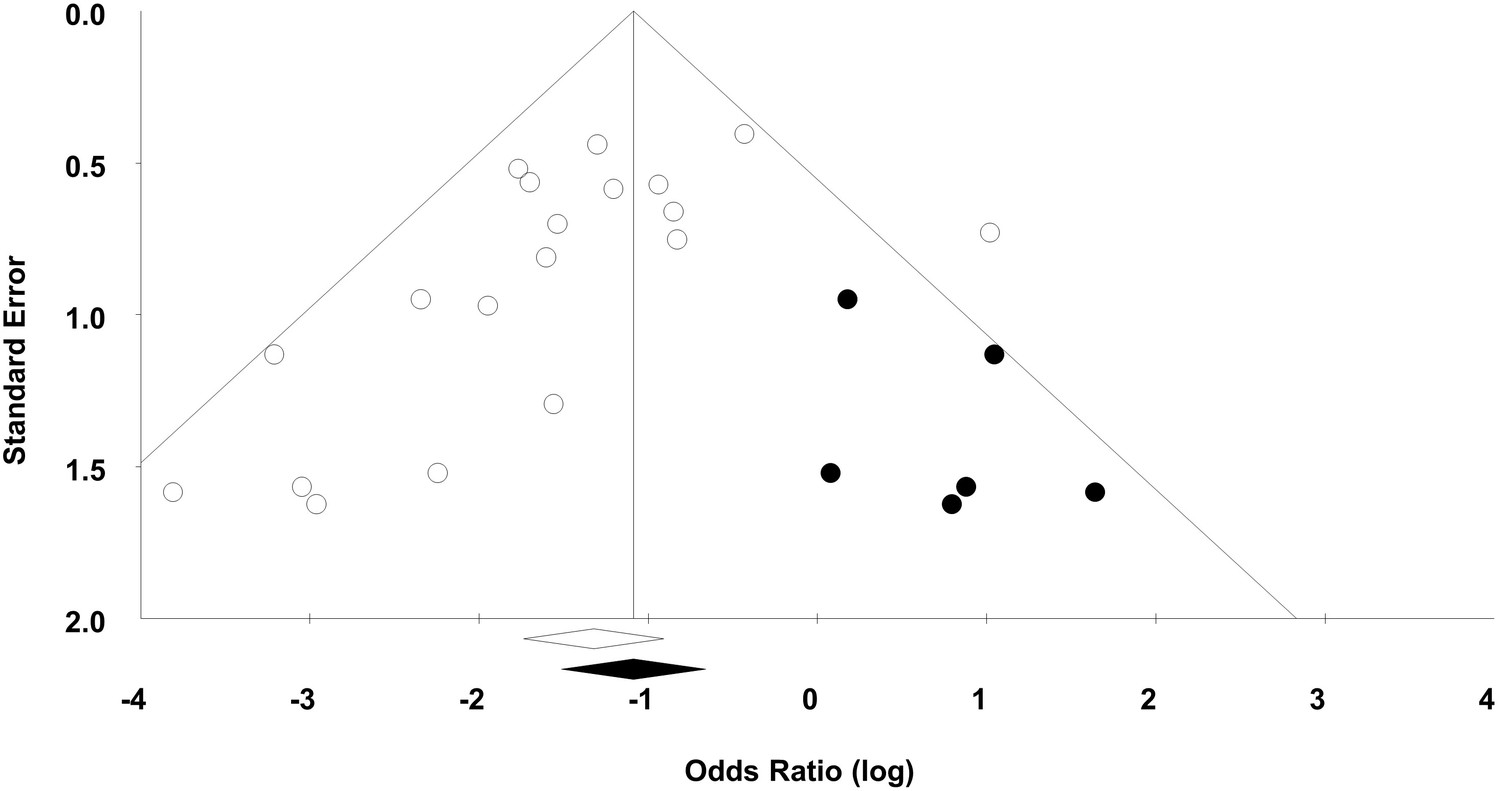
Funnel plot to detect publication bias.
Trim and fill analysis was performed on overall mortality. Open circles denote original data, black circles denote ‘filled’ studies. Open diamond denotes original pooled effect size (log odds ratio) and 95% confidence interval. Filled diamond represents adjusted effect size and 95% confidence interval.
Tables
Table 1
General characteristics of preclinical studies investigating the efficacy of mesenchymal stromal cells in models of sepsis.
| Author year Country | Species, Strain, Gender | Sepsis model | Resuscitation | MSC source, Compatibility | MSC Dose | Time (hours)* | MSC route | Control |
|---|---|---|---|---|---|---|---|---|
| Gonzalez-Rey et al. (2009)A Spain | Mouse BALB/c, NR | CLP (1 × 22 G) | None | Adipose Xenogenic or Allogeneic | 1.0 × 10⁶ | 4 | IP | DMEM |
| Gonzalez-Rey et al. (2009)B Spain | Mouse BALB/c, NR | LPS (i.p.) | None | Adipose Xenogenic | 1.0 x 10⁶ or3.0 x 105 | 0.5 | IP | DMEM |
| Nemeth et al. (2009) United States | Mouse C57BL/6, M | CLP (2 × 21 G) | Fluid and antibiotics | Bone marrow Allogeneic | 1.0 × 10⁶ | 0 or 1 | IV | PBS or Fibroblast |
| Bi et al. (2010) China | Mouse C57BL/6, NR | CLP (2 × 21 G) | None | Bone marrow Xenogenic | 1.0 × 10⁶ | 1 1 | IV | PBS |
| Mei et al. (2010)A Canada | Mouse C57BL/6J, F | CLP (1 × 22 G) | Fluid | Bone marrow Syngeneic | 2.5 × 10⁵ | 6 | IV | NS |
| Mei et al. (2010)B Canada | Mouse C57BL/6J, F | CLP (1 × 18 G) | Fluid and antibiotics | Bone marrow Syngeneic | 2.5 × 10⁵ | 6 | IV | NS |
| Liang et al. (2011) China | Rat Wistar, F | LPS (i.v.) | None | Bone marrow Syngeneic | 1.0 × 10⁶ | 2 | IV | NS |
| Chang et al. (2012) China | Rat SPD, M | CLP (2 × 18 G) | None | Adipose Autologous | 3 × 1.2 × 106 | 0.5, 6 then 18 | IP | NS |
| Krasnodembskaya et al. (2012), USA | Mouse C57BL/6J, M | P. aeruginosa (i.p.) | None | Bone marrow Xenogenic | 1.0 × 10⁶ | 1 | IV | PBS Fibroblast |
| Li et al. (2012) China | Rat SPD, M | LPS (i.p.) | None | Umbilical cord Xenogenic | 5.0 × 10⁵ | 1 | IV | NS or Fibroblast |
| Hall et al. (2013) USA | Mouse BALB/c, M | CLP (2 × 21 G) | None | Bone marrow Syngeneic | 1 × 5.0× 105 + 2× 2.5 × 105 | 2 then 24 then 48 | IV | PBS or Fibroblast |
| Zhao et al. (2013) China | Rat SPD, F | LPS (i.v.) | None | Bone marrow Syngeneic | 2.5 ×10⁶ | 2 | IV | NS |
| Chao et al. (2014) Taiwan | Rat Wistar, M | CLP (1 × 18 G) | None | Bone Marrow or Umbilical Cord Xenogenic | 5.0 × 10⁶ | 4 | IV | PBS |
| Kim et al. (2014) Canada | Mouse C57BL/6, M | SEB+ (i.p) | None | Bone marrow Syngeneic | 2.5 × 10⁵ | 3 | IV | PBS |
| Luo et al. (2014) China | Mouse C57Bl/6, M | CLP (2 × 21 G) | Fluid | Bone marrow Syngeneic | 1.0 × 10⁶ | 3 | IV | NS |
| Pedrazza et al. (2014) Brazil | Mouse C57BL/6, M | E. coli (i.p.) | None | Adipose Syngeneic | 1.0 × 10⁶ | 0 | IV | PBS |
| Sepulveda et al. (2014) Spain | Mouse BALB/c, M | LPS (i.p.) | None | Bone Marrow Xenogenic | 1.0 × 10⁶ | 0.5 | IP | PBS |
| Zhao et al. (2014) China | Mouse C57BL/6, M | CLP (NR) | None | Umbilical cord Xenogenic | 1.0 × 10⁶ | 1 | IV | NS |
| Zhou et al. (2014) China | Mouse NOD SCID, M | LPS+ (i.p.) | None | Umbilical Cord Xenogenic | 2.0 × 10⁶ | 6 | IV | No treatment |
| Yang et al. (2015) China | Mouse NOD SCID, M | LPS+ (i.p.) | None | Umbilical cord Xenogenic | 5.0 × 10⁵ | 0 | IV | DMEM |
-
Legend: * = Time of delivery post-sepsis induction, + = Models also administered D-galactosamine, CLP = Cecal ligation and puncture, DMEM = Dulbecco's modified Eagle's medium, i.p. = Intraperitoneal, i.v. = Intravenous, LPS = Lipopolysaccharide, NR = Not reported, NOD SCID = NOD.Cg-Prkdcscid Il2rgtm1Wjl/SzJ (immunodeficient), NS = Normal saline, PBS = Phosphate buffered saline, SEB = Staphylococcal enterotoxin B, SPD = Sprague-Dawley.
Table 2
Risk of bias assessment of preclinical studies investigating the efficacy of mesenchymal stromal cells in models of sepsis.
| Study | Randomization | Allocation concealment | Blinding of personnel | Blinding of outcome assessment | Incomplete outcome data | Selective outcome reporting |
|---|---|---|---|---|---|---|
| Gonzalez-Rey et al. (2009) | U | U | U | U | L | L |
| Nemeth et al. (2009) | U | U | U | U | L | L |
| Bi et al. (2010) | U | U | U | U | H | L |
| Mei et al. (2010) | U | U | U | U | L | L |
| Liang et al. (2011) | U | U | U | U | U | L |
| Chang et al. (2012) | U | U | U | U | U | L |
| Krasnodembskaya et al. (2012) | U | U | U | U | U | L |
| Li et al. (2012) | U | U | U | U | U | L |
| Hall et al. (2013) | U | U | U | U | U | L |
| Zhao et al. (2013) | U | U | U | U | U | L |
| Chao et al. (2014) | U | U | U | U | U | L |
| Kim et al. (2014) | U | U | U | H | U | L |
| Luo et al. (2014) | U | U | U | U | U | L |
| Pedrazza et al. (2014) | U | U | U | U | U | L |
| Sepulveda 2014 | U | U | U | U | U | L |
| Zhao et al. (2014) | U | U | U | U | U | L |
| Zhou et al. (2014) | U | U | U | U | H | L |
| Yang et al. (2015) | U | U | U | U | U | L |
-
Legend: H = High risk of bias, L = Low risk of bias, U = Unclear risk of bias
-
Blinding of Outcome Assessment for Mortality: Low risk = Outcome assessors were blinded to the study groups when assessing mortality through surrogate endpoints or animals were allowed to die. Unclear = Insufficient information to determine if outcome assessors were blinded during assessment or if animals were allowed to die. High Risk = Outcome assessors not blinded to the study groups and death was defined according to surrogate endpoints.
-
Incomplete Outcome Data: Low risk = N values were consistent between methods and results for the mortality outcome. Unclear = N value was either not presented in the methods or in the results, and therefore there is insufficient information to permit judgement. High risk = N values were not consistent between methods and results for the mortality outcome.
-
Selective Reporting: Low risk = The methods section indicated mortality as a pre-specified outcome measure. High risk = The mortality outcome was presented in the results but not pre-specified in the methods section.
Table 3
Risk of bias assessment (other domains) of preclinical studies investigating the efficacy of mesenchymal stromal cells in models of sepsis.
| Study | Baseline characteristics* | Random housing* | Source of funding | Conflict of interest | Sample size calculation |
|---|---|---|---|---|---|
| Gonzalez-Rey et al. (2009) | U | U | H | H | U |
| Nemeth et al. (2009) | U | U | L | U | U |
| Bi et al. (2010) | U | U | L | U | U |
| Mei (2010) | U | U | H | H | U |
| Liang et al. (2011) | U | U | L | U | U |
| Chang et al. (2012) | U | U | L | L | H |
| Krasnodembskaya et al. (2012) | U | U | L | L | U |
| Li et al. (2012) | U | U | L | L | U |
| Hall et al. (2013) | U | U | L | L | U |
| Zhao et al. (2013) | U | U | L | L | U |
| Chao et al. (2014) | U | U | L | L | U |
| Kim et al. (2014) | U | U | L | L | U |
| Luo et al. (2014) | U | U | L | L | U |
| Pedrazza et al. (2014) | U | U | L | L | U |
| Sepulveda 2014 | U | U | L | L | U |
| Zhao et al. (2014) | U | U | L | L | U |
| Zhou et al. (2014) | U | U | L | L | U |
| Yang et al. (2015) | U | U | L | L | U |
-
Legend: * = Items modified from SYRCLE risk of bias tool, H = High risk of bias, L = Low risk of bias, U = Unclear risk of bias
-
Baseline Characteristics: Low risk = Baseline severity of disease equal between experimental groups, Unclear = Baseline severity of disease unreported, High risk = Baseline severity of disease unbalanced between experimental groups.
-
Random Housing: Low risk = Animal cages were randomly placed within an animal room/facility, Unclear = Housing placement unreported, High risk = Animals place in non-random arrangement in animal room/facility.
-
Other risk of bias was assessed according to source of funding, conflict of interest and pre-specified sample size calculations:
-
Source of Funding: Low risk = Non-industry source of funding (or no funding). Unclear = Funding source was not reported. High risk = Study was funded by industry.
-
Conflict of Interest: Low risk = Authors reported on no conflict of interest. Unclear = Conflict of interest was not reported. High risk = Authors reported on potential conflict of interests.
-
Sample Size Calculation: Low risk = Sample size calculations were correctly performed and followed. Unclear = Sample size calculations were not performed. High risk = Sample size calculations were incorrectly performed/followed.
Table 4
Construct validity assessment of preclinical studies investigating the efficacy of mesenchymal stromal cells in models of sepsis.
Study | Large animal model | Adult animal model | Comorbidities | Infectious model of sepsis | Therapy initiated after sepsis induction | Documented sepsis severity prior to initiating treatment | Resuscitation included antibiotics | Resuscitation included fluids |
|---|---|---|---|---|---|---|---|---|
| N | N | N | Y | Y | N | N | N | |
| N | N | N | N | Y | N | N | N | |
| N | Y | N | Y | Y | N | Y | Y | |
| N | U | N | Y | Y | N | N | N | |
| N | Y | N | Y | Y | N | N | Y | |
| N | Y | N | Y | Y | N | Y | Y | |
| N | U | N | N | Y | N | N | N | |
| N | U | N | Y | Y | N | N | N | |
| N | Y | N | Y | Y | N | N | N | |
| N | U | N | N | Y | N | N | N | |
| N | U | N | Y | Y | N | N | N | |
| N | Y | N | N | Y | N | N | N | |
| N | U | N | Y | Y | N | N | N | |
| N | Y | N | N | Y | N | N | N | |
| N | U | N | Y | Y | N | N | Y | |
| N | Y | N | Y | N | N | N | N | |
| N | Y | N | N | Y | N | N | N | |
| N | U | N | Y | Y | N | N | N | |
| N | N | Y | N | Y | N | N | N | |
| N | N | Y | N | N | N | N | N |
-
Legend: N = No, U = Unclear, Y = Yes. Letters following author and year (e.g. Mei 2010A) indicate that more than one independent experiment was conducted in the same publication.
-
Large Animal Model: Yes = Sheep, pig, dog, monkey. No = Mouse, rat
-
Adult Animal Model: Yes = Rats ≥ 6 weeks old, mice ≥ 8 weeks old. No = Rats < 6 weeks old, mice < 8 weeks old. Unclear = No age stated
-
Comorbidities: Yes = e.g. Diabetes, obesity, immunodeficiency. No = No comorbidities.
-
Infectious Model of Sepsis: Yes = Cecal-ligation and puncture, live bacterial administration. No = Bacterial product administration (e.g. lipopolysaccharide).
-
Therapy Initiated After Sepsis Induction: Yes = Mesenchymal stromal cells administered after sepsis model induced. No = Mesenchymal stromal cells administered at the time of sepsis induction.
-
Documented Sepsis Severity Prior to Initiating Treatment: Yes = Mesenchymal stromal cells administered after marker of severity (e.g. hypotension) measured. No = Mesenchymal stromal cells administered without a marker of severity being measured.
-
Resuscitation Included Fluids: Yes = Fluid therapy (aside from vehicle for cell administration) administered. No = Only vehicle for cell administration or no fluids administered.
Download links
A two-part list of links to download the article, or parts of the article, in various formats.
Downloads (link to download the article as PDF)
Open citations (links to open the citations from this article in various online reference manager services)
Cite this article (links to download the citations from this article in formats compatible with various reference manager tools)
Evaluating mesenchymal stem cell therapy for sepsis with preclinical meta-analyses prior to initiating a first-in-human trial
eLife 5:e17850.
https://doi.org/10.7554/eLife.17850


