Genome-wide identification of lineage and locus specific variation associated with pneumococcal carriage duration
- Wellcome Trust Sanger Institute, United Kingdom
- St. Mary’s Campus, Imperial College London, United Kingdom
- University College London, United Kingdom
- Mahidol University, Thailand
- University of Oxford, United Kingdom
Figures
Figure 1
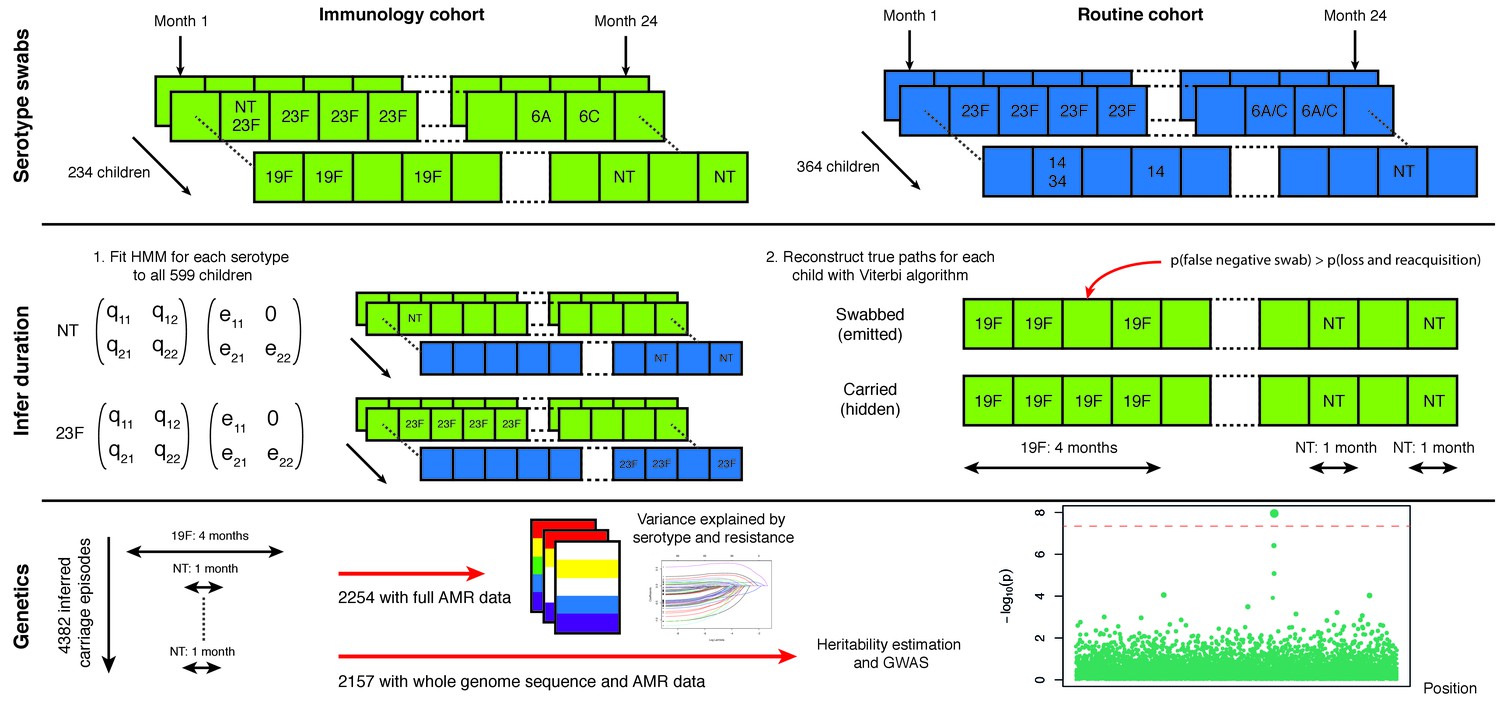
Swabbing and sequencing study design.
We start with serotype swab data on 598 children from two cohorts, taken every month after birth for two years. For all samples we fitted the transition and emission probabilities of a continuous time hidden Markov model for each serotype. Then, for each child, we used these parameters were then used to infer the most likely carriage durations. We matched carriage episodes with resistance and genomic data for 2157 episodes to draw conclusions on the basis of variation in this epidemiological parameter.
Figure 2
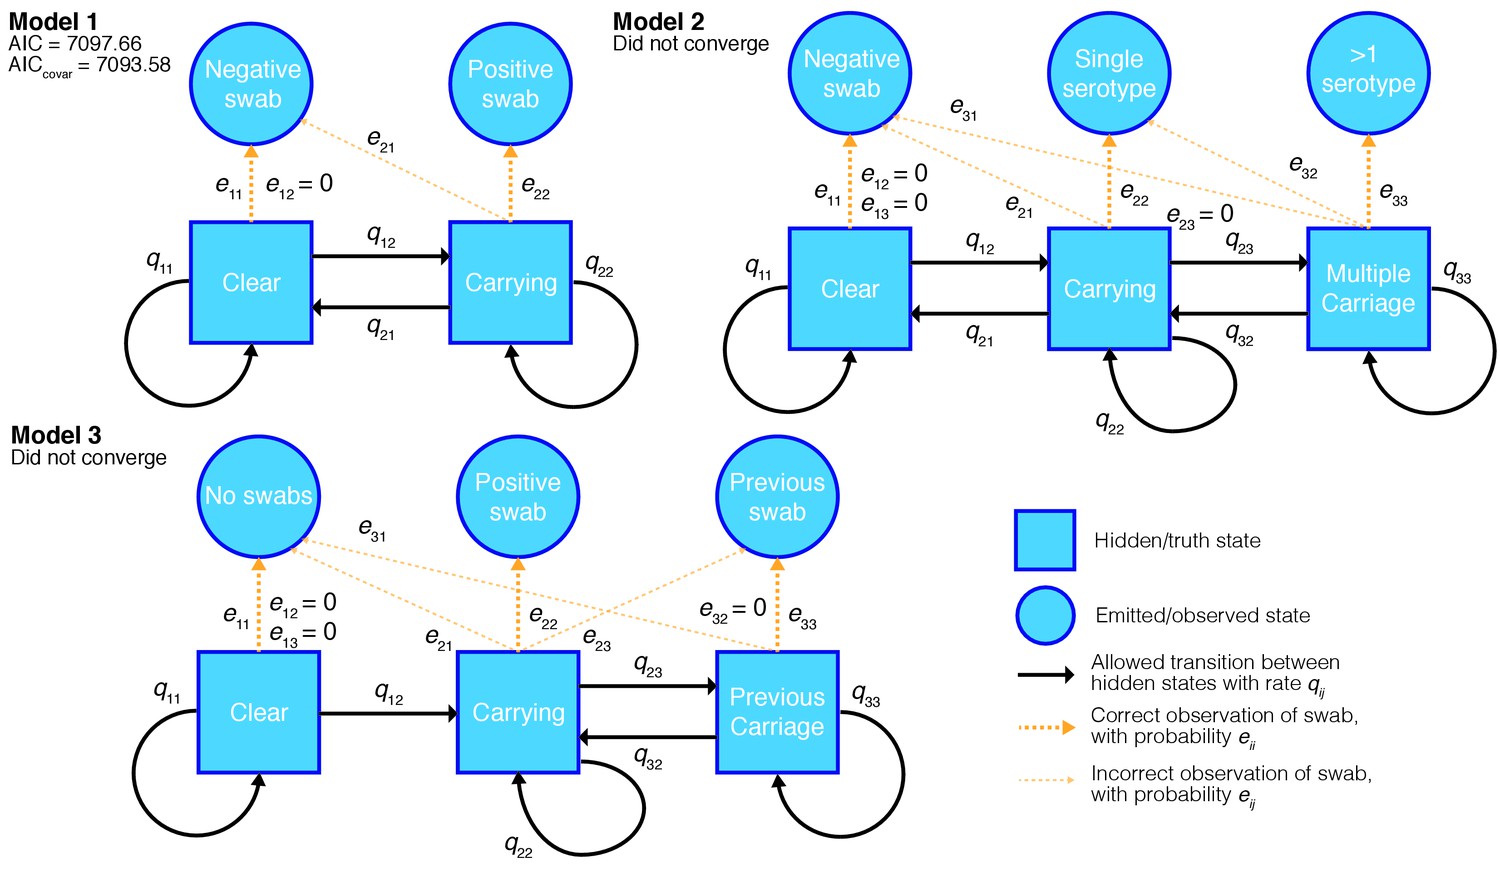
Hidden Markov models of swab time series, and their goodness-of-fit.
We fitted three different models to the processed time-series data with states, allowed transitions and emissions as shown. We refitted each model allowing the transitions probabilities to covary with the age of the child and whether the child had carried pneumococcus previously. For the converged model the Akaike information criterion (AIC) is shown for the original fit, and when including these covariates (AICcovar).
Figure 3 with 3 supplements
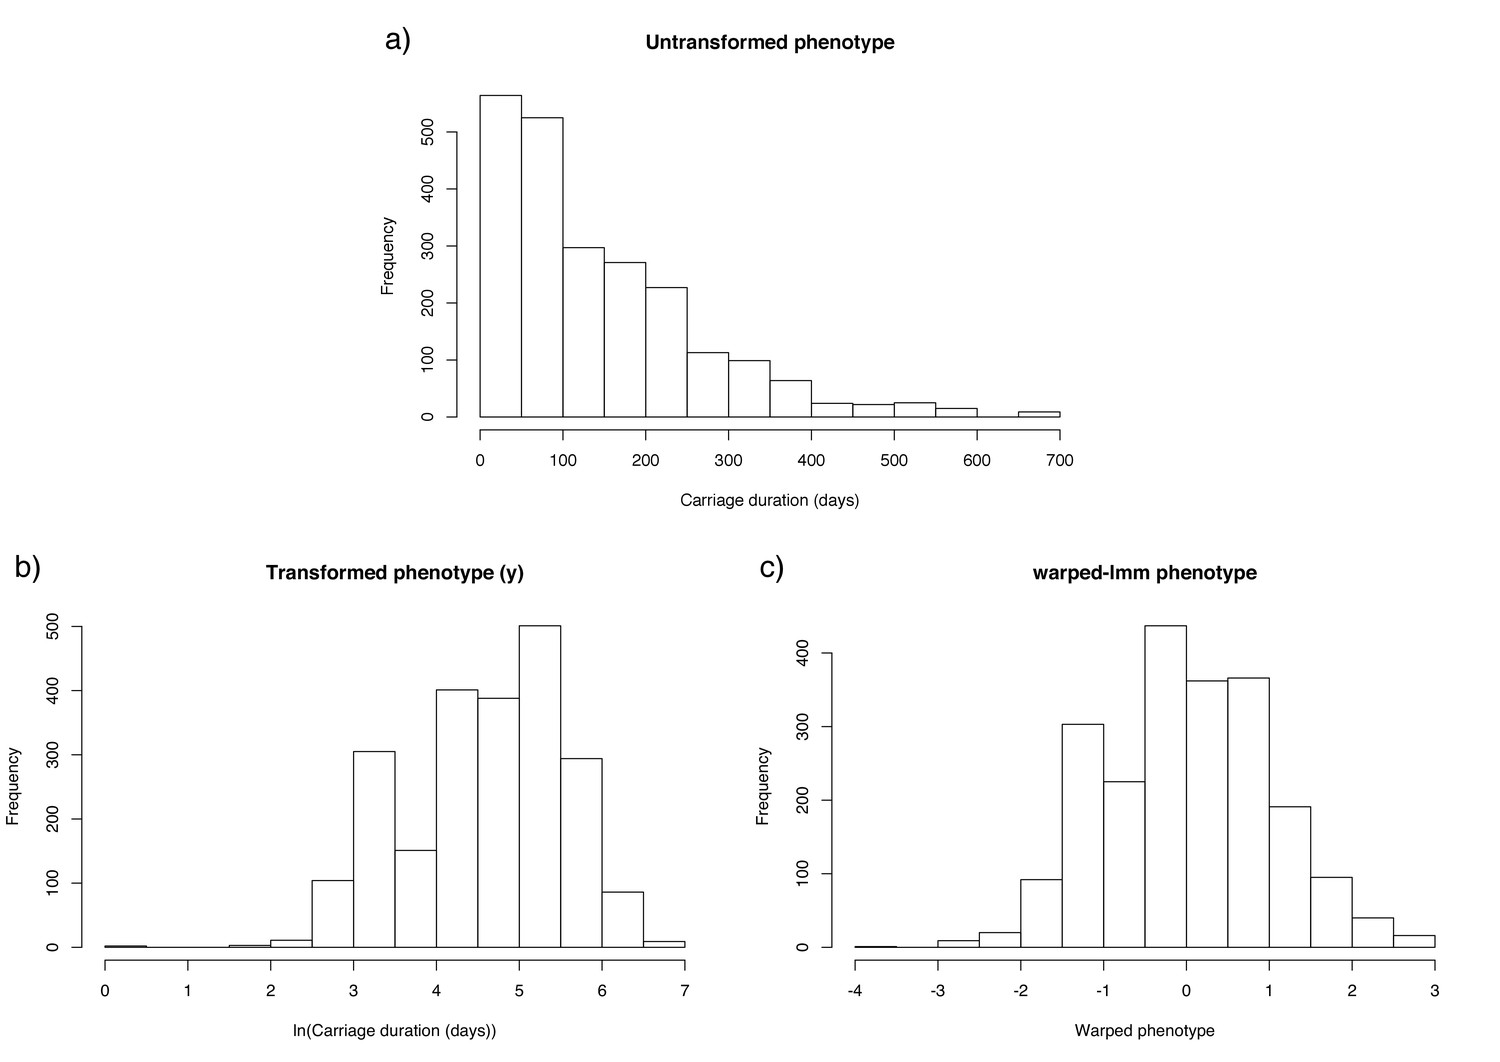
Distribution of carriage duration, and effect of monotonic transformation.
Panel (a) shows a histogram of the inferred carriage duration, (b) shows this result after the natural logarithm is taken, and (c) after the warping function is applied.
-
Figure 3—source data 1
Sequenced isolates and their untransformed inferred carriage durations.
- https://doi.org/10.7554/eLife.26255.010
-
Figure 3—source data 2
Sequenced isolates and their warped carriage durations.
- https://doi.org/10.7554/eLife.26255.011
Figure 3—figure supplement 1
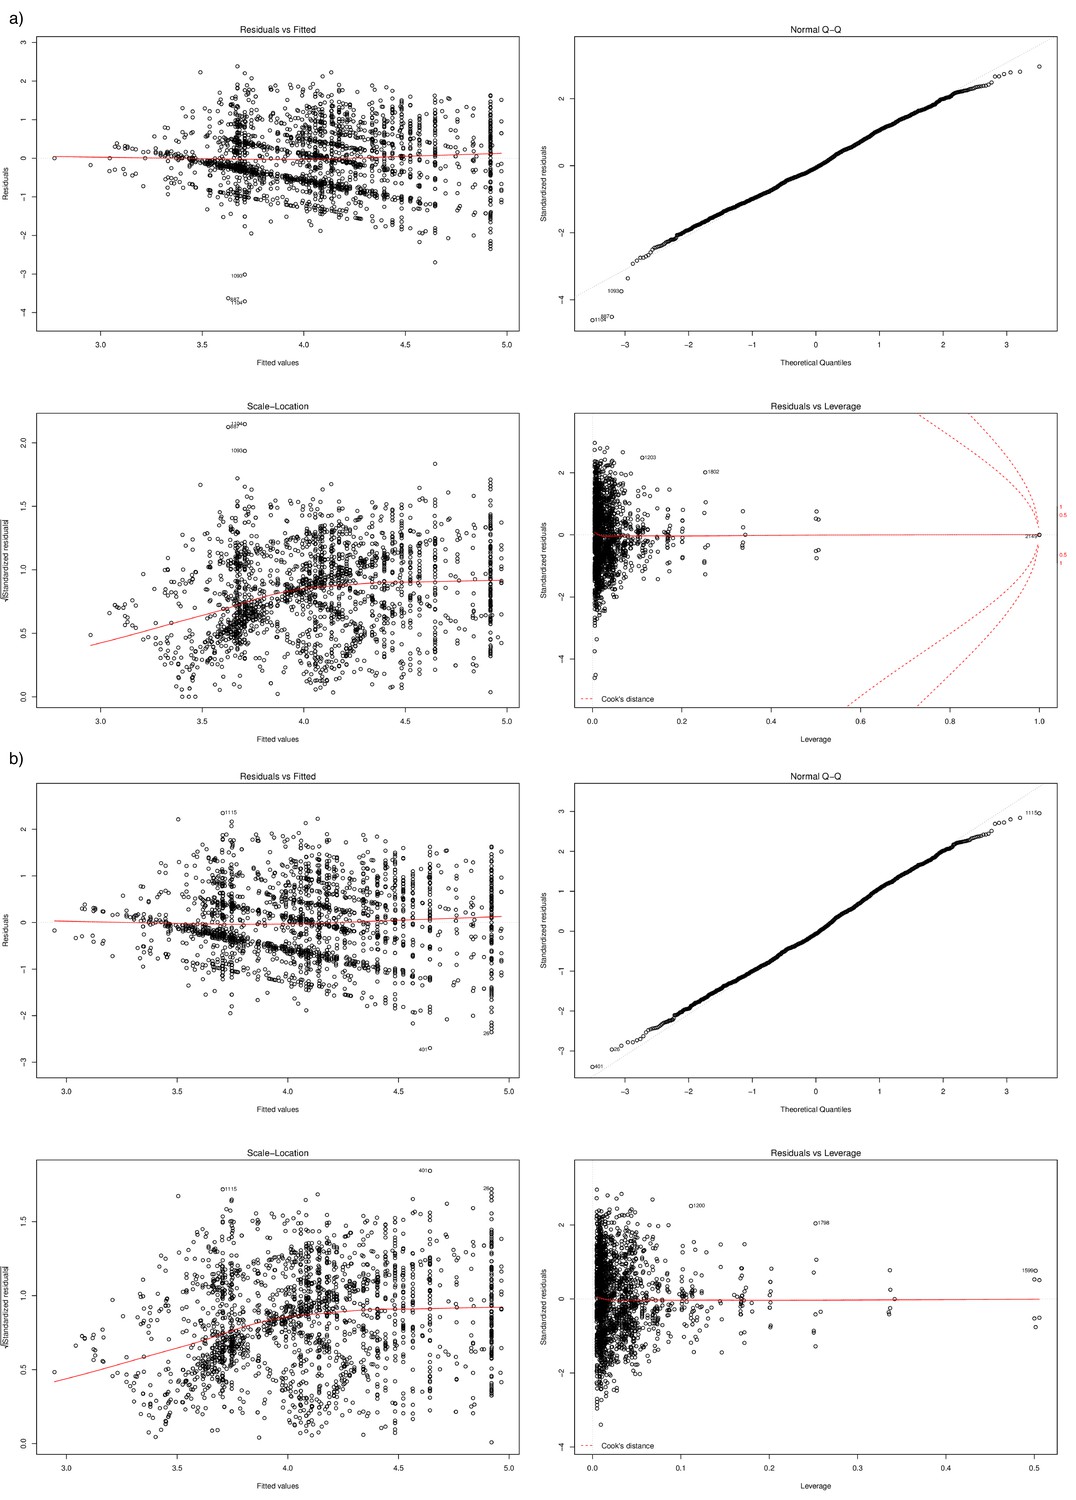
Regression diagnostics and outlier removal.
Panel (a) shows prior to outlier removal, (b) after outlier removal as produced by plot.lm() in R. Points deviating from normal residuals (top right plot), and at high leverage (bottom right plot) were removed. These observations appeared to be due to swabs not taken at the prescribed monthly intervals.
Figure 3—figure supplement 2
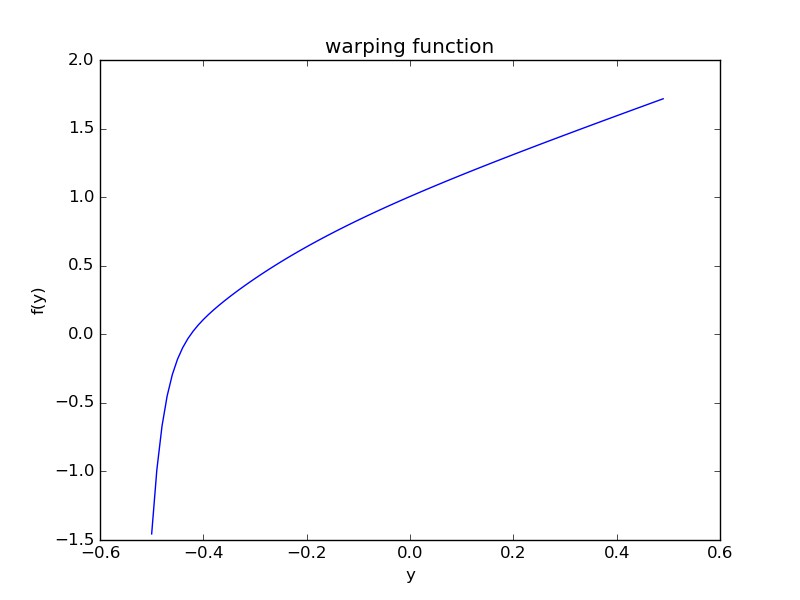
Monotonic warping function from warped-lmm. x-axis shows the centred and normalised input phenotype; y-axis shows corresponding warped value.
https://doi.org/10.7554/eLife.26255.008
Figure 3—figure supplement 3
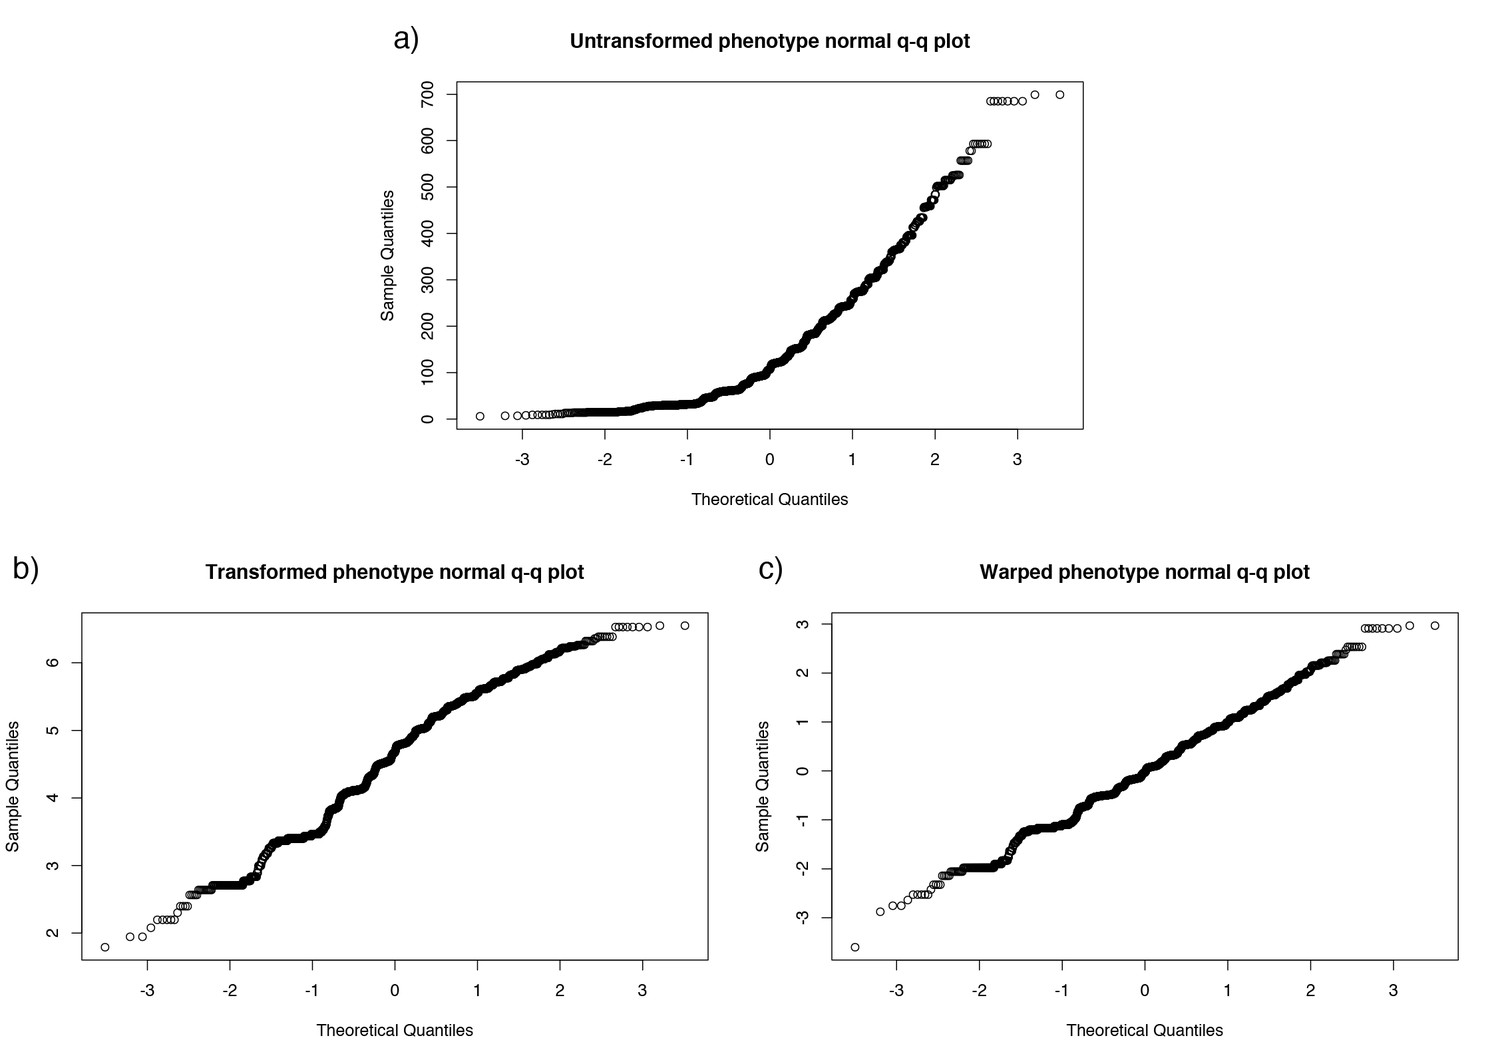
Normal quantile-quantile plot of carriage length, and effect of monotonic transformation.
Panel (a) the inferred carriage duration, (b) after the natural logarithm is taken, and (c) after the warping function is applied.
Figure 4 with 4 supplements
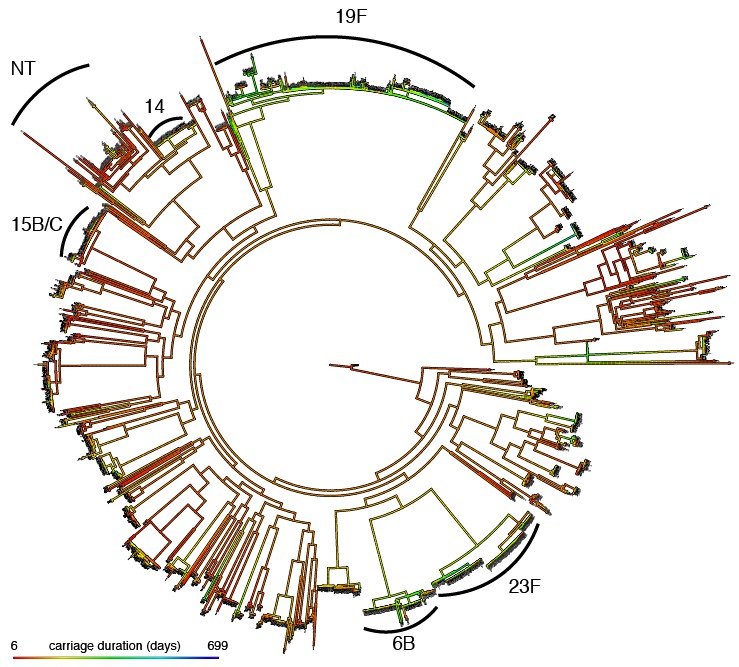
Mapping of carriage duration onto phylogeny.
Using the carriage duration as a continuous trait, the ancestral state at every node of the rooted phylogeny was reconstructed. Red branches are carriage for a short time, blue for a long time. Clusters identified in previous analysis have been labelled.
-
Figure 4—source data 1
Phylogenetic tree in Newick format.
- https://doi.org/10.7554/eLife.26255.017
Figure 4—figure supplement 1
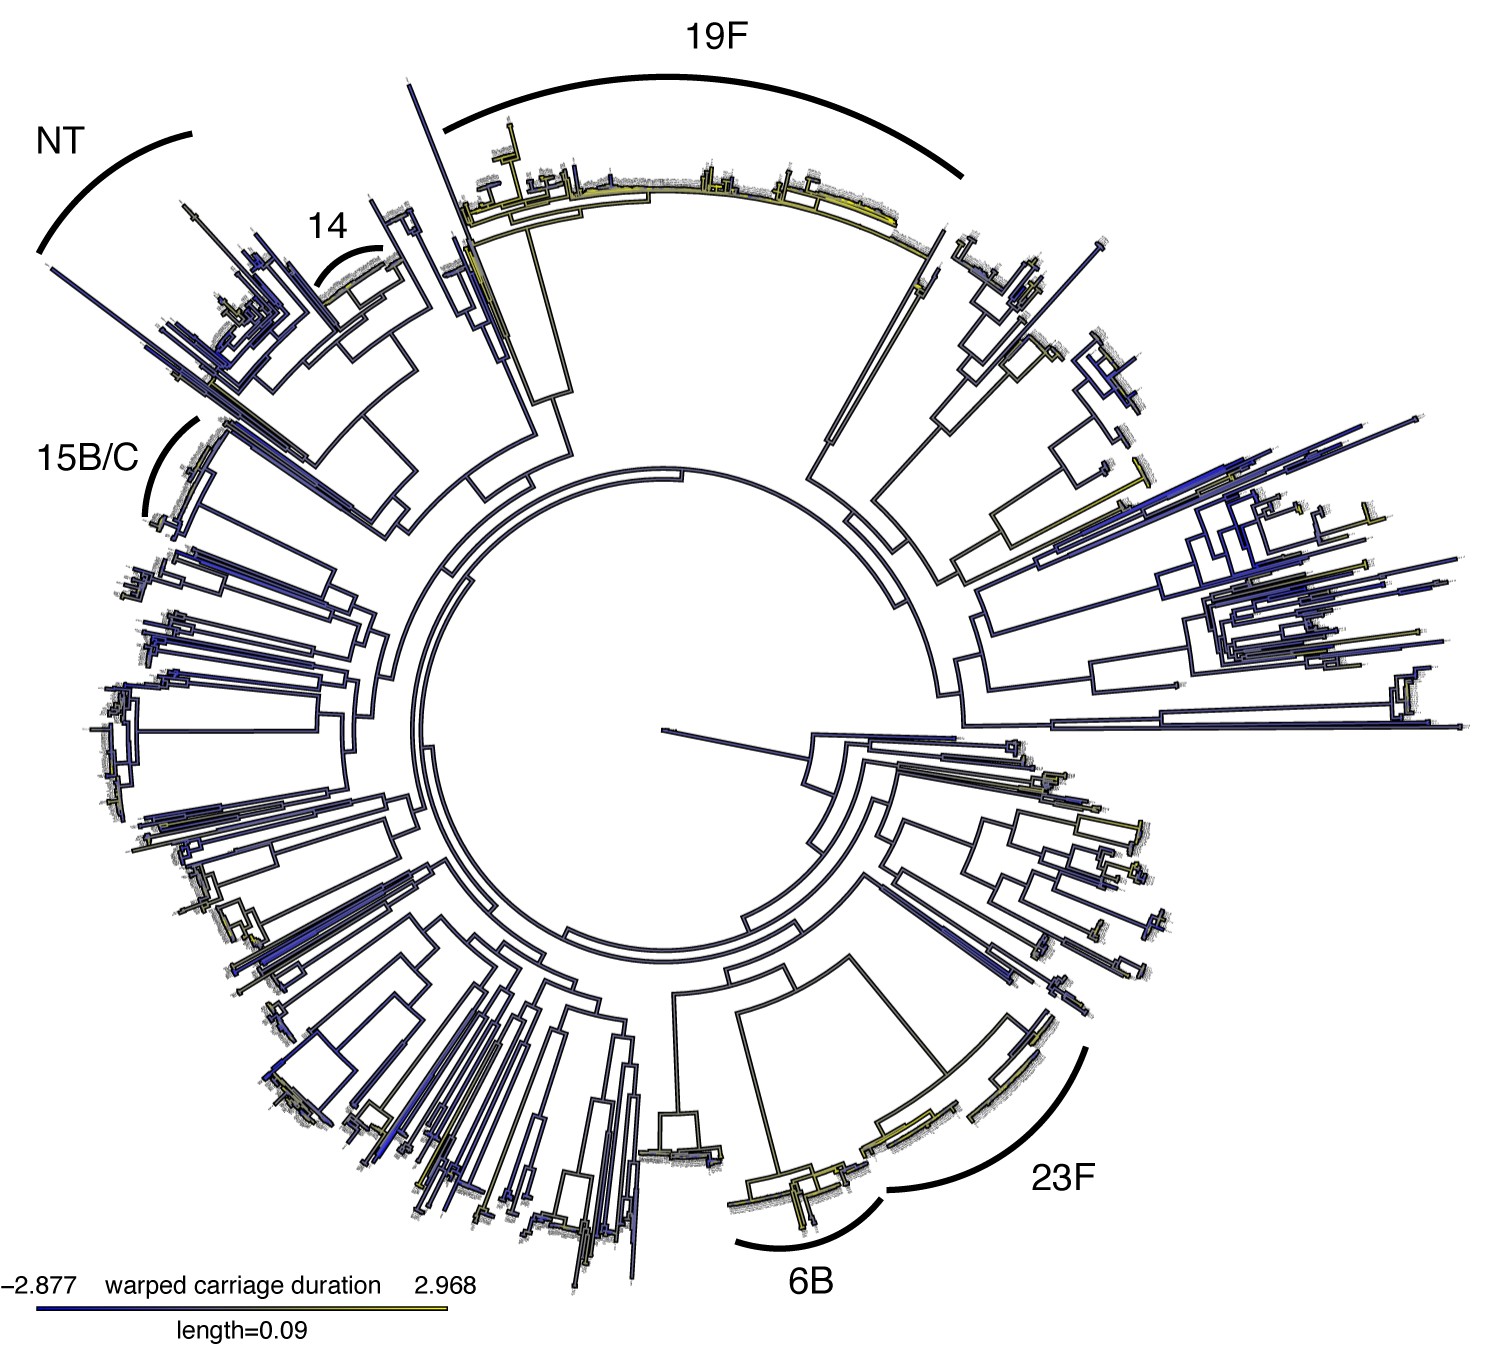
Mapping of warped carriage duration onto phylogeny.
As Figure 4, but using the warped carriage duration. Blue branches are carriage for a short time, yellow for a long time.
Figure 4—figure supplement 2
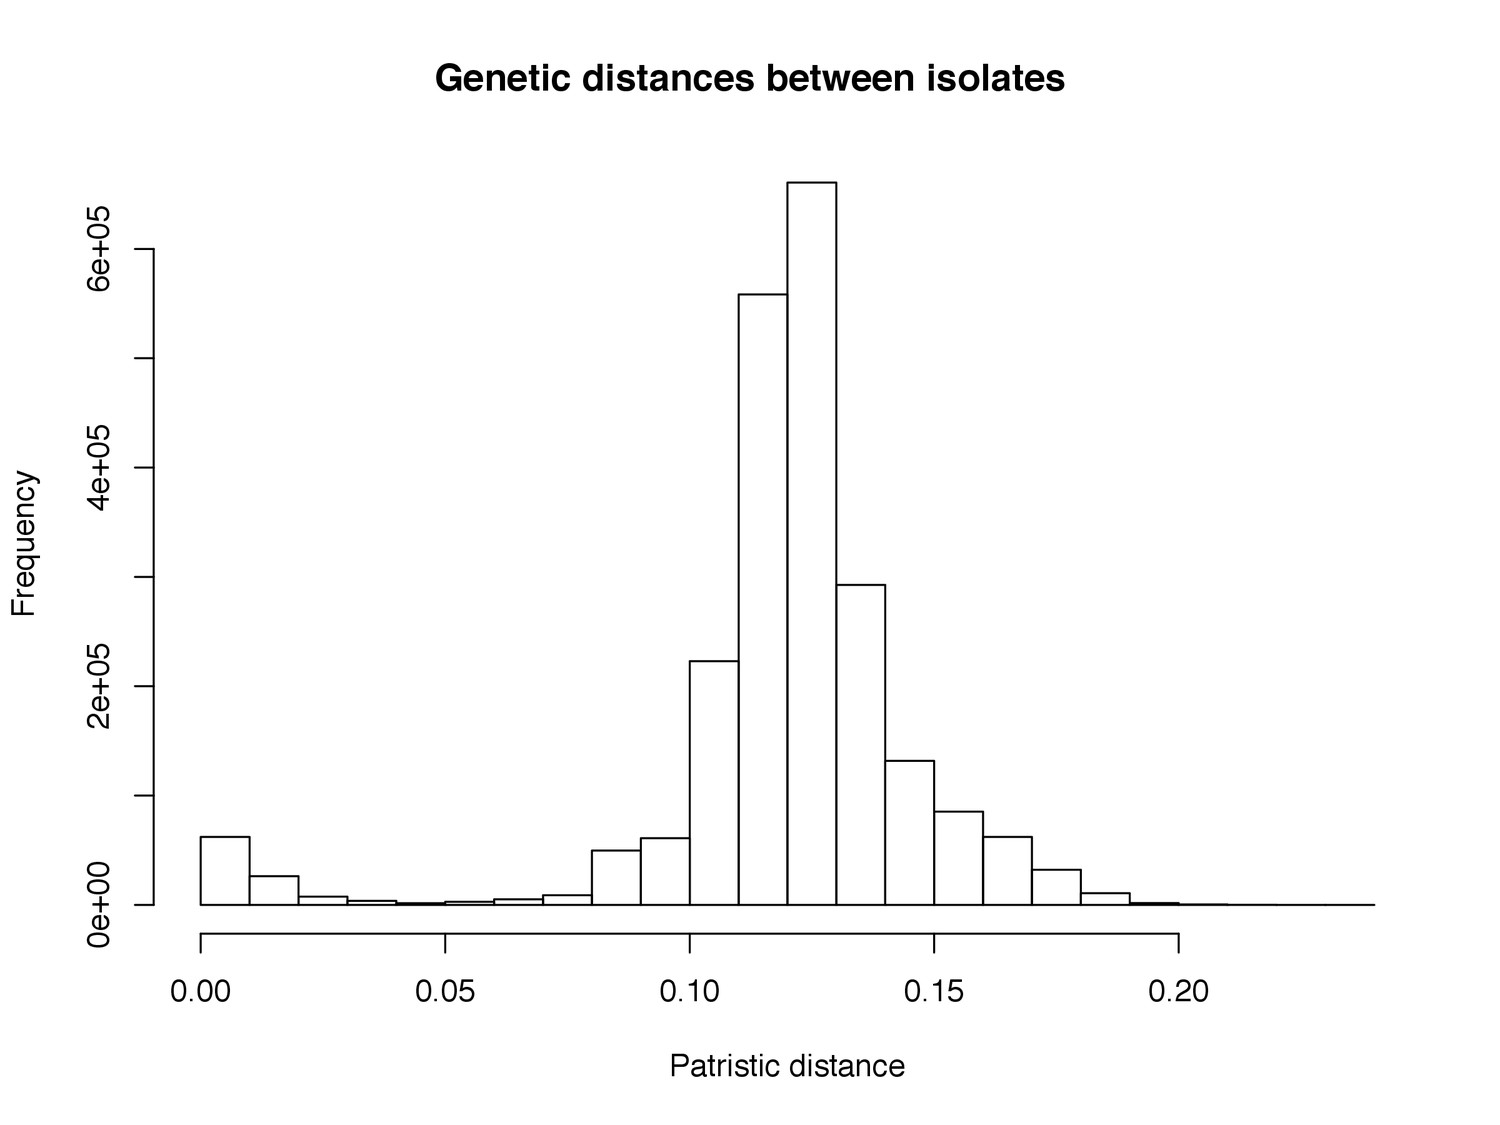
Histogram of pairwise patristic distances on the inferred phylogeny.
A cut-off for heritability estimation was chosen at 0.04, under which a clear second maxima corresponds to closely related isolates on the tree.
Figure 4—figure supplement 3
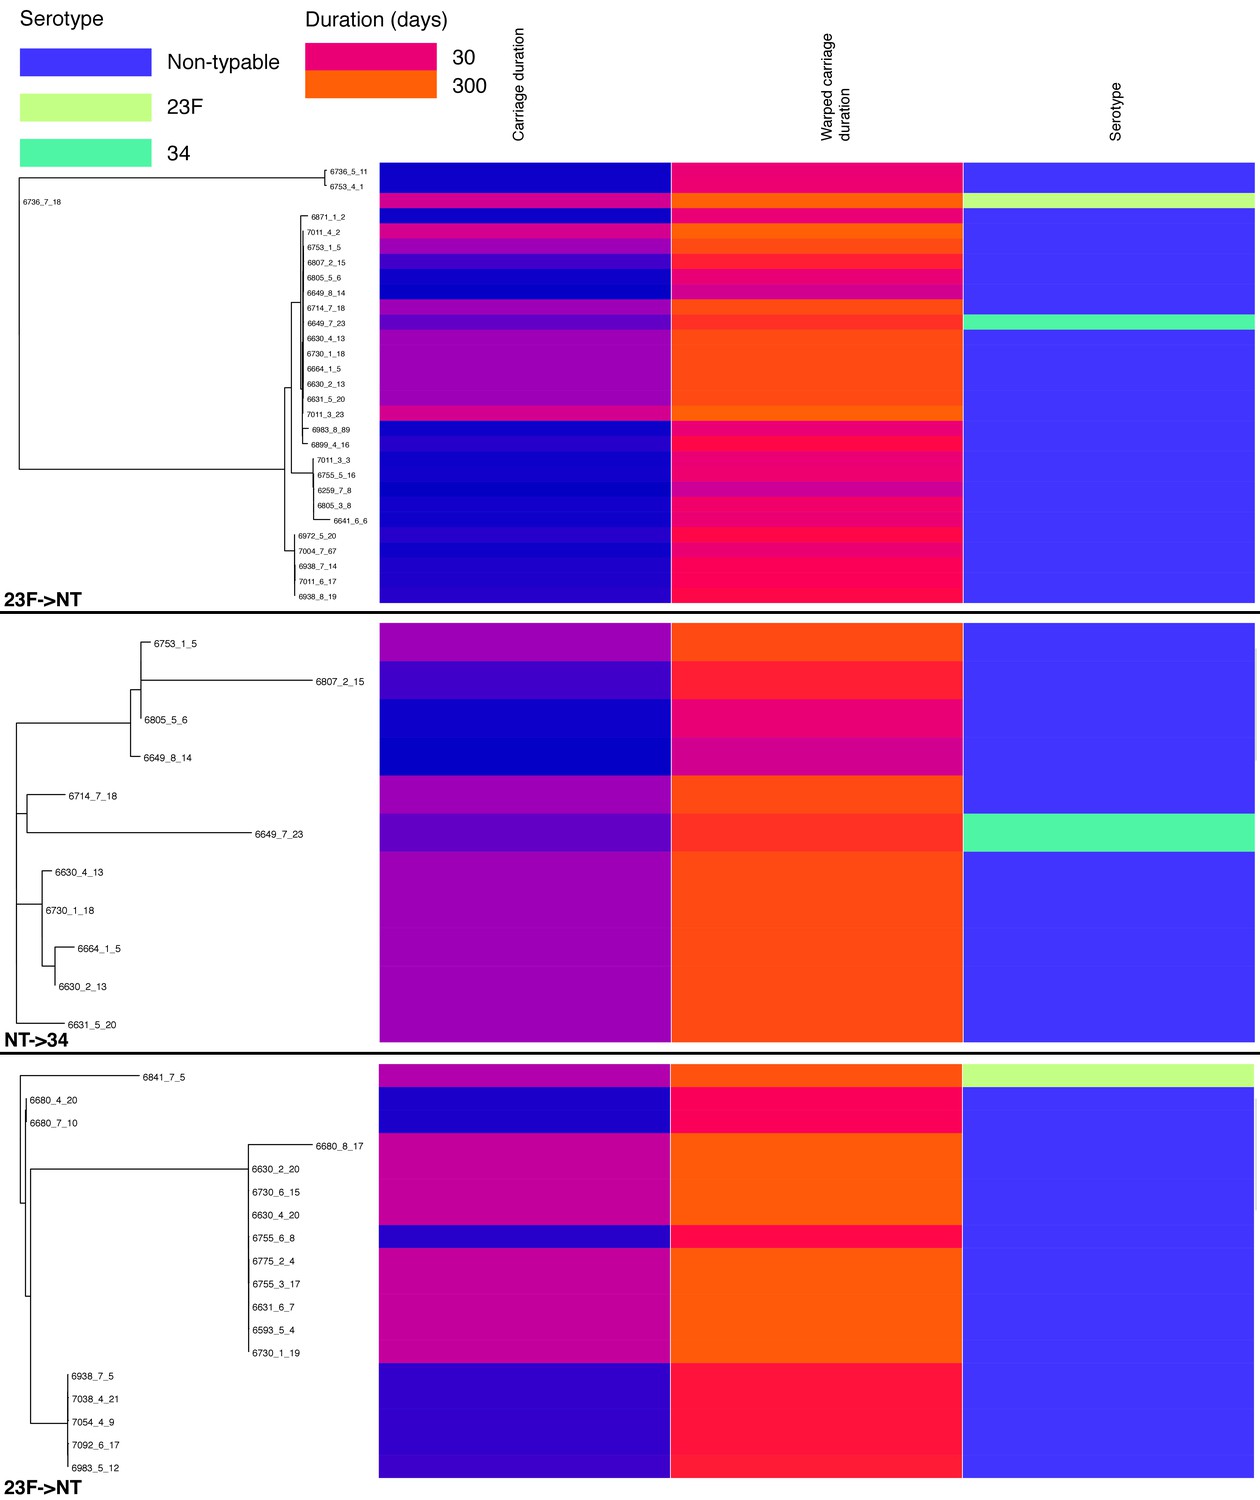
Change in carriage duration associated with capsule switching events.
For each of the three events analysed the subtree containing the switch is shown on the left. For each isolate within the subtree, carriage duration (on a roughly exponential scale), warped carriage duration (on a roughly linear scale) and serotype are shown as coloured bars aligned with the tip.
Figure 4—figure supplement 4
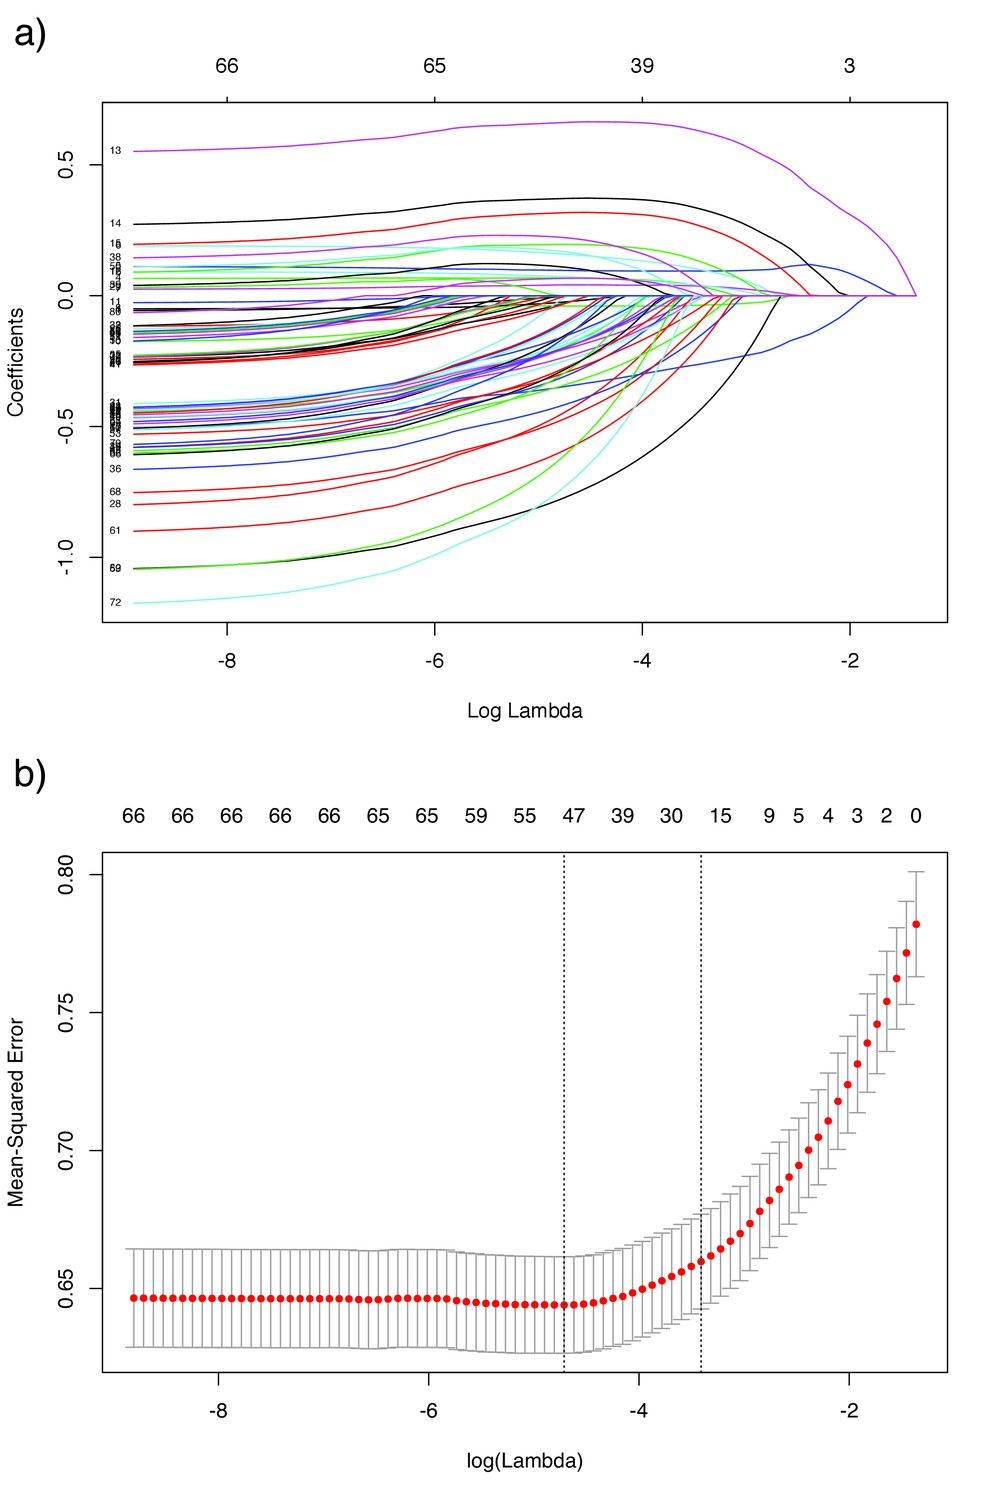
Lasso regression plots for lineage effects.
Panel a) shows the value of each predictor on the y-axis for different values of the penalty on the x-axis, which increases from left to right. The labels along the top are the number of predictors remaining in the model for each . Panel b) shows the results of leave-one-out cross validation on the mean-squared error, along the same x-scale. The at minimum error is shown by the left dashed line, and the within one standard error is shown by the right dashed line.
Figure 5 with 5 supplements

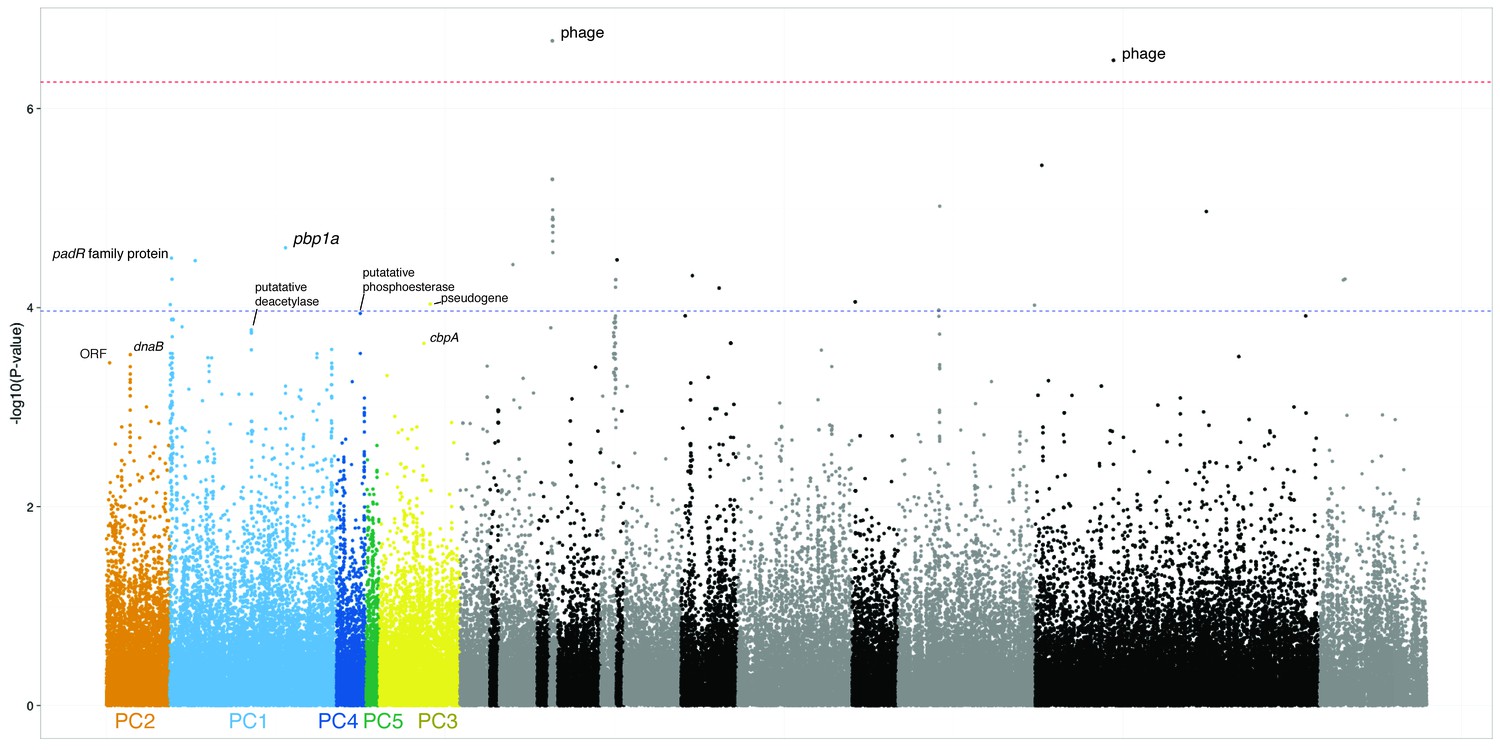
Manhattan plot of SNPs associated with carriage duration.
The significance of each SNP’s association with carriage duration against its position in the ATCC 700669 genome is shown. The red line denotes genome-wide significance ( Bonferroni corrected with 92487 unique tests), and the blue line suggestive significance (2.3 orders of magnitude below significant, following convention). Loci reaching suggestive significance are labelled with their nearest annotation, as in Table 4.
-
Figure 5—source data 1
Plot file for Manhattan plot, with coordinates and -log10 transformed p-values of all tested SNPs.
- https://doi.org/10.7554/eLife.26255.026
Figure 5—figure supplement 1
Possible SNPs associated with lineage and carriage duration.
The SNPs and p-values as shown in Figure 5, however the x-axis is now ordered by strength of association of lineage (defined by principal component) with carriage duration. The left most lineages are those most associated, those in black/grey were not significantly associated. SNPs are coloured by the lineage they are most associated with.
Figure 5—figure supplement 2
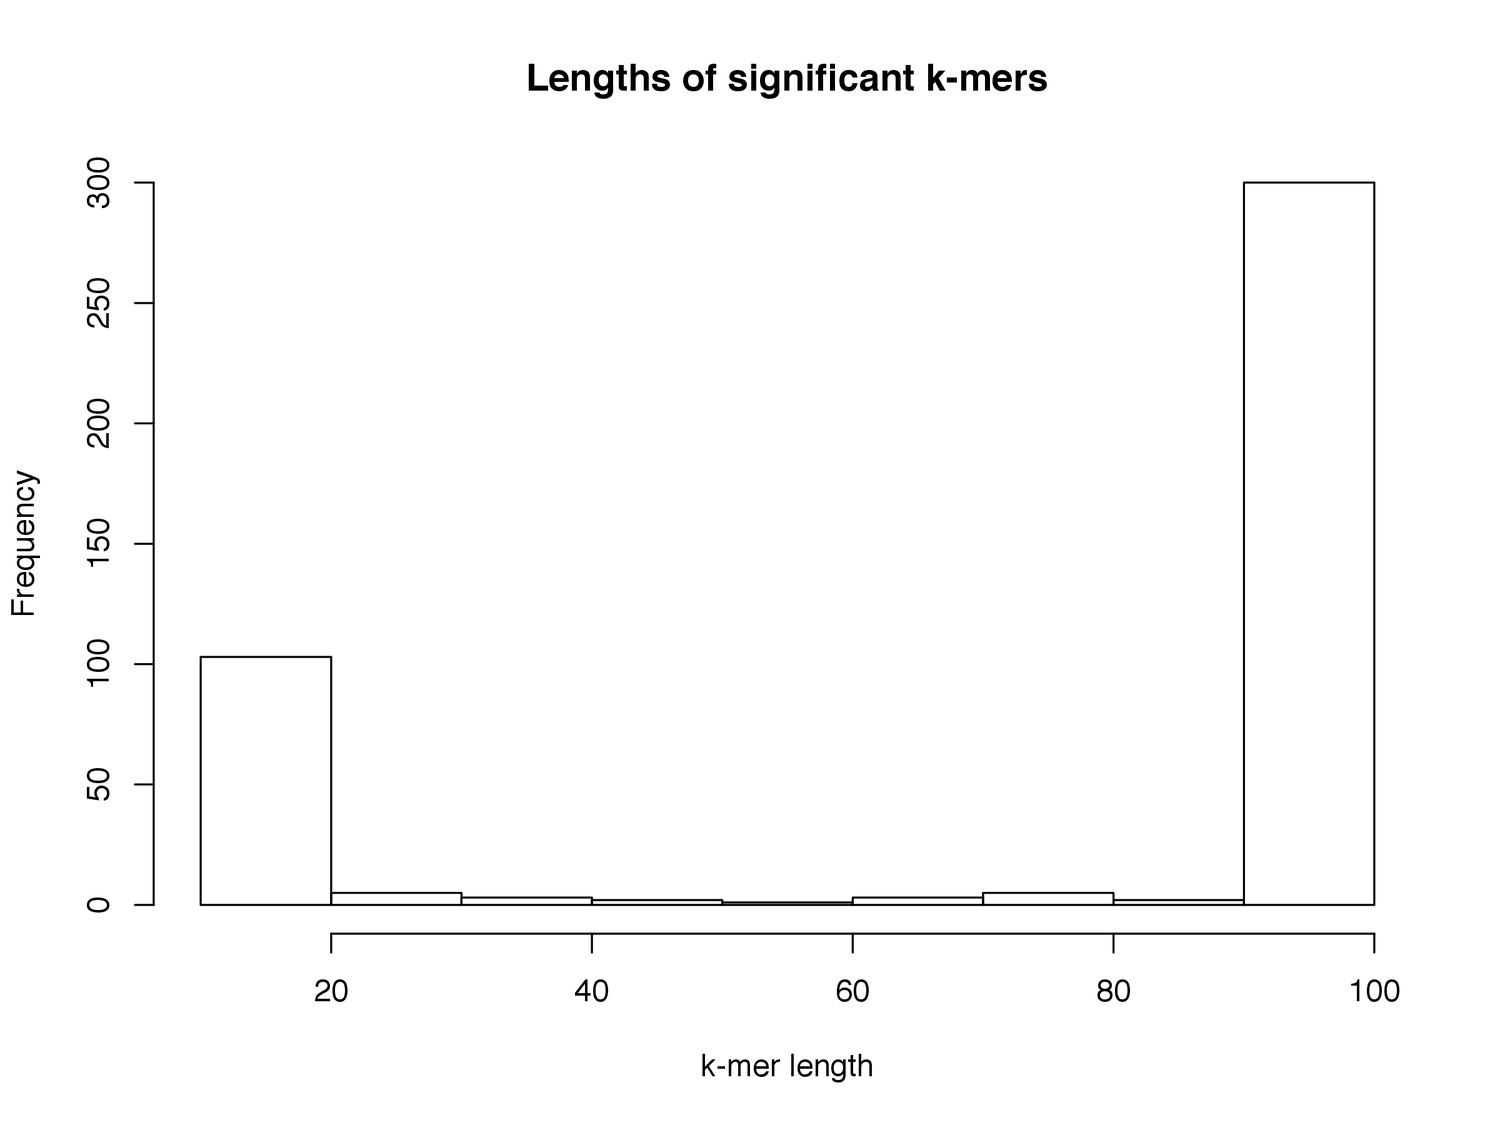
Distribution of lengths of significant k-mers.
The lengths of those k-mers reaching significance in the LMM analysis. Lengths below 20 bases were filtered from downstream analysis, due to having low specificity.
Figure 5—figure supplement 3
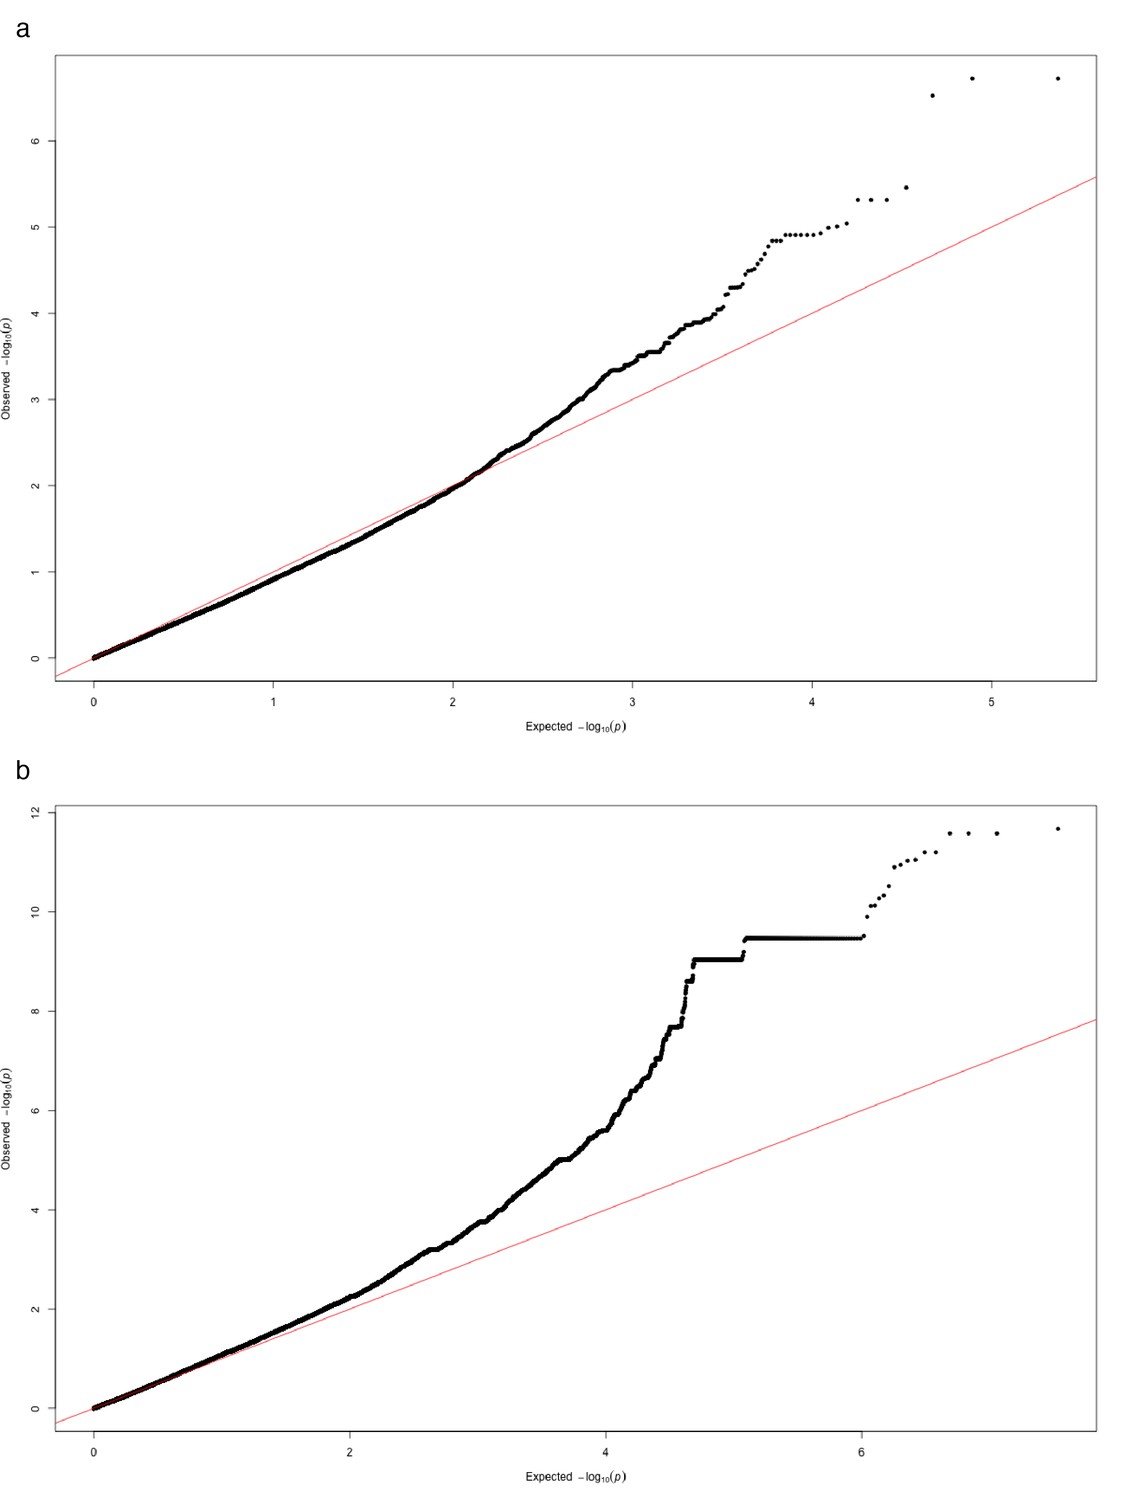
Quantile-quantile plot of association p-values.
For fast-lmm results on (a) SNPs passing quality filters and (b) k-mers of all lengths passing quality filters.
Figure 5—figure supplement 4
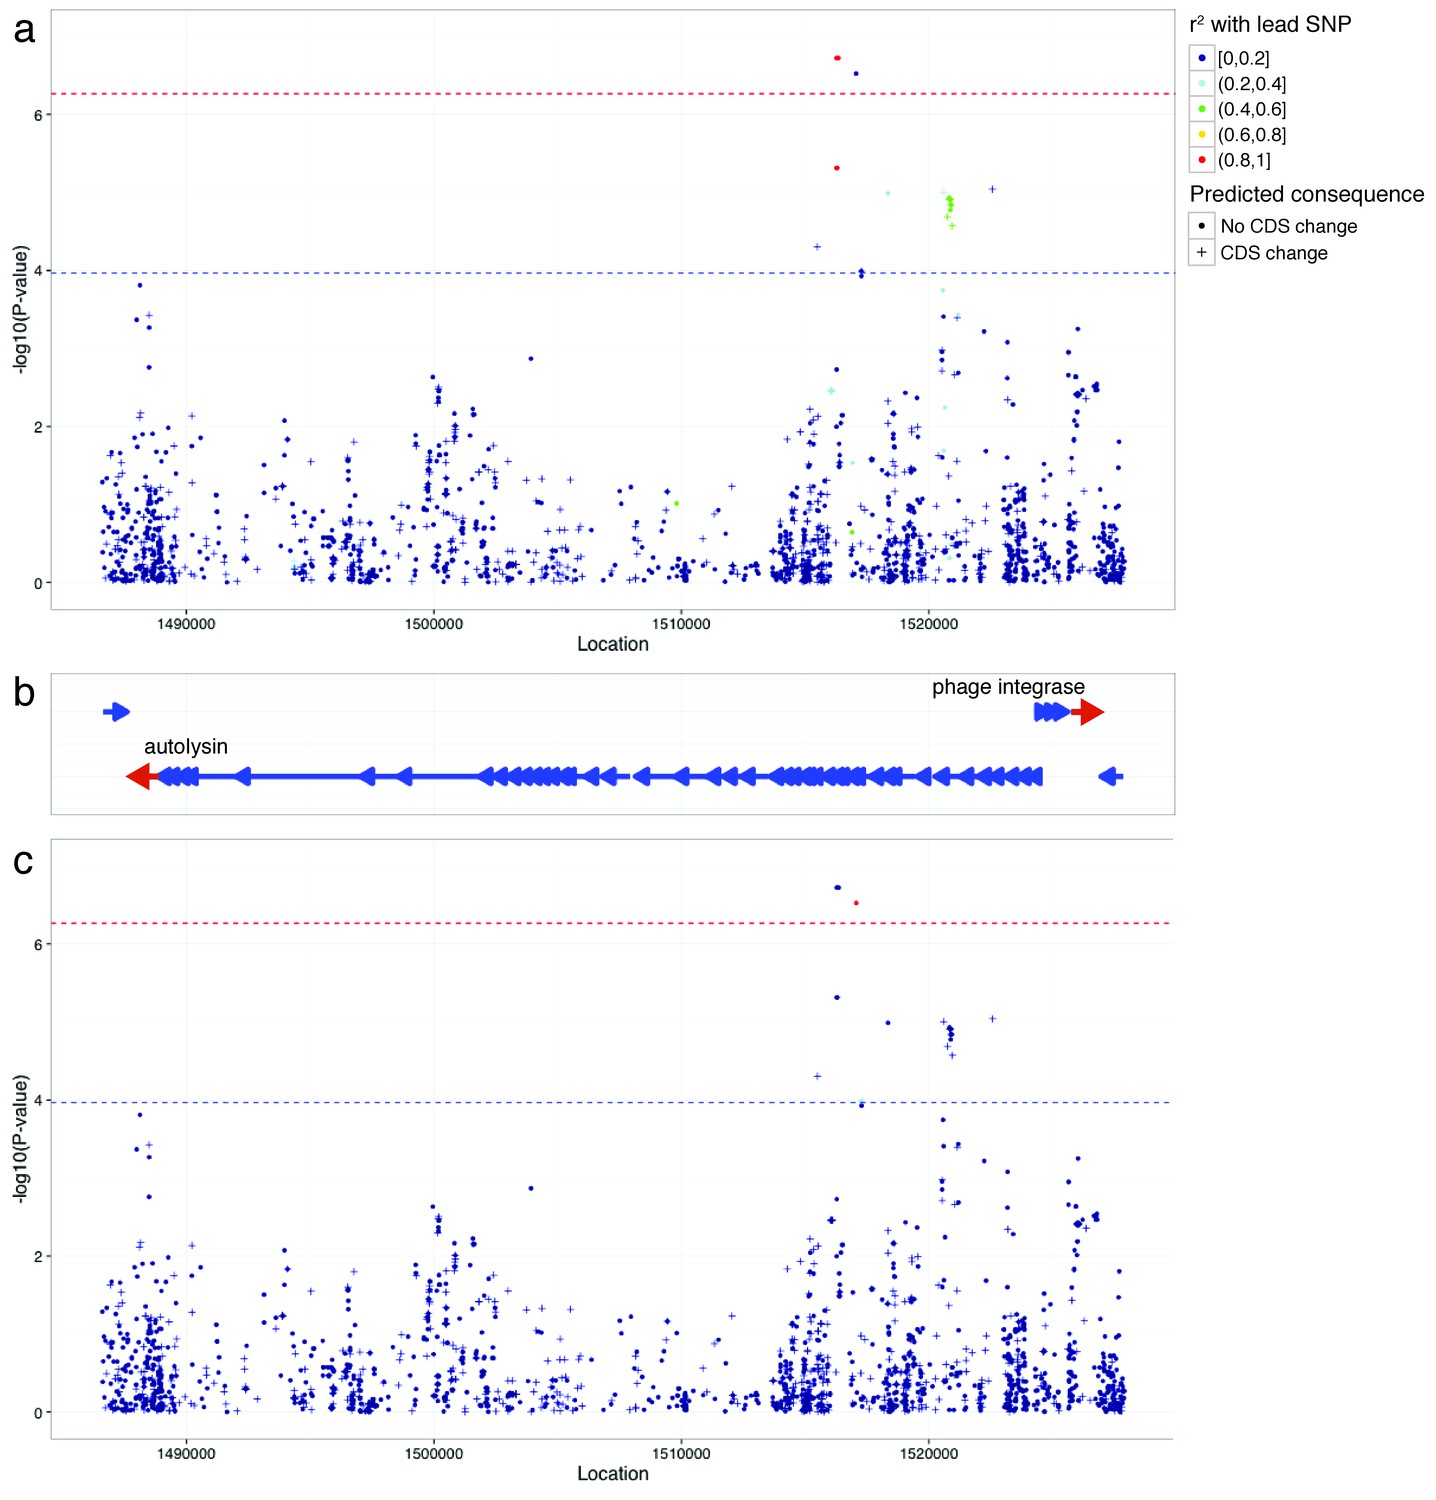
Manhattan plots of phage-associated SNPs associated with carriage duration.
As in Figure 5, but enlarging the phage region found to be significant. SNPs are coloured by their LD with the lead SNP (the highest P-value in the region plotted), and are crosses if they are predicted to cause a change in coding sequence. Panel (a) shows LD in relation to the lead SNP at position 1516350. Panel (b) plots genes in the region, with the start and end of the phage genes labelled. Panel (c) shows LD in relation to the second SNP signal at position 1517063.
Figure 5—figure supplement 5
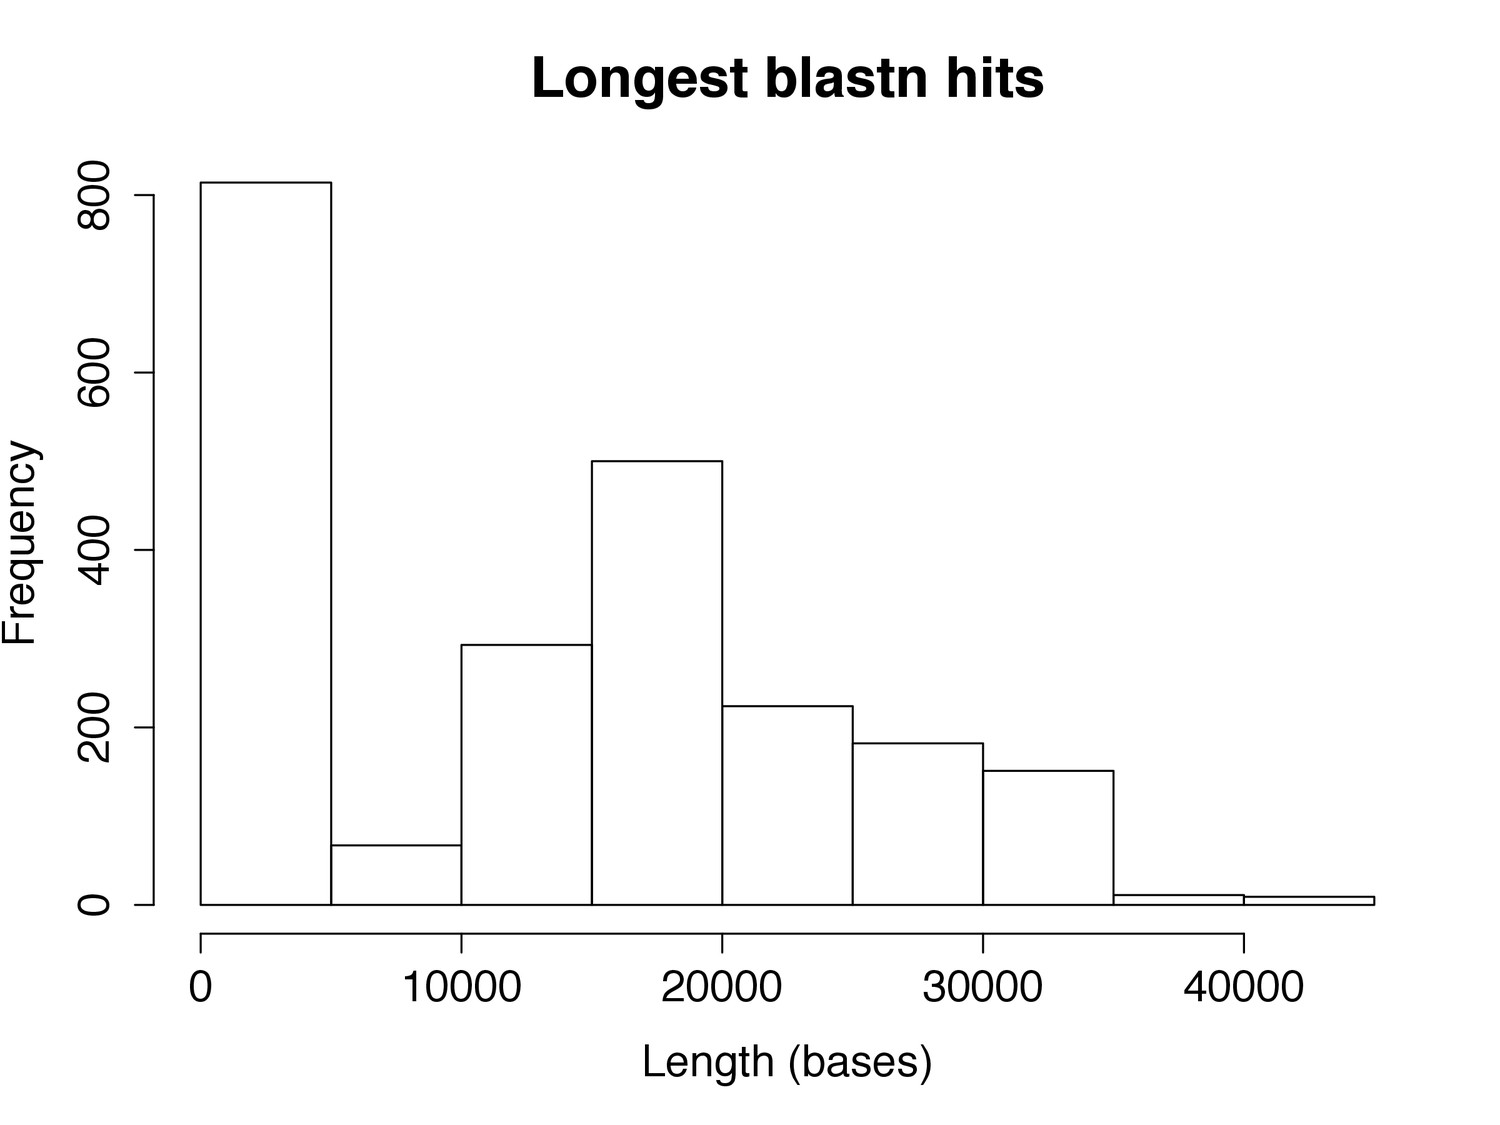
Identification of phage in assemblies by blastn hit length.
Histogram of the length of top hits against a database of phage sequence by blastn. Isolates with >5000 bp hits were defined as having phage present.
Figure 6
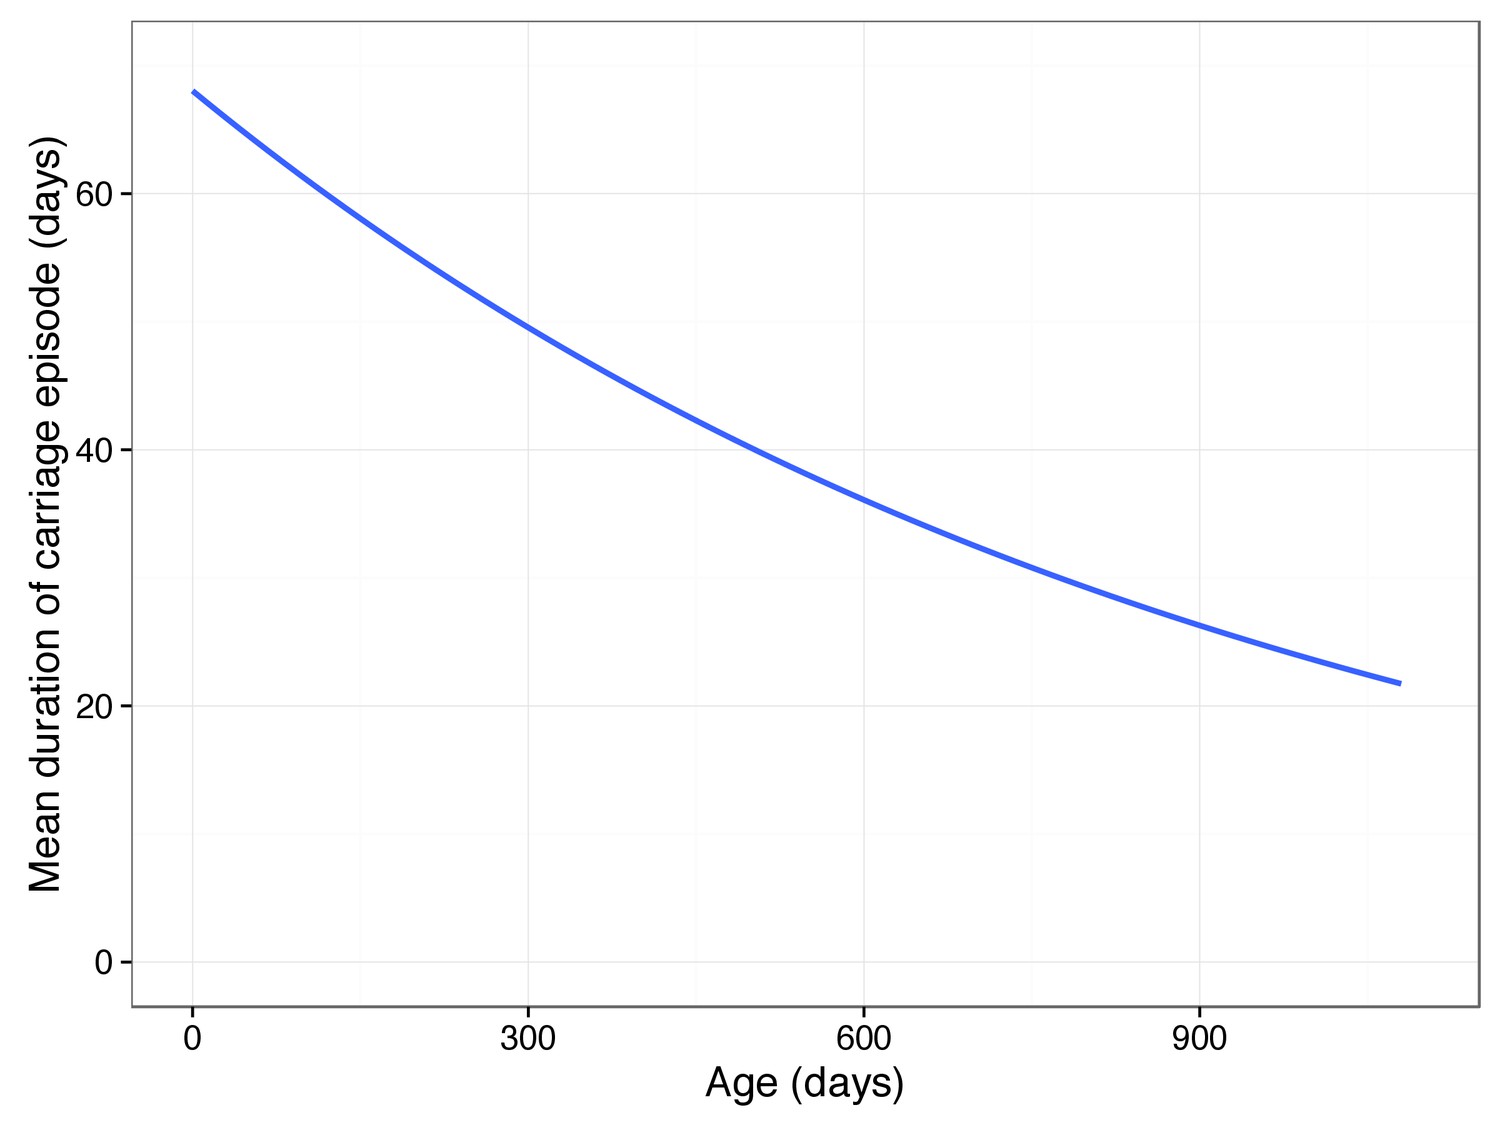
Predicted mean carriage duration as a function of child age.
Fit is an exponential decay over the first two years of life, using the decay rate inferred from a linear regression of log(carriage duration).
Tables
Table 1
Success of culturing unencapsulated S. pneumoniae.
Based on having >1% abundance of 16S reads showing the bacteria as being present, 44/361 true positive swabs were not successfully cultured.
| Abundance | Culture positive | Number |
|---|---|---|
| >1% | Cultured | 361 |
| >1% | Not cultured | 44 |
| <1% | Cultured | 56 |
| <1% | Not cultured | 54 |
Table 2
Coefficients from lasso regression model of carriage duration.
The mean (intercept) corresponds to a sensitive 6A/C carriage episode, and different serotypes and resistances are perturbations about this mean. Positive effects are expected to have a greater magnitude, due to the positive skew of carriage duration. Rows in bold were significant predictors in the covariance test.
| Factor | Effect on carriage duration (days) |
|---|---|
| Mean (intercept) | 59.5 |
| Erythromycin resistance | +7.5 |
| Tetracycline resistance | +3.0 |
| Trimethoprim resistance | +2.9 |
| Clindamycin resistance | +1.8 |
| Penicillin intermediate resistance | +1.3 |
| Serotype 19F | +46.9 |
| Serotype 23F | +21.0 |
| Serotype 6B | +16.2 |
| Serotype 14 | +7.2 |
| Serotype 21 | +1.6 |
| Serotype 19B | −0.1 |
| Serotype 18C | −1.9 |
| Serotype 29 | −4.3 |
| Serotype 3 | −4.5 |
| Serotype 4 | −7.2 |
| Serotype 24F | −8.5 |
| Non-typable (NT) | −12.3 |
| Serotype 5 | −18.6 |
Table 3
Mean length of carriage, and expected number of carriage episodes within the first two years of life.
Only serotypes with enough data for the HMM fit to converge are shown. Starred observations have a standard error which is larger than the estimated value, indicating low confidence in the estimate.
| Serotype | Sojourn time (days) | Expected number of infections |
|---|---|---|
| 19F | 292* | 0.85 |
| 23F | 112 | 0.83 |
| 6A/C | 76.4 | 0.88 |
| 6B | 114 | 0.75 |
| 14 | 137* | 0.58 |
| NT | 40.6 | 2.05 |
Table 4
SNP Locus effects at genome-wide and suggestive significance.
Co-ordinates are with respect to the ATCC 700669 reference genome, and are for the lead SNP in each locus after LD-pruning. Effect sizes are for the warped phenotype.
| Co-ordinate | Nearest annotation | Effect size | P-value | Significance level |
|---|---|---|---|---|
| 6753 | trcF | −0.12 | Suggestive | |
| 254312 | pepS | −0.11 | Suggestive | |
| 303239 | IS630-Spn1 transposase | 0.078 | Suggestive | |
| 333632 | pbp1a | 0.079 | Suggestive | |
| 971849 | SPRITE repeat region | 0.078 | Suggestive | |
| 1013978 | IS630-Spn1 transposase | 0.11 | Suggestive | |
| 1073185 | FM211187.3435 (pseudogene) | 0.086 | Suggestive | |
| 1308604 | aroA | −0.27 | Suggestive | |
| 1472933 | Upstream of fms | −0.23 | Suggestive | |
| 1473700 | putative glutathione S-transferase | −0.16 | Suggestive | |
| 1515497 | hypothetical phage protein | −0.099 | Suggestive | |
| 1516293 | putative phage Holliday junction resolvase | −0.10 | Suggestive | |
| 1516350 | putative phage Holliday junction resolvase | −0.12 | Genome-wide significant | |
| 1517063 | phage protein | −0.11 | Genome-wide significant | |
| 1613197 | pbp2b | −0.21 | Suggestive | |
| 1813192 | thioesterase superfamily protein | −0.12 | Suggestive |
-
Table 4–source data 1
Association results for SNPs, from fast-lmm.
- https://doi.org/10.7554/eLife.26255.028
Table 5
Summary of variance of carriage duration explained by genetic and environmental factors.
encompasses all rows, other than the measured environmental effects. For each variant component the method used to estimate it is reported: CPP - closest phylogenetic pairs; LMM - variance component using a linear mixed model with pathogen genotype as random effects; - linear regression using lasso to select predictors.
| Source | Of which is | Total variance explained | Proportion of total heritability explained |
|---|---|---|---|
| Total heritability () | 0.634 (CPP) | 1.00 | |
| Common SNP heritability () | 0.438 (LMM) | 0.691 | |
| Serotype and resistance | 0.190 ()/0.253 (LMM) | 0.300 ()/0.399 (LMM) | |
| Serotype only | 0.178 ()/0.135 (LMM) | 0.281 ()/0.213 (LMM) | |
| Resistance only | 0.092 ()/0.113 (LMM) | 0.145 ()/0.178 (LMM) | |
| Phage k-mers | 0.067 (LMM) | 0.106 | |
| Intact comYC | 0.127 (LMM) | 0.201 | |
| Measured environmental effects | Age and previous carriage | 0.046 () | - |
Download links
A two-part list of links to download the article, or parts of the article, in various formats.
Downloads (link to download the article as PDF)
Open citations (links to open the citations from this article in various online reference manager services)
Cite this article (links to download the citations from this article in formats compatible with various reference manager tools)
Genome-wide identification of lineage and locus specific variation associated with pneumococcal carriage duration
eLife 6:e26255.
https://doi.org/10.7554/eLife.26255


