Context-dependent deposition and regulation of mRNAs in P-bodies
- University of Basel, Switzerland
- ETH Zürich, Switzerland
- Swiss Institute of Bioinformatics, Switzerland
Figures
Figure 1 with 2 supplements
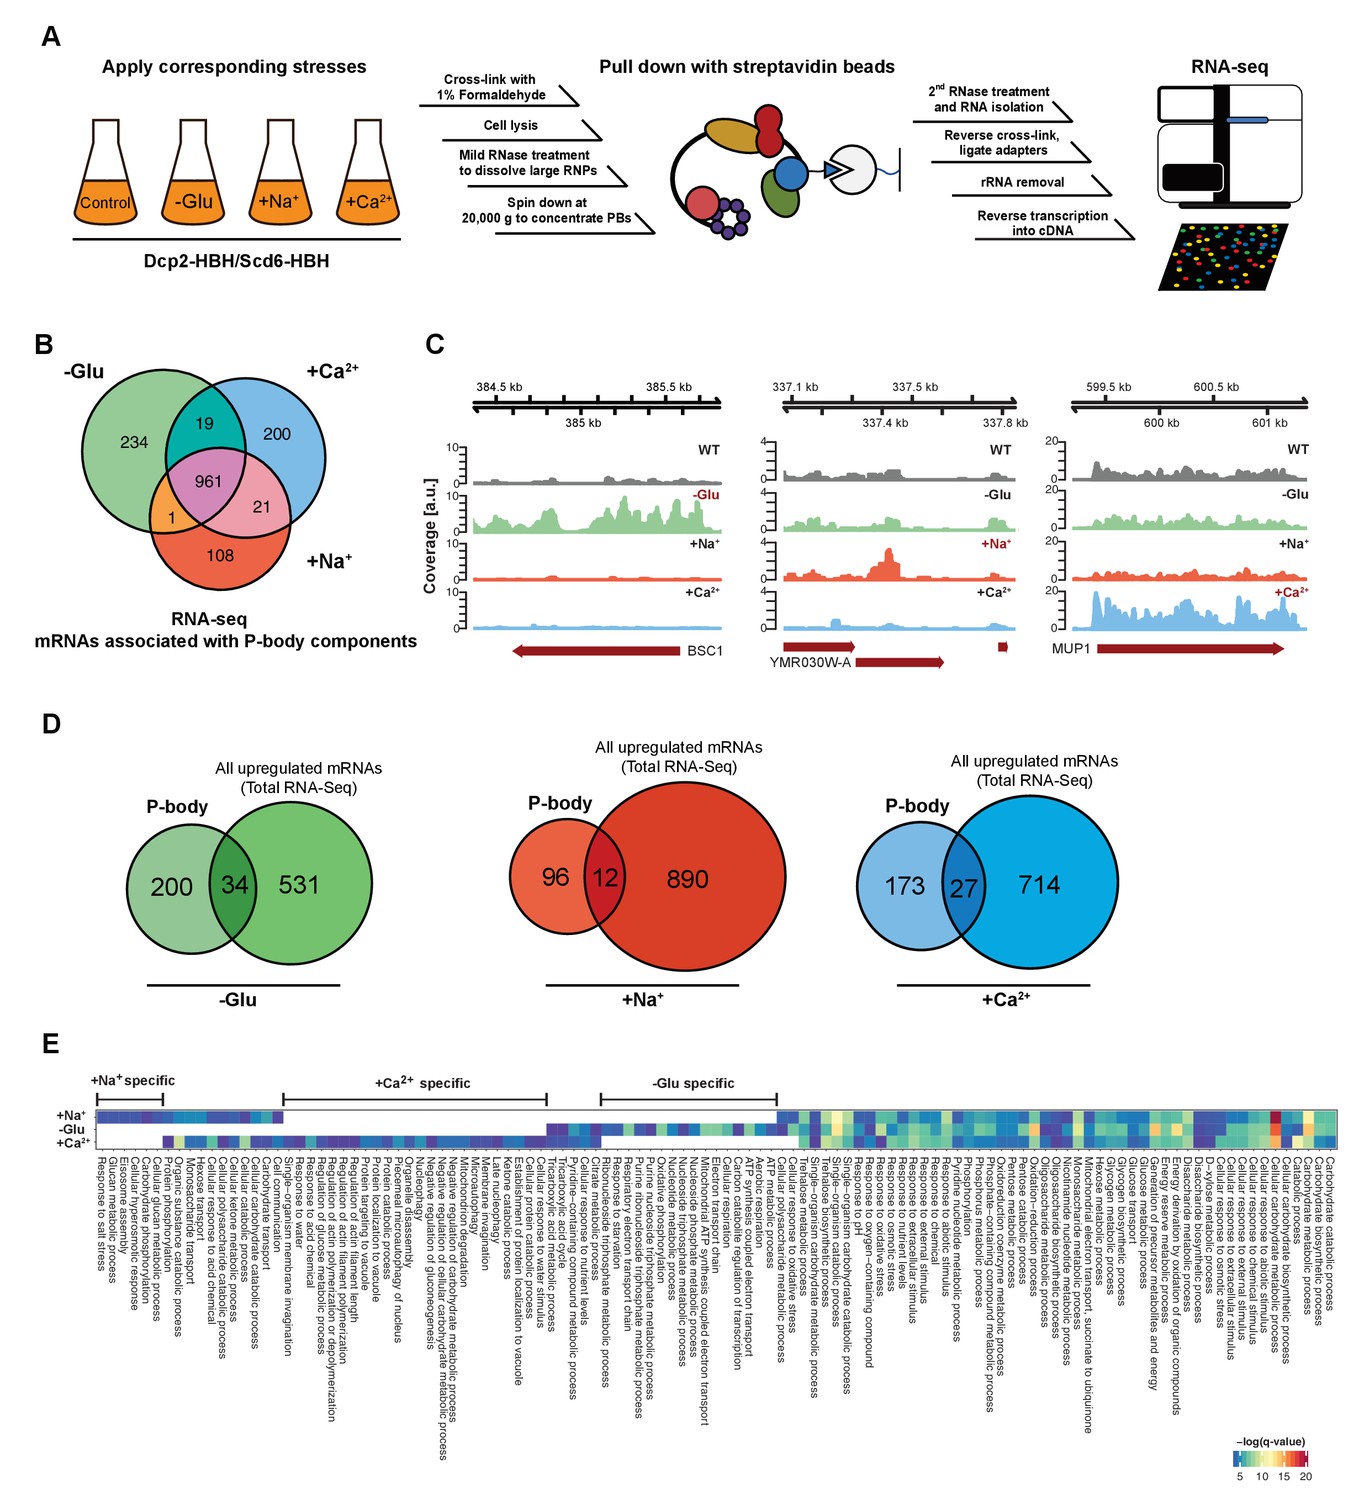
RNA-Seq reveals stress-specific mRNA subsets associated with P-body components at membranes.
(A) RNA-Seq library preparation workflow. Cells expressing Dcp2-HBH or Scd6-HBH were stressed for 10 min, followed by cross-linking with formaldehyde. After cell lysis, centrifugation was performed to enrich membrane fractions. Cross-linked complexes were subsequently purified via streptavidin affinity purification. mRNAs were isolated and ligated with adapters. cDNA libraries were prepared by reverse transcription and sequenced using single-read RNA-Seq. (B) Venn diagram illustrating the intersections among mRNAs associated with P-body components (p<0.05) under glucose depletion and osmotic stress conditions with Na+ or Ca2+, relative to the no stress condition as determined by RNA-Seq. (C) Read coverage plots (average over five biological replicates) of RNA-Seq data mapped to P-body associated genes under specific stress conditions. (D) Venn diagrams showing the intersections between mRNAs specifically associated with P-body components under glucose depletion, Na+ or Ca2+ stresses and all mRNAs that are upregulated upon the same treatment according to total RNA-Seq. (E) Enrichment analysis of P-body-associated genes under different stress conditions against Gene Ontology's (GO) biological processes (BP). Significantly enriched pathways (q-value <0.05) from hypergeometric tests are presented in a clustered heatmap. Rows and columns correspond to stress conditions and pathways, respectively, and the negative logarithms of q-values are color-coded from blue (low) to red (high).
Figure 1—figure supplement 1
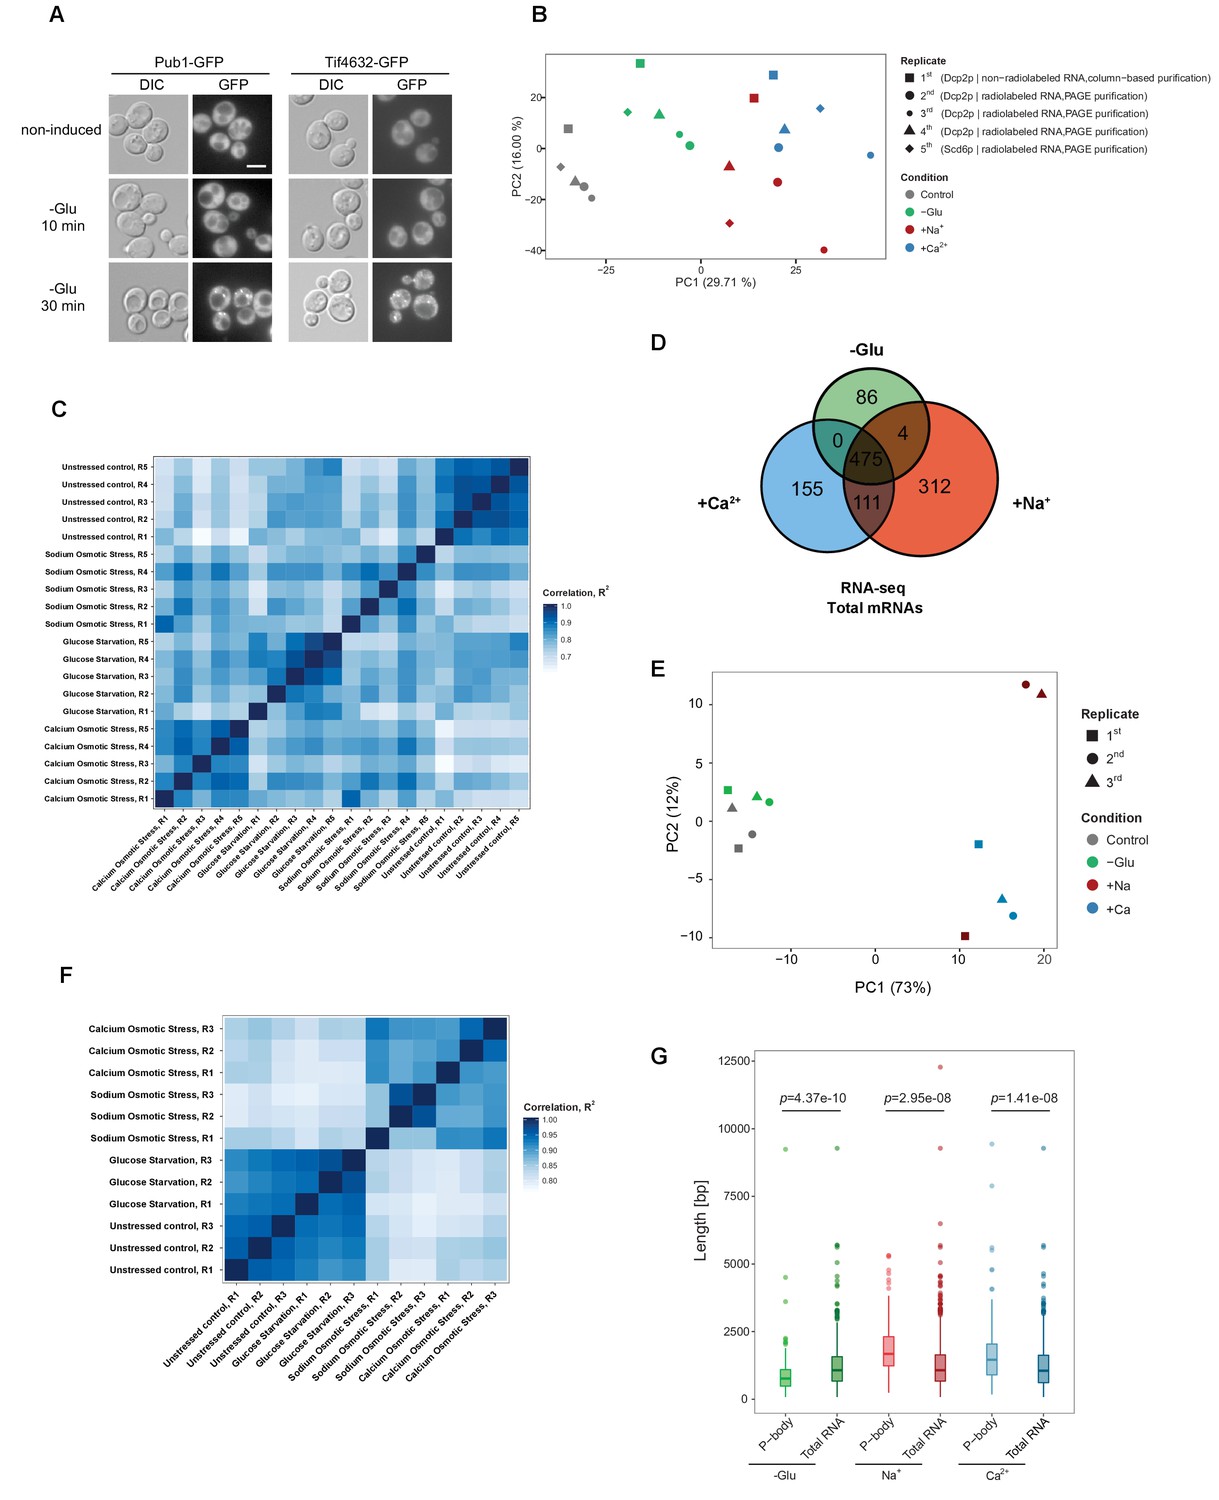
Reproducibility of datasets derived from RNA-Seq and Total RNA-Seq.
(A) Stress granules are not induced within 10 min of glucose starvation. Live-cell detection of stress granules (Pub1-GFP and Tif4632-GFP) following glucose depletion. Scale bar, 5 μm. Results are representative of three independent experiments. (B) Principal component analysis (PCA) plot based on the read count profile from aligned P-body associated RNA-Seq data of five biological replicates for each condition. The two first principal components are plotted with the proportion of variance explained, indicated by each component next to the axes labels. (C) Heat map generated from read counts of P-body-associated RNA-Seq datasets by performing pair-wise correlations across replicates and conditions. The continuous scale represents the correlation (R2 value) across samples. (D) Venn diagram illustrating the intersections among upregulated mRNAs (p<0.05) under glucose depletion, Na+ and Ca2+ stresses, relative to the unstressed control as determined by total RNA-Seq. (E) PCA plot based on the read count profile from aligned total RNA-Seq data of three biological replicates for each condition. The two first principal components are plotted with the proportion of variance explained, indicated by each component next to the axes labels. (F) Heat map generated from read counts of total RNA-Seq datasets by performing pair-wise correlations across replicates and conditions. The continuous scale represents the correlation (R2 value) across samples. (G) Length (total exonic) comparison of P-body-associated and total upregulated mRNAs under indicated stresses. A non-parametric, two-sided Wilcoxon test was used to determine p values.
Figure 1—figure supplement 2
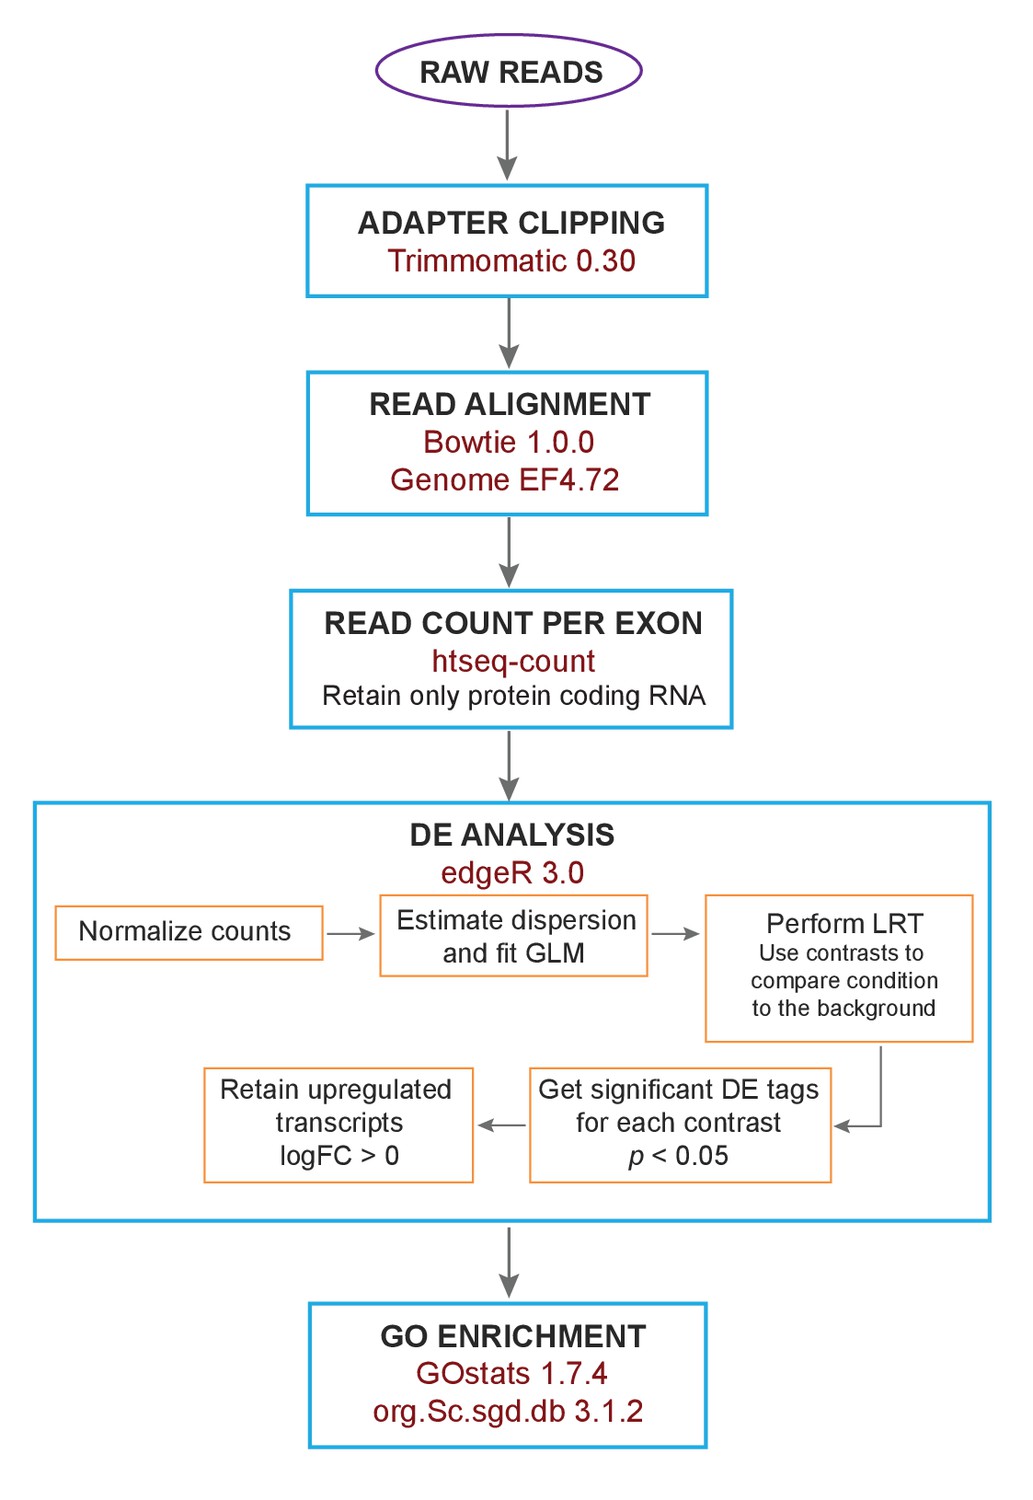
Flow chart of the analysis of RNA-Seq data.
The raw reads from the sequencing of RNA-Seq libraries were subject to adapter clipping. Subsequently, the reads were aligned and the read count per exon was extracted. This was followed by differential expression (DE) analysis of only protein coding RNA. Within this step, the counts were normalized, followed by dispersion estimation and fitting of a generalized linear model (GLM). In order to get differentially expressed genes for each stress condition, likelihood ratio tests (LRT) were performed using contrasts to compare the different conditions against the background. The top significant tags (p<0.05) were further filtered using logFC >0 to get significant upregulated genes for each condition.
Figure 2 with 1 supplement
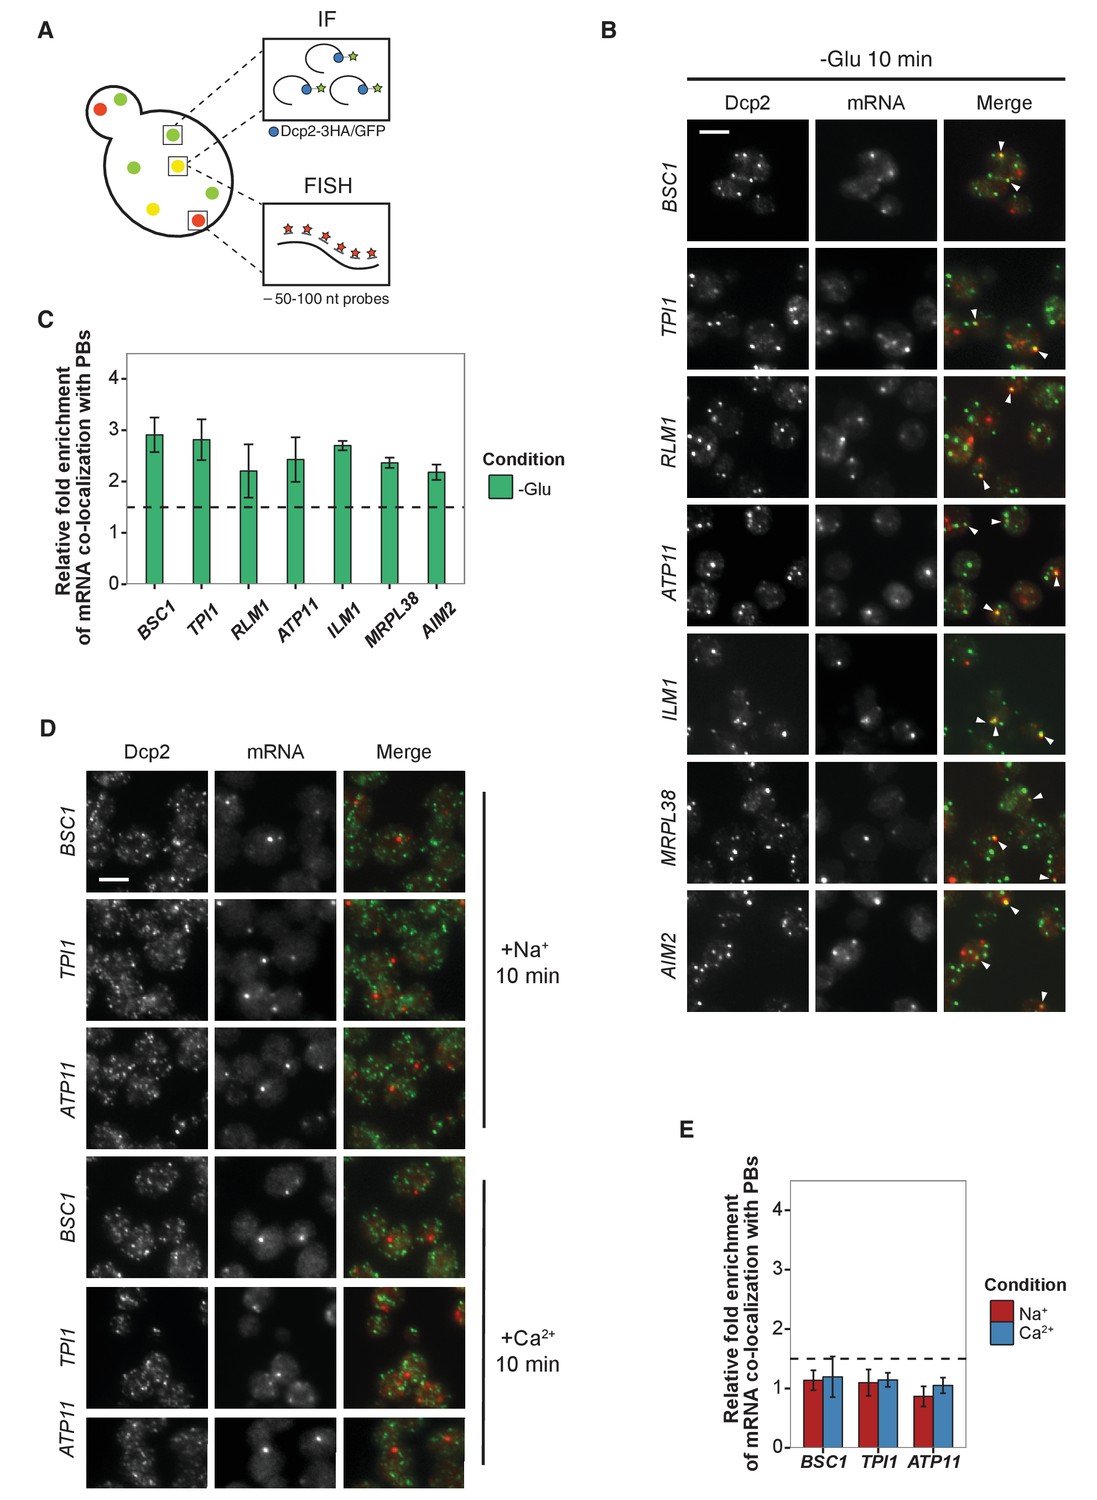
Validation of glucose-specific candidates by combined fluorescence in situ hybridization and immunofluorescence (FISH-IF).
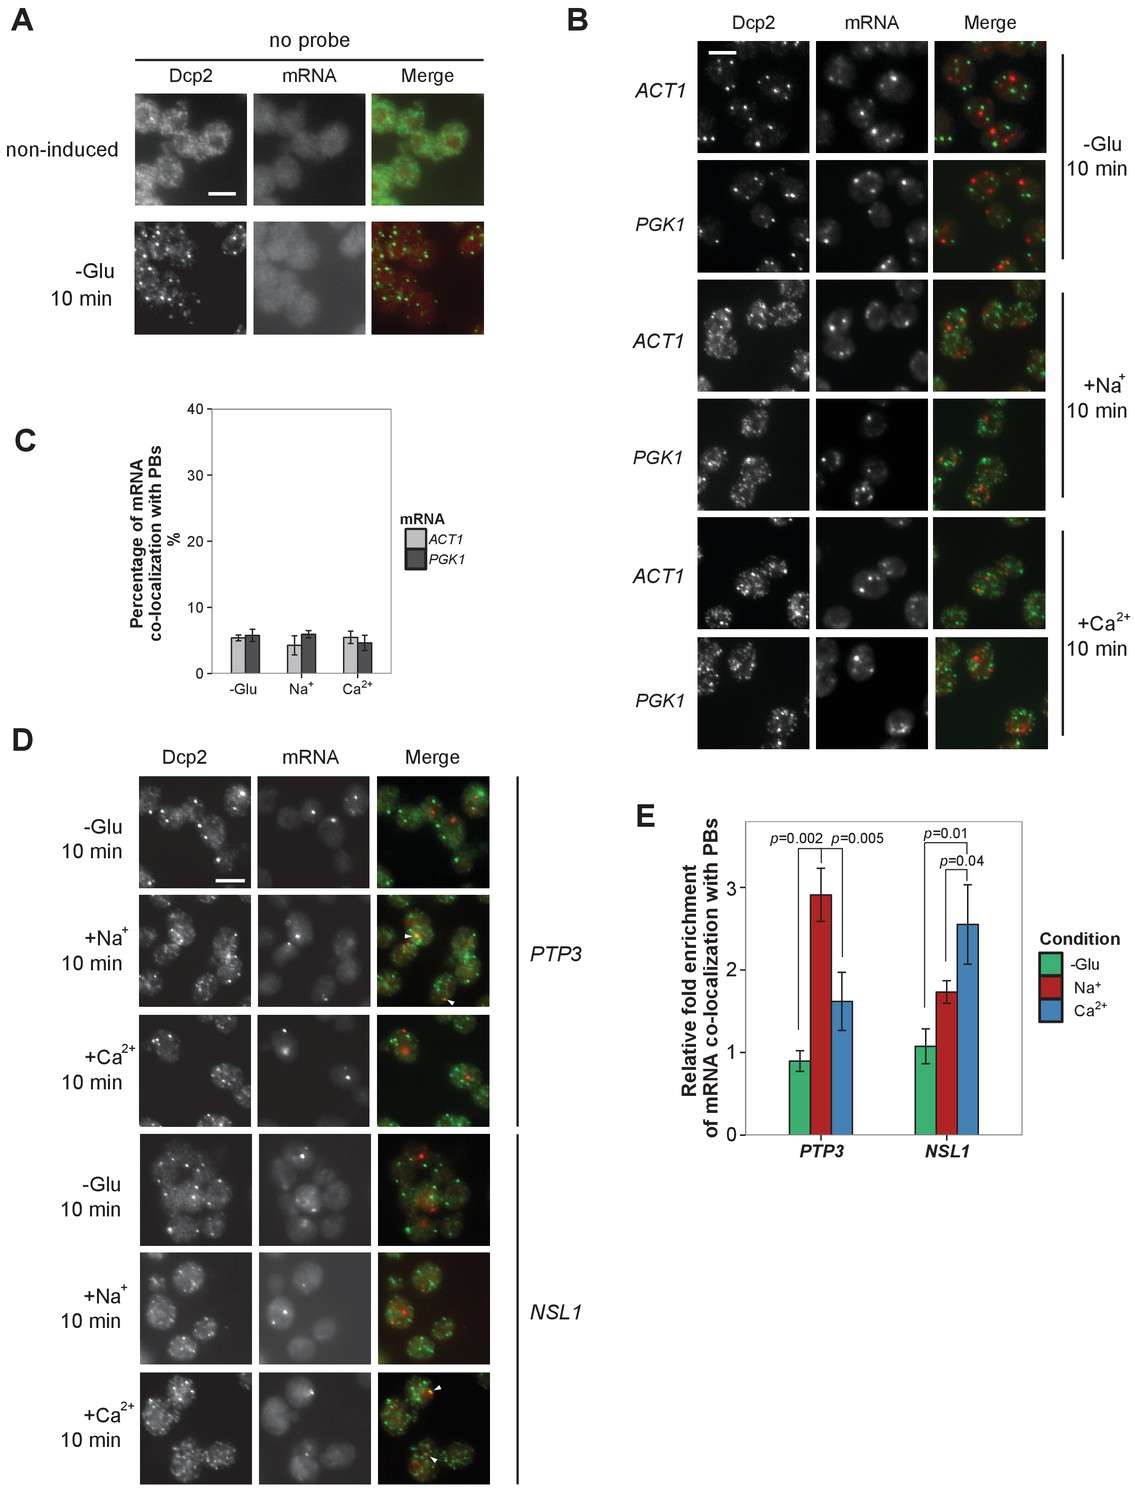
(A) Schematic representation of combined FISH-IF technique. Immunofluorescence staining was performed against P-body marker Dcp2 chromosomally tagged with 3 HA or GFP. To detect mRNAs accumulating in P-bodies, multiple short probes (50–100 nt) against the open reading frame (ORF) of each gene were used for FISH. (B) Fluorescence images of P-bodies and glucose-starvation-specific candidate mRNAs after glucose depletion. Cells expressing Dcp2-3HA were first grown in YPD media to mid-log phase and shifted to YP media lacking glucose for 10 min. Scale bar, 5 μm. Error bars, mean ±SEM. (C) Bar plot depicting the quantification of co-localization between candidate mRNAs and P-bodies. The percentage of co-localization was quantified as described in Materials and methods. The relative fold enrichment was subsequently calculated by normalizing the percentage of candidate mRNAs against the percentage of control mRNAs (Figure 2—figure supplement 1C). The dashed line represents an arbitrarily fixed threshold of 1.5 for determining significant P-body association. (D) Fluorescence images of P-bodies and glucose-specific candidate mRNAs under mild osmotic stress with Na+ or Ca2+. Cells expressing Dcp2-3HA were first grown in YPD media to mid-log phase and shifted to YPD media containing 0.5 M NaCl or 0.2 M CaCl2 for 10 min. Scale bars, 5 μm. Error bars, mean ±SEM. (E) Same as (C) except stress conditions. Scale bar, 5 μm. Error bars, mean ±SEM.
-
Figure 2—source data 1
Data used for plotting.
Files contains data for panel C of Figure 2.
- https://doi.org/10.7554/eLife.29815.007
-
Figure 2—source data 2
Data used for plotting.
Files contains data for panel E of Figure 2.
- https://doi.org/10.7554/eLife.29815.008
Figure 2—figure supplement 1
Evaluation of Na+, Ca2+ and non-candidate mRNAs by FISH-IF.
(A) FISH-IF controls. Combined FISH-IF was performed without probes with cells expressing Dcp2-3HA under non-induced condition. Scale bar, 5 μm. (B) Fluorescence images of P-bodies and two non-candidate mRNAs, ACT1 and PGK1. Cells expressing Dcp2-3HA were treated with indicated stresses. Scale bar, 5 μm. (C) Bar plot depicting the percentage of co-localization between non-candidate mRNAs and P-bodies. The average of the percentages of ACT1 and PGK1 under each condition served as a control level in calculating the fold enrichment Figures pertaining to co-localization of mRNAs with P-bodies. Error bars, mean ±SEM. (D) Fluorescence images of P-bodies and Na+ (PTP3) and Ca2+ (NSL1)-specific candidate mRNAs under glucose depletion, Na+ or Ca2+ stresses. Scale bar, 5 μm. (E) Bar plot depicting the quantification of co-localization between candidate mRNAs and P-bodies following glucose depletion, Na+ or Ca2+ osmotic stresses. Error bars, mean ±SEM. A one-tailed, non-paired Student’s t-test was used to determine p values.
-
Figure 2—Figure Supplement 1—source data 1
Data used for plotting.
Files contains data for panel C of Figure 2—figure supplement 1.
- https://doi.org/10.7554/eLife.29815.009
-
Figure 2—Figure Supplement 1—source data 2
Data used for plotting.
Files contains data for panel E of Figure 2—figure supplement 1.
- https://doi.org/10.7554/eLife.29815.010
Figure 3 with 1 supplement
The stability of P-body associated mRNAs varies and can be categorized according to their GO terms.
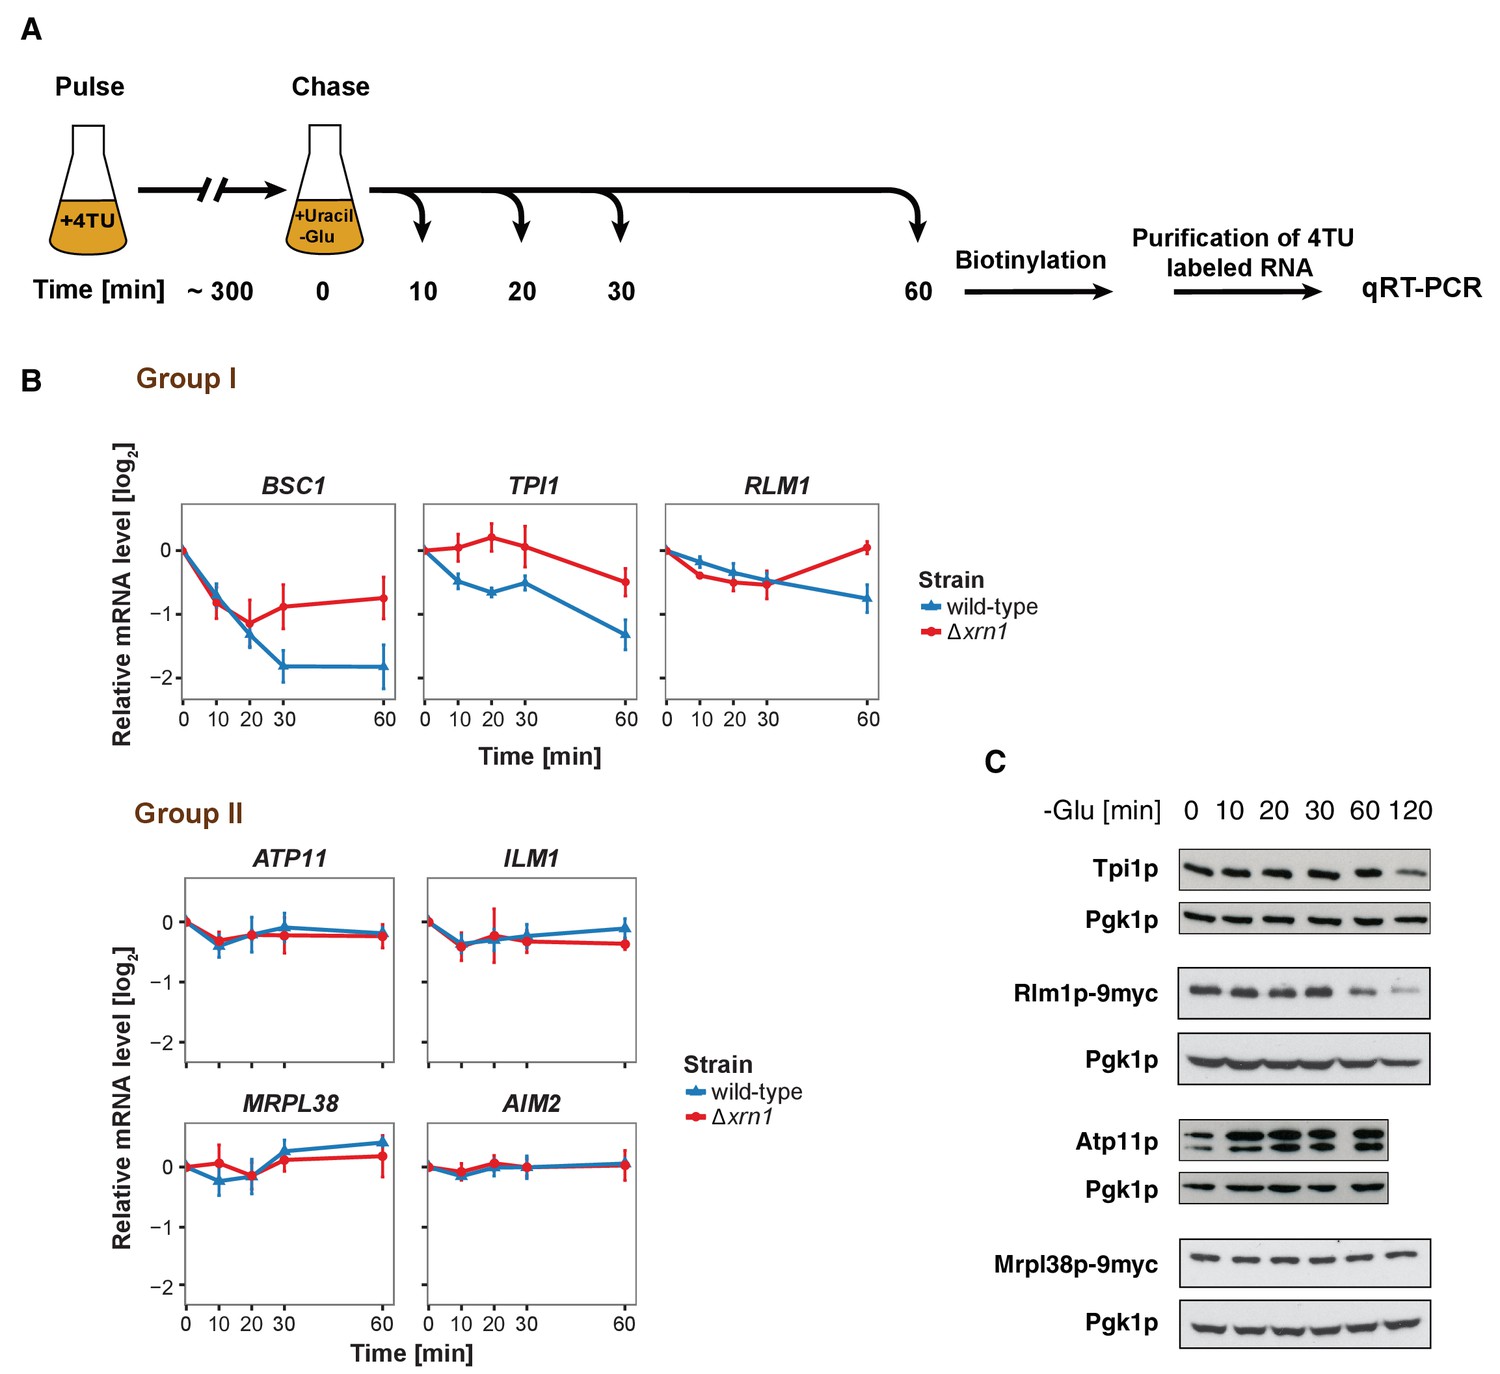
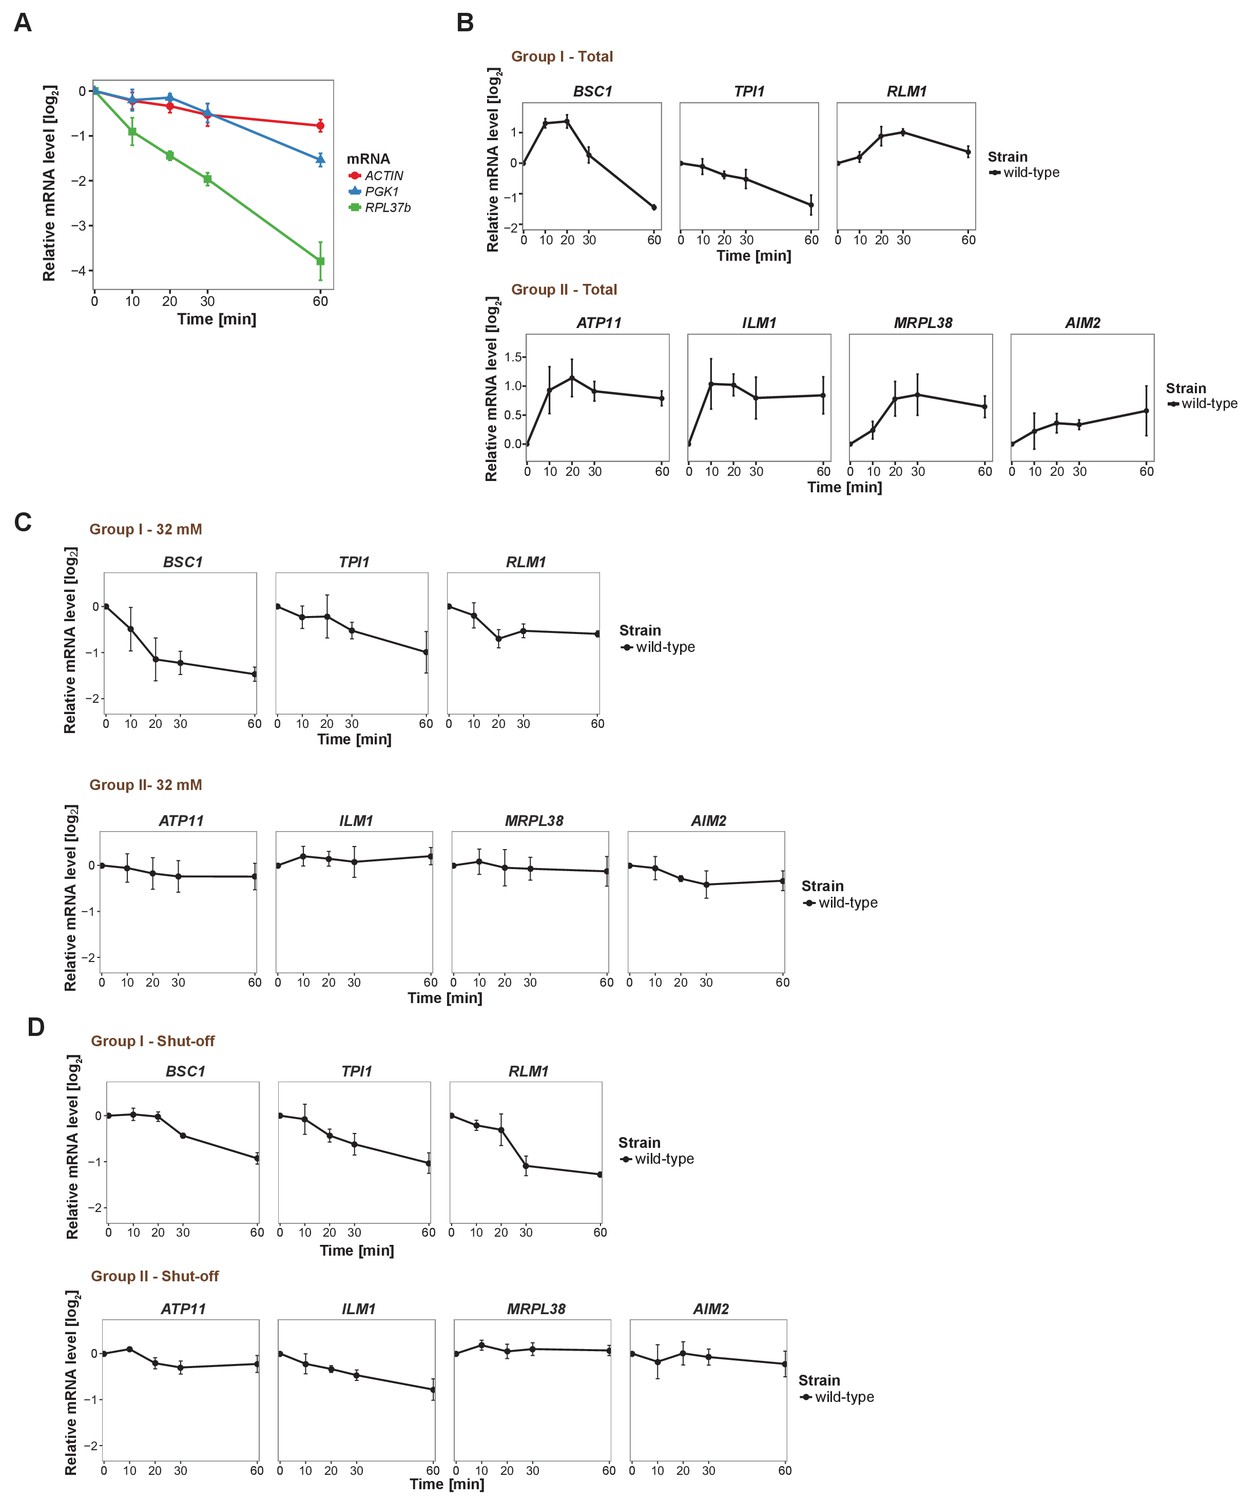
(A) Schematic illustration of pulse-chase protocol. Cells were grown in the presence of 0.2 mM 4-TU and shifted into media lacking glucose but containing 20 mM uracil. Cells were harvested at indicated time points after the shift. Total RNA was extracted and biotinylated. 4TU labeled RNA was purified and subsequently analyzed by qRT-PCR. (B) The stability of 4TU labeled candidate mRNAs was determined by qRT-PCR in wild type and Δxrn1 strains at indicated time points following a shift to glucose-depleted media. Transcription levels were normalized using ACT1 gene as an endogenous reference. Group I: non-mitochondria-related candidates. Group II: mitochondria-related candidates. Error bars, mean ±SEM. (C) Western blot analysis of Tpi1p, Rlm1p-9myc, Atp11p and Mprl38p-9myc at indicated time points after glucose deprivation. The 9myc tag was inserted at the end of the coding sequence without affecting the 3’UTR. Pgk1p was used as a loading control. Anti-Tpi1p, anti-Atp11p, anti-myc and anti-Pgk1p were used for detection. Results are representative of 3–4 independent experiments per target protein.
-
Figure 3—source data 1
Data used for plotting.
Files contains data for panel B of Figure 3.
- https://doi.org/10.7554/eLife.29815.013
Figure 3—figure supplement 1
Changes in total candidate mRNA levels and validation of pulse-chase protocol.
(A) Evaluation of qRT-PCR reference genes stability after glucose depletion. The total mRNA levels of three commonly used reference genes were measured by qRT-PCR and normalized to spike-in RNA control as described in Materials and methods. (B) Fold changes of total candidate mRNA levels after glucose depletion were determined by qRT-PCR using ACT1 as reference. (C) The stability of candidate mRNAs was determined by performing the pulse-chase experiment with 32 mM uracil, followed by qRT-PCR. (D) The stability of mRNAs was examined by qRT-PCR after blocking transcription by 1, 10-phenanthroline in the wild type strain at indicated time points following a shift to glucose-depleted media. Group I: non-mitochondria-related candidates. Group II: mitochondria-related candidates. Error bars, mean ±SEM.
-
Figure 3—Figure Supplement 1—source data 1
Data used for plotting.
Files contains data for panel A of Figure 3—figure supplement 1.
- https://doi.org/10.7554/eLife.29815.014
-
Figure 3—Figure Supplement 1—source data 2
Data used for plotting.
Files contains data for panel B of Figure 3—figure supplement 1.
- https://doi.org/10.7554/eLife.29815.015
-
Figure 3—Figure Supplement 1—source data 3
Data used for plotting.
Files contains data for panel C of Figure 3—figure supplement 1.
- https://doi.org/10.7554/eLife.29815.016
-
Figure 3—Figure Supplement 1—source data 4
Data used for plotting.
Files contains data for panel D of Figure 3—figure supplement 1.
- https://doi.org/10.7554/eLife.29815.017
Figure 4 with 2 supplements
Puf5p is required for mRNA targeting to P-bodies.
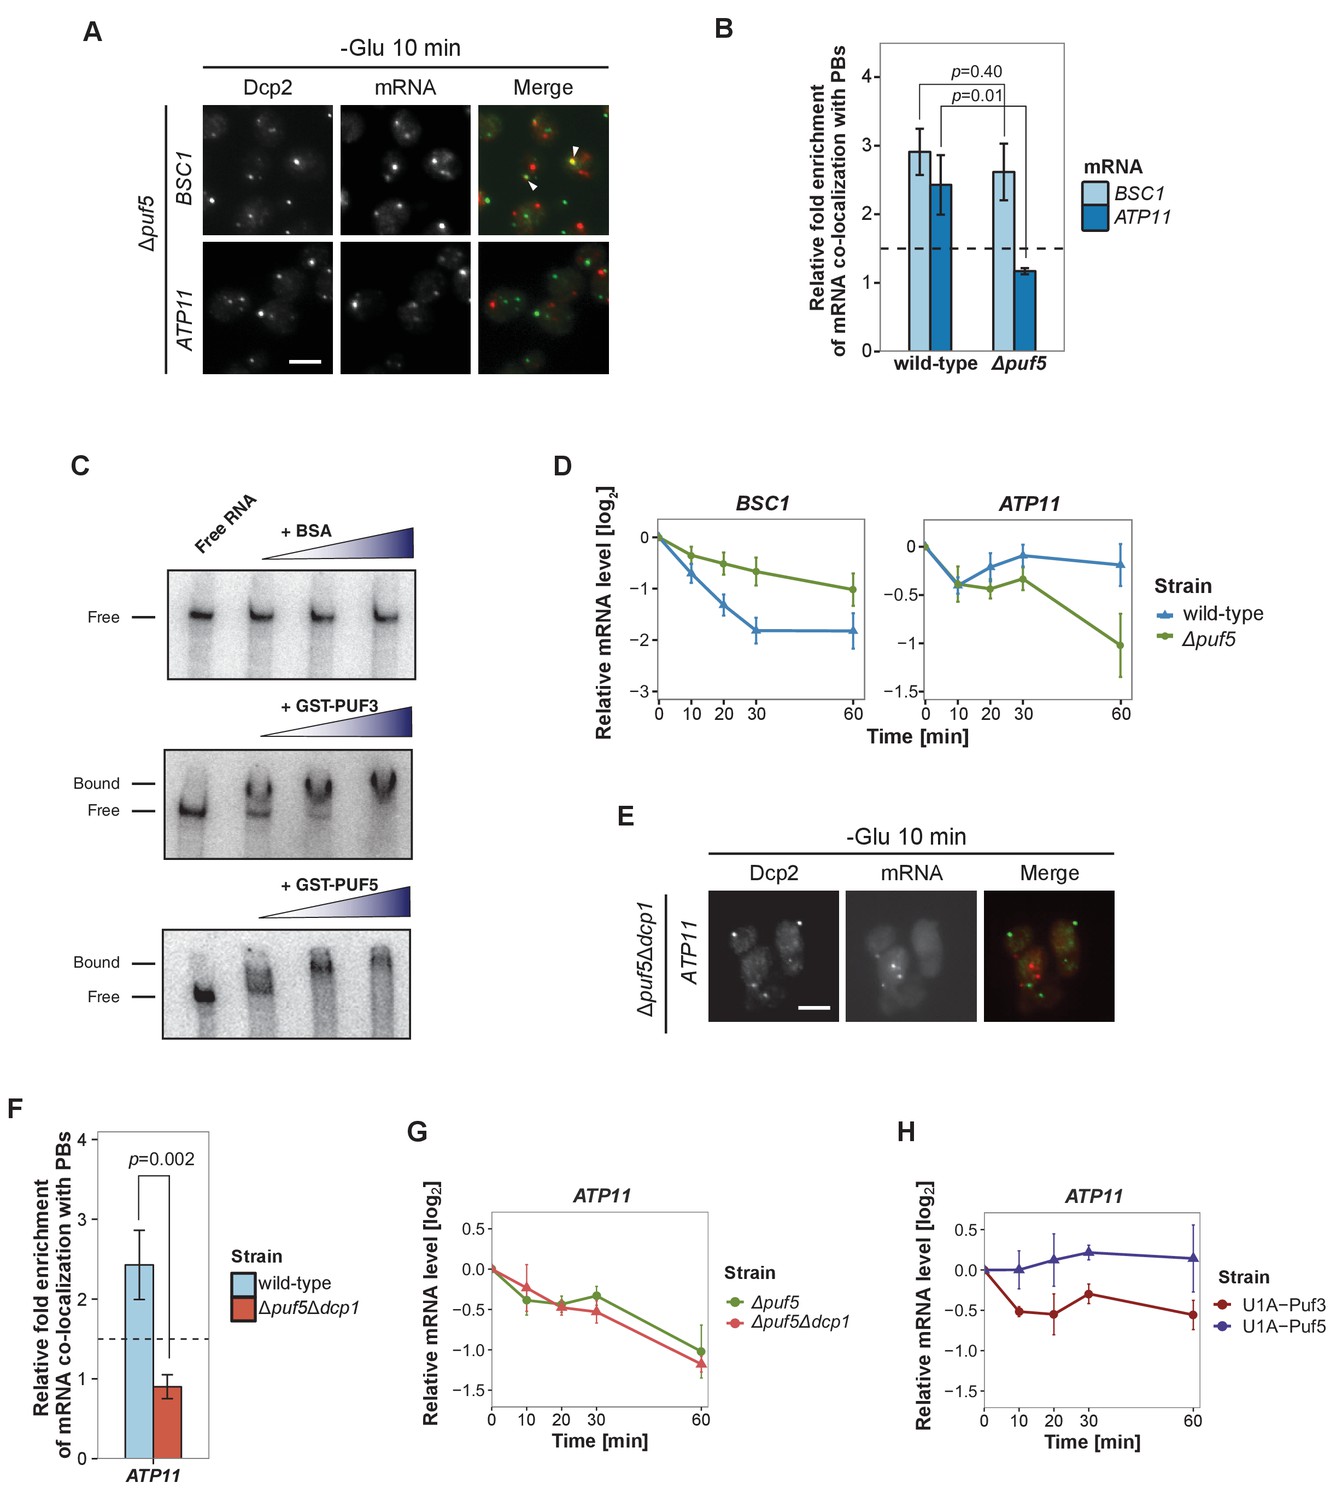
(A) Fluorescence images of P-bodies and BSC1 (Group I) or ATP11 (Group II) mRNAs following glucose depletion on Δpuf5 cells expressing Dcp2-GFP. Scale bar, 5 μm. (B) Bar plot showing the relative fold enrichment of co-localization between BSC1, ATP11 and P-bodies in Δpuf5 strain 10 min after switched to glucose-free media. Wild type is plotted as in Figure 2C. The dashed line represents a fixed threshold of 1.5 for determining significant enrichment. Error bars, mean ±SEM. A one-tailed, non-paired Student’s t-test was used to determine p values. (C) EMSA assays using ATP11 3’UTR RNA (1–500 nt after STOP codon) oligonucleotide in the absence or presence of bovine serum albumin (1.25, 2.5, 5 μM), GST-Puf3 (10, 50, 100 nM) and GST-Puf5 (1.25, 2.5, 5 μM). Unbound radiolabelled RNA (Free) shifts to a high molecular weight complex when bound to GST-Puf3 or GST-Puf5 (Bound), Results are representative of 3–4 independent experiments per protein. (D) The stability of 4TU labeled BSC1 and ATP11 mRNAs was measured by qRT-PCR in Δpuf5 strain at indicated time points following glucose depletion. Wild type is plotted as in Figure 3B. Error bars, mean ±SEM. (E) Fluorescence images of P-bodies and ATP11 mRNA following glucose depletion on Δpuf5Δdcp1 cells expressing Dcp2-GFP. Scale bar, 5 μm. (F) Bar plot showing the relative fold enrichment of co-localization between ATP11 and P-bodies in Δpuf5Δdcp1 strain upon 10 min glucose starvation. Wild type is plotted as in Figure 2C. The dashed line represents a fixed threshold of 1.5 for determining significant enrichment. Error bars, mean ±SEM. A one-tailed, non-paired Student’s t-test was used to determine p values. (G) The stability of 4TU labeled ATP11 mRNA was measured by qRT-PCR in Δpuf5Δdcp1 strain at indicated time points following glucose depletion. Δpuf5 is plotted as in Figure 4D. Error bars, mean ±SEM. (H) The stability of ATP11 mRNA was examined by qRT-PCR after blocking transcription by 1, 10-phenanthroline in Dcp2-2xmcherry strains co-expressing PGK1-U1A (stem loops)-STL1 and U1A (coat protein)-GFP-Puf5 or U1A (coat protein)-GFP-Puf3.
-
Figure 4—source data 1
Data used for plotting.
Files contains data for panel B of Figure 4.
- https://doi.org/10.7554/eLife.29815.021
-
Figure 4—source data 2
Data used for plotting.
Files contains data for panel D of Figure 4.
- https://doi.org/10.7554/eLife.29815.022
-
Figure 4—source data 3
Data used for plotting.
Files contains data for panel F of Figure 4.
- https://doi.org/10.7554/eLife.29815.023
-
Figure 4—source data 4
Data used for plotting.
Files contains data for panel G of Figure 4.
- https://doi.org/10.7554/eLife.29815.024
-
Figure 4—source data 5
Data used for plotting.
Files contains data for panel H of Figure 4.
- https://doi.org/10.7554/eLife.29815.025
Figure 4—figure supplement 1
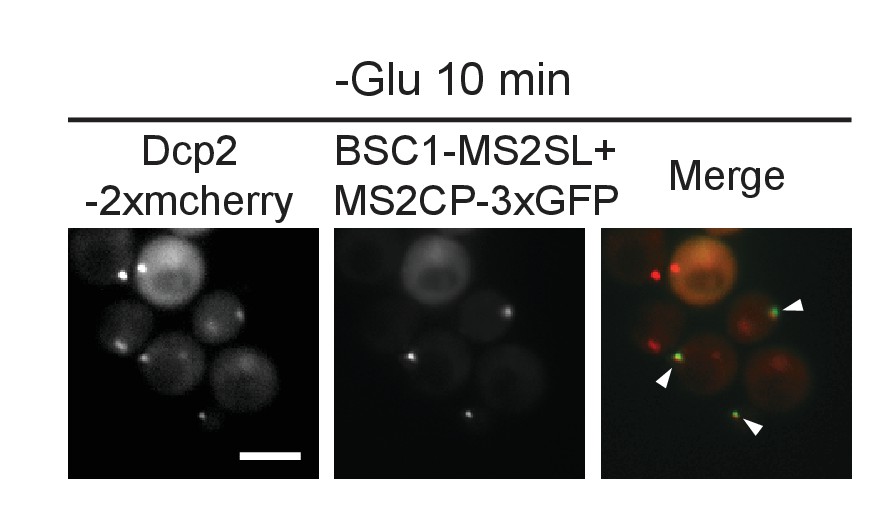
Live-cell detection of P-bodies (Dcp2-2xmcherry) and BSC1 mRNA molecules using the MS2 system.
Scale bar, 5 μm. Results are representative of 3 independent experiments.
Figure 4—figure supplement 2

A screen for RNA-binding proteins required for mRNA recruitment to P-bodies.
(A) A screen to identify RNA-binding proteins affecting mRNA recruitment to P-bodies by FISH-IF. BSC1 and ATP11 were selected for screening performed with the deletion strains as listed. A fold enrichment value above 1.5 was classified as not required (-), below as required (+). Two independent experiments were performed per mRNA per strain. (B) The stability of 4-TU labeled BSC1 and ATP11 mRNAs was measured by qRT-PCR in Δpuf3 strain at indicated time points following glucose depletion. Wild type is plotted as in Figure 3B. Error bars, mean ±SEM. (C) Live-cell detection of P-bodies (Dcp2-2xmcherry) and Puf5p (GFP) following glucose withdrawal, Scale bar, 5 μm. Results are representative of 3 independent experiments. (D) Live-cell detection of P-bodies (Dcp2-2xmcherry) and U1A-GFP-Puf3 or U1A (coat protein)-GFP-Puf5 using the U1A system. Scale bar, 5 μm. Results are representative of 3 independent experiments.
-
Figure 4—Figure Supplement 2—source data 1
Data used for plotting.
Files contains data for panel B of Figure 4—figure supplement 2.
- https://doi.org/10.7554/eLife.29815.026
Figure 5 with 1 supplement
3’UTR is necessary for mRNA localization to P-bodies.
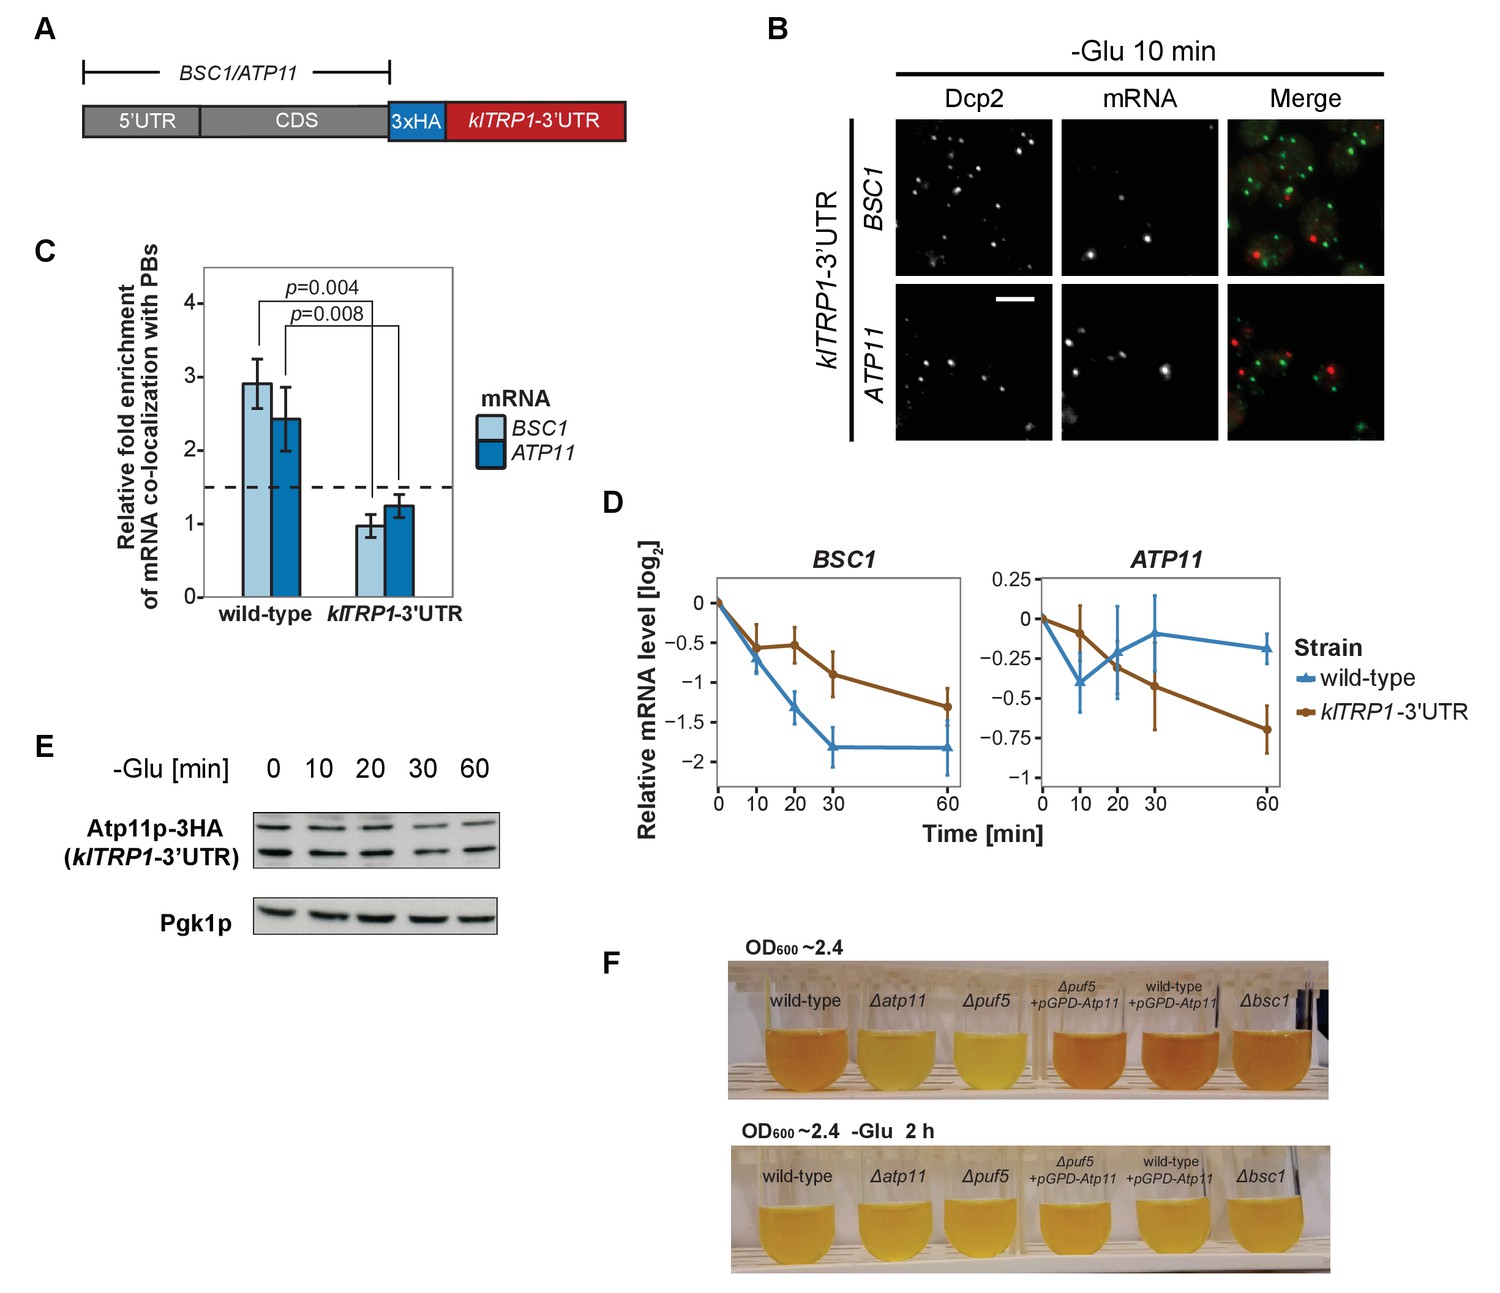
(A) A schematic representation of C-terminal tagging with 3xHA. The endogenous 3’UTR was simultaneously replaced by the 3’UTR of klTRP1. (B) Fluorescence images of P-bodies and BSC1, ATP11 mRNAs following glucose depletion on corresponding 3’UTR replaced strains. Scale bar, 5 μm. (C) Bar plot depicting the relative fold enrichment of co-localization between BSC1, ATP11 and P-bodies in corresponding 3’UTR replaced strains 10 min after glucose starvation. Wild type is plotted as in Figure 2C. The dashed line represents a fixed threshold of 1.5 for determining significant enrichment. Error bars, mean ±SEM. A one-tailed, non-paired Student’s t-test was used to determine p values. (D) The stability of 4TU labeled BSC1 and ATP11 mRNAs was determined by qRT-PCR in corresponding 3’UTR replaced strains at indicated time points following glucose depletion. Wild type is plotted as in Figure 3B. Error bars, mean ±SEM. (E) Western blot analysis of Atp11p-HA (klTRP1 3’UTR) at indicated time points after glucose deprivation. Pgk1 was used as a loading control. Anti-HA and anti-Pgk1p were used for detection. Results are representative of three independent experiments. (F) Assessment of intracellular glycogen content in wild type, ATP11, PUF5 deletion strains in the absence or presence of ATP11 overexpression plasmid and BSC1 deletion strain by iodine staining. Yeast cultures were grown to stationary phase (OD600 ~2.4) in medium containing 2% dextrose (upper panel). Then cells were shifted to medium without dextrose for 2 hr (lower panel). Results are representative of four independent experiments.
-
Figure 5—source data 1
Data used for plotting.
Files contains data for panel C of Figure 5.
- https://doi.org/10.7554/eLife.29815.029
-
Figure 5—source data 2
Data used for plotting.
Files contains data for panel D of Figure 5.
- https://doi.org/10.7554/eLife.29815.030
Figure 5—figure supplement 1
3’UTR is insufficient for mRNA localization to P-bodies.
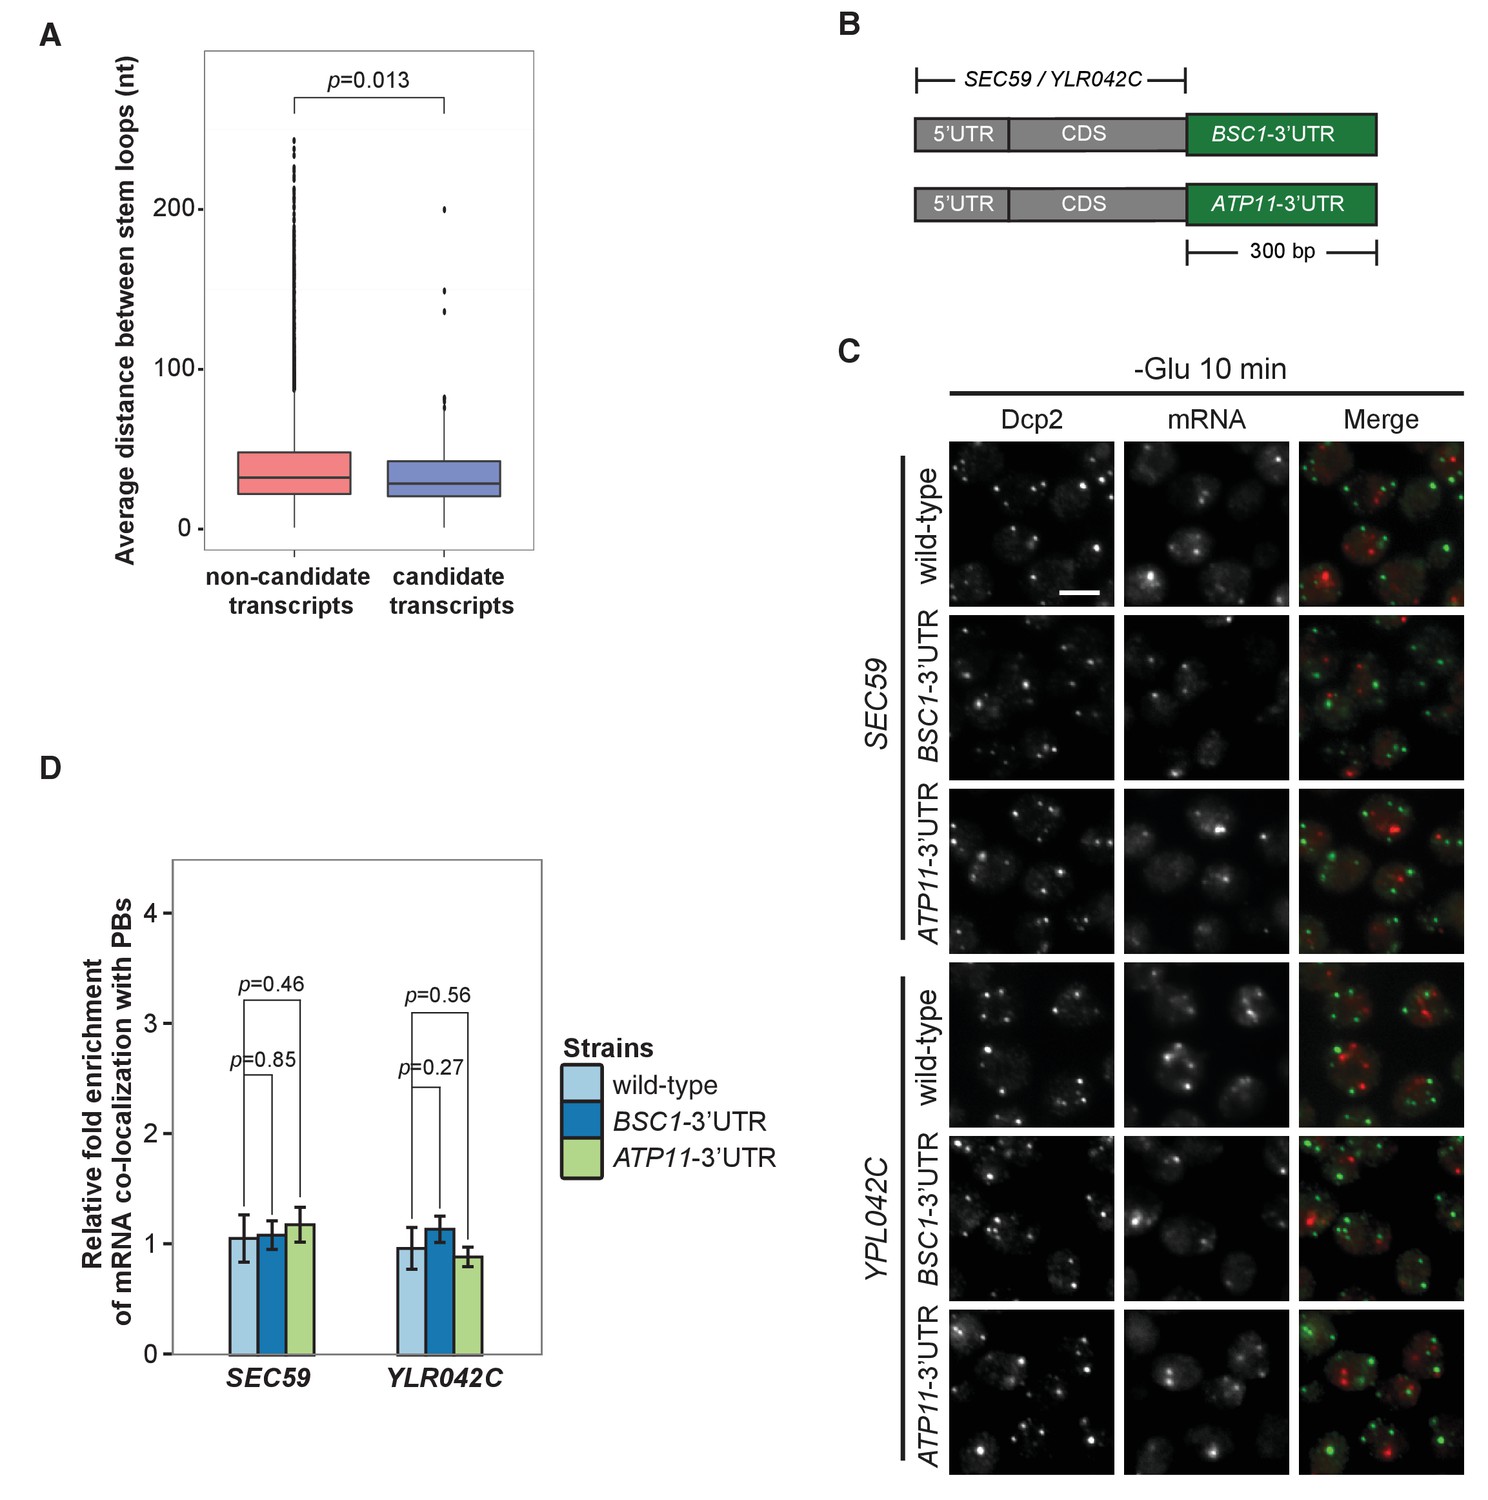
(A) Box plot of average distances between stem loops among the 3’UTRs of candidate transcripts versus non-candidate transcripts. A non-parametric, one-sided Wilcoxon rank-sum test was used to determine p values. (B) A schematic representation of 3’UTR transplantation chimeras. The endogenous 3’UTRs (300 bp downstream from stop codon) of SEC59 and YLR042C (300 bp downstream from stop codon) were replaced by the 3’UTRs of BSC1 and ATP11, respectively. (C) Fluorescence images of P-bodies and SEC59 and YLR042C mRNAs following glucose depletion. Scale bar, 5 μm. (D) Bar plot showing the relative fold enrichment of co-localization between SEC59, YLR042C and P-bodies in indicated chimeric strains 10 min after glucose withdrawal. Wild type is plotted as in Figure 2C. Error bars, mean ±SEM. A one-tailed, non-paired Student’s t-test was used to determine p values.
-
Figure 5—Figure Supplement 1—source data 1
Data used for plotting.
- https://doi.org/10.7554/eLife.29815.031
Figure 6
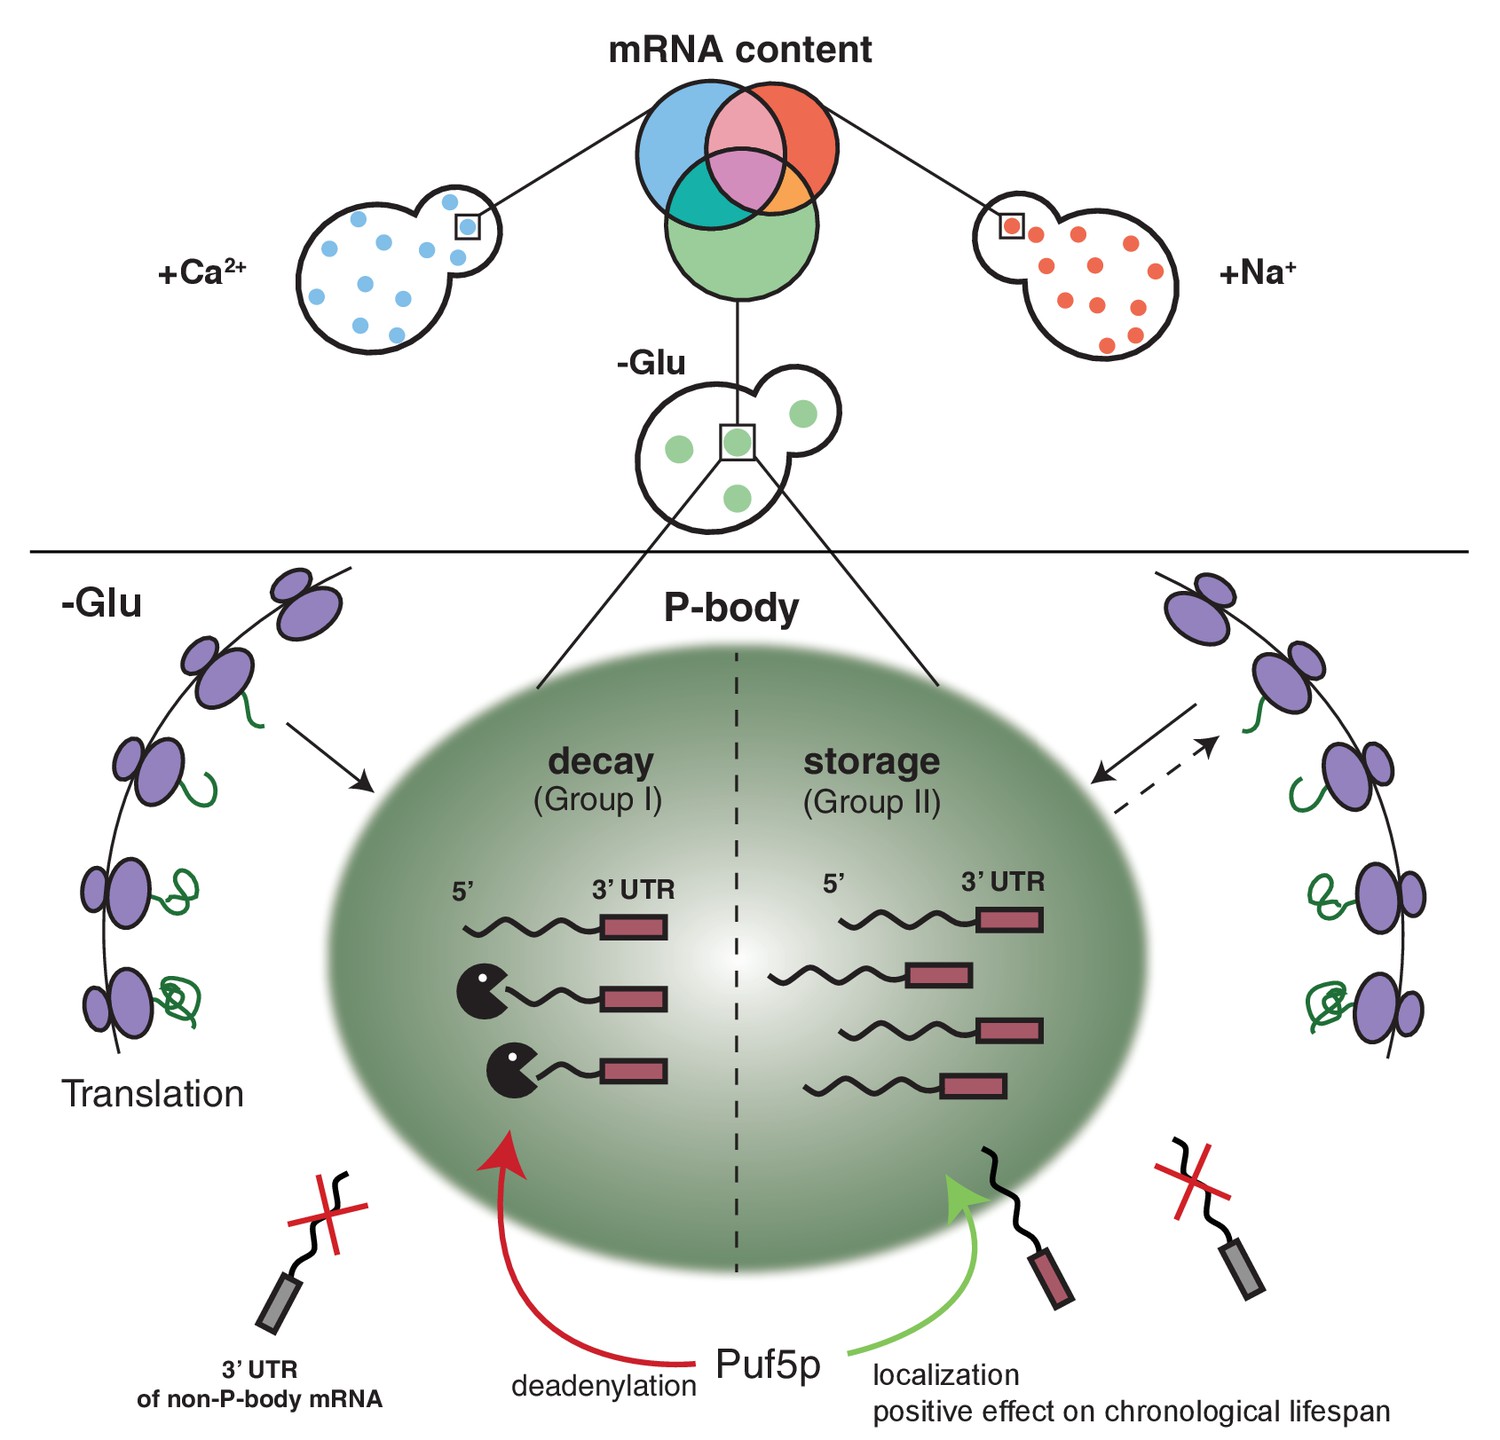
Schematic model summarizing our findings.
https://doi.org/10.7554/eLife.29815.032Tables
Key resources table
| Reagent type (species) or resource | Designation | Source or reference | Identifiers | Additional information |
|---|---|---|---|---|
| strains are listed in Supplementary file 5 | ||||
| primers are listed in Supplementary file 4 | ||||
| genetic reagent (Plasmid) | pDZ274 | Addgene plasmid # 45929 | ||
| genetic reagent (Plasmid) | pDZ415 | Addgene plasmid # 45162 | ||
| antibody | anti-DIG-POD | Roche | RRID:AB_514500 | 1/750 in PBTB |
| antibody | anti-HA | Covance | RRID:AB_2314672 | 1/250 FISH-IF, 1/1,000 WB |
| antibody | anti-GFP | Roche | RRID:AB_390913 | 1/250 |
| antibody | goat anti-mouse-IgG-Alexa 488 | Invitrogen | RRID:AB_2534069 | 1/400 in PBS |
| antibody | anti-Tpi1 | LSBio | RRID:AB_11132833 | 1/1,000 |
| antibody | anti-myc | Sigma-Aldrich | RRID:AB_439694 | 1/1,000 |
| antibody | anti-Pgk1 | Invitrogen | RRID:AB_221541 | 1/1,000 |
Additional files
-
Supplementary file 1
Experimental design.
- https://doi.org/10.7554/eLife.29815.033
-
Supplementary file 2
Hit list RNAseq from RNAs associated with PB components.
- https://doi.org/10.7554/eLife.29815.034
-
Supplementary file 3
Hit list RNAseq from total RNA.
- https://doi.org/10.7554/eLife.29815.035
-
Supplementary file 4
List of primers used in this study.
- https://doi.org/10.7554/eLife.29815.036
-
Supplementary file 5
List of strains used in this study.
- https://doi.org/10.7554/eLife.29815.037
-
Transparent reporting form
- https://doi.org/10.7554/eLife.29815.038
Download links
A two-part list of links to download the article, or parts of the article, in various formats.
Downloads (link to download the article as PDF)
Open citations (links to open the citations from this article in various online reference manager services)
Cite this article (links to download the citations from this article in formats compatible with various reference manager tools)
Context-dependent deposition and regulation of mRNAs in P-bodies
eLife 7:e29815.
https://doi.org/10.7554/eLife.29815


