A randomised double blind placebo controlled phase 2 trial of adjunctive aspirin for tuberculous meningitis in HIV-uninfected adults
- Oxford University Clinical Research Unit, Vietnam
- Hospital for Tropical Diseases, Vietnam
- Western General Hospital, United Kingdom
- Queen Mary University of London, United Kingdom
- VU University Amsterdam, Netherlands
- Nuffield Department of Medicine, University of Oxford, United Kingdom
Figures
Figure 1
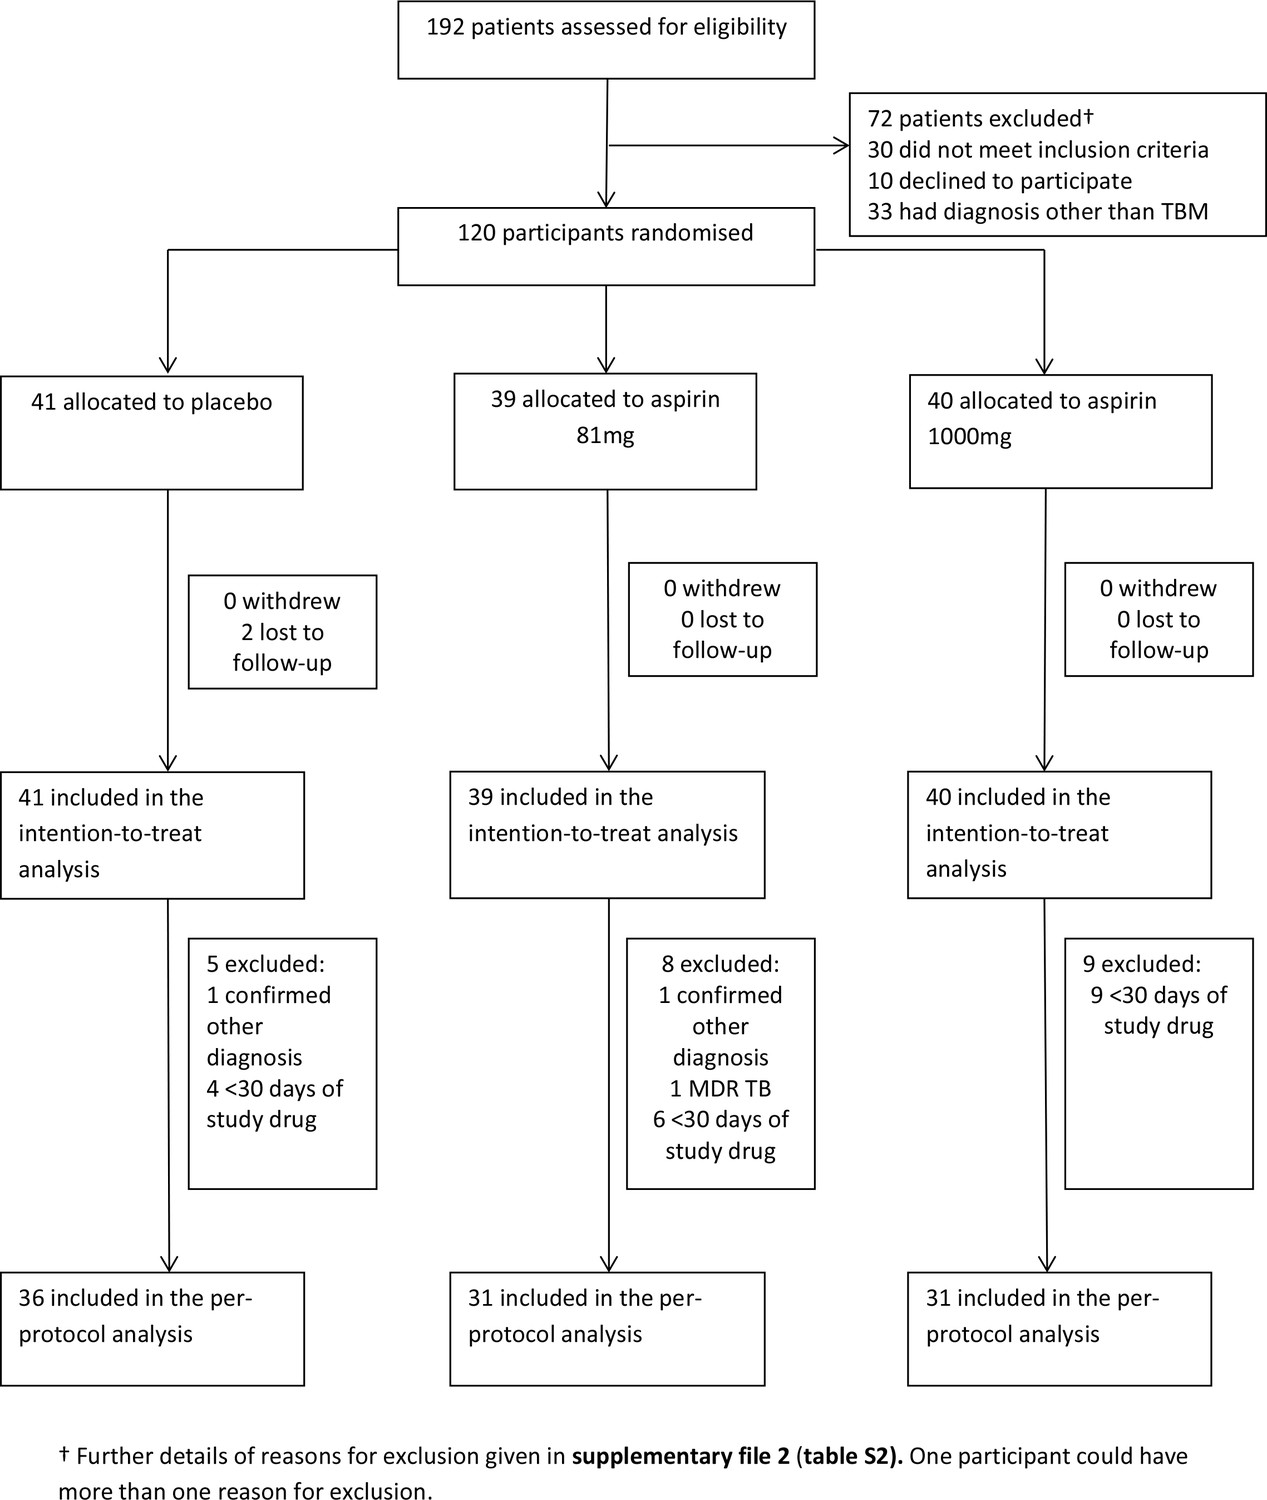
Participant flow through the trial.
https://doi.org/10.7554/eLife.33478.003
Figure 2 with 2 supplements
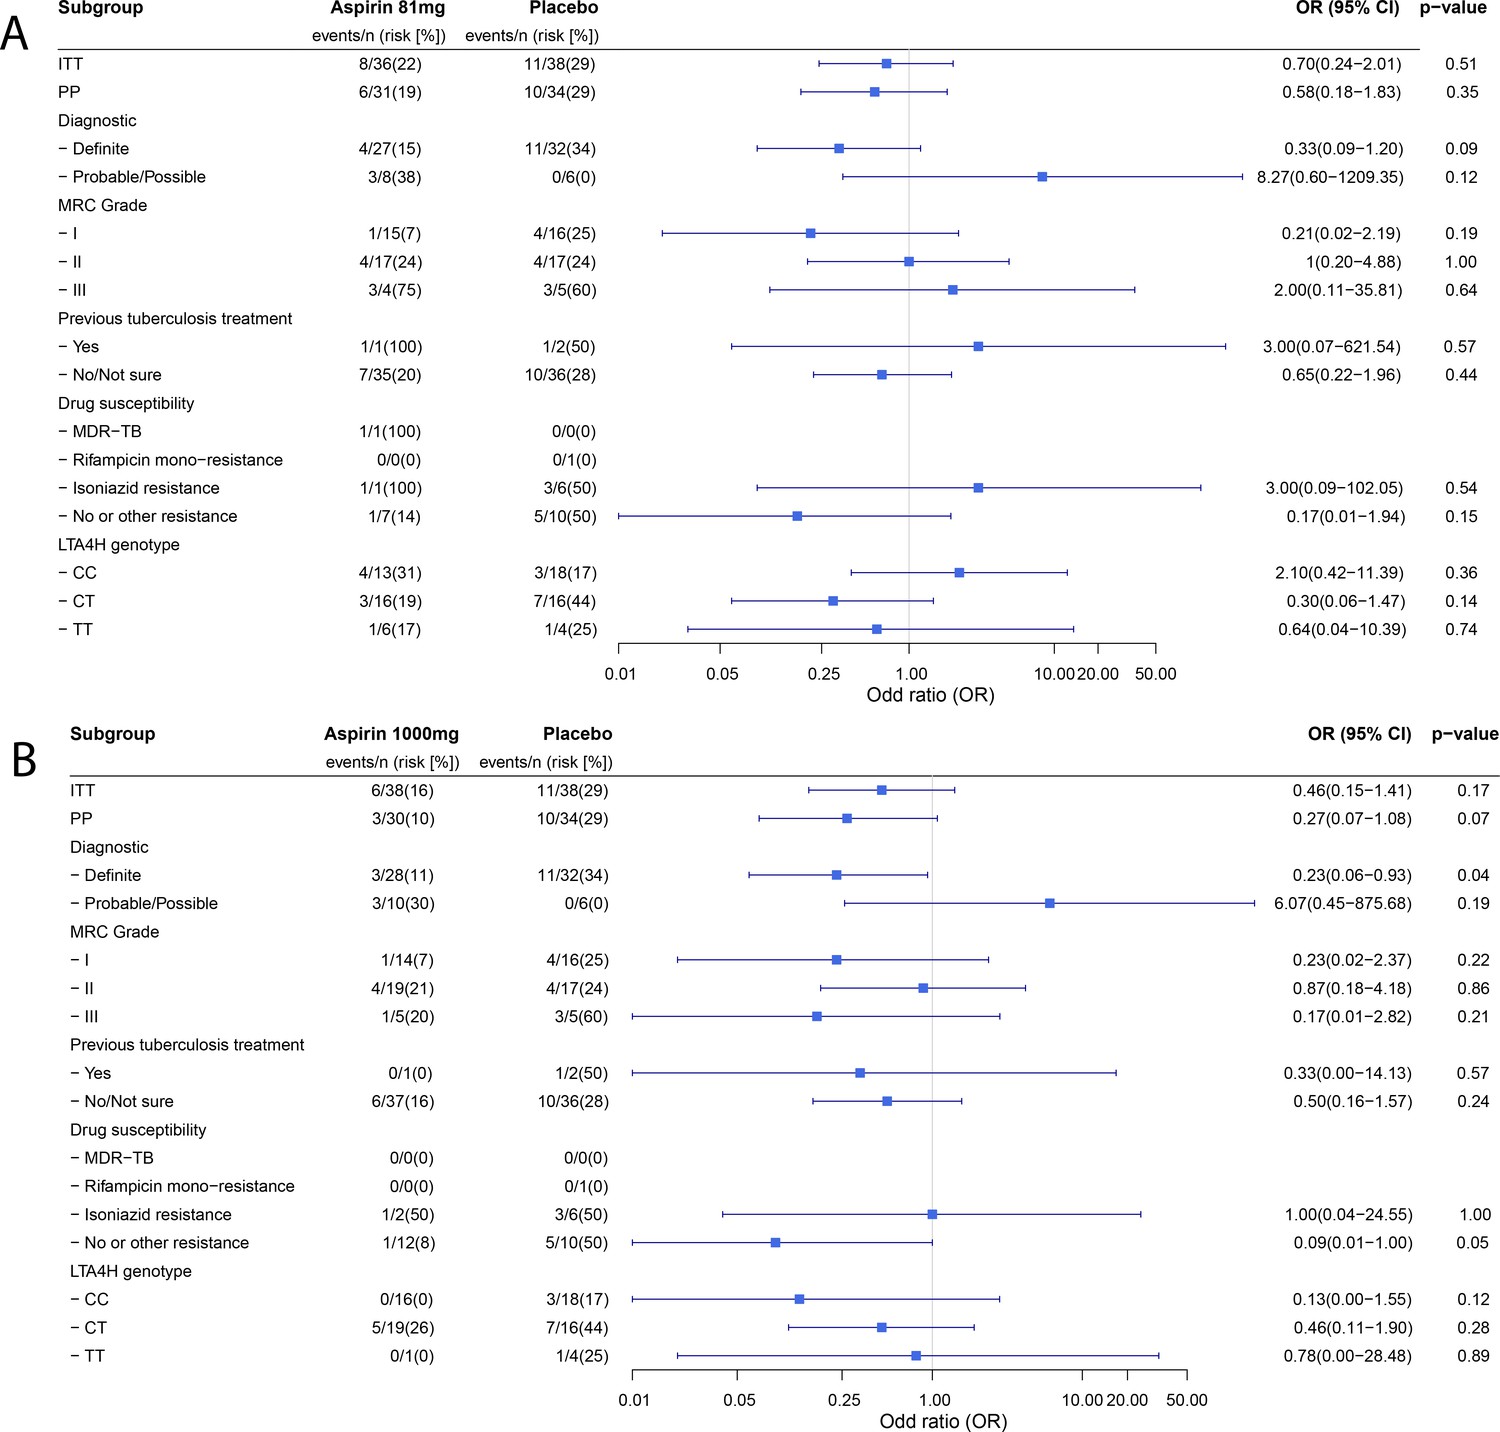
Forest plots of ITT, per-protocol and planned sub-group analysis of aspirin 81 mg versus placebo (A) and aspirin 1000 mg versus placebo (B) for the primary efficacy outcome.
Estimates for subgroups without events were obtained via Firth’s penalized likelihood. Panels show 8 month survival plots for the ITT (C) and per-protocol (D) populations.
Figure 2—figure supplement 1
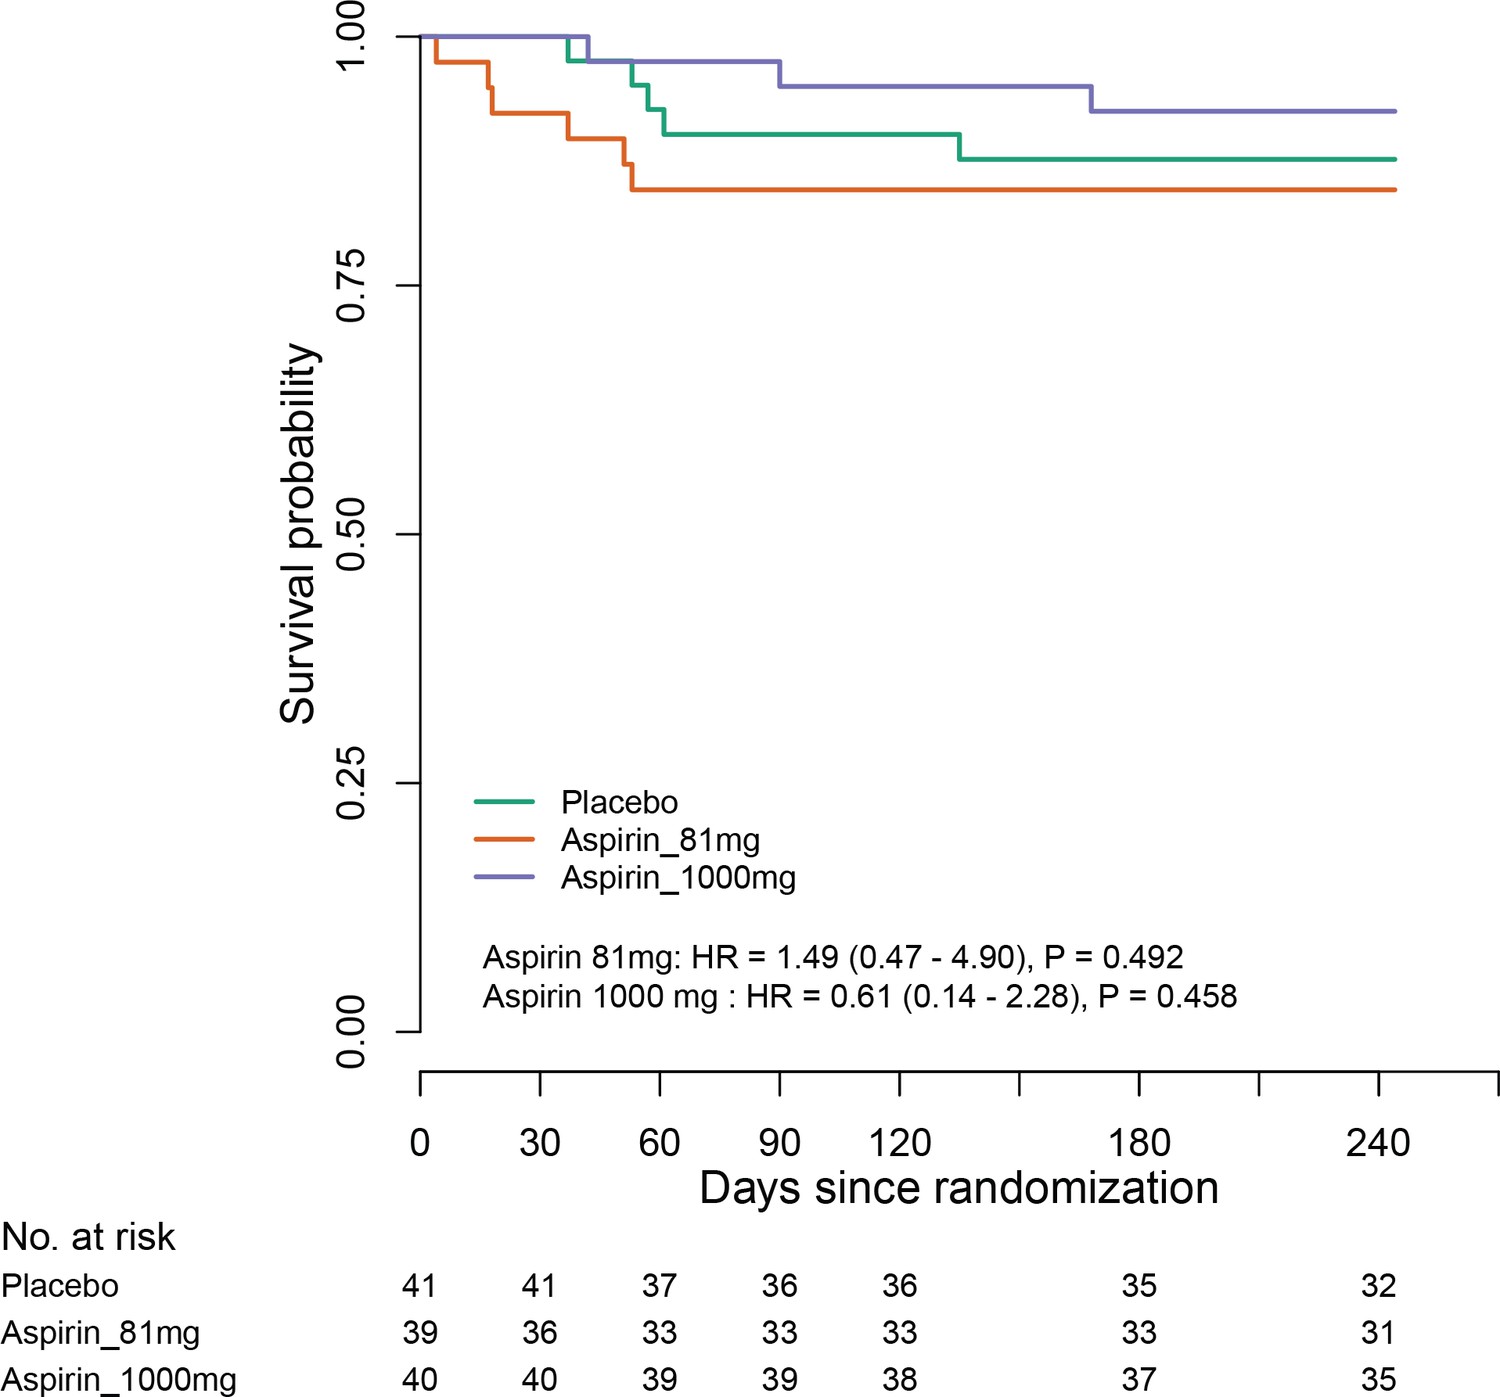
C (panel within Figure 2).
ITT population survival in each group over 8 months.
Figure 2—figure supplement 2
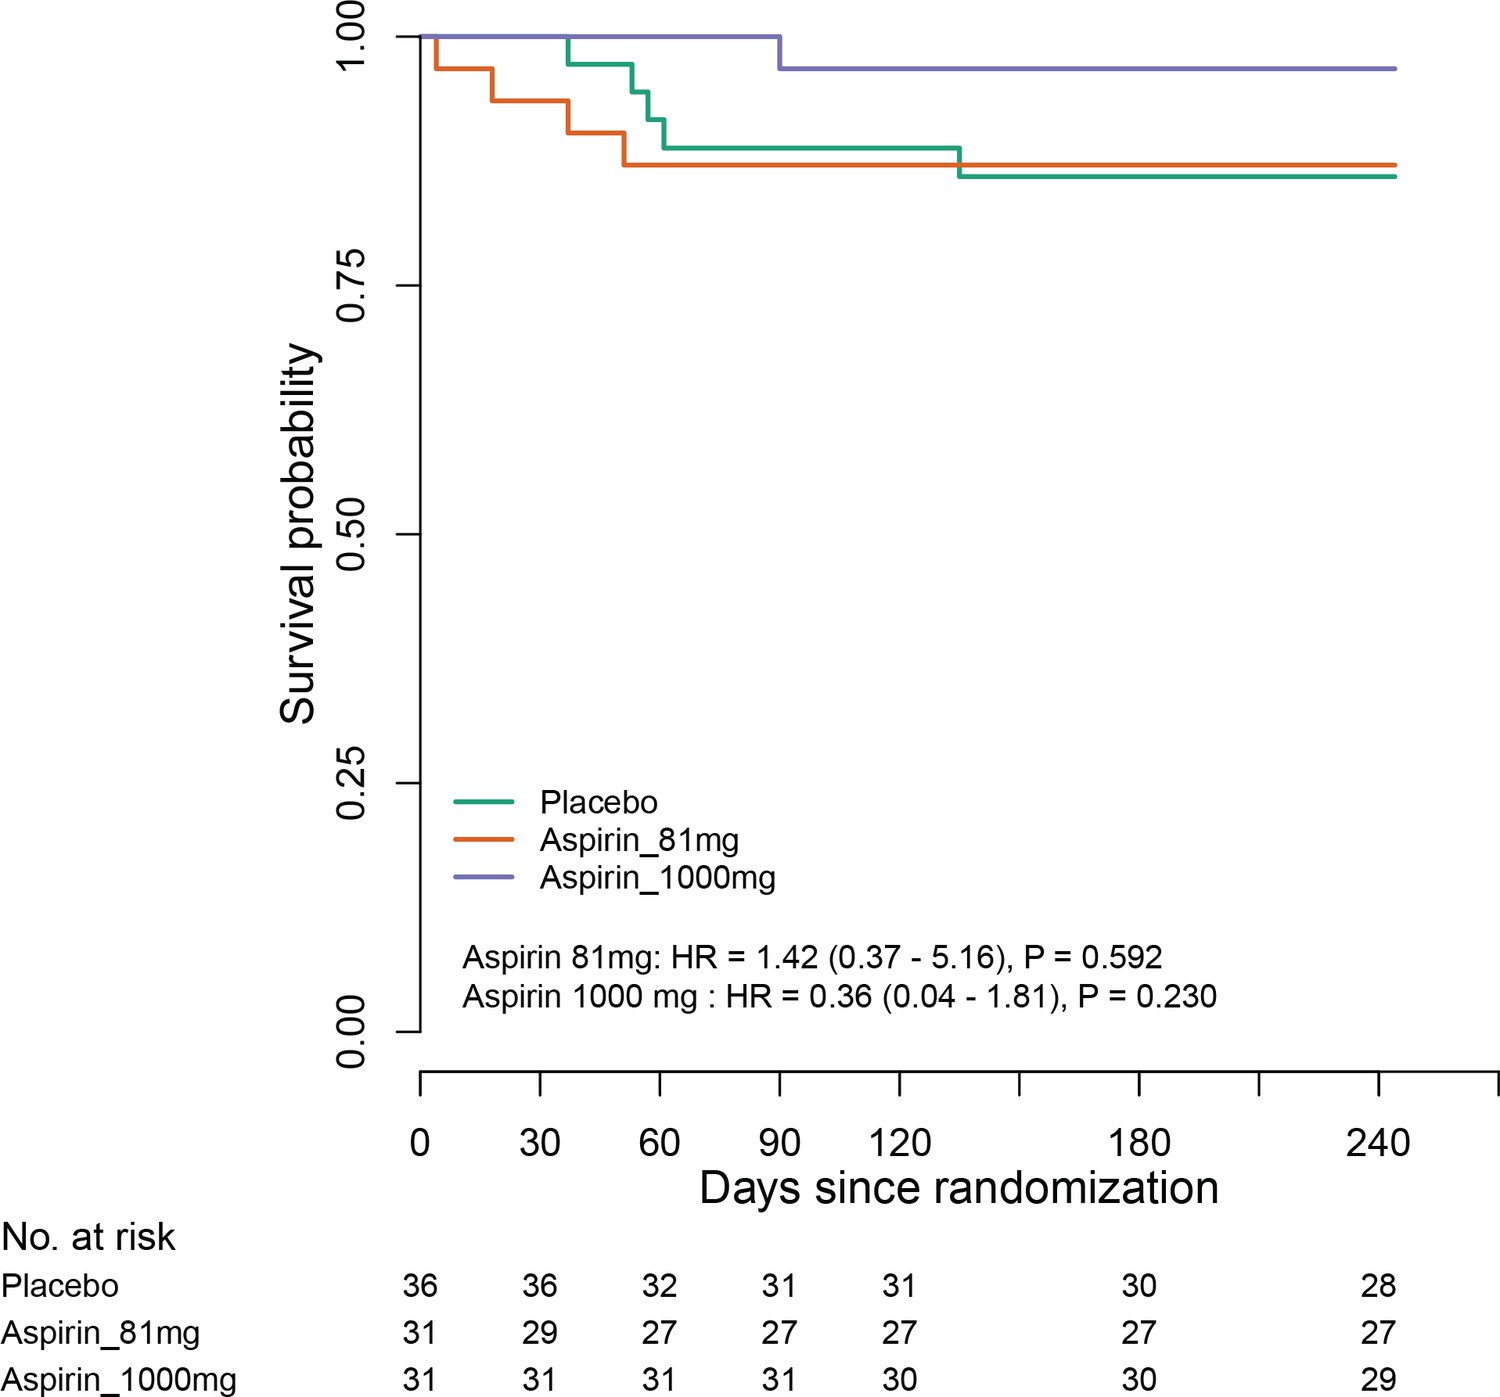
D (panel within Figure 2).
Per-protocol population survival in each group over 8 months.
Figure 3 with 1 supplement
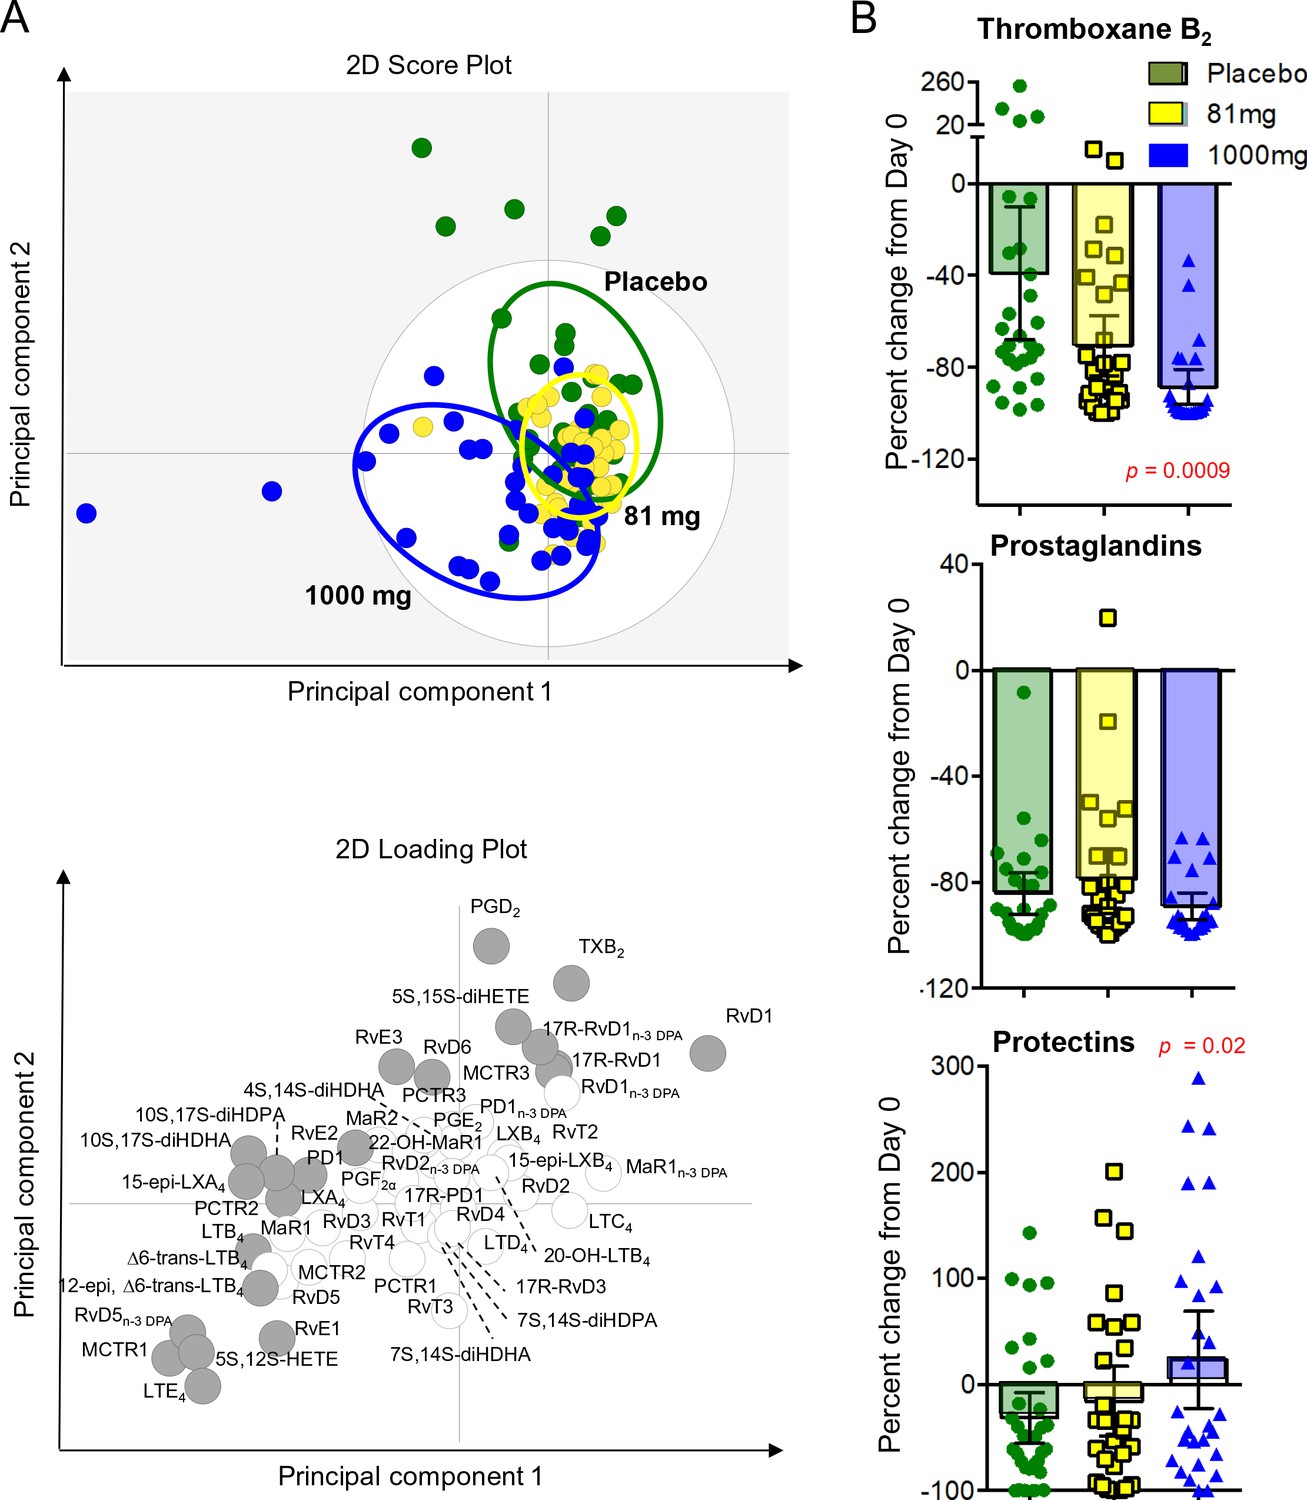
LCMS lipid mediator profiles in the CSF of adults with TBM according to treatment with aspirin or placebo.
CSF was collected from participants at baseline and 30 days after 81 mg, 1000 mg or placebo administration. (A) Partial least squares discriminant analysis 2-dimensional score plot of the distinct LM-SPM profiles identified in day 30 CSF at the indicated intervals (top panel) and corresponding 2-dimensional loading plot. Grey ellipse in the score plots denotes estimated 95% probability regions (bottom panel). Grey circles in the loading plot represent LM with a variable in importance score ≥ 1. (B) Relative regulation of Thromboxane B2 (the stable TXA2 further metabolite), Prostaglandins (PGD2, PGE2, PGF2) and Protectins (PD1, 17R-PD1, 22-OH-PD1, 10S, 17S-diHDHA, PCTR1, PCTR2 and PCTR3) by day 30 compared to baseline values (absolute values given in supplementary file 6). Results for B are mean ± s.e.m, n = 30 for placebo, n = 26 for 81 mg and n = 26 for 1000 mg group. Comparisons between treatment groups assessed using one-way ANOVA followed by multiple comparisons test. Only p-values<0.05 given in the figure (all other comparisons non-significant).
Figure 3—figure supplement 1
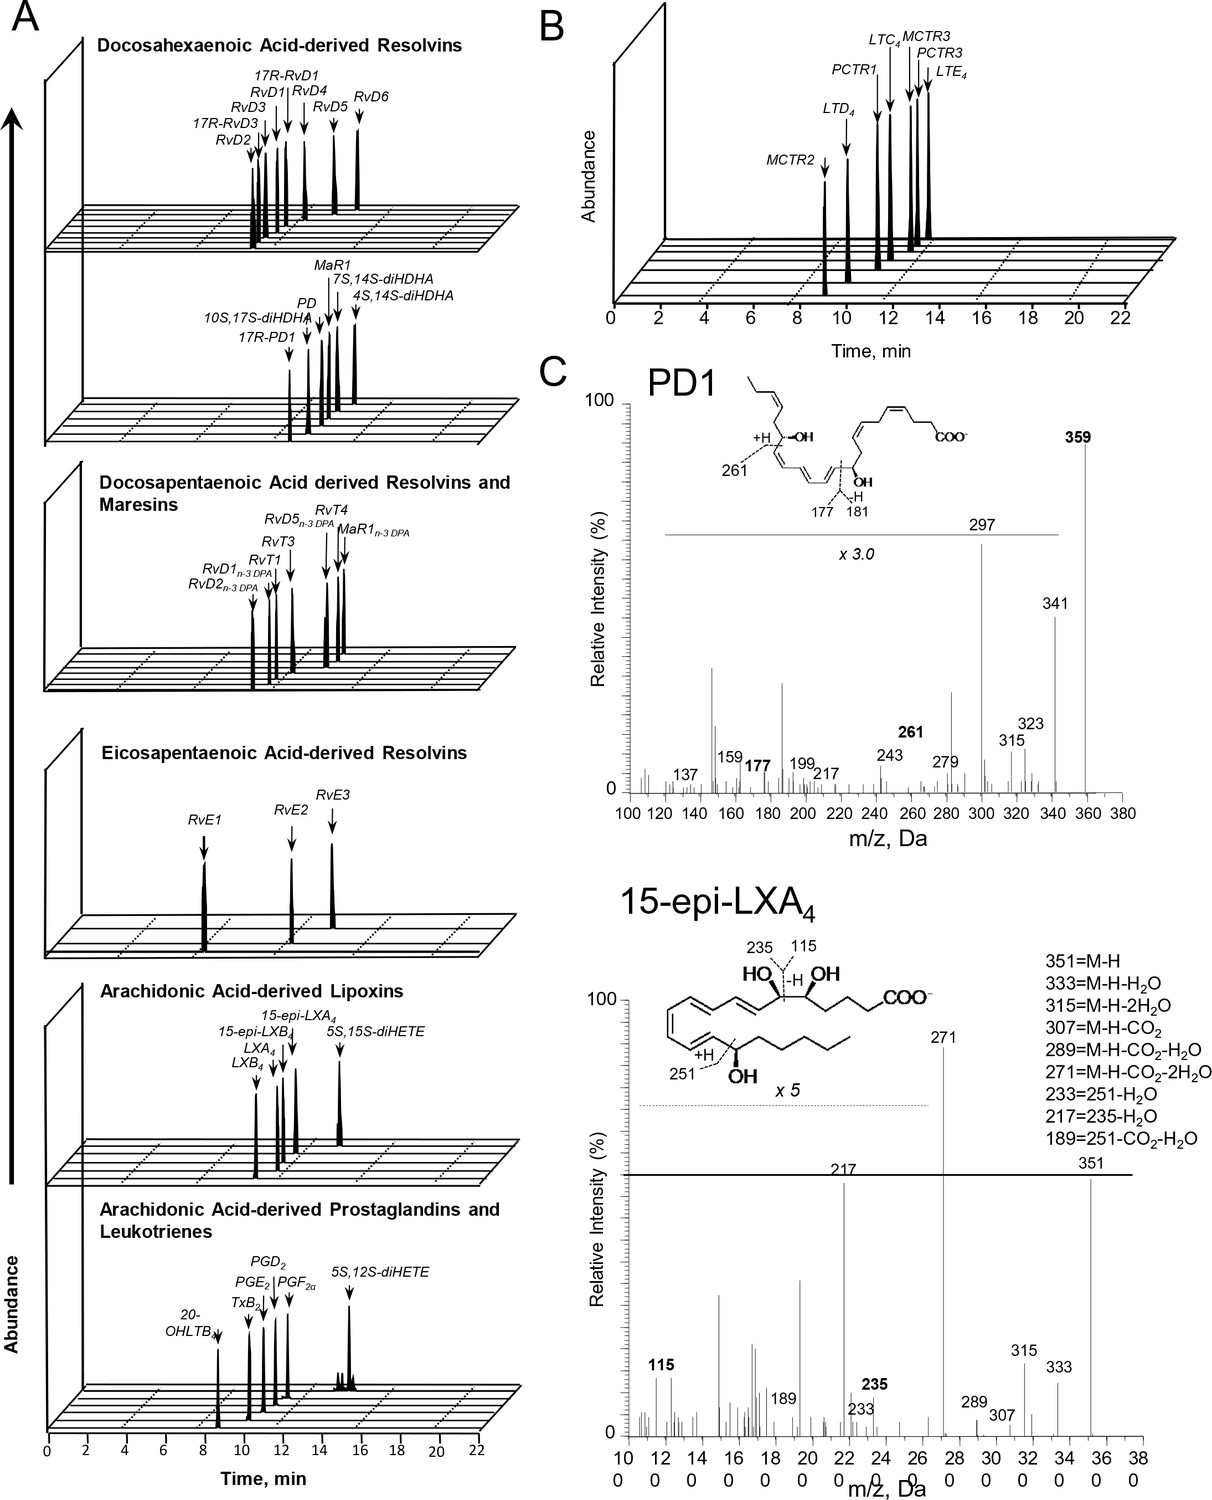
Lipid mediator profiles of CSF from participants with TBM.
Lipid mediators (LM) were extracted, identified and quantified using LM profiling. (A,B) Multiple reaction monitoring chromatograms for identified mediators. (C) tandem mass fragmentation spectra employed in the identification of PD1 and 15-epi-LXA4. Results are representative of 82 patients.
Tables
Table 1
Baseline characteristics.
https://doi.org/10.7554/eLife.33478.004| Variable | Placebo (n = 41) | 81 mg Aspirin (n = 39) | 1000 mg aspirin (n = 40) |
|---|---|---|---|
| Age (years) – median(IQR) | 43 (33–49) | 39 (34–48) | 40 (31–53) |
| Male gender- no.(%) | 27 (65.9) | 28 (71.8) | 24 (60.0) |
| Weight (kg) | 50 (44–60) | 50 (45–60) | 50 (47–58) |
| Previous tuberculosis treatment- no.(%) | 3 (7.3) | 1 (2.6) | 1 (2.5) |
| Illness duration (days) – median(IQR) | 10 (9–14) | 10 (8–15) | 10 (8–14) |
| MRC Grade: – no.(%)* - I - II - III | 16 (39.0) 20 (48.8) 5 (12.2) | 15 (38.5) 19 (48.7) 5 (12.8) | 15 (37.5) 20 (50.0) 5 (12.5) |
| Glasgow Coma Score (/15) – median(IQR) | 15 (14–15) | 15 (14–15) | 15 (14–15) |
| Cranial nerve palsy- no.(%) | 12 (29.3) | 9 (23.1) | 12 (30.0) |
| Hemiplegia- no.(%) | 3 (7.3) | 0 | 1 (2.5) |
| Paraplegia- no.(%) | 1 (2.4) | 4 (10.3) | 1 (2.5) |
| Chest radiograph: - no.(%) - Normal - Miliary tuberculosis - Other lung tuberculosis | 20 (48.8) 10 (25.0) 11 (26.8) | 25 (64.1) 3 (7.9) 10 (25.6) | 19 (47.5) 11 (28.2) 9 (22.5) |
| Plasma sodium (mmol/L) – median(IQR) | 127 (124–131) | 130 (125–134) | 129 (125–132) |
| CSF: – median(IQR) Total leucocyte count (/mm3) % neutrophils % lymphocytes Total protein (g/dL) Lactate Glucose CSF:plasma glucose | 311 (126–425) 22 (7–49) 78 (51–93) 1.4 (1.1–2.0) 5.0 (4.0–6.6) 2.1 (1.3–2.8) 0.3 (0.2–0.4) | 328 (120–605) 12 (6–29) 88 (71–94) 1.2 (0.9–1.9) 5.0 (3.5–6.9) 2.2 (1.7–2.9) 0.3 (0.2–0.5) | 180 (141–340) 14 (6–32) 84 (68–94) 1.6 (1.1–2.1) 4.9 (3.5–6.0) 2.4 (1.7–2.8) 0.4 (0.3–0.5) |
| Diagnostic category: - no.(%)† - Definite - Probable - Possible - Confirmed other diagnosis | 34 (82.9) 4 (9.8) 2 (4.9) 1 (2.4) | 29 (74.4) 5 (12.8) 4 (10.3) 1 (2.6) | 29 (72.5) 8 (20.0) 3 (7.5) 0 |
| Brain imaging performed: - no.(%) - Normal - Meningeal enhancement - Tuberculomas - Hydrocephalus - Infarcts | 40 15 (37.5%) 6 (15.0%) 7 (17.5%) 6 (15.0%) 17 (42.5%) | 35 13 (37.1%) 5 (14.3%) 4 (11.4%) 4 (11.4%) 8 (22.9%) | 39 17 (43.6%) 3 (7.7%) 4 (10.3%) 3 (7.7%) 15 (38.5%) |
| DST available– no.‡ - No isoniazid or rifampicin resistance – no.(%)§ - Isoniazid resistant- no.(%) - Rifampicin resistant- no.(%) - MDR- no.(%) | 19 12 (63.2) 6 (31.6) 1 (5.2) 0 | 9 7 (77.8) 1 (11.1) 0 1 (11.1) | 14 12 (86.7) 2 (14.3) 0 0 |
| Initial anti-tuberculosis drug treatment- no.(%)# - RHZES - RHZE - RHZL | 40 (97.6) 1 (2.4) 0 | 37 (94.9) 1 (2.6) 1 (2.6) | 40 (100.0) |
| LTA4H genotype available – no - CC - CT - TT | 41 21 (51.2) 16 (39.0) 4 (9.8) | 38 14 (36.8) 18 (47.4) 6 (15.8) | 37 16 (43.2) 20 (54.1) 1 (2.7) |
-
IQR = inter quartile range
*MRC denotes modified British Medical Research Council criteria. Grade I indicates a Glasgow coma score of 15 with no neurologic signs, grade II a score of 11 to 14 (or 15 with focal neurologic signs), and grade III a score of 10 or less.
-
†Diagnostic categories were assigned according to the consensus case definition (table S1) (Marais et al., 2010). Confirmed other diagnosis was only made based on microbiological evidence.
‡DST = drug susceptibility test.
-
§MDR (multidrug-resistance) is defined as resistance to at least both isoniazid and rifampicin. In all categories, other resistance may be present.
#Rifampicin (R), Isoniazid (H), Pyrazinamide, Ethambutol (E), Streptomycin (S).
Table 2
Primary safety and efficacy outcomes by 60 days from randomisation in the intention-to-treat population.
https://doi.org/10.7554/eLife.33478.005| Placebo (n = 41) | Aspirin 81 mg (n = 39) | Aspirin 1000 mg (n = 40) | Absolute risk difference [%] (95% confidence interval) | Overall comparison P-value | |
|---|---|---|---|---|---|
| Primary safety outcomes | |||||
| Gastro-intestinal bleeding or MRI-proven intracranial bleeding event* | 5/36 (13.9%) | 8/35 (22.9%) | 8/40 (20.0%) | Aspirin 81 mg vs placebo: 9.0% (-9.3 to 26.9%) Aspirin 1000 mg vs placebo: 6.1% (-11.5 to 22.8%) | 0.59 |
| Gastro-intestinal bleeding event | 5/38 (13.2%) | 7/35 (20.0 %) | 8/40 (20.0 %) | Aspirin 81 mg vs placebo: 6.8% (-10.5 to 24.4%) Aspirin 1000 mg vs placebo: 6.8% (-10.2 to 23.4%) | 0.71 |
| MRI-proven intracranial bleeding event | 0/35 (0%) | 1/32 (3.1%) | 0/38 (0%) | Aspirin 81 mg vs placebo: 3.1% (-7.1 to 15.7%) Aspirin 1000 mg vs placebo: 0.0% (-9.9 to 9.2%) | 0.30 |
| Primary efficacy outcomes | |||||
| New MRI-proven brain infarction or death | 11/38 (28.9%) | 8/36 (22.2%) | 6/38 (15.8%) | Aspirin 81 mg vs placebo: −6.7% (-25.7 to 13.1%) Aspirin 1000 mg vs placebo: −13.2% (-31.0 to 5.7%) | 0.40 |
| New MRI-proven brain infarction† | 8/35 (22.9%) | 2/30 (6.7%) | 5/37 (13.5%) | Aspirin 81 mg vs placebo: −16.2% (-33.1 to 2.0%) Aspirin 1000 mg vs placebo: −9.3% (-27.2 to 8.7%) | 0.18 |
| Death | 4/41 (9.8%) | 6/39 (15.4%) | 1/40 (2.5%) | Aspirin 81 mg vs placebo: 5.6% (-9.5 to 21.1%) Aspirin 1000 mg vs placebo: −7.3% (-20.2 to 4.7%) | 0.14 |
-
*Gastro-intestinal bleeding event data are missing for seven participants (three placebo, 4 aspirin 81 mg) because they either died or were lost to follow-up before day 60. MRI-proven new intracranial bleeding event or infarct data are missing for 15 subjects (6 Placebo, 7 Aspirin 81 mg, 2 Aspirin 1000 mg) because they either died (four placebo, 6 aspirin 81 mg, 1 aspirin 1000 mg), were lost to follow-up before day 60 (1 placebo), or they were too unwell to have scans within 60 ± 10 days (two placebo, 1 aspirin 81 mg, 2 aspirin 1000 mg). A participant was excluded from the analysis of the combined primary safety endpoint if they had missing data for both gastro-intestinal bleeding event and MRI-proven intracranial bleeding event, or if information about one event type is missing and the other event type did not occur (i.e. participants for which it is unclear due to missing data whether the combined event occurred or not are excluded to avoid under-estimation of the true safety risk).
†18* 18 participants (6 Placebo, 9 Aspirin 81 mg, 3 Aspirin 1000 mg) did not have MRI information at either baseline (±7 days) or day 60 (±10 days). For death status, the patient lost to follow-up after 57 days was treated as being alive. Patients were excluded from the combined primary efficacy endpoint if they were alive but MRI information was missing. One patient (Placebo) had both a new MRI-proven brain infarction event and death.
Table 3
Primary efficacy outcomes by 60 days from randomisation in the per-protocol population
https://doi.org/10.7554/eLife.33478.006| Placebo (n = 36) | Aspirin81mg (n = 31) | Aspirin1000mg (n = 31) | Absolute risk difference [%] (95% confidence interval) | Overall comparison P-value | |
|---|---|---|---|---|---|
| New MRI-proven brain infarction or death* | 10/34 (29.4%) | 6/31 (19.4%) | 3/30 (10.0%) | Aspirin 81 mg vs placebo: −10.1% (-29.7 to 11.0%) Aspirin 1000 mg vs placebo: −19.4% (-37.4 to 0.6%) | 0.16 |
| New MRI-proven brain infarction | 7/31 (22.6%) | 2/27 (7.4%) | 3/30 (10.0%) | Aspirin 81 mg vs placebo: −15.2% (-33.2 to 4.3%) Aspirin 1000 mg vs placebo: −12.6% (-31.0 to 6.6%) | 0.22 |
| Death | 4/36 (11.1%) | 4/31 (12.9%) | 0/31 (0%) | Aspirin 81 mg vs placebo: 1.8% (-14.4 to 19.1%) Aspirin 1000 mg vs placebo: −11.1% (-25.3 to 1.8%) | 0.11 |
-
*10 participants (five placebo, 4 aspirin 81 mg, 1 aspirin 1000 mg) did not have MRI information at either baseline (±7 days) or day 60 (±10 days). One participant (placebo) had both a new MRI-proven brain infraction event and death.
Table 4
Sub-group analyses of the primary efficacy outcome in the intention-to-treat population.
https://doi.org/10.7554/eLife.33478.010| Placebo (events/n (risk%)) | Aspirin 81 mg (events/n (risk%)) | Aspirin 1000 mg (events/n (risk%)) | P-value comparison | P-heterogeneity | |
|---|---|---|---|---|---|
| Diagnostic criteria - Definite - Probable/Possible | 11/32 (34.4%) 0/6 (0%) | 4/27 (14.8%) 3/8 (37.5%) | 3/28 (10.7%) 3/10 (30.0) | 0.06 0.30 | 0.01 |
| MRC Grade - I - II - III | 4/16 (25.0%) 4/17 (23.5%) 3/5 (60.0%) | 1/15 (6.7%) 4/17 (23.5%) 3/4 (75.0%) | 1/14 (7.1%) 4/19 (21.1%) 1/5 (20.0%) | 0.33 1.00 0.42 | 0.44 |
| Previous tuberculosis treatment - Yes - No | 1/2 (50.0%) 10/36 (27.8%) | 1/1 (100%) 7/35 (20.0%) | 0/1 (0%) 6/37 (16.2%) | 1.00 0.51 | 0.28 |
| Drug susceptibility* - MDR-TB - Rifampicin mono-resistance - Isoniazid resistance (with or without streptomycin resistance) - No or other resistance | 0/0 (0%) 0/1 (0%) 3/6 (50.0%) 5/10 (50.0%) | 1/1 (100%) 0/0 (0%) 1/1 (100%) 1/7 (14%) | 0/0 (0%) 0/0 (0%) 1/2 (50.0%) 1/12 (8%) | 1.00 0.09 | 0.17 |
| LTA4H genotype† - CC - CT - TT | 3/18 (16.7%) 7/16 (43.8%) 1/4 (25.0%) | 4/13 (30.8%) 3/16 (18.8%) 1/6 (16.7%) | 0/16 (0%) 5/19 (26.3%) 0/1 (0%) | 0.05 0.30 1 | 0.13 |
-
*4 participants not genotyped. P-value for the heterogeneity was obtained from likelihood ratio tests for an interaction term between treatment and the grouping variable in a logistic regression model.
†Outcomes unavailable in two participants in the placebo group with DST available (one lost to follow-up at day 57 and one did not have MRI information at day 60).
Table 5
Summary of disability and death by day 60 and by 8 months in the ITT and per-protocol populations
https://doi.org/10.7554/eLife.33478.011| Placebo (N = 41) | Aspirin 81 mg (N = 39) | Aspirin 1000 mg (N = 40) | P-value | |
|---|---|---|---|---|
| ITT population | ||||
| Rankin score categories by 60 days* | ||||
| - Complete recovery | 6/37 (16.2%) | 11/39 (28.2%) | 9/40 (22.5%) | |
| - Intermediate | 22/37 (59.5%) | 16/39 (41.0%) | 22/40 (55.0%) | 0.61 |
| - Death or severely disabled | 9/37 (24.3%) | 12/39 (30.8%) | 9/40 (22.5%) | |
| Rankin score categories by 8 months | ||||
| - Complete recovery | 18/39 (46.1%) | 23/39 (59.0%) | 22/40 (55.0%) | |
| - Intermediate | 10/39 (24.6%) | 7/39 (17.95%) | 11/40 (27.5%) | 0.29 |
| - Death or severely disabled | 11/39 (28.2%) | 9/39 (23.1%) | 7/40 (17.5%) | |
| Per-protocol population | ||||
| Rankin score categories at 60 days | ||||
| - Complete recovery | 6/33 (18.2%) | 9/31 (29.0%) | 7/31 (22.6%) | |
| - Intermediate | 21/33 (63.6%) | 15/31 (48.4%) | 19/31 (61.3%) | 0.69 |
| - Death or severely disabled | 6/33 (18.2%) | 7/31 (22.6%) | 5/31 (16.1%) | |
| Rankin score categories by 8 months | ||||
| - Complete recovery | 17/35 (48.6%) | 20/31 (64.5%) | 19/31 (61.3%) | |
| - Intermediate | 9/35 (25.7%) | 5/31 (16.1%) | 9/31 (29.0%) | 0.13 |
| - Death or severely disabled | 9/35 (25.7%) | 6/31 (19.4%) | 3/31 (9.7%) | |
-
*Complete recovery = Rankin score 0; Intermediate = Rankin score 1 or 2; Death or severely disabled = Rankin score 3–6. Three participants in the placebo group missed their day 60 assessment and two were lost to follow-up at day 57 and 217. P-values refer to a linear-by-linear trend test for disability scores
Table 6
Summary of clinical grade 3 or four adverse events by randomised group
https://doi.org/10.7554/eLife.33478.012| Event | Placebo (n = 41) No. patients (%) (number of events) | Aspirin 81 mg (n = 39) No. patients (%) (number of events) | Aspirin 1000 mg (n = 40) No. patients (%) (number of events) | P-value comparison |
|---|---|---|---|---|
| All events | 11 (26.8%) (17) | 17 (43.6%) (33) | 9 (22.5%) (16) | 0.11 |
| Allergic events - Rash - Stevens Johnsons syndrome* | 1 (2.4%) (1) 1 (2.4%) (1) 0 | 1 (2.6%) (2) 0 1 (2.6%) (2) | 0 | 0.77 |
| Cardiac events - Hypotension | 0 | 3 (7.7%) (3) 3 (7.7%) (3) | 1 (2.5%) (1) | 0.08 |
| Electrolyte events - Hyponatraemia - Hypokalaemia | 1 (2.4%) (1) 1 (2.4) (1) 0 | 4 (10.3%) (4) 4 (10.3%) (4) 0 | 3 (7.5%) (3) 2 (5.0%) (2) 1 (2.5%) (1) | 0.31 |
| Gastrointestinal events - Vomiting blood - Melena | 2 (4.9%) (2) 2 (4.9%) (2) 0 | 1 (2.6%) (1) 1 (2.6%) (1) 0 | 1 (2.5%) (1) 0 1 (2.5%) (1) | 1.00 |
| Hepatic events - Hepatitis | 1 (2.4%) (2) 1 (2.4%) (2) | 1 (2.6%) (1) 1 (2.6%) (1) | 0 | 0.77 |
| Neurological events - Hemiparesis - Paraparesis - Cranial nerve palsy - Fall in GCS ≥ 2 points for ≥ 2 days | 4 (9.8%) (5) 0 1 (2.4%) (1) 0 2 (4.9%) (2) | 9 (23.1%) (13) 1 (2.6%) (1) 2 (5.1%) (2) 1 (2.6%) (1) 5 (12.8%) (5) | 3 (7.5%) (5) 0 1 (2.5%) (1) 0 2 (5.0%) (2) | 0.11 |
| Respiratory events - Pneumonia - Respiratory failure | 4 (9.8%) (4) 0 4 (9.8%) (4) | 8 (20.5%) (9) 1 (2.6%) (1) 8 (20.5%) (1) | 4 (10.0%) (4) 0 4 (10.0%) (4) | 0.30 |
| Other events† | 2 (4.9%) (2) | 0 | 2 (5.0%) (2) | 0.54 |
-
*Event related to rifampicin, not study drug
P-values refer to Fisher’s exact test for the number of participants with at least one event.
Additional files
-
Supplementary file 1
Table S1 Tuberculous meningitis diagnostic criteria
- https://doi.org/10.7554/eLife.33478.015
-
Supplementary file 2
Table S2 Reasons for exclusion of screened patients from the trial
- https://doi.org/10.7554/eLife.33478.016
-
Supplementary file 3
Table S3 Summary of adverse events related, or possibly related, to aspirin
- https://doi.org/10.7554/eLife.33478.017
-
Supplementary file 4
Table S4 Full Rankin scores by treatment group by day 60 and 8 months in the ITT population
- https://doi.org/10.7554/eLife.33478.018
-
Supplementary file 5
Table S5 Other MRI brain findings by treatment group on days 60 and month eight in the ITT population
- https://doi.org/10.7554/eLife.33478.019
-
Supplementary file 6
Table S6 CSF individual lipid mediator Profiles at baseline and 30 days post aspirin and placebo administration†
- https://doi.org/10.7554/eLife.33478.020
-
Supplementary file 7
Full trial protocol.
- https://doi.org/10.7554/eLife.33478.021
-
Reporting standard
- https://doi.org/10.7554/eLife.33478.022
-
Transparent reporting form
- https://doi.org/10.7554/eLife.33478.023
Download links
A two-part list of links to download the article, or parts of the article, in various formats.
Downloads (link to download the article as PDF)
Open citations (links to open the citations from this article in various online reference manager services)
Cite this article (links to download the citations from this article in formats compatible with various reference manager tools)
A randomised double blind placebo controlled phase 2 trial of adjunctive aspirin for tuberculous meningitis in HIV-uninfected adults
eLife 7:e33478.
https://doi.org/10.7554/eLife.33478


