Extensive transmission of microbes along the gastrointestinal tract
- European Molecular Biology Laboratory, Germany
- European Molecular Biology Laboratory and Faculty of Biosciences, Heidelberg University, Germany
- APHP and UPEC Université Paris-Est Créteil, France
- Luxembourg Centre for Systems Biomedicine, Luxembourg
- Centre Hospitalier de Luxembourg, Luxembourg
- Max Delbrück Centre for Molecular Medicine, Germany
- European Molecular Biology Laboratory and University Hospital Heidelberg, Germany
- University of Würzburg, Germany
Figures
Figure 1 with 1 supplement
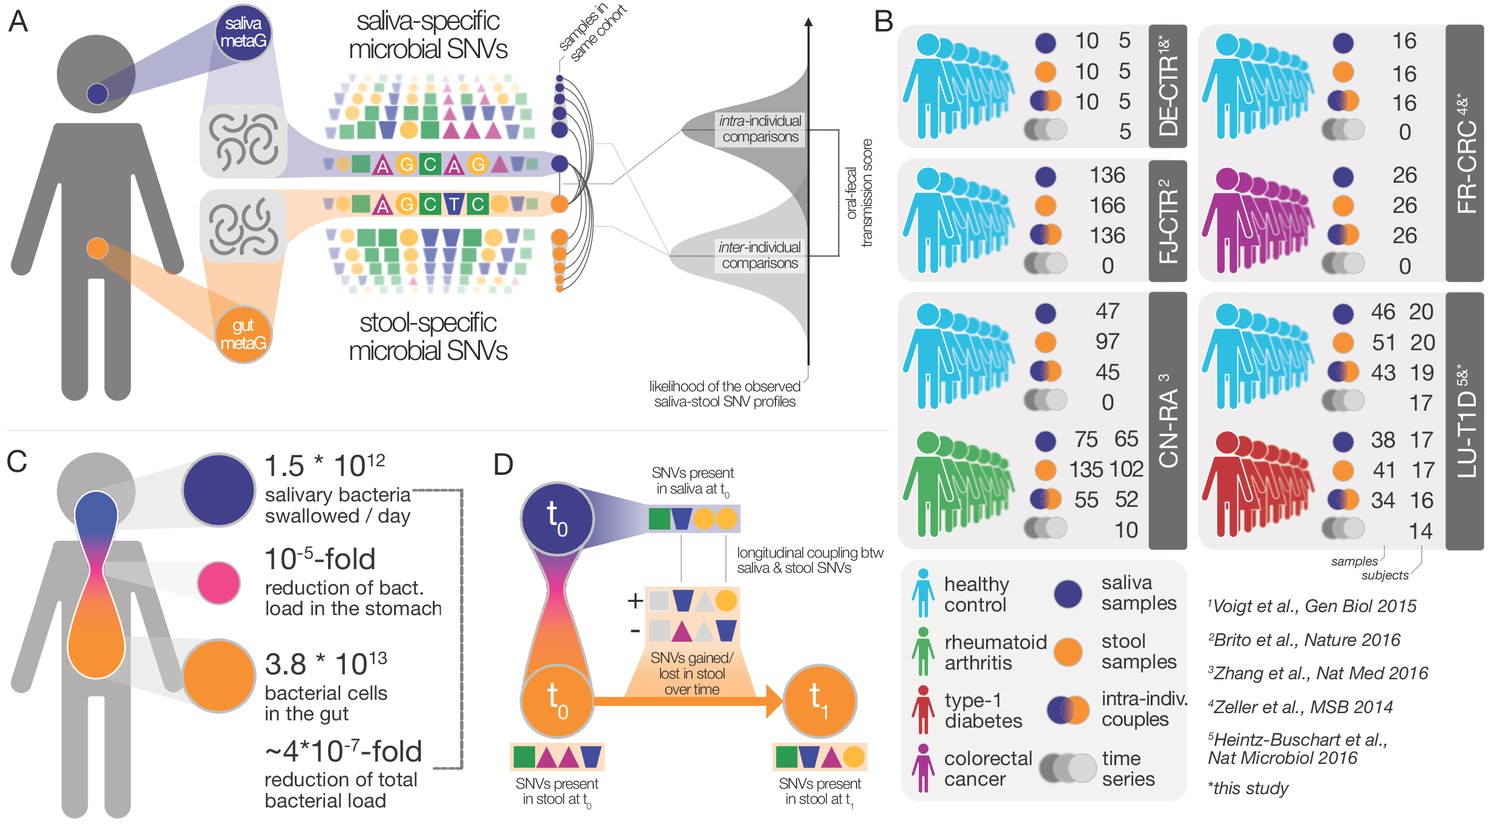
Data and workflow overview.
(A) Oral-fecal transmission scores were calculated from salivary and fecal microbial SNV profiles. (B) Cohort and dataset overview. For longitudinal cohorts (DE-CTR, CN-RA and LU-T1D), both the total number of samples and the number of individuals are shown, as well as the number of individuals considered in time-series analyses. (C) Salivary and fecal microbial loads allow the calculation of physiologically expected levels of ‘passive’ microbial transmission (i.e., by ingestion, without growth). (D) The longitudinal coupling of microbial SNVs between salivary and fecal samples was used to infer transmission directionality and oral-fecal transmission rates (see Materials and methods).
Figure 1—figure supplement 1
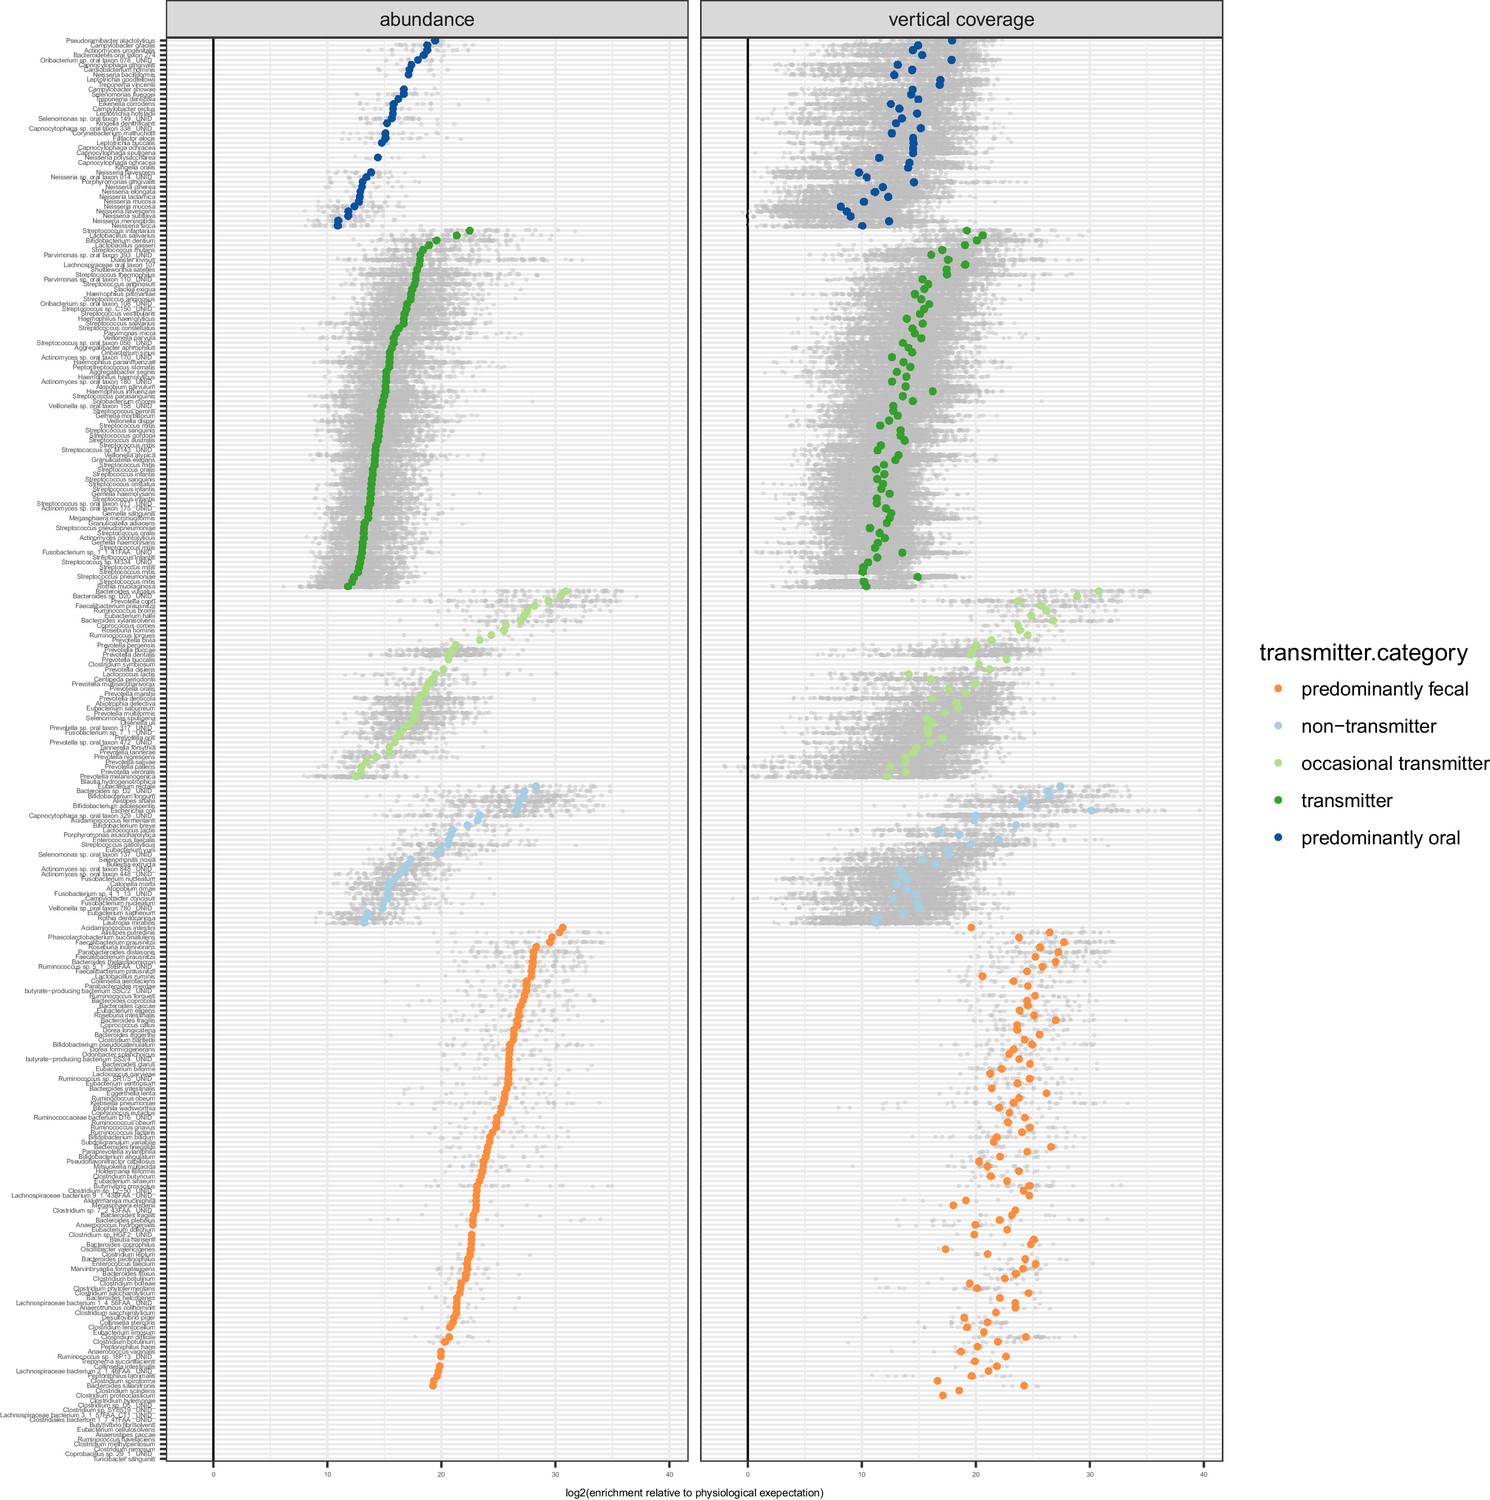
Enrichment of oral species in the gut.
Relative to physiologically expected levels of ‘passive’ transmission (see Figure 1C), all tested species with paired observations (in saliva and stool of the same individual) showed a fecal enrichment by several orders of magnitude. The fecal enrichment (x axis) is shown on a log2 scale, so values approximate the effective number of cell divisions (without cell deaths) necessary to account for observed fecal levels based on matched oral samples. The left plot shows enrichment purely based on relative salivary and fecal abundance. On the right, the average oral and fecal depths of uniquely mapping reads is used as a reference, normalised by genome size.
Figure 2 with 5 supplements
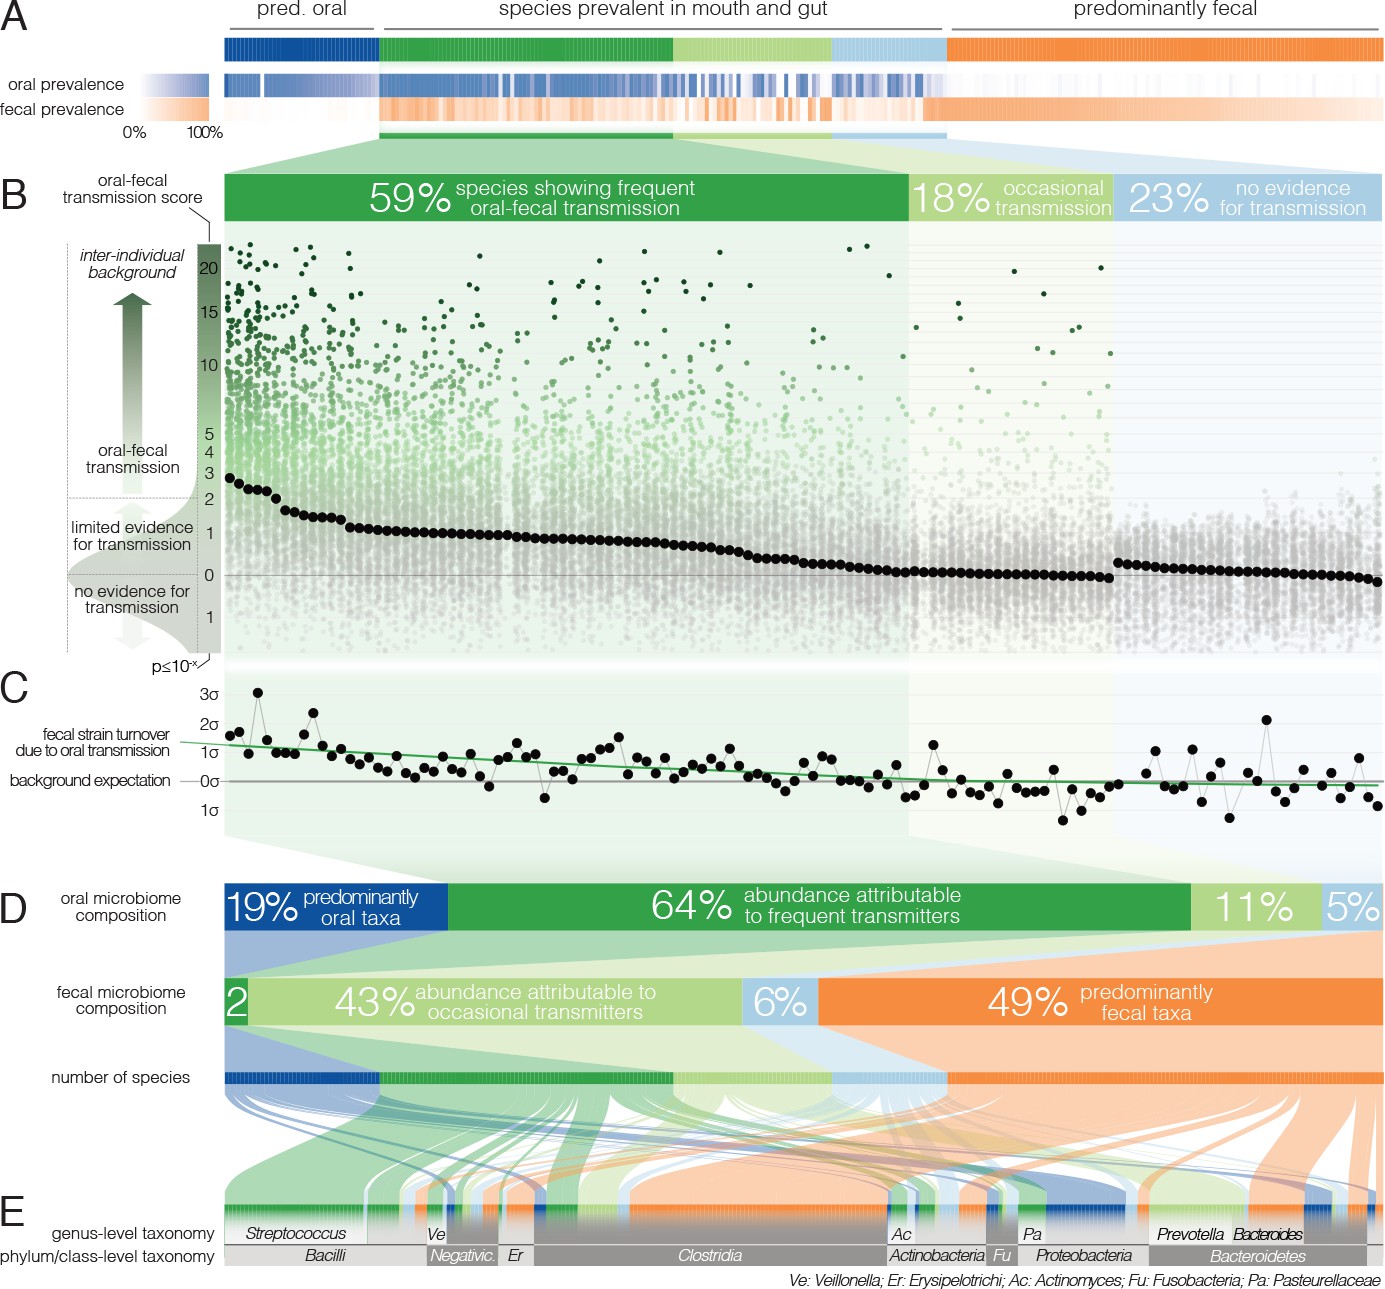
Oral-fecal transmission is common across a wide range of phylogenetically diverse species.
(A) Among 310 tested species, 125 were prevalent in both the mouth and gut across subjects. (B) 77% of these formed coherent strain populations between both habitats, when viewed across all tested subjects (‘frequent’ transmitters) or at least in some (‘occasional’ transmitters), as evidenced by oral-fecal transmission scores based on intra-individual SNV overlap against an inter-individual background (see Materials and methods). (C) Oral-to-fecal transmission rates, as inferred from longitudinal coupling of oral and gut SNVs (see Materials and methods), exceeded background levels for transmitted taxa, even at conservative lower estimates. (D) On average, transmissible taxa accounted for a large fraction of classifiable microbial abundance in both the oral cavity and gut. (E) Oral-fecal transmissibility was largely a clade-wise trait at genus or family ranks, but common across bacterial phyla.
Figure 2—figure supplement 1
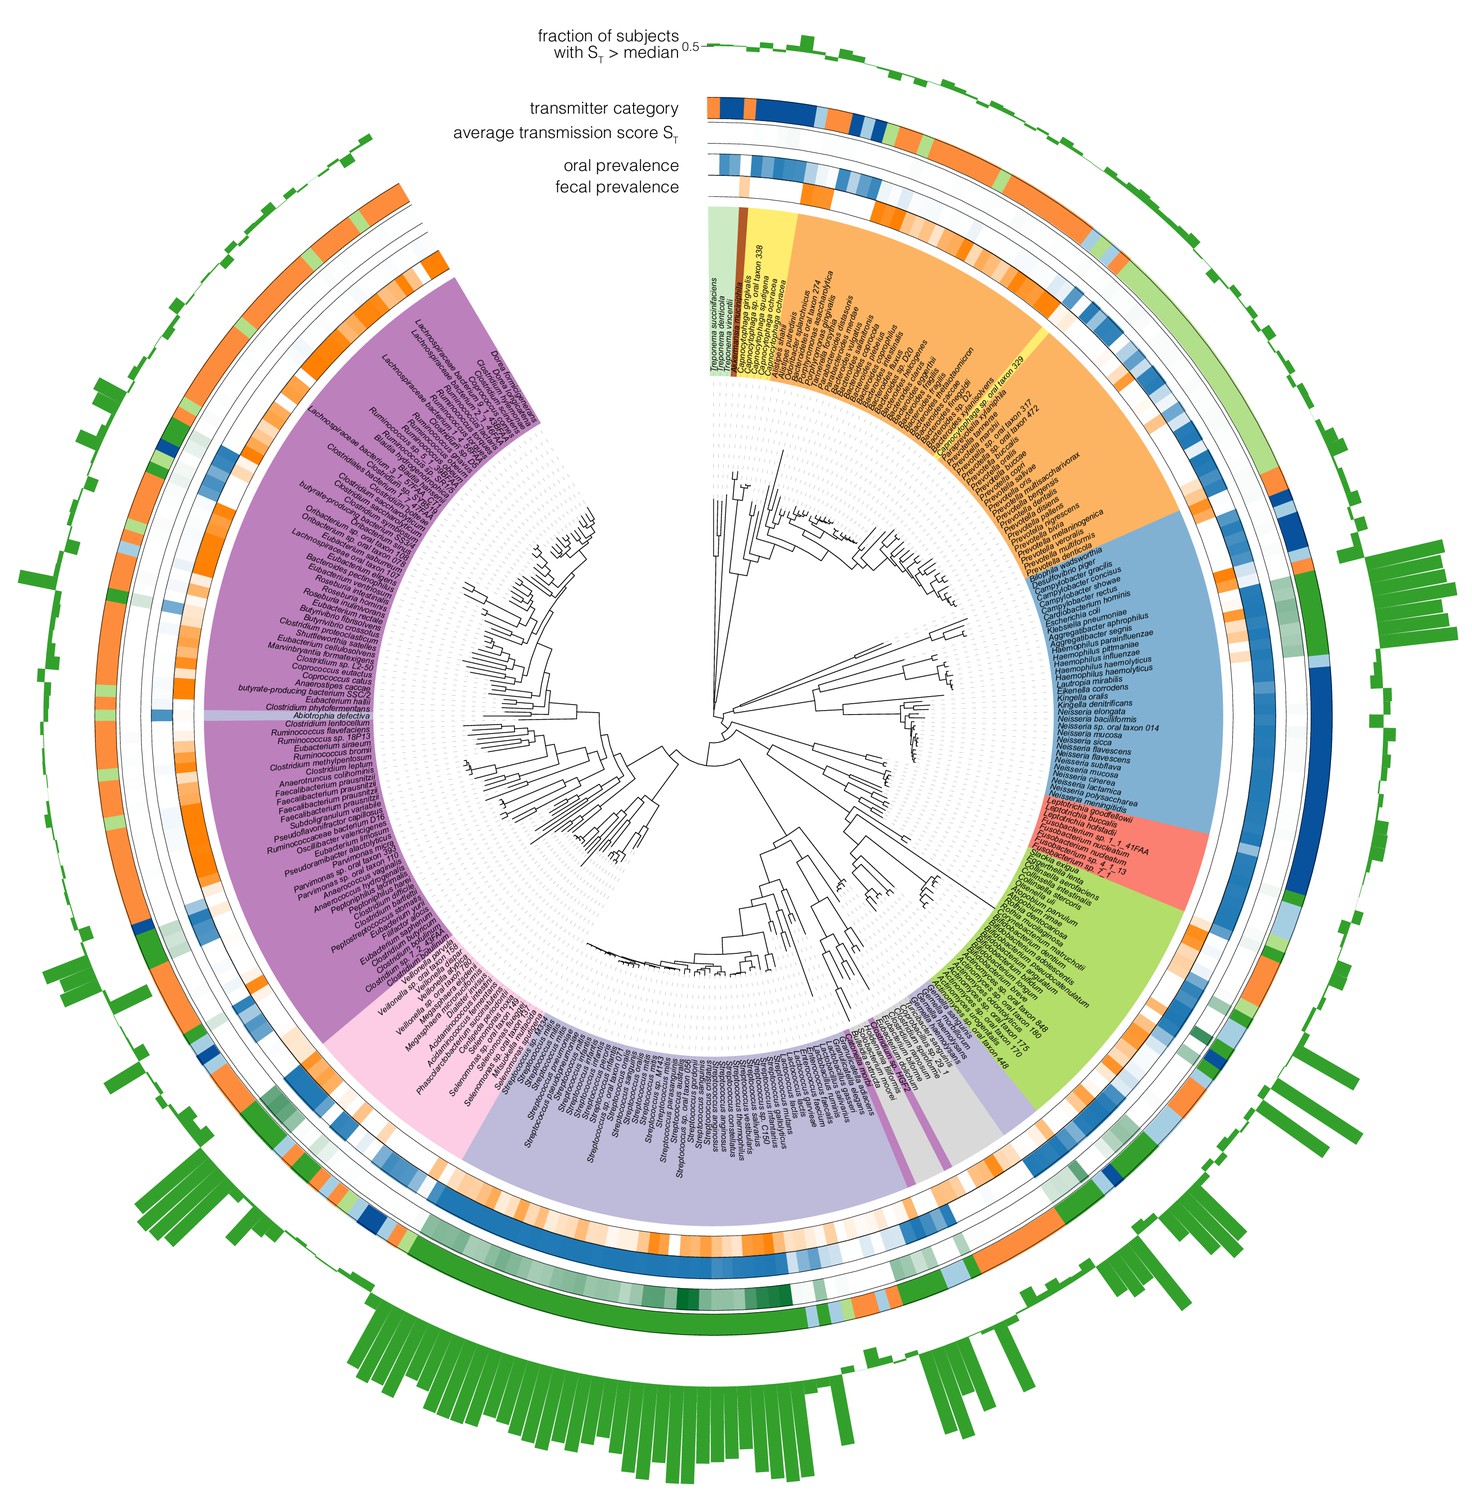
Phylogenetic distribution of oral-fecal transmission.
A maximum likelihood phylogenetic tree of the species tested in this study (see Supplementary file 2 and Materials and methods). Annotations, from inside to outside (colour scales as in the main text): fecal species prevalence (fraction of individuals in which the species was detectable in feces); oral prevalence; average transmission score across subjects (see Figure 2C); transmitter category (see Figure 2); fraction of individuals in which the observed transmission score exceeded median background transmission scores. The visualization was generated using iTol (Letunic and Bork, 2016). Scalable, interactive versions of the full tree and per-phylum subtrees are available online (http://itol.embl.de/shared_projects.cgi; password-less login ‘tsbschm’).
Figure 2—figure supplement 2
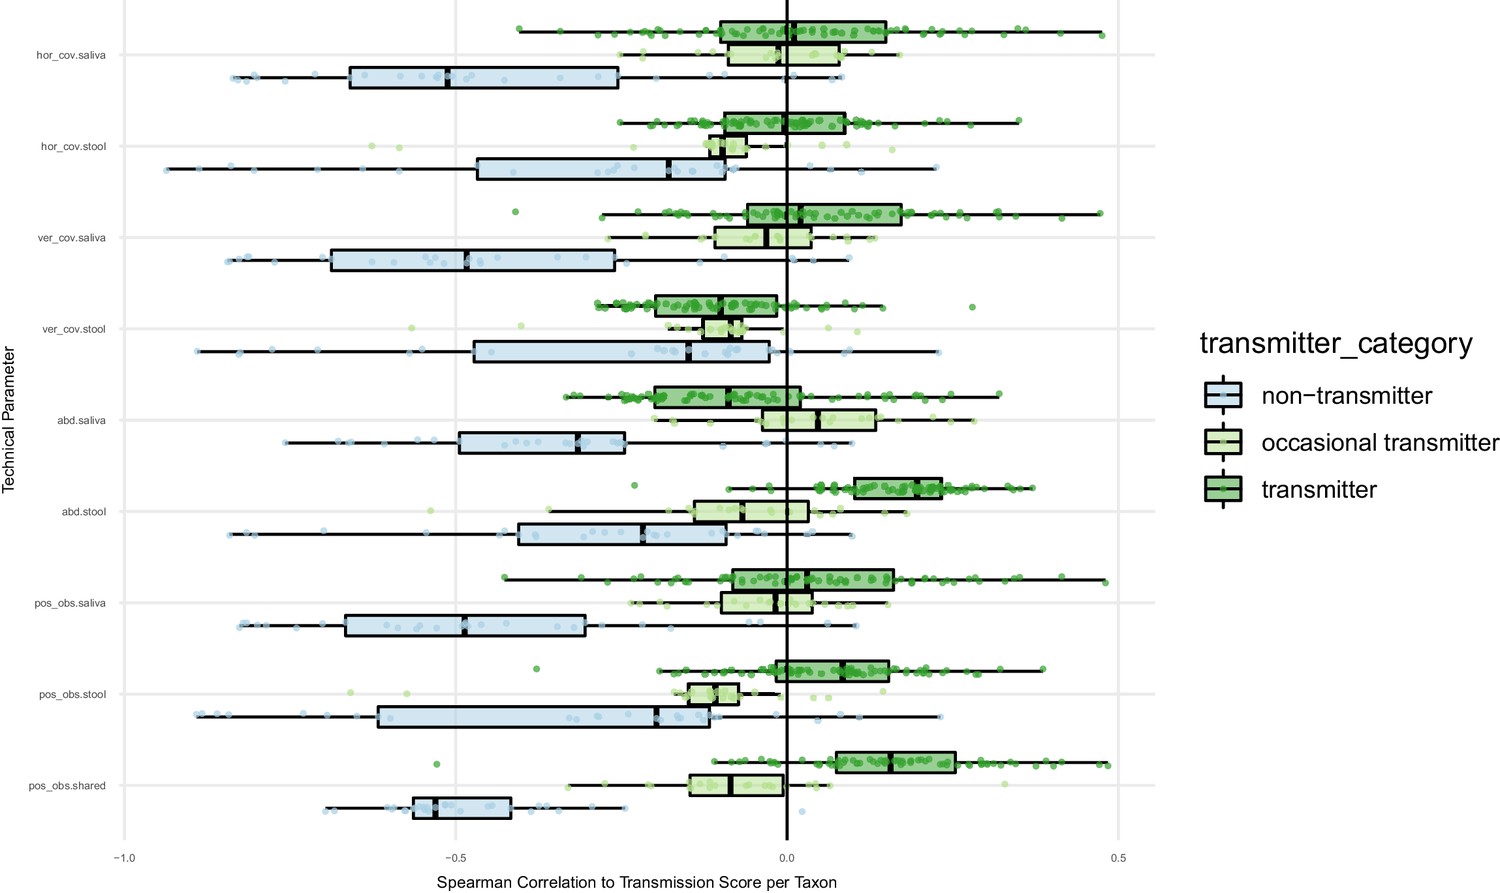
Oral-fecal transmission scores are independent of technical covariates.
Spearman correlations of oral-fecal transmission scores (see Materials and methods) with putative technical covariates per taxon across subjects. On average, horizontal (breadth) and vertical (depth) genome mapping coverage did not correlate with transmission scores for transmitting taxa when viewed across subjects, and were anti-correlated for non-transmitting taxa (i.e., deeper coverage reinforced the negative signal for these taxa). In line with this, the total number of observed SNV positions in each site anti-correlated with transmission scores for non-transmitters, and mildly correlated for transmitters. Taxon relative abundance of transmitters in stool tended to correlate positively with transmission scores; arguably, this is a biological rather than a technical effect, as higher transmission rates coincide with higher fecal abundance of transmitted taxa. The same applies to intra-individually shared genome coverage which is likewise expected to coincide with oral-fecal strain overlap.
Figure 2—figure supplement 3

Longitudinal stability of SNV profiles per species in saliva and stool.
SNV overlap per taxon and intra-individual time series, normalised as a standard Z score across an inter-individual background. Median Z scores are highlighted.
Figure 2—figure supplement 4
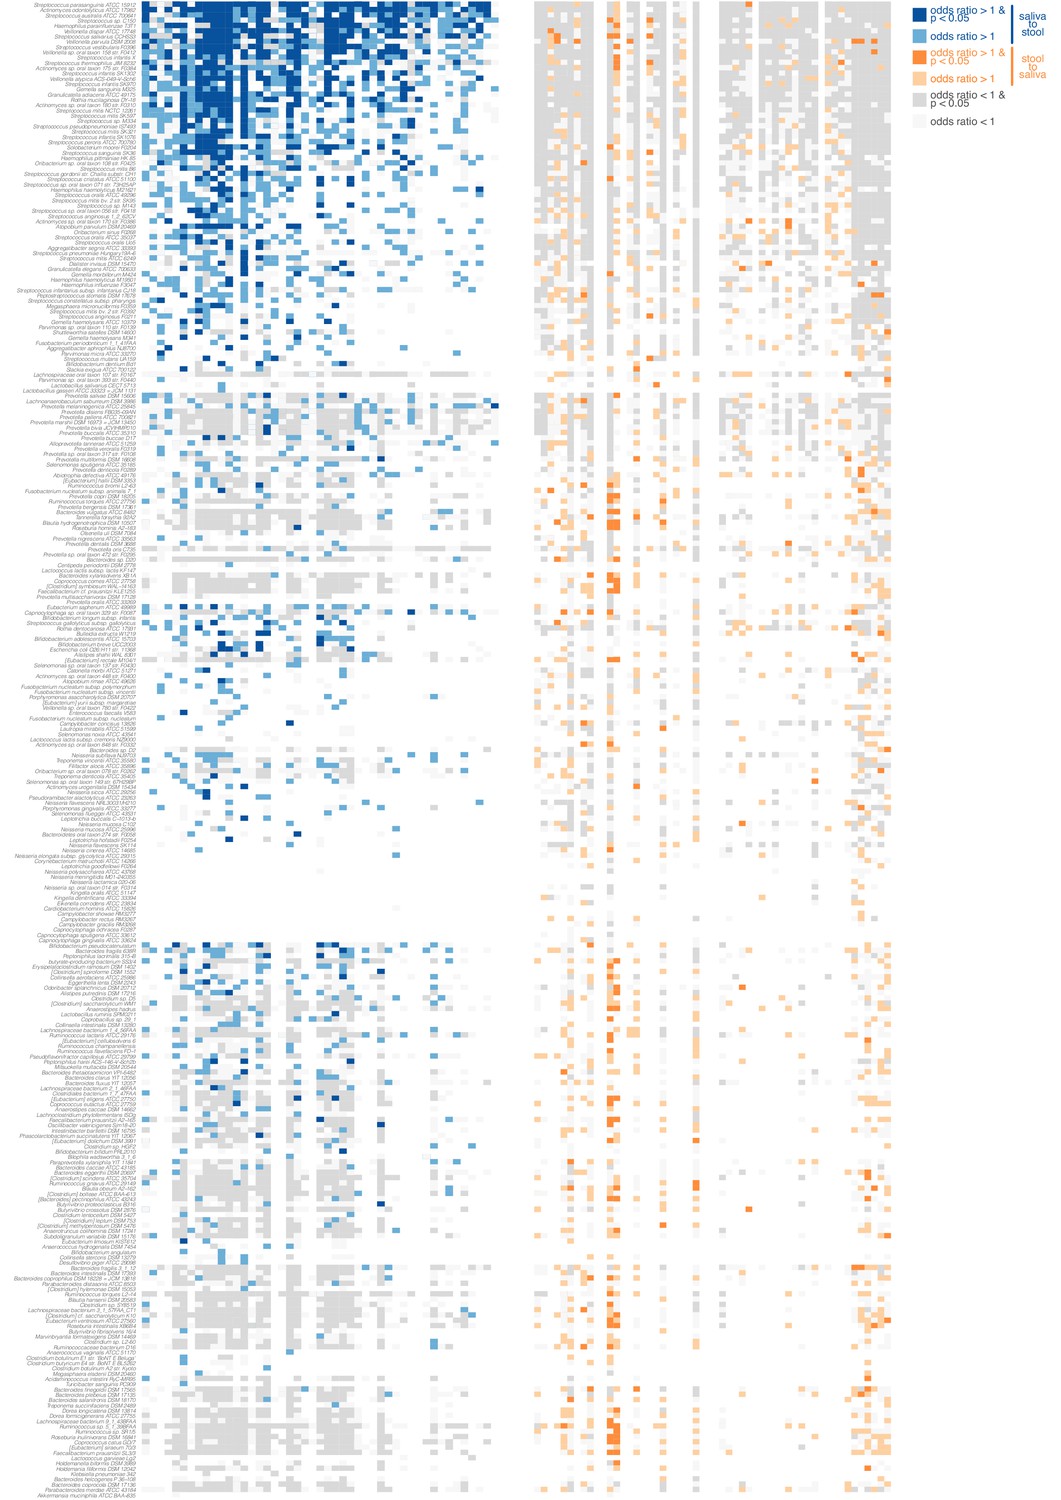
Directionality of transmission, as inferred from longitudinal data.
The longitudinal coupling of oral and fecal SNVs was assessed from longitudinal source-sink sample triplets (see Materials and methods, Figure 1D). The heatmaps show data on oral-to-fecal (left, blue) and fecal-to-oral (right, orange) coupling. Taxa (y axis) are sorted by transmission category analogous to Figure 2 (top to bottom, frequent transmitters, occasional transmitters, non-transmitters, predominantly oral, predominantly fecal); subjects (x axis) are sorted left to right by decreasing evidence for oral-fecal coupling. Colors indicate (significant) positive odds ratios for oral-to-fecal (blue) and fecal-to-oral (orange) coupling, negative odds ratios (grey), or missing/insufficient data (white). Frequent transmitters generally showed indications of oral-to-fecal coupling, but not vice versa. For the remaining taxa, the trend was similar, but less pronounced.
Figure 2—figure supplement 5
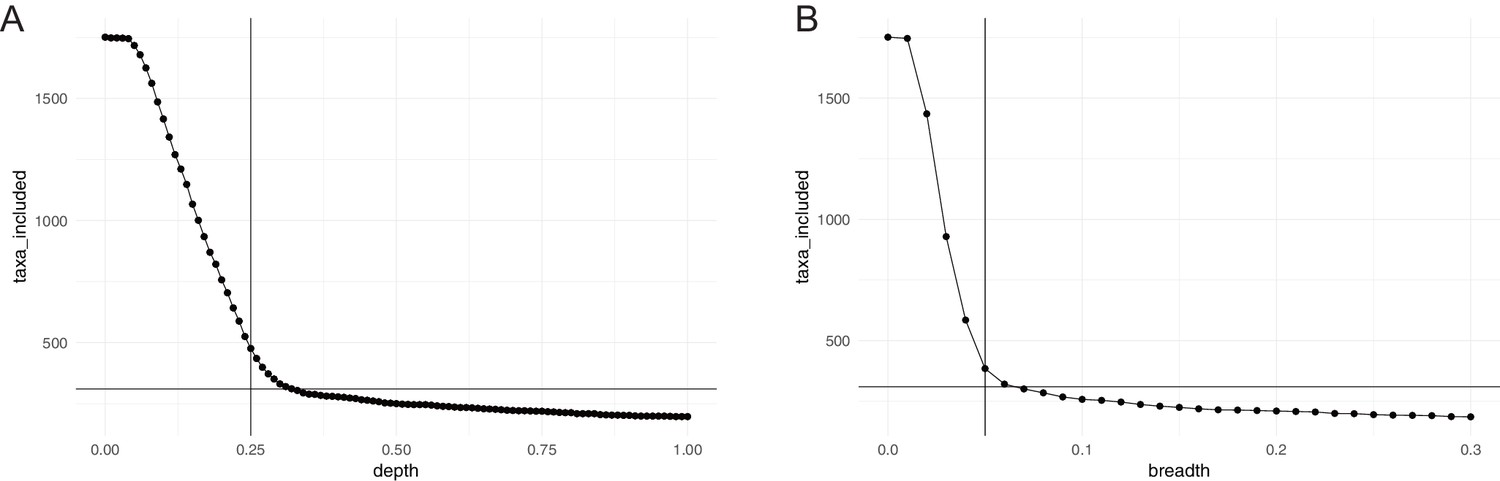
Horizontal (breadth) and vertical (depth) coverage cutoffs.
To be considered in our study, a species had to meet three criteria in at least 10% of all considered samples: relative abundance >10−6; average vertical genome coverage (depth) ≥0.25 x; horizontal genome coverage (breadth) ≥5%. The panels show the number of taxa meeting the (A) depth and (B) breadth criterion alone, as a function of coverage. The chosen cutoffs and final number of taxa considered (310) are indicated.
Figure 3 with 1 supplement
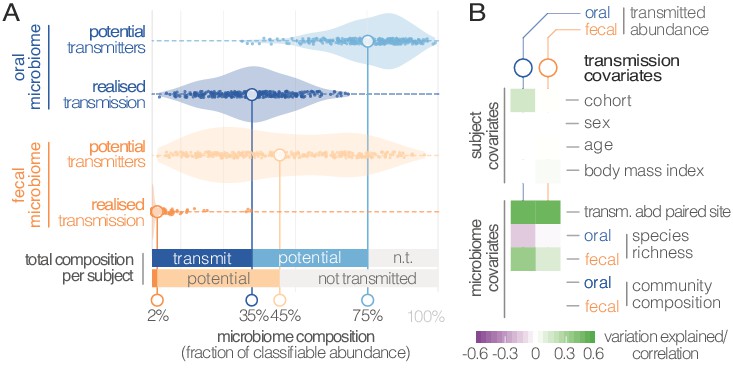
Oral-fecal transmission is extensive, with high levels of variation across individuals.
(A) Potentially transmissible species on average accounted for 75% and 45% of known microbes in salivary and fecal samples, respectively. Among these, realised transmitters were defined as strains that could be traced within subjects with confidence (given detection limits, see Materials and methods). (B) Tests for the association of transmission levels in mouth and gut to subject-level covariates (ANOVA, relative sum of squares), to each other (ρSpearman), with oral and fecal community richness (ρSpearman), and with oral and fecal community composition (distance-based redundancy analysis on Bray-Curtis dissimilarities, blocked by cohort, relative sum of squares).
Figure 3—figure supplement 1
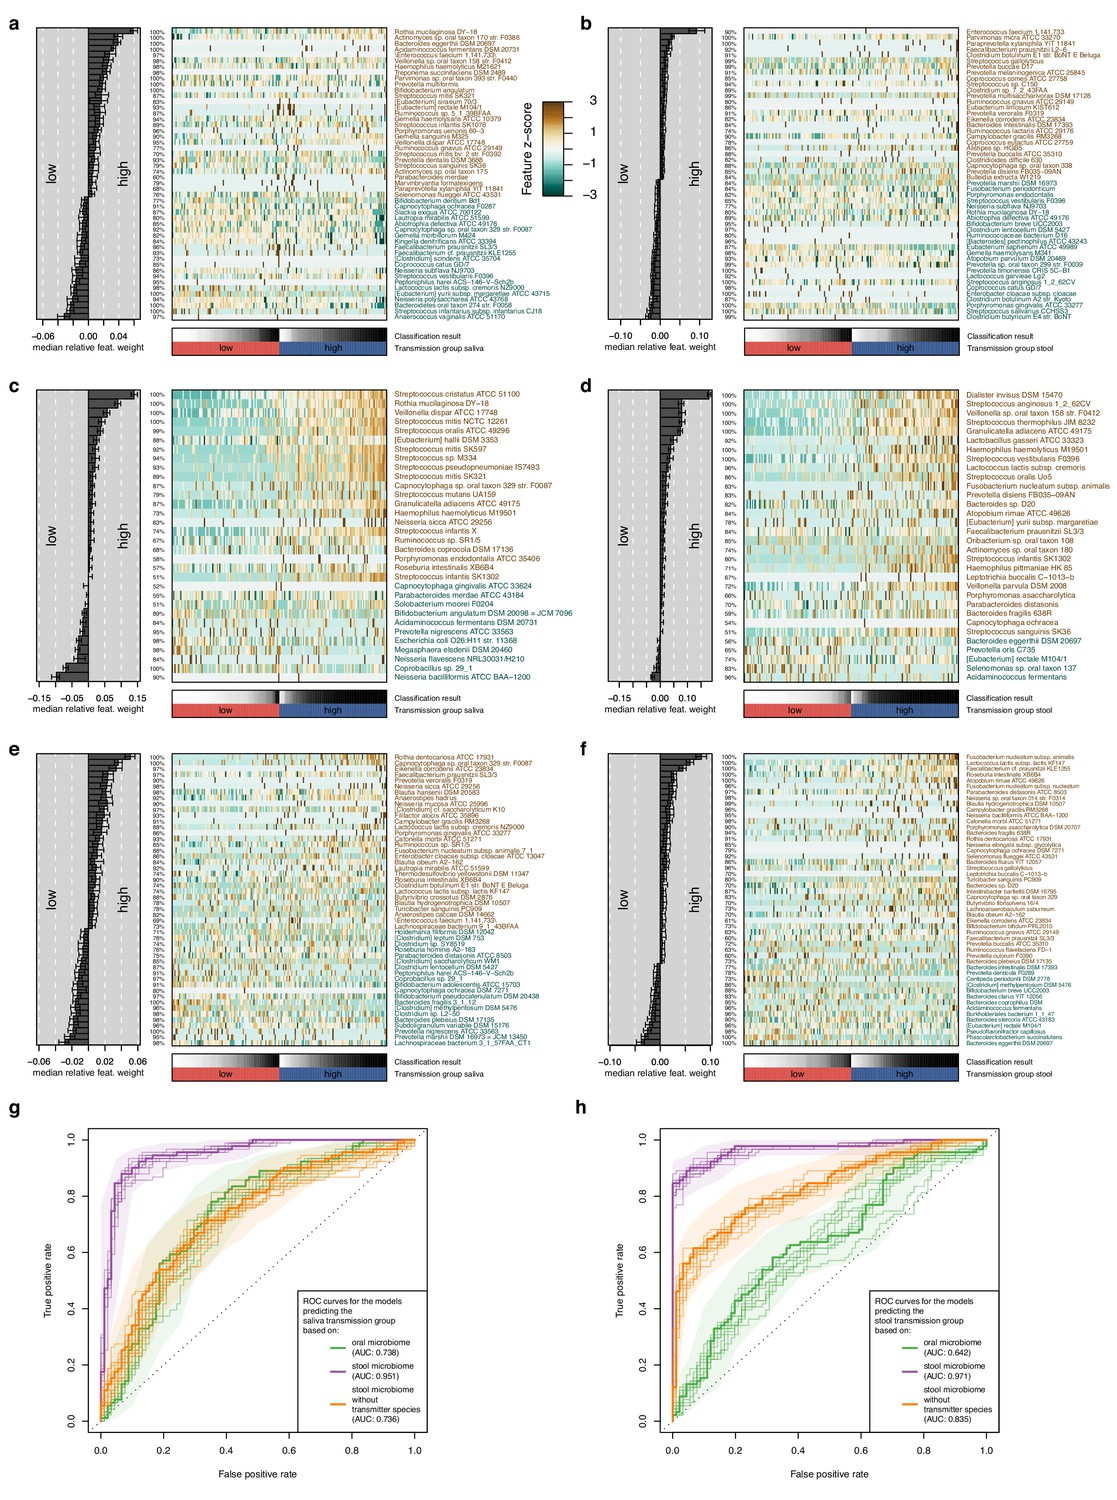
Multivariable statistical models reveal links between both oral and gut microbiome features with transmission levels.
Models were trained from oral and gut microbiome features to classify subjects into ‘high’ and ‘low’ transmission individuals (see Materials and methods). Model interpretation plots show the median relative model weight (barplots on the left) of the top selected features, the robustness (the number of cross-validation folds in which the respective feature had a non-zero weight; percentages next to the barplot), and the feature z-scores across samples, ordered by group and classification score (heatmap and annotations below). Plots are shown for models trained on the salivary microbiome, predicting the saliva transmission group (a) and the stool transmission group (b); trained on the stool microbiome, predicting the saliva transmission group (c) and the stool transmission group (d); and trained on the stool microbiome after exclusion of frequently transmitting species, predicting the saliva transmission group (e) and the stool transmission group (f). (g) Receiver operating characteristics (ROC) curves for the three models shown in (a, c, e). (h) ROC curves for the three models shown in (b, d, f).
Figure 4 with 1 supplement
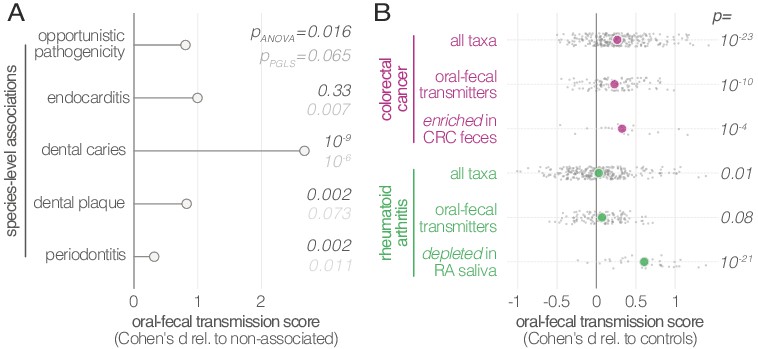
Oral-fecal transmission is associated with disease state.
(A) Species known to be associated with various diseases showed increased oral-fecal transmission scores (pANOVA, sequential ANOVA including additional phenotypes), even upon phylogenetic generalized least squares regression (pPGLS, see Materials and methods and Supplementary file 2). (B) Oral-fecal transmission scores tested in colorectal cancer and rheumatoid arthritis cases against controls for specific sets of species (sequential ANOVA, blocked by taxon and subject covariates). Individual data points represent Cohen’s d effect sizes (difference in means, normalised by pooled standard deviation) for individual taxa across subjects.
Figure 4—figure supplement 1
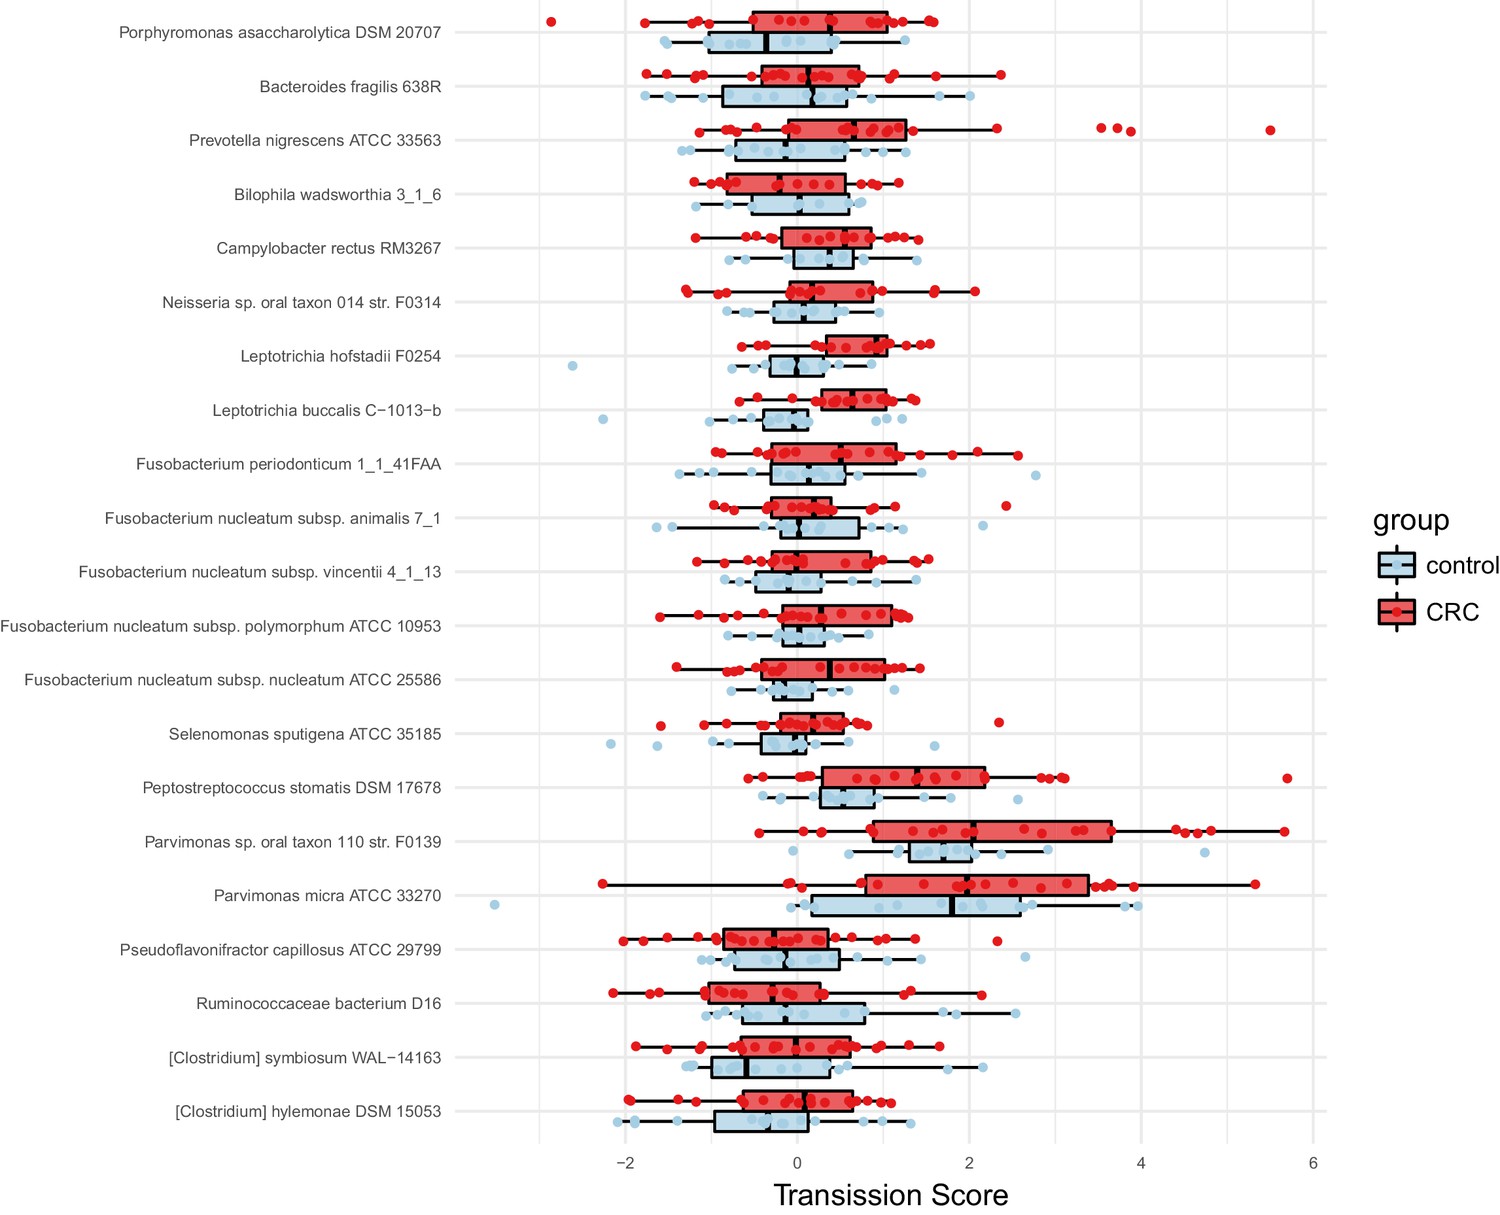
Species enriched in colorectal cancer show higher oral-fecal transmission scores in patients than controls.
Transmission scores in cases and controls are shown for a list of species previously (Zeller et al., 2014) reported to be fecally enriched in colorectal cancer.
Author response image 1

Additional files
-
Supplementary file 1
Sample and subject metadata.
For a subset of individuals in the CN-RA and DE-CTR cohorts, replicates were merged for salivary samples.
- https://doi.org/10.7554/eLife.42693.015
-
Supplementary file 2
Taxa data.
Taxa metadata, annotated disease associations, and raw data on relative abundances, horizontal and vertical coverage of each taxon across all samples.
- https://doi.org/10.7554/eLife.42693.016
-
Supplementary file 3
Transmission covariates.
- https://doi.org/10.7554/eLife.42693.017
-
Supplementary file 4
Abundances of oral and fecal marker species are predictive of transmission levels.
- https://doi.org/10.7554/eLife.42693.018
-
Transparent reporting form
- https://doi.org/10.7554/eLife.42693.019
Download links
A two-part list of links to download the article, or parts of the article, in various formats.
Downloads (link to download the article as PDF)
Open citations (links to open the citations from this article in various online reference manager services)
Cite this article (links to download the citations from this article in formats compatible with various reference manager tools)
Extensive transmission of microbes along the gastrointestinal tract
eLife 8:e42693.
https://doi.org/10.7554/eLife.42693


