The long non-coding RNA Cerox1 is a post transcriptional regulator of mitochondrial complex I catalytic activity
- University of Edinburgh, Western General Hospital, United Kingdom
- University of Oxford, United Kingdom
- University of Edinburgh, United Kingdom
Figures
Figure 1 with 1 supplement

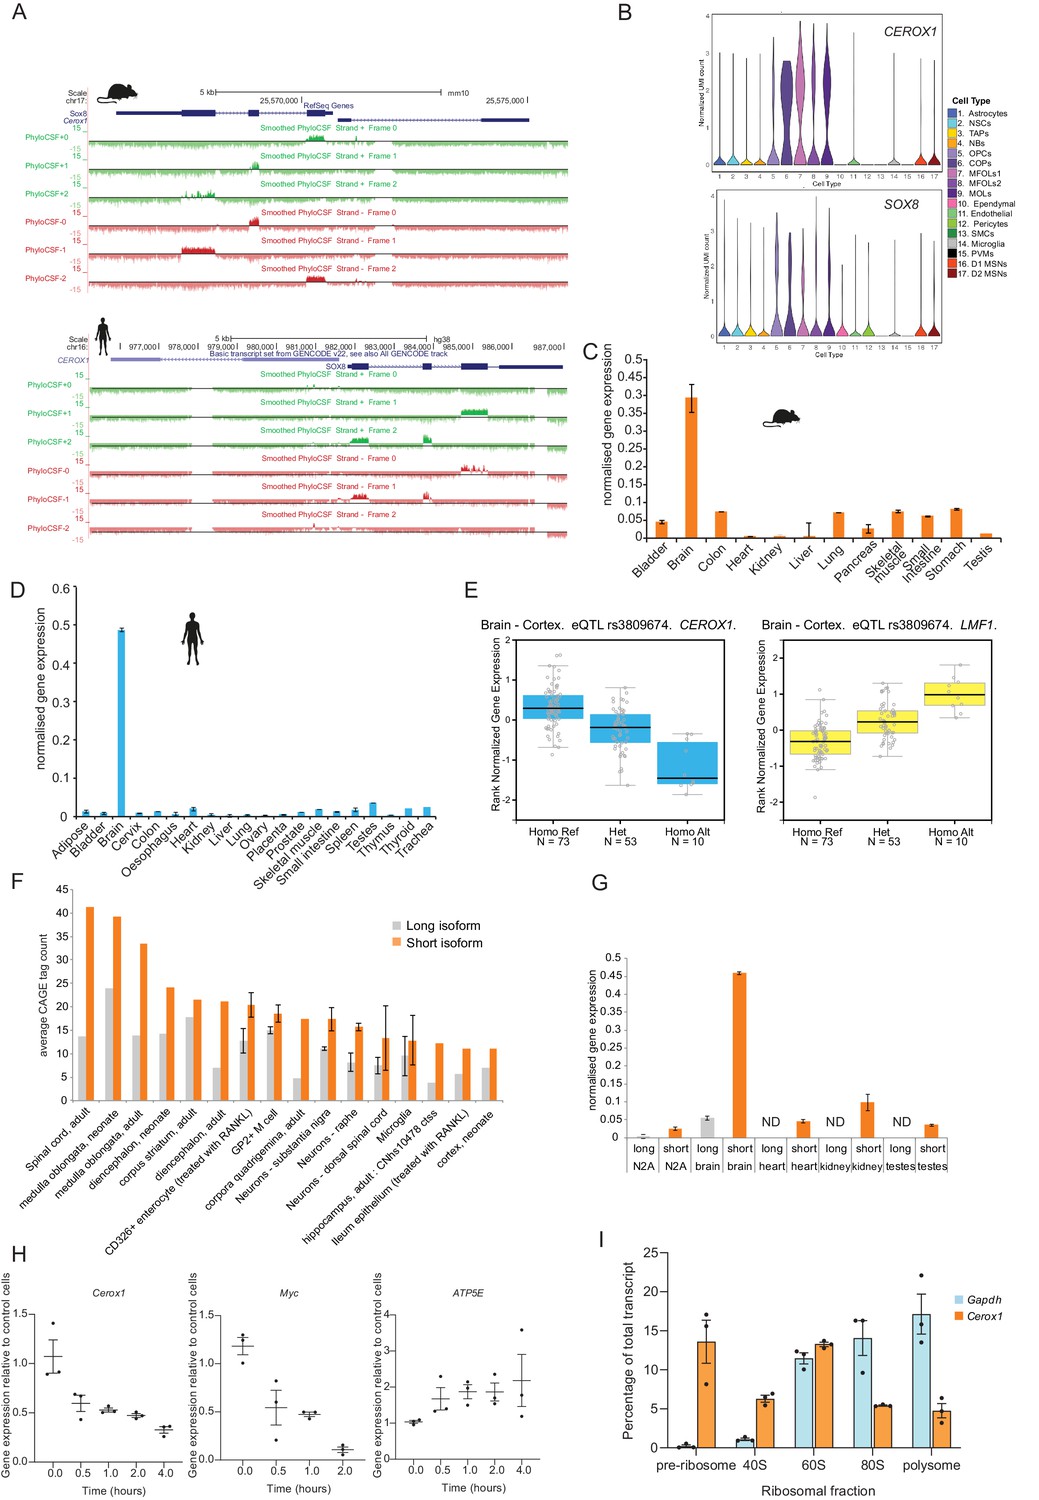
Cerox1 is an evolutionarily conserved, highly expressed and predominantly cytoplasmic lncRNA.
(A) The mouse Cerox1 locus (mm9 assembly). Sequence shaded in blue highlights conservation within exon two among eutherian mammals, but not in non-mammalian vertebrates such as chicken and zebrafish. (B) Syntenic human locus (hg19). This transcript was previously identified on the minus strand as LMF1 non-coding transcript 4, and is located within the intron of LMF1 non-coding transcript 2. LMF1 non-coding transcript two is annotated as a nonsense mediated decay biotype. A prominent peak of H3K4me3 (tri-methylation of histone H3 lysine 4 often found near promoters) modification marks the CEROX1 transcriptional start site. H3K4me3 peaks for H7-human embryonic stem cells (H7-hESC), human skeletal muscle myoblasts (HSMM) and human embryonic kidney 293 cells (HEK293) are depicted. The genomic evolutionary rate profiling (GERP) score indicates a higher extent of conservation of the CEROX1 promoter (shaded pink) than the adjacent SOX8 promoter (shaded green). (C) Schematic representation of mouse Cerox1 transcript and the human orthologous sequence. Exon two contains blocks of 60–70% sequence identity; human CEROX1 has an additional 1235 bases of retrotransposed insertions at the 5’ end. (D) Distributions of lncRNAs’ and protein-coding genes’ average expression levels across tissues in mouse. Average expression levels of representative mitochondrial complex I subunits’ mRNAs are indicated. TPM = tags per million. (E) Average expression levels of Cerox1 across mouse tissue samples. The orange bar highlights nervous system tissue samples whose values for replicates among neurological tissues are shown in the inset panel: 1- Medulla oblongata, 2– Spinal cord, 3– Diencephalon, 4– Substantia nigra, 5– Microglia, 6– Raphe, 7– Dorsal spinal cord, 8– Corpora quadrigemina, 9– Cortex, 10– Corpus striatum, 11- Visual cortex, 12– Olfactory brain, 13– Cerebellum, 14– Neurospheres sympathetic neuron derived, 15– Neurospheres parasympathetic neuron derived, 16– Neurospheres enteric neuron derived, 17– Astrocytes (cerebellar), 18– Hippocampus, 19– Hippocampal, 20– Ventral spinal cord, 21– Astrocytes, 22– Pituitary gland, 23– Astrocytes (hippocampus), 24– Cortical neurons, 25– Striatal neurons, 26– Schwann cells, 27– Meningeal cells. Error bars indicate s.e.m. (F) Cytoplasmic localisation of mouse Cerox1 compared to a nuclear retained lncRNA, Malat1, as demonstrated by fluorescent in situ hybridization and cell fractionation followed by quantitative PCR. By fractionation, mouse Cerox1 is 15-fold enriched in the cytoplasm of N2A cells (n = 5; error bars s.e.m.). Scale bar = 5 μm.
Figure 1—figure supplement 1
Transcript characterisation.
https://doi.org/10.7554/eLife.45051.004
Figure 2 with 1 supplement
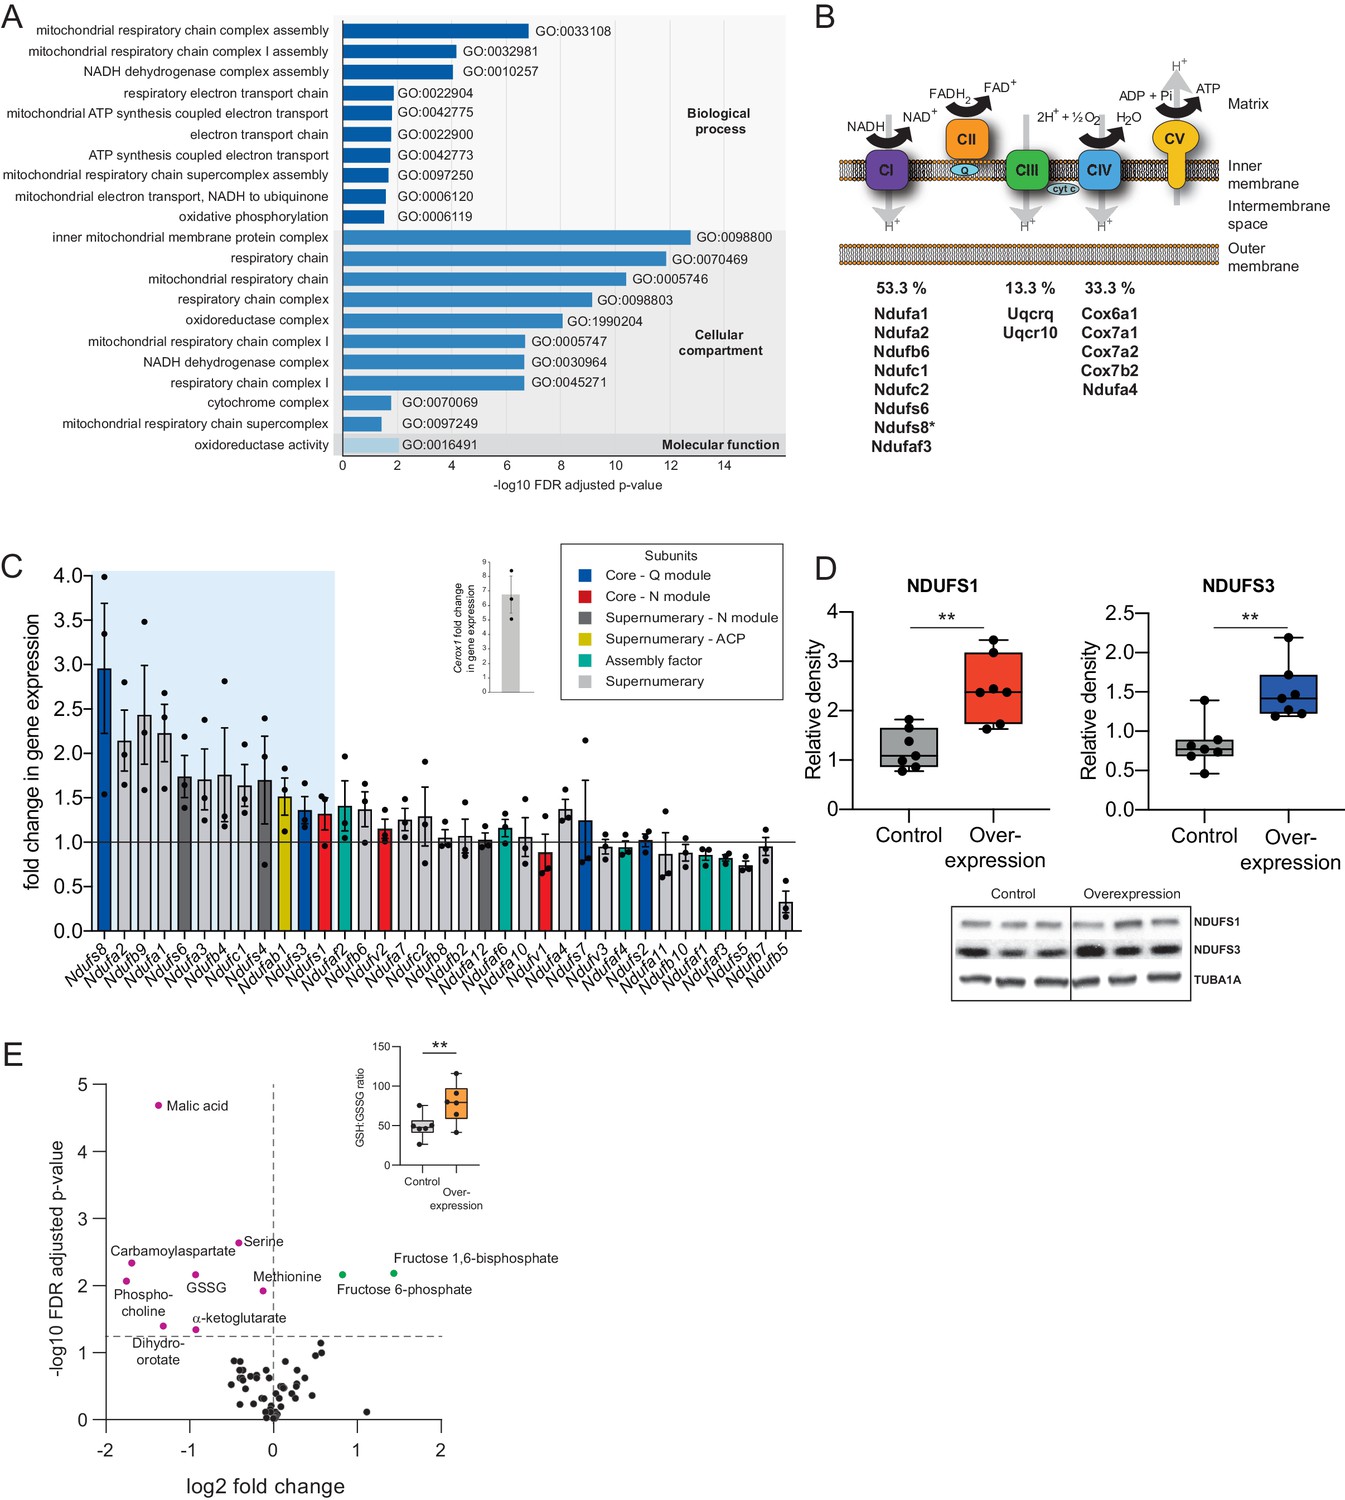
Cerox1 overexpression elevates levels of OXPHOS transcripts and their encoded proteins.
(A) Gene ontology analysis indicates a significant enrichment of upregulated genes involved in mitochondrial electron transport, energy production and redox reactions. (B) Four membrane bound multi-subunit complexes (CI, CII, CIII, CIV) are embedded in the inner mitochondrial membrane and facilitate transfer of electrons; three of these subunits are also proton pumps which create the chemiosmotic gradient required for ATP synthase activity, with complex V being ATP synthase. The subunits vary in size and complexity with Complex I (NADH:ubiquinone oxidoreductase) consisting of 45 subunits, Complex II (succinate dehydrogenase) four subunits, Complex III (Ubiquinol:cytochrome c oxidoreductase) 11 subunits and Complex IV (Cytochrome c oxidase) 13 subunits. Of 15 oxidative phosphorylation genes whose transcripts were up-regulated following Cerox1 overexpression 53% were subunits of Complex I, 13% were subunits of Complex III and 33% were subunits of Complex IV. * indicates core subunits that are essential for activity. Note: subunit NDUFA4 has recently been reassigned to mitochondrial complex IV (Balsa et al., 2012). (C) qPCR profiling of 35 complex I subunits and assembly factors (30 nuclear encoded complex I subunits and five assembly factors). Transcripts showing a 1.4 fold, or greater, change in expression after overexpression of Cerox1 are present within the boxed shaded area. Fold change of wild-type Cerox1 compared to the control are indicated in the inset panel. The transcripts profiled can be characterised into six categories: Core–Q module, subunits responsible for the electron transfer to ubiquinone; Core–N module, subunits responsible for the oxidation of NADH; Supernumerary subunits– those that are additional to the core subunits required for the catalytic role of complex I, but do not play a catalytic role themselves. Many of these subunits may be performing a structural role, but the majority are of unknown function. The supernumerary subunits can be further subdivided into supernumerary – N module, those accessory subunits associated with the NADH oxidation module of CI; supernumerary ACP (acyl carrier protein) – in addition to being a non-catalytic subunit of CI, NDUFAB1 is also a carrier of the growing fatty acid chain in mitochondrial fatty acid biosynthesis; assembly factor, proteins that are required for the correct assembly and integration of CI. Error bars s.e.m. (n = 3 biological replicates). (D) Overexpression of Cerox1 results in large increases in the total protein levels of two core subunits for which high quality antibodies exist, normalised to the loading control α-tubulin (TUBA1A). NDUFS1 is one of three (NDUFS1, NDUFV1, NDUFV2) core components of the N-module of Complex I. NDUFS3 is one of four (NDUFS2, NDUFS3, NDUFS7, NDUFS8) core components of the Complex I Q-module. n = 7 biological replicates for control and overexpression. 2-sided t-test; **p<0.01. (E) Overexpression of Cerox1 results in a change in the metabolite profile of N2A cells, with 10 of 66 metabolites measured demonstrating a significant change in the experimental sample after multiple testing correction (q < 0.05; n = 6 biological replicates for pCAG-control and pCAG Cerox1 overexpression). N2A cells overexpressing Cerox1 show an increased GSH:GSSG ratio (figure inset, 2-sided t-test; **p<0.01).
-
Figure 2—source data 1
N2A metabolomics profiling - Figure 2E.
- https://doi.org/10.7554/eLife.45051.007
Figure 2—figure supplement 1
Manipulation of Cerox1 expression levels.
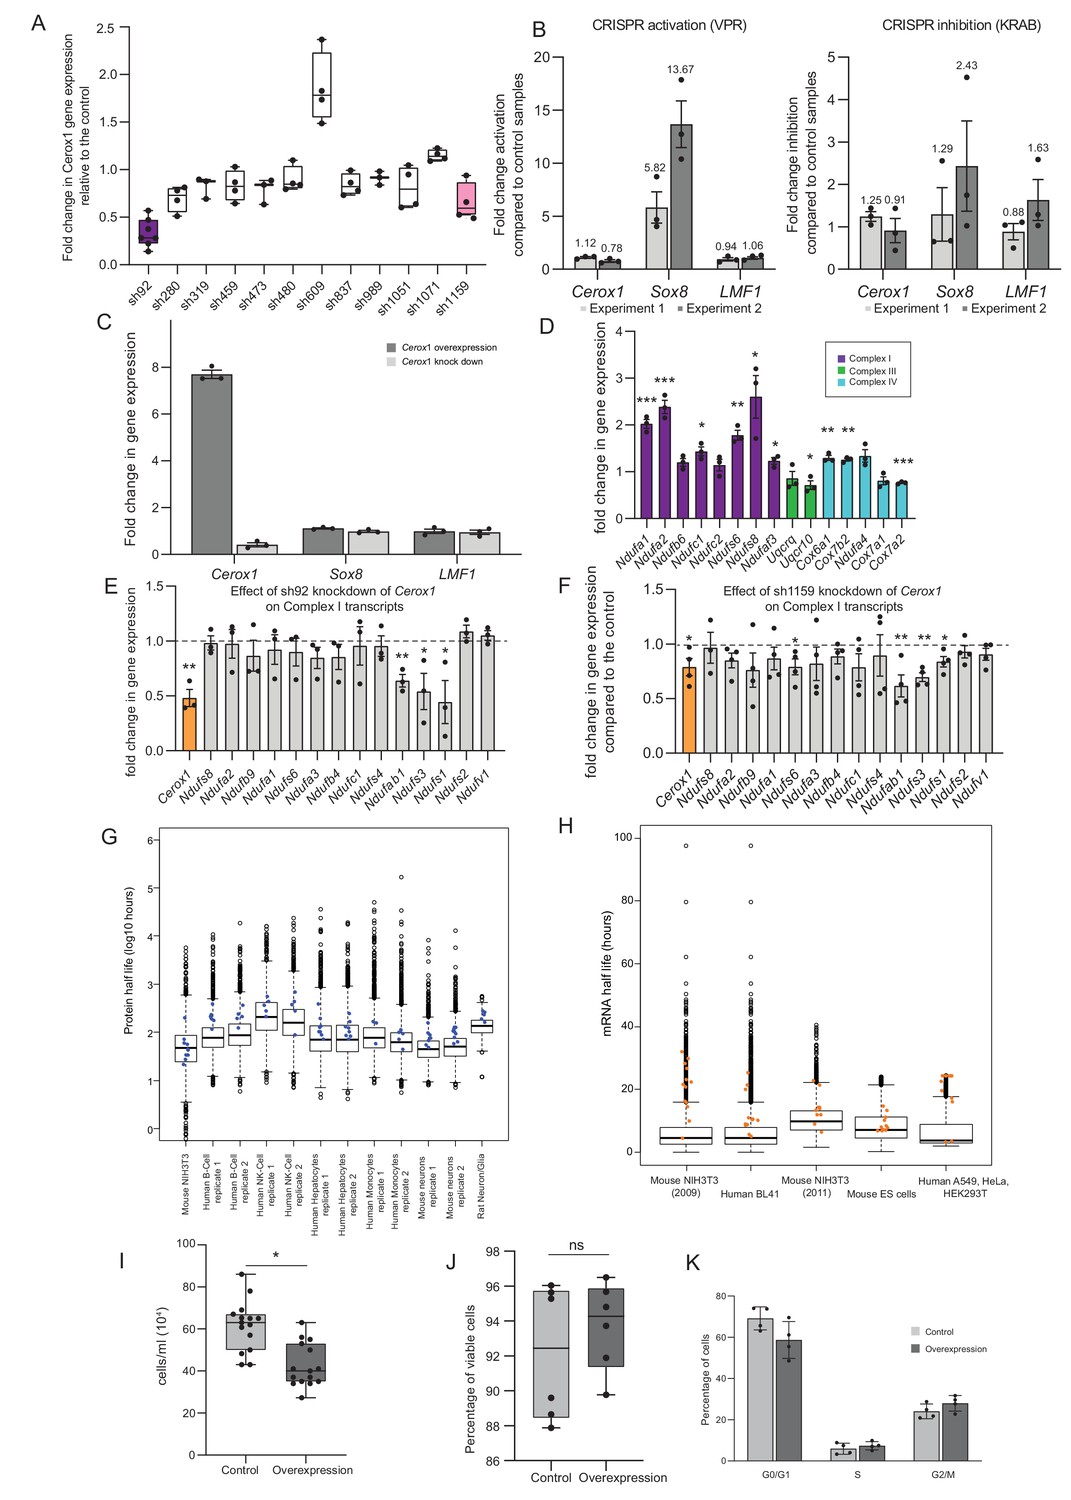
(A) Fold-change in Cerox1 level following treatment with each of twelve unique shRNAs. (B) CRISPR activation and inhibition at the divergent Cerox1-Sox8 promoter. (C) Overexpression and sh92-mediated knockdown of Cerox1 have no significant effect on expression of its neighbouring protein coding gene, Sox8 or the downstream gene, Lmf1. (D) qPCR validation of the expression increase in OXPHOS subunit transcripts indicated by microarray technology. As significant fold changes in gene expression from the microarray data were typically <1.8 fold, we applied an arbitrary threshold of 1.4 fold change in expression for qPCR experiments (2-sided t-test; **p<0.01, *p<0.05, ns = not significant). Errors bars s.e.m. (n = 3 biological replicates). (E) Knockdown of Cerox1 with shRNA92 led to significant decreases in three complex I subunit transcripts (Ndufab1, Ndufs3 and Ndufs1) as measured by qPCR (errors s.e.m., n = 3 biological replicates). (F) Knockdown of Cerox1 with shRNA1159 also resulted in significant decreases in these transcripts (Ndufab1, Ndufs3 and Ndufs1) as well as Ndufs6 (errors s.e.m., n = 4 biological replicates). (G) Protein half-lives obtained from mouse, human and rat primary cells and cell lines (Dörrbaum et al., 2018; Mathieson et al., 2018; Schwanhäusser et al., 2011). Blue dots represent Cerox1-sensitive complex I subunits (if present in the dataset). In the majority of cases, half-lives of these proteins exceed the median half-life. (H) mRNA half-lives from mouse and human cell lines (Schwanhäusser et al., 2011; Friedel et al., 2009; Sharova et al., 2009; Tani et al., 2012). Orange dots represent Cerox1-sensitive complex I subunits (if present in the dataset). As for the protein data, in most cases these transcripts have half-lives that exceed the median mRNA half-life. (I) Overexpression of Cerox1 slows cell growth. Counting of cells previously seeded to the same density (0.1 × 10⁶ cells/well) 48 hr post transfection demonstrated that there were 45% fewer cells in wells overexpressing Cerox1 (p=0.02, two-tailed Student’s t-test, errors s.d., n = 6). (J) The percentage of viable cells was not significantly different in Cerox1 overexpression and control cells (p=0.1, two-tailed Student’s t-test, errors s.d., n = 6). (K) N2A cells overexpressing control and Cerox1 were stained with propidium iodide and subjected to fluorescent activated cell sorting to determine the proportion of cells in various phases of the cell cycle. In an asynchronously cycling cell population there was no significant difference (two sided t-test) between the proportion of cells in G0/G1, S and G2/M phases between control cells expressing the pCAG control construct and those overexpressing Cerox1. p>0.05, n = 4 biological replicates.
Figure 3 with 1 supplement
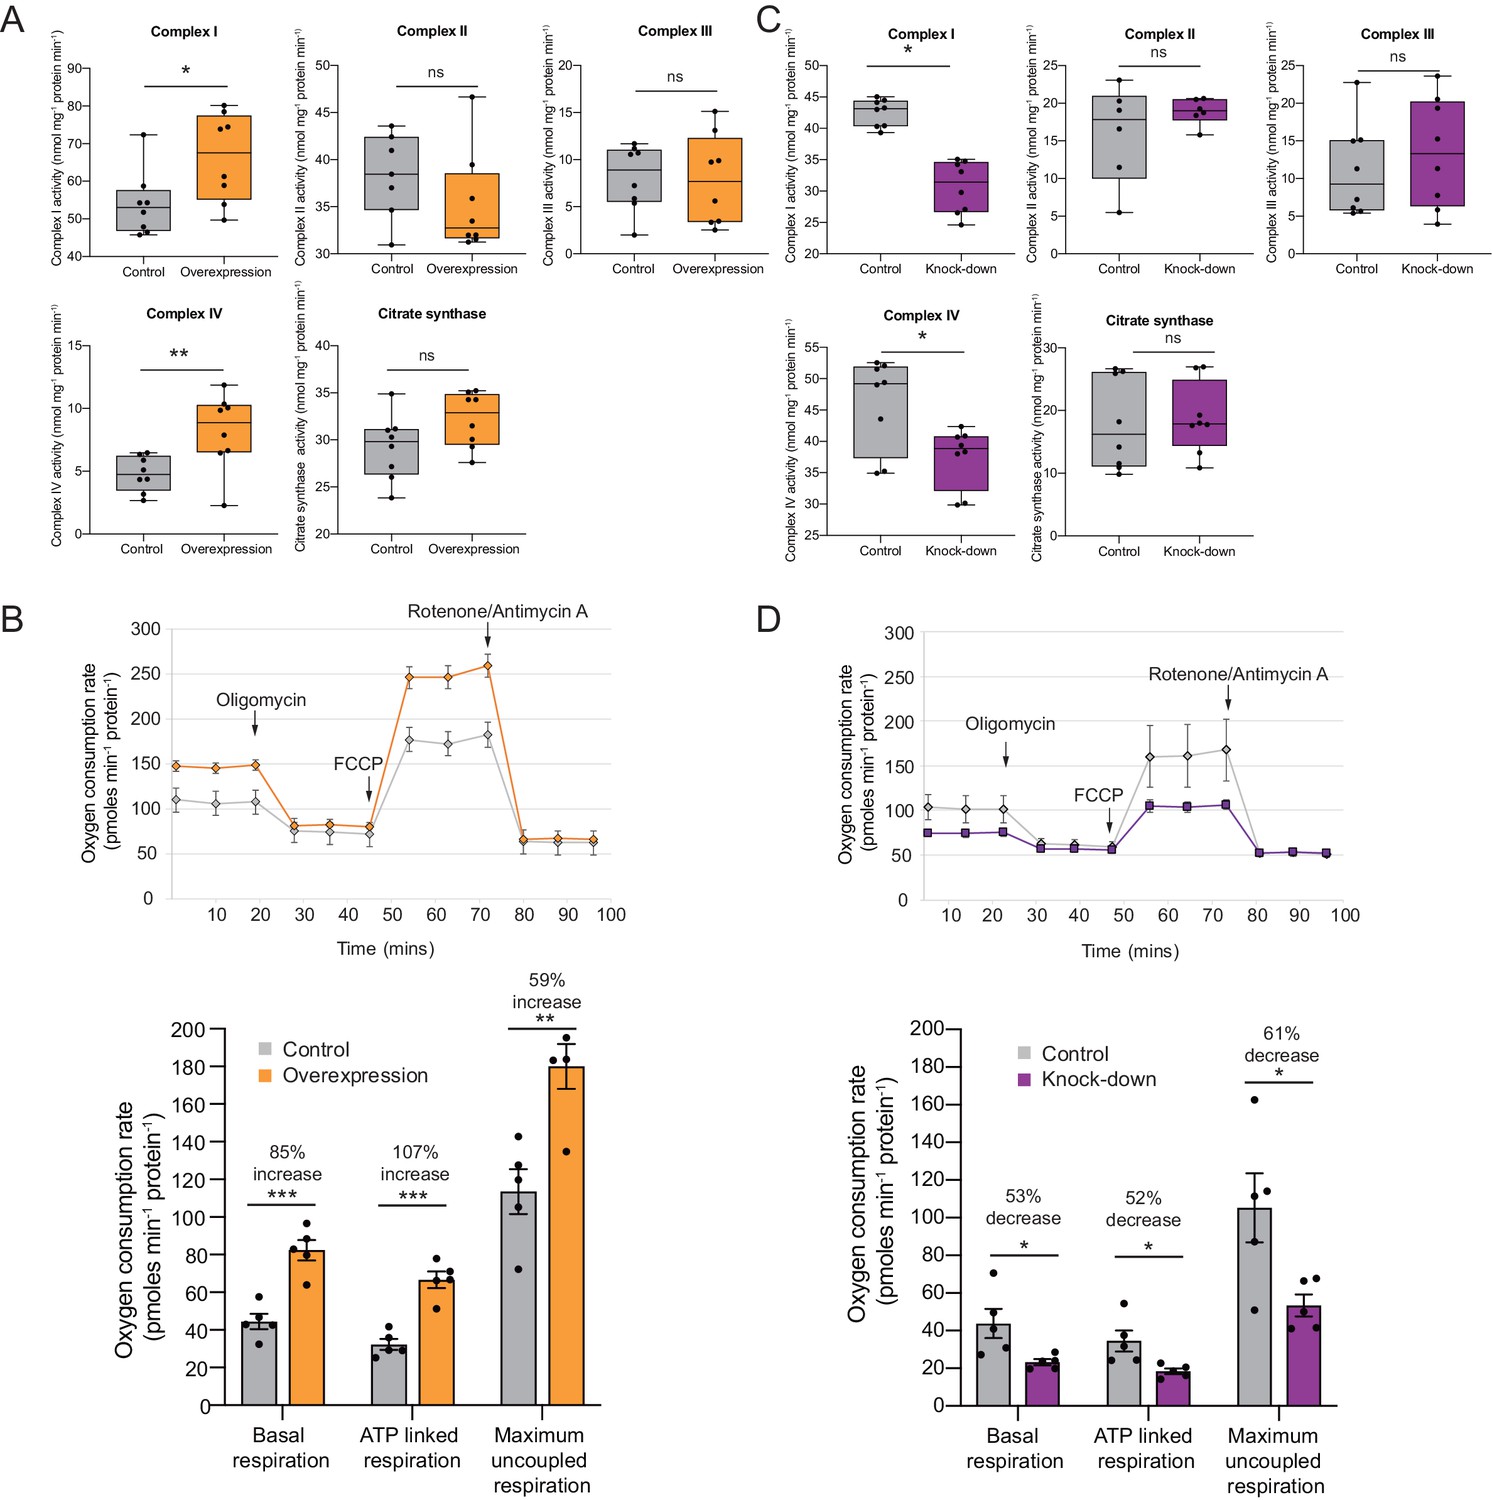
OXPHOS enzyme activity and oxygen consumption change concordantly and substantially with Cerox1 level alteration.
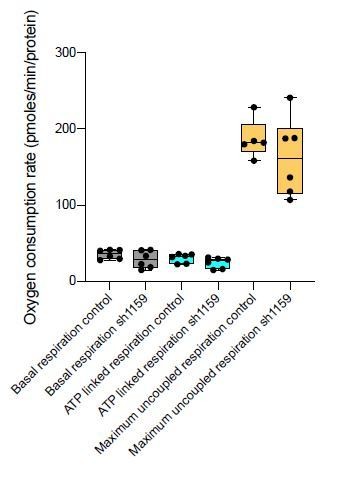
(A) Enzyme activities in mouse N2A cells 72 hr post-transfection of Cerox1 overexpression construct. Mouse Cerox1 overexpression in N2A cells results in significant increases in the catalytic activities of complexes I (22% increase) and IV (50% increase). Complexes II, III and citrate synthase show no significant change in activity. n = 8 biological replicates for control and overexpression. (B) Oxygen consumption, by N2A cells overexpressing Cerox1. Top: normalised real time oxygen consumption rate in basal conditions and after sequential injections of oligomycin, FCCP and rotenone/antimycin A. Bottom: changes in basal, ATP-linked and maximum uncoupled respiration respectively. Error bars s.e.m. (n = 5 biological replicates). (C) sh92-mediated knockdown of Cerox1 results in significant decreases of Complexes I and IV enzymatic activities 72 hr post transfection; no significant changes were observed for complexes II, III or the citrate synthase control. n = 8 biological replicates for control and knockdown. The less effective shRNA (sh1159) also decreased oxygen consumption yet not significantly relative to the control (data not shown). (D) Oxygen consumption, by Cerox1 knockdown N2A cells. Top: normalised real time oxygen consumption rate in basal conditions and after sequential injections of oligomycin, FCCP and rotenone/antimycin A. Bottom: changes in basal, ATP-linked and maximum uncoupled respiration respectively. Error bars s.e.m. (n = 5 biological replicates). 2-tailed Student’s t-test: ***p<0.001, **p<0.01, *p<0.05, ns not significant.
-
Figure 3—source data 1
N2A Cerox1 overexpression specific enzyme assays - Figure 3A.
- https://doi.org/10.7554/eLife.45051.010
-
Figure 3—source data 2
N2A Cerox1 overexpression seahorse bioanalyzer - Figure 3B.
- https://doi.org/10.7554/eLife.45051.011
-
Figure 3—source data 3
N2A Cerox1 knock down specific enzyme assays - Figure 3C.
- https://doi.org/10.7554/eLife.45051.012
-
Figure 3—source data 4
N2A Cerox1 knock down seahorse bioanalyzer - Figure 3D.
- https://doi.org/10.7554/eLife.45051.013
Figure 3—figure supplement 1
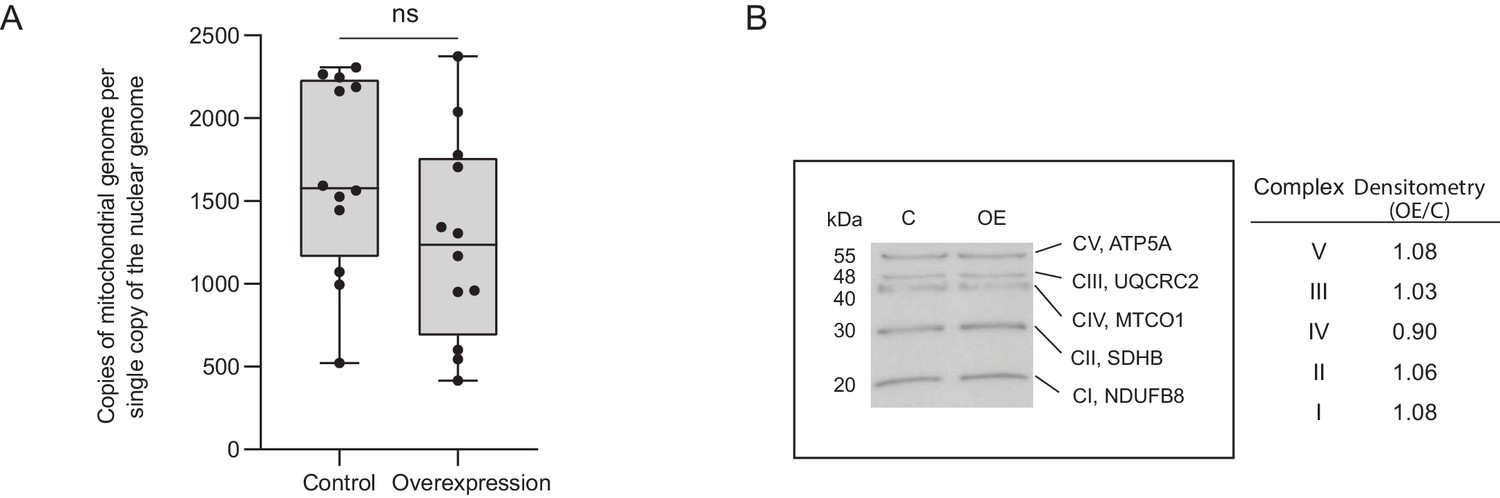
Increases in mitochondrial complex I and complex IV activities are not due to an increase in mitochondrial copy number.
(A) The mitochondrial-to-nuclear genome ratio was calculated by amplifying the nuclear genes β-actin and beclin-1 and the mitochondrial genes Nd1 and Nd2 and calculating the ratio. Primers were designed to regions in ND1 and ND2 that would not amplify any nuclear pseudogenes. No significant difference in mitochondrial genome number was found between control and Cerox1 overexpression N2A cells (p=0.99, two-tailed Student’s t-test, errors s.d, n = 12). (B) Western blots were performed using an OXPHOS antibody cocktail on protein extracted from control and overexpression N2A cells. Densitometry analysis indicated no significant difference in the amount of OXPHOS complexes between control and experimental cell lines. CI, complex I; CII, complex II; CIII, complex III; CIV, complex IV; CV, complex V; NDUFB8, NADH dehydrogenase (ubiquinone) one beta subcomplex, 8; SDHB, succinate dehydrogenase complex, subunit B; UQCRC2, ubiquinol cytochrome c reductase core protein 2; MTCO1, mitochondrial cytochrome oxidase 1; ATP5A, ATP synthase alpha subunit.
Figure 4
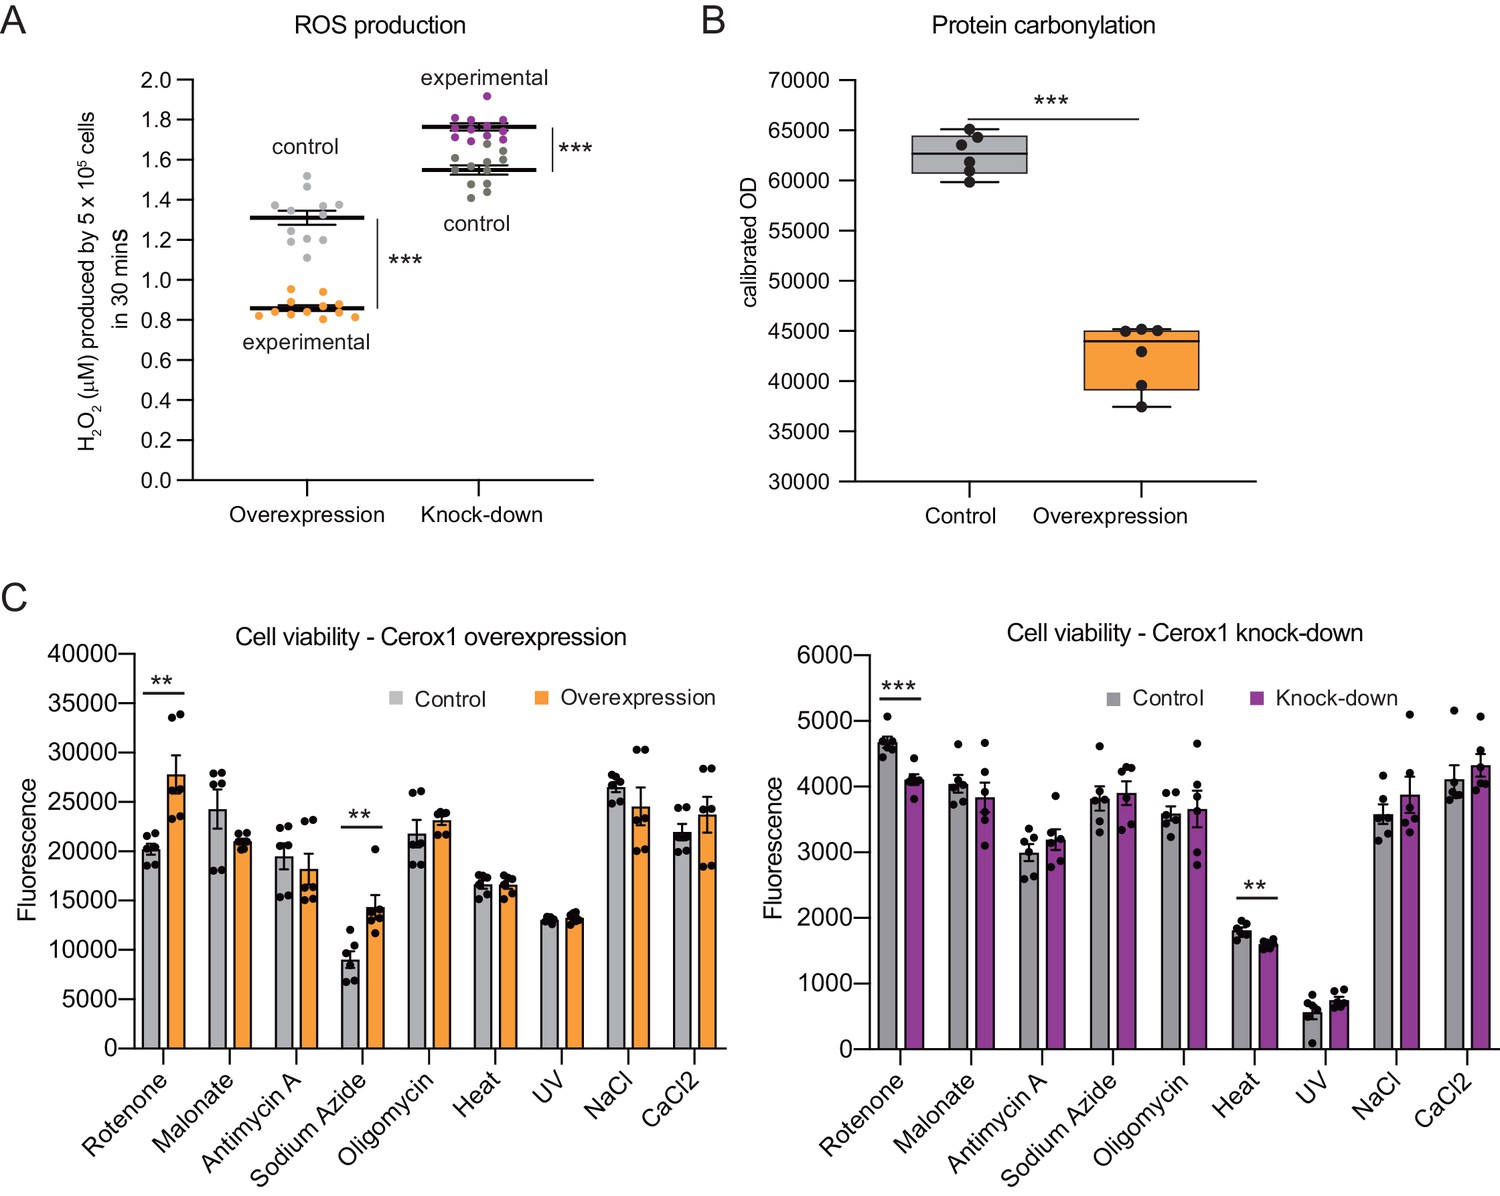
Cellular oxidative stress and viability depend on Cerox1 levels.
(A) Cerox1 knockdown increases the production of reactive oxygen species by 20%, whilst Cerox1 overexpression decreases it by 45% (error bars s.e.m., n = 12 biological replicates). (B) Protein oxidative damage also decreases in the overexpression condition compared to the control, as measured by densitometry on western blots against carbonylation of amino acid side chains. n = 6 biological replicates. (C) Viability of Cerox1 overexpressing and knock-down cells when stressed. N2A cells were stressed by addition of electron transport chain (ETC) inhibitors (rotenone, CI inhibitor; malonate, competitive inhibitor of CII; antimycin A, CIII inhibitor; sodium azide, CIV inhibitor; oligomycin, ATP synthase inhibitor), exposure to environmental stress (heat, ultraviolet radiation), or manipulation of extracellular osmolarity (NaCl) or extracellular calcium (CaCl2) concentration, for 1 hr and then the viability of the cells measured using the fluorescent indicator Alamar Blue. Error bars s.e.m. (n = 6 biological replicates for overexpression control, overexpression, knock-down control and knock-down). 2-tailed Student’s t-test: ***p<0.001, **p<0.01.
-
Figure 4—source data 1
N2A Reactive oxygen species production - Figure 4A.
- https://doi.org/10.7554/eLife.45051.015
-
Figure 4—source data 2
N2A Cerox1 overexpression protein carbonylation - Figure 4B.
- https://doi.org/10.7554/eLife.45051.016
-
Figure 4—source data 3
N2A cell viability Cerox1 overexpression and knockdown - Figure 4C.
- https://doi.org/10.7554/eLife.45051.017
Figure 5 with 1 supplement
The effect of Cerox1 on complex I transcript levels is miRNA-dependent.
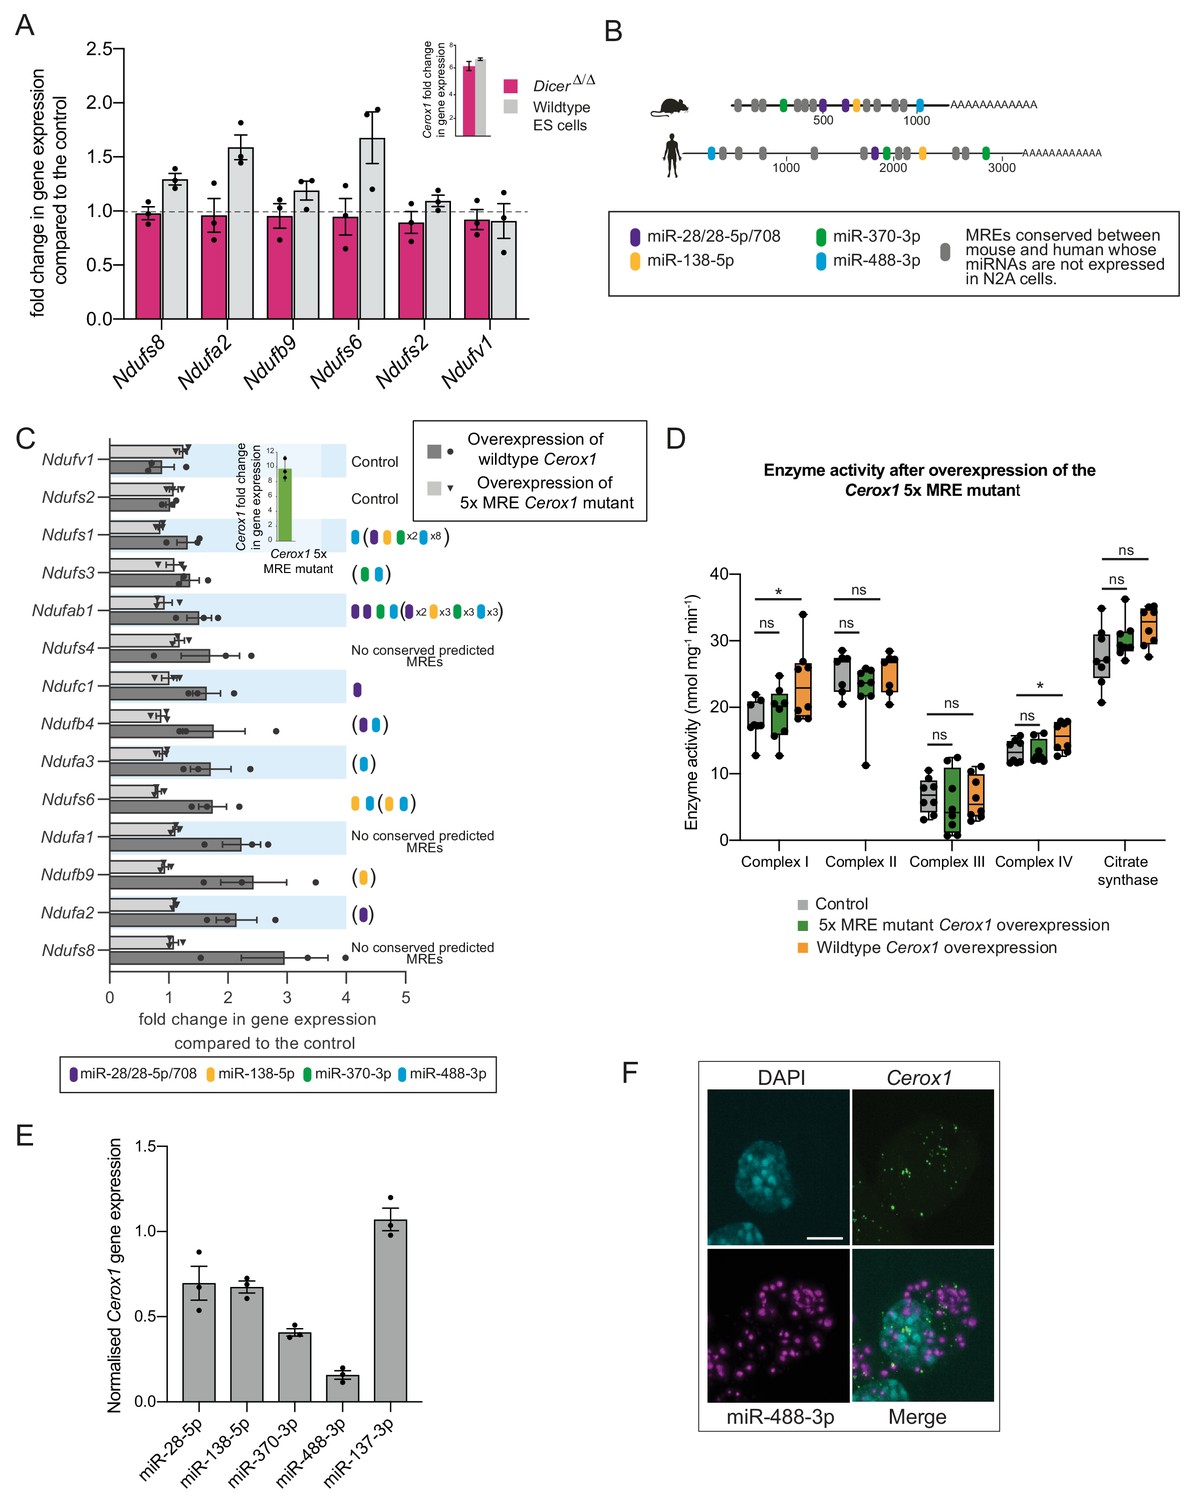
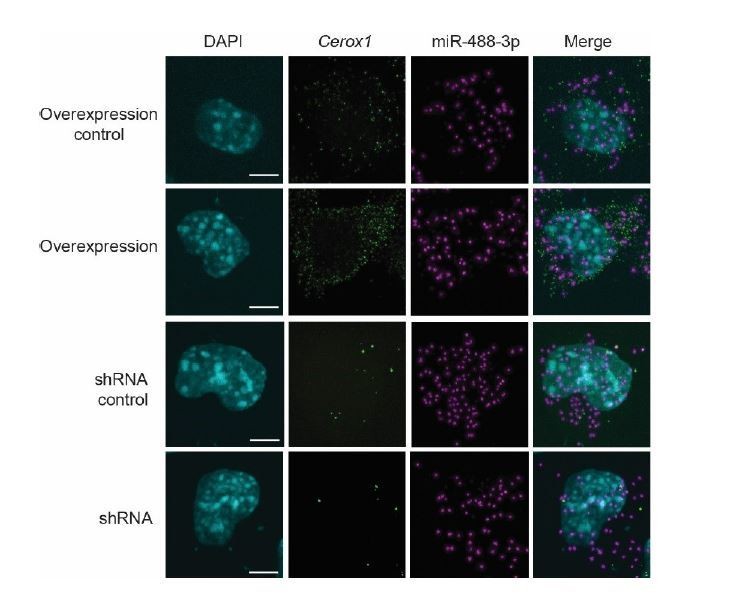
(A) Overexpression of Cerox1 in mouse wildtype and DicerΔ/Δembryonic stem (ES) cells (inset graph). The overexpression of Cerox1 in wildtype mouse embryonic stem cells results in an increase in complex I subunit transcripts, with no observed change in expression of two control subunits (Ndufs2, Ndufv1) that were also unaffected in N2A cells. Overexpression of Cerox1 in DicerΔ/Δembryonic stem cells results in no increase in the expression of any complex I subunit. 2-sided t-test; **p<0.01, *p<0.05, ns = not significant. Error bars s.e.m. n = 3 biological replicates. (B) Predicted MREs whose presence is conserved in both the mouse and human Cerox1. Coloured MREs indicate those MREs whose presence is conserved between mouse and human and whose miRNAs are expressed in N2A cells. miRNA site types are as follows: miR-28–5p, 8mer-A1; miR-138–5p, 6mer; miR-370–3p, 7mer-m8; miR-488–3p, 7mer-m8; miR-708–5p, 7mer-A1. The grey predicted MREs represent those that are conserved, but whose miRNAs are not expressed in N2A cells (miR-125a-3p, miR-199/199–5p, miR-302ac/520f, miR-485/485–5p, miR-486/486–5p, miR-501/501–5p, miR-654–3p, miR-675/675–5p). (C) Overexpression of the 5xMRE mutant failed to alter expression of complex I subunit transcripts that otherwise all increase in abundance following wild-type Cerox1 overexpression. Fold changes of wildtype Cerox1 or the 5xMRE Cerox1 mutant compared to the control are indicated in the inset panel. The numbers of MREs predicted by TargetScan v7.0 (Agarwal et al., 2015) in these transcripts’ 3’UTRs for the four conserved, N2A expressed miRNA families are indicated (see also Supplementary file 3). Due to known widespread noncanonical miRNA binding (Helwak et al., 2013), predictions were also extended across the gene body (bracketed MREs). 2-sided t-test; **p<0.01, *p<0.05, ns = not significant. Error bars s.e.m. n = 3 biological replicates. (D) Overexpression of the 5xMRE mutant failed to alter OXPHOS enzymatic activity compared to the control for any of the complexes measured. A one-way ANOVA was applied to test for differences in activities of the mitochondrial complexes between a control and overexpression of wildtype Cerox1 and the 5xMRE mutant. A post-hoc Dunnett’s test indicated that the overexpression of wildtype Cerox1 resulted, as expected, in significantly increased complex I and IV activities of 30% and 17% respectively (F [2, 21]=4.9, p=0.017; F[2, 20]=4.6, p=0.033), while comparisons for the 5xMRE mutant with the control were not significant. There was no significant difference in the activities of complex II (F[2,19]=3.5, p=0.26), complex III (F[2,19]=0.08, p=0.5) or citrate synthase (F[2,20]=2.6, p=0.42). n = 6 biological replicates. Significance levels, one-way ANOVA, Dunnett’s post hoc test *p<0.05. (E) Four to six fold overexpression of each of four miRNAs with predicted MREs whose presence is conserved in both mouse and human Cerox1 resulted in a decrease in Cerox1 transcript level, with overexpression of miR-488–3p resulting in >90% knock down of Cerox1. This was not observed when the miRNA miR-137–3p, which has no predicted MREs in Cerox1, was similarly overexpressed. Error bars s.e.m. n = 3 biological replicates. (F) Fluorescent in situ hybridisation detection of miR-488–3p (magenta) and Cerox1 (green) in N2A cells. Scale bar = 5 μm. A no probe control (Figure 5—figure supplement 1D) indicated some background Fast Red signal (miRNA detection) localised to the nucleus, but no background for Alexa Fluor-488 (lncRNA detection).
-
Figure 5—source data 1
N2A wildtype and MRE mutant Cerox1 overexpression specific enzyme assays - Figure 5D.
- https://doi.org/10.7554/eLife.45051.020
Figure 5—figure supplement 1

Expression profile of mmu-miR-488-3p.
(A) Expression profile of mouse miR-28–5p, miR-138–5p, miR-370–3p, miR-488–3p and miR-708–5p in N2A cells as measured by quantitative PCR and nanostring. Both techniques reveal the same trend in expression in N2A cells. Highest to lowest expression is as follows: miR-138–5p>miR-28–5p>miR488-3p/miR-708–5p>miR-370–3p. (B) Tissue profiling miRNA expression data from Landgraf et al. (2007) indicates the restricted expression of mmu-miR-488–3p to the central nervous system, N2A cells and embryonic development. Expression of mmu-miR-488–3p was not detected in any other tissue surveyed (data not shown). (C) Mouse tissue short RNA sequencing (Isakova and Quake, 2018) illustrates the high expression of miR-488–3p in the mouse brain, where it is ranked 42nd of 901 small RNAs detected in the brain. (D) Fluorescent in situ hybridization no probe control. Some back ground nuclear signal can be detected in the Fast Red channel (used to image the miRNA probe), but there was no detectable background for Alexa Fluor-488 (lncRNA detection). Scale bar = 5 μm.
Figure 6
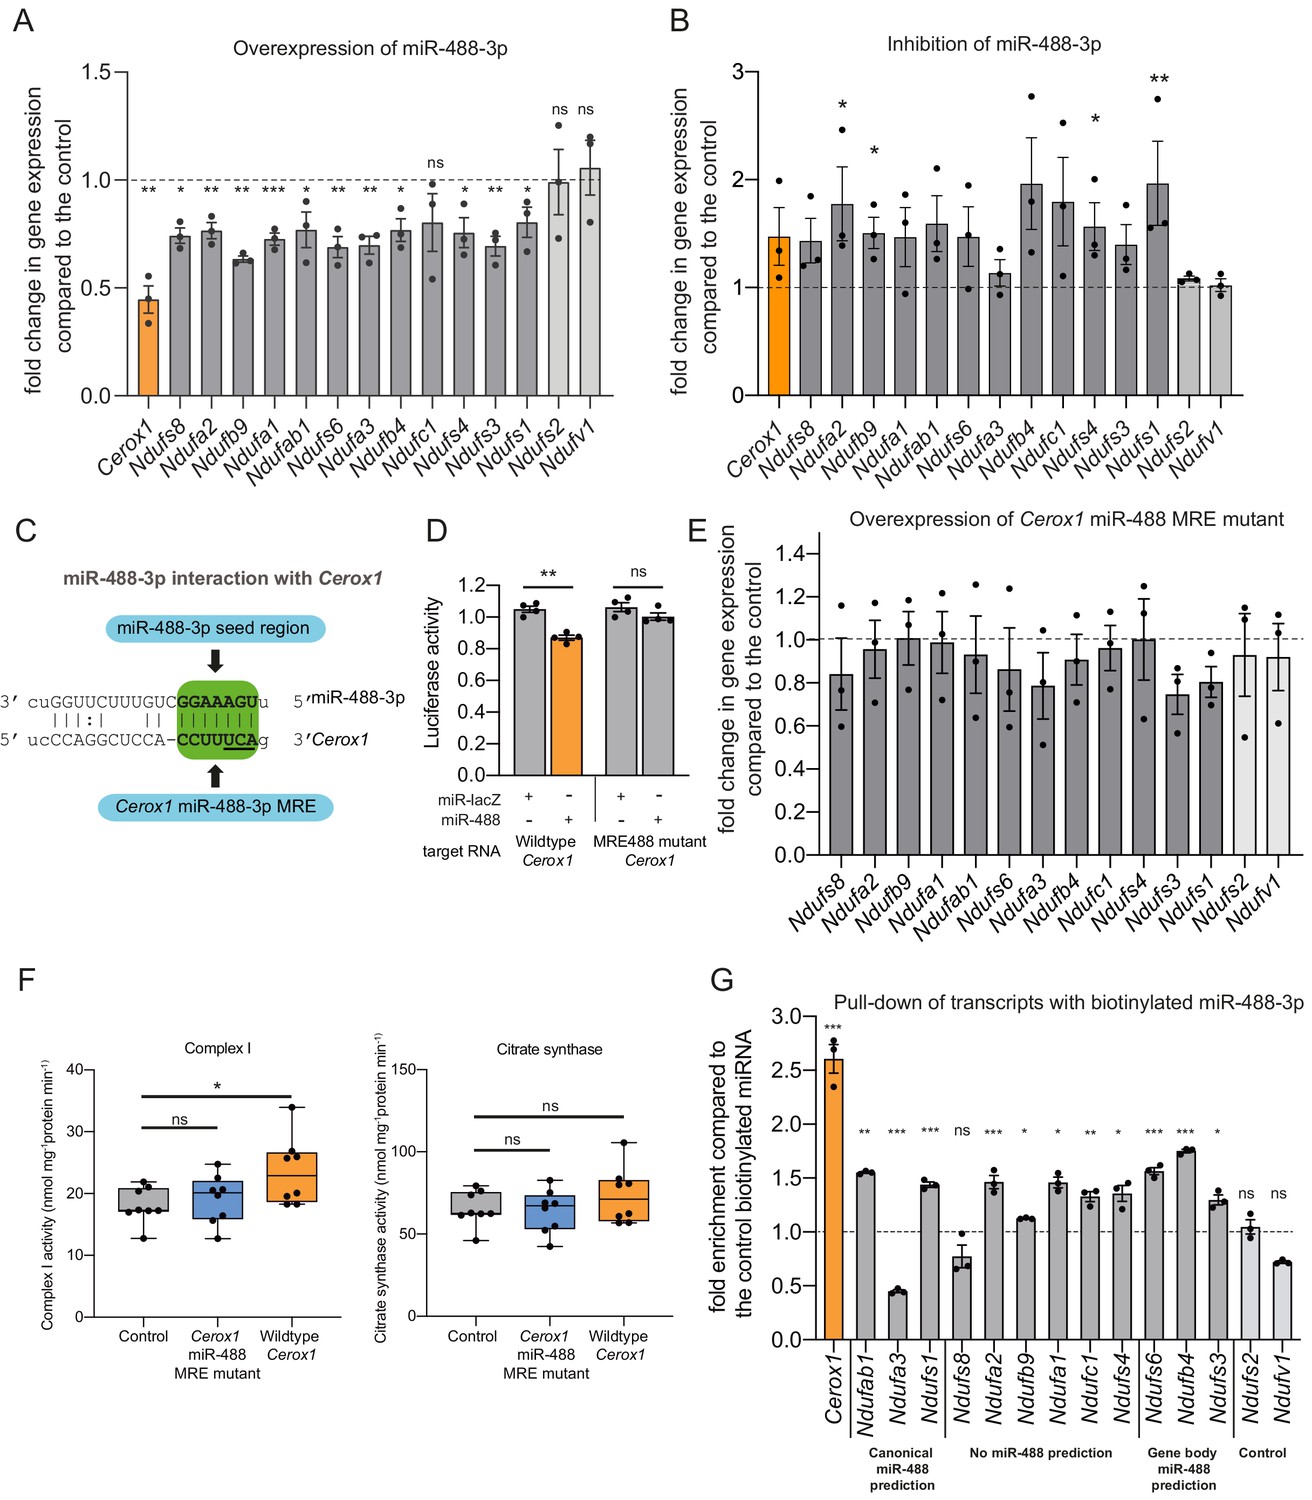
An intact miR-488–3p response element site is required for the effect of Cerox1 on complex I catalytic activity.
(A) Overexpression of miR-488–3p knocks down all Cerox1-sensitive subunit transcripts. Error bars s.e.m. (n = 3 biological replicates for control and overexpression of miR-488–3p). 2-sided t-test; ***p<0.001, **p<0.01, *p<0.05 (B) Inhibition of miR-488–3p increases the expression of most (10/12) target transcripts compared to the control. Error bars s.e.m. (n = 3 biological replicates for control and inhibition of miR-488–3p). 2-sided t-test; **p<0.01, *p<0.05. (C) Schematic of the predicted miR-488–3p miRNA recognition element in Cerox1. The interaction of miR-488–3p with Cerox1 is predicted to involve a 7mer-8m seed site, with the heptamer sequence of the seed being complementary to nucleotides 2–8 of the miRNA. Underlined residues indicate the location of the Cerox1 miR-488-3p MRE mutation. (D) Luciferase destabilisation assay for both wildtype Cerox1 and Cerox1 mutated within the miR-488–3p MRE. Error bars s.e.m. (n = 4 biological replicates for each condition). 2-sided t-test; **p<0.01. (E, F) Overexpression of Cerox1 mutated within a single miR-488–3p MRE (E) failed to alter expression levels of complex I subunits that increase in expression with wild-type Cerox1 overexpression (error bars s.e.m, n = 3 biological replicates) and (F) failed to recapitulate the increase in complex I catalytic activity observed for the wildtype transcript. Fold change of wildtype Cerox1 compared to the control is indicated on the left of panel E. As expected, wildtype enzymatic activity was significantly different for complex I (F [2, 21]=4.944 P=0.019). A post-hoc Dunnett’s test indicated that the overexpression of wildtype Cerox1 resulted in significantly increased complex I activity, while the comparison of the Cerox1 miR-488–3p MRE mutant with the control was not significant. There was no significant difference in the activity of citrate synthase (F[2,21]=1.4, p=0.28). n = 8 biological replicates. Significance levels, one-way ANOVA, Dunnett’s post hoc test *p<0.05, ns = not significant. (G) Enrichment of 8 Cerox1 sensitive transcripts that do not have predicted canonical 3’UTR miR-488–3p MREs using biotinylated miR-488–3p as bait as compared to the control biotinylated miRNA. Error bars s.e.m. (n = 3 biological replicates). 2-sided t-test; ***p<0.001, **p<0.01, *p<0.05, ns – not significant.
-
Figure 6—source data 1
N2A wildtype and miR-488–3 p mutant Cerox1 overexpression complex I and citrate synthase assays - Figure 6F.
- https://doi.org/10.7554/eLife.45051.022
Figure 7

Human CEROX1 modulates complex I activity in mouse cells.
(A) CEROX1 is enriched in the cytoplasm. Error bars s.e.m. n = 4 biological replicates. (B) Relative levels of lncRNA (blue) and protein-coding gene (grey) expression across individuals and tissues in human. The black arrow indicates the expression level of CEROX1 in the set of 5161 lncRNAs. RPKM: reads per kilobase per million reads. (C) Average expression levels of CEROX1 in human tissues. Blue bars highlight neurological tissues used to build the inset graph. The inset graphic represents the comparison of gene expression variation among individuals for neurological tissues: 1–Putamen, 2-Caudate nucleus, 3-Nucleus accumbens, 4–Cortex, 5-Substantia nigra, 6–Amygdala, 7–Hippocampus, 8-Spinal cord, 9-Anterior cingulate cortex, 10-Frontal cortex, 11–Hypothalamus, 12-Tibial nerve, 13–Cerebellum, 14–Pituitary gland, 15-Cerebellar hemisphere. (D) OXPHOS enzyme activities in human HEK293T cells after 72 hr of CEROX1 overexpression. Overexpression of CEROX1 results in significant increases in the activities of complexes I (31% increase) and III (18% increase), with no significant change in other enzyme activities. n = 8 biological replicates. 2-sided t-test: p<0.01, ns = not significant. (E) Oxygen consumption, as measured on a Seahorse XFe24 Analyzer, by HEK293T cells overexpressing CEROX1. Top: normalised real time oxygen consumption rate in basal conditions and after sequential injections of oligomycin, FCCP and rotenone/antimycin A. Bottom: changes in basal, ATP-linked and maximum uncoupled respiration respectively. Error bars s.e.m. n = 6 biological replicates. (F) Reciprocal overexpression of mouse Cerox1 in human HEK293T cells or human CEROX1 in mouse N2A cells results in elevated complex I activity. n = 8 biological replicates. 2-sided t-test: ***p<0.001, **p<0.01, ns = not significant.
-
Figure 7—source data 1
HEK293T CEROX1 overexpression specific enzyme assays - Figure 7D.
- https://doi.org/10.7554/eLife.45051.024
-
Figure 7—source data 2
HEK293T CEROX1 overexpression seahorse bioanalyzer - Figure 7E.
- https://doi.org/10.7554/eLife.45051.025
-
Figure 7—source data 3
Reciprocal overexpression, complex I and citrate synthase assay - Figure 7F.
- https://doi.org/10.7554/eLife.45051.026
Figure 8

Proposed model for Cerox1 as a post-transcriptional regulator of mitochondrial protein production and energy metabolism.
In this model, Cerox1 (A) post-transcriptionally maintains energy metabolism homeostasis through buffering the stable ETC transcripts against miRNA-mediated gene silencing. Overexpression of Cerox1 (B) leads to a depletion of the pool of miRNAs that bind ETC transcripts, and therefore a decrease in miRNA mediated gene silencing of the ETC protein-coding transcripts. This has two subsequent effects: (1) a further accumulation of ETC protein coding transcripts, and (2) an increase in the overall translation of ETC subunit proteins owing to decreased miRNA binding to ETC transcripts. More rapid replenishment by undamaged subunits in mitochondrial complex I, leads to increased efficiency of complex I activity and hence an increase in overall oxygen consumption of the ETC.
Author response image 1
Author response image 2
Author response image 3

Author response image 4
Author response image 5

Author response image 6

Tables
Key resources table
| Reagent type (species) or resource | Designation | Source or reference | Identifiers | Additional information |
|---|---|---|---|---|
| Gene (Mus musculus) | Cerox1 | NA | AK079380; 2810468N07Rik; ENSMUST00000163493 | |
| Gene (Homo sapiens) | CEROX1 | NA | BC098409; RP11-161M6.2; ENST00000562570 | |
| Cell line (Mus musculus) | N2A (mouse neuroblastoma cells) | European Collection of Authenicated Cell Cultures (ECACC) | RRID: CVCL_0470; ECACC: 89121404 | |
| Cell line (Homo sapiens) | HEK293T (human embryonic kidney cells) | European Collection of Authenicated Cell Cultures (ECACC) | RRID: CVCL_0063; ECACC 12022001 | |
| Transfected construct (Mus musculus and Homo sapiens) | pCAG-GFP | https://www.addgene.org/89684/ | RRID:Addgene_89684 | This backbone was modified for overexpression of Cerox1, Cerox1 MRE mutants and CEROX1 |
| Transfected construct (Mus musculus) | BLOCK-it U6 shRNA expression construct | Invitrogen | K494500 | |
| Transfected construct (Mus musculus) | BLOCK-iT Pol II miR RNAi expression vector | Invitrogen | K493600 | |
| Antibody | anti-NDUFS1, rabbit monoclonal | Abcam | RRID: AB_2687932; ab169540 | Overnight, four degrees (1:30,000) |
| anti-NDUFS3, mouse monoclonal | Abcam | RRID:AB_10861972; ab110246 | Overnight, four degrees, 0.15 mg/ml | |
| anti-alpha tubulin, mouse monoclonal | Abcam | RRID:AB_2241126; ab7291 | Overnight, four degrees (1:30,000) | |
| goat anti-rabbit HRP, goat polyclonal | Invitrogen | RRID:AB_2536530; G-21234 | Room temperature,1 hr (1:30,000) | |
| goat anti-mouse HRP, goat polyclonal | Dako | RRID:AB_2617137; P0447 | Room temperature,1 hr (1:3,000) | |
| Recombinant DNA reagent | Fugene6 | Promega | E2691 | |
| Commercial assay or kit | Amplex Red Hydrogen Peroxide/Peroxidase Assay Kit | Thermofisher | A22188 | |
| OxyBlot protein oxidation detetion kit | Merck Millipor | S7150 | ||
| QuantiGene ViewRNA miRNA ISH cell assay kit | Affymetrix | QVCM0001 | ||
| Chemical compound, drug | Rotenone | Sigma Aldrich | R8875-5G | |
| Antimycin A | Sigma Aldrich | A8674-25MG | ||
| Sodium Azide | Sigma Aldrich | S8032-25G | ||
| Oligomycin | Sigma Aldrich | 75351–5 MG | ||
| NADH (reduced) | Sigma Aldrich | N8129-1G | ||
| coenzyme Q | Sigma Aldrich | C7956-2mg | ||
| Fatty acid free albumin | Sigma Aldrich | A8806-1G | ||
| Sodium succinate | Sigma Aldrich | S5047-100G | ||
| Dichlorophenolindophenol (DCPIP) | Sigma Aldrich | 33125–5 G-R | ||
| Decylubiquinone | Sigma Aldrich | D7911-10mg | ||
| cytochrome c | Sigma Aldrich | C7752 | ||
| Carbonyl cyanide 4(trifluoromethoxy)phenylhydrazone | Sigma Aldrich | C2920-10mg | ||
| miRNA inhibitors | Ambion | 4464084 | ||
| miRCURY LNA biotinylated miRNAs | Exiqon | 339178 | ||
| Software, algorithm | TargetScan v7.0 | Agarwal et al., 2015 | DOI: 10.7554/eLife.05005 |
Additional files
-
Supplementary file 1
Association of CEROX1 single nucleotide polymorphism on anthropomorphic traits.
Data was accessed through http://geneatlas.roslin.ed.ac.uk/.
- https://doi.org/10.7554/eLife.45051.028
-
Supplementary file 2
Differentially expressed genes after overexpression of mouse Cerox1.
- https://doi.org/10.7554/eLife.45051.029
-
Supplementary file 3
MRE predictions for Nduf subunit transcripts.
- https://doi.org/10.7554/eLife.45051.030
-
Supplementary file 4
shRNA oligos and PCR primers.
- https://doi.org/10.7554/eLife.45051.031
-
Transparent reporting form
- https://doi.org/10.7554/eLife.45051.032
Download links
A two-part list of links to download the article, or parts of the article, in various formats.
Downloads (link to download the article as PDF)
Open citations (links to open the citations from this article in various online reference manager services)
Cite this article (links to download the citations from this article in formats compatible with various reference manager tools)
The long non-coding RNA Cerox1 is a post transcriptional regulator of mitochondrial complex I catalytic activity
eLife 8:e45051.
https://doi.org/10.7554/eLife.45051


