Co-regulation and function of FOXM1/RHNO1 bidirectional genes in cancer
- Eppley Institute for Cancer Research and Fred & Pamela Buffett Cancer Center, University of Nebraska Medical Center, United States
- Departments of Gynecologic Oncology, Immunology, and Center for Immunotherapy, Roswell Park Comprehensive Cancer Center, United States
- Penn Ovarian Cancer Research Center, University of Pennsylvania Perelman School of Medicine, United States
- Massachusetts General Hospital Cancer Center, Harvard Medical School, United States
Figures
Figure 1
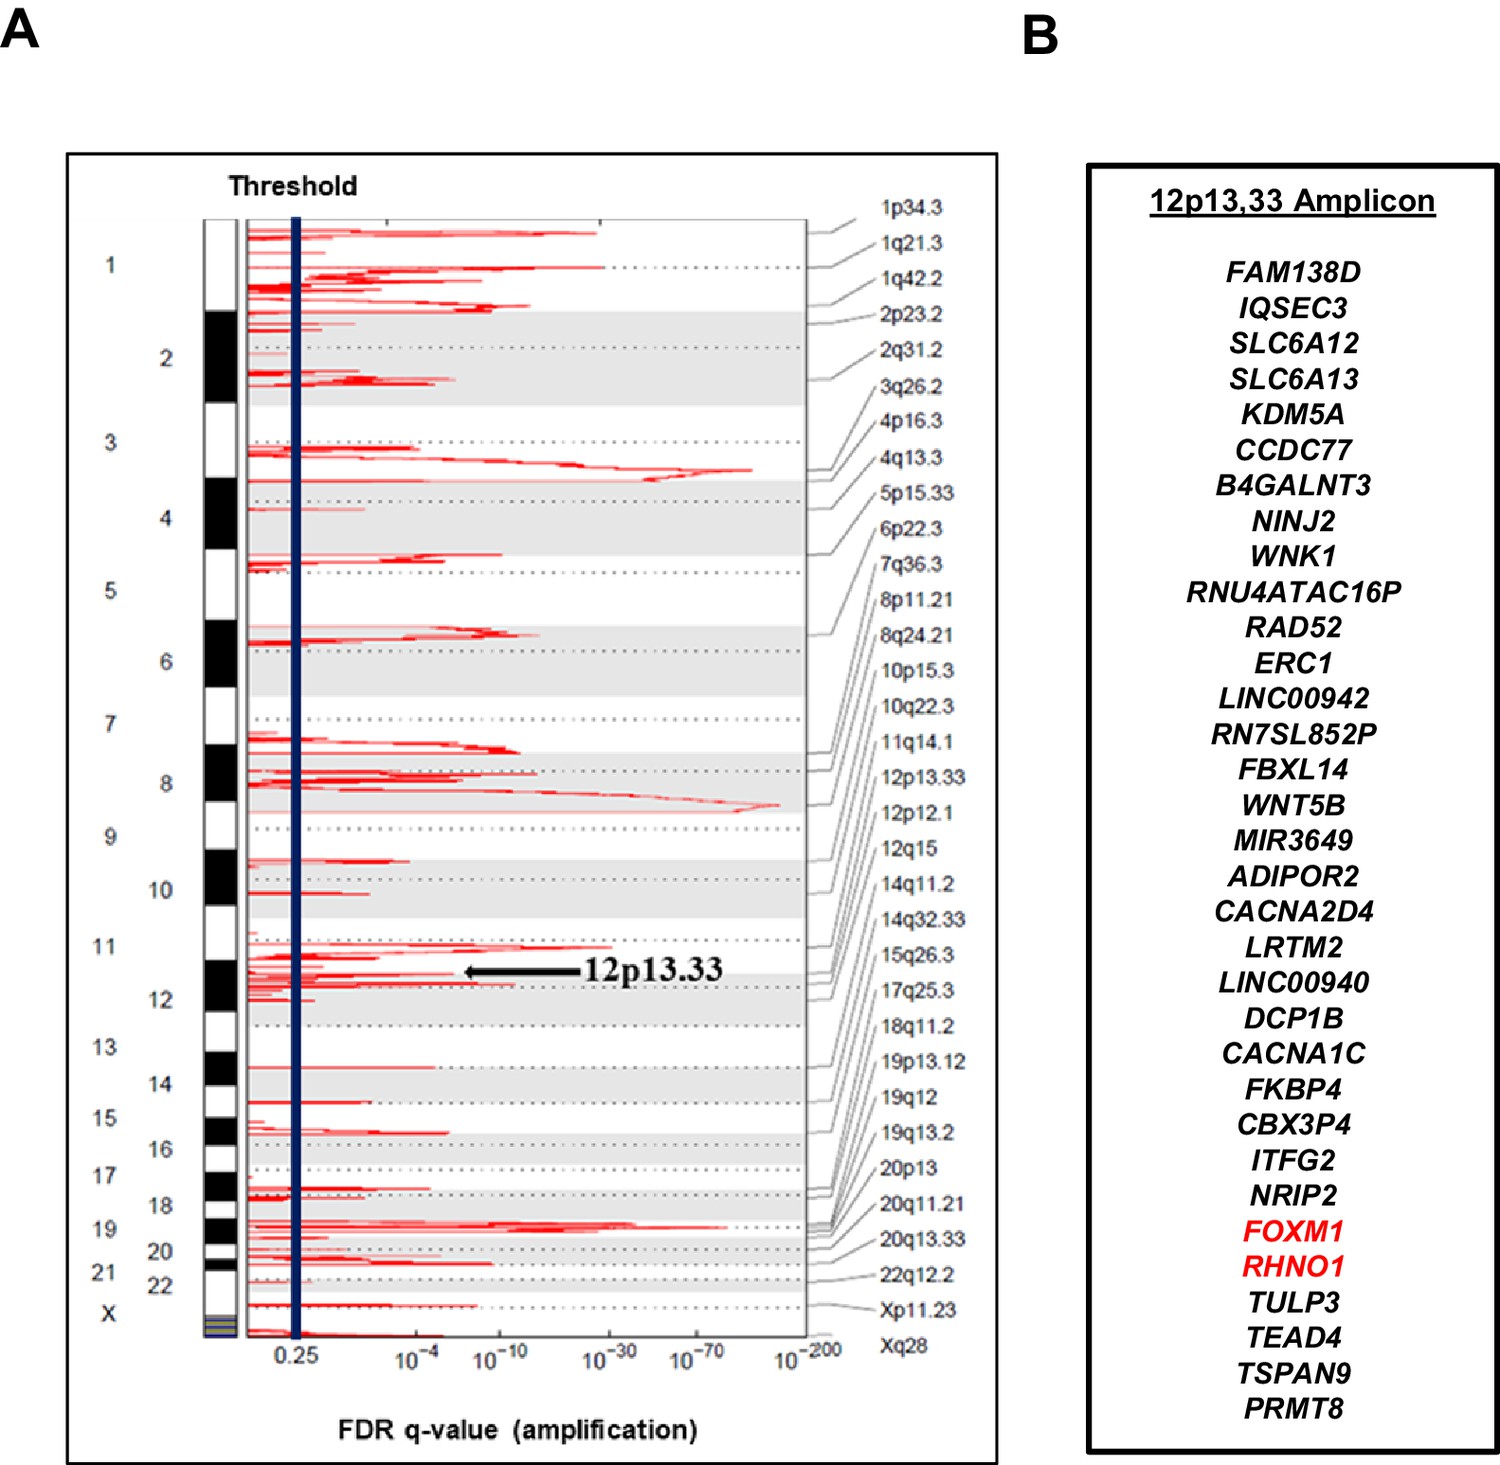
The 12p13.33 amplicon in high-grade serous carcinoma (HGSC).
(A) Recurrent copy number amplifications in The Cancer Genome Atlas HGSC data (n = 579), as determined by GISTIC. Black vertical line indicates the threshold for significance, corresponding to an false discovery rate (FDR) q-value <0.25. The 12p13.33 genomic amplicon is indicated with an arrow. (B) The 33 genes in the 12p13.33 amplicon, listed top to bottom in genomic order from centromere to telomere. FOXM1 and RHNO1 are shown in red.
Figure 2 with 2 supplements

FOXM1/RHNO1 expression correlation in high-grade serous carcinoma (HGSC) and genomic characteristics.
(A) Hierarchical clustering dendrogram of The Cancer Genome Atlas HGSC mRNA expression correlations of the 33 genes in the 12p13.33 amplicon. FOXM1 and RHNO1 are boxed. (B) Genomic configuration and characteristics of FOXM1 and RHNO1. Transcript structure, CpG islands, epigenetic marks, and vertebrate genome conservation data are shown. Data were obtained from the UCSC Genome Browser and ENCODE.
Figure 2—figure supplement 1
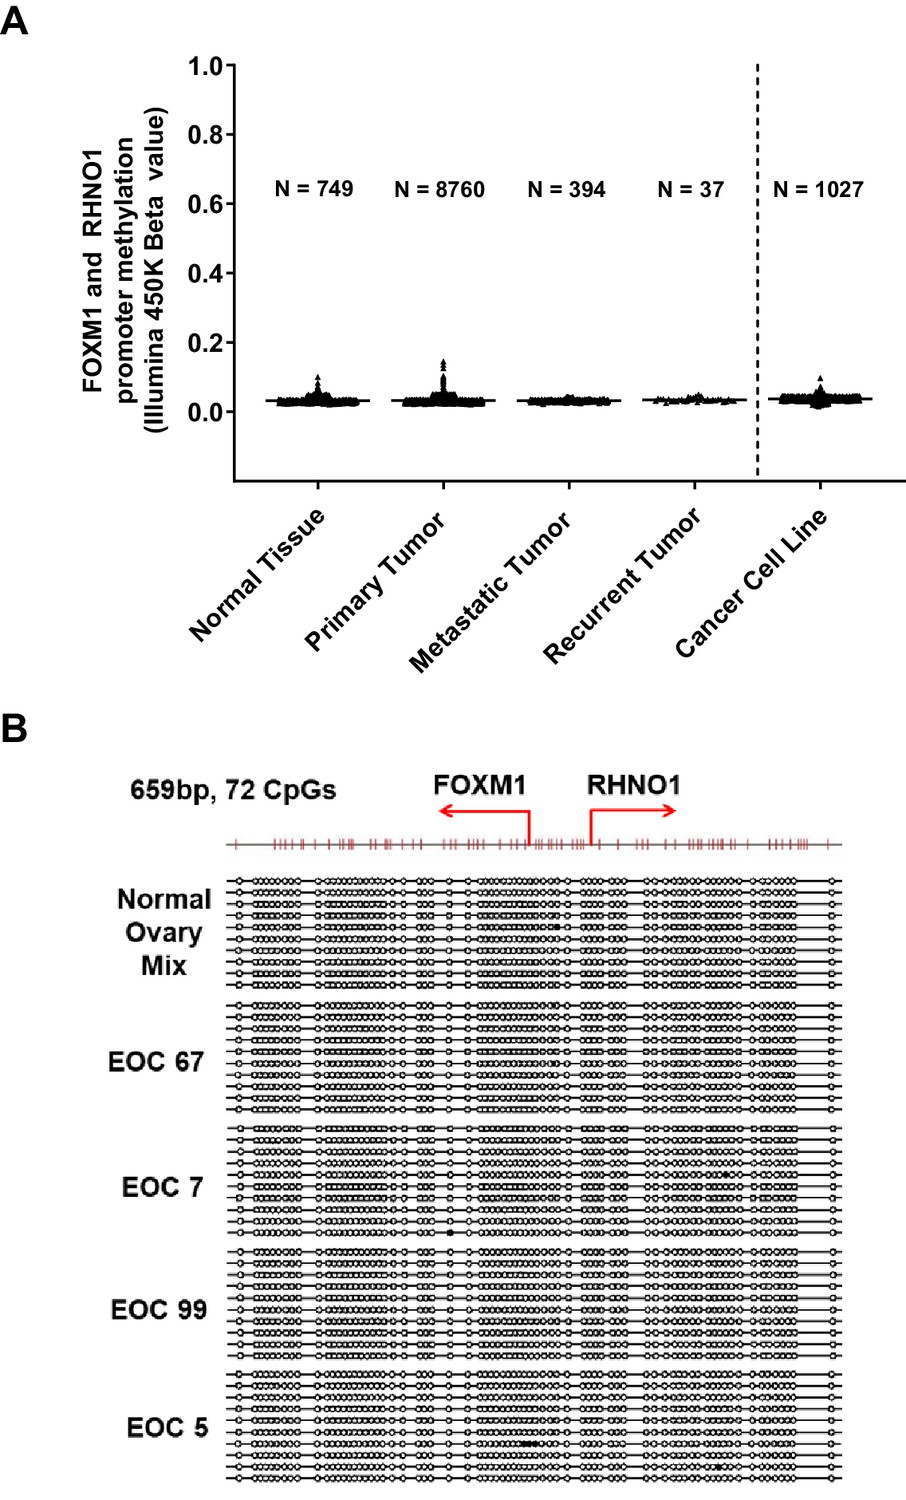
The FOXM1/RHNO1 bidirectional promoter (F/R-BDP) region is hypomethylated in normal and cancer tissues.
(A) Distribution of DNA methylation at the F/R-BDP in The Cancer Genome Atlas normal and tumor tissues and Cancer Cell Line Encyclopedia cancer cell lines. Beta values represent the level of DNA methylation, averaged across seven CpG sites within the F/R-BDP CpG island. A value of 1 corresponds to fully methylated, while a value of 0 corresponds to fully unmethylated. (B) F/R-BDP regional DNA methylation as determined by sodium bisulfite clonal sequencing. Gene transcriptional start sites are indicated by the red broken arrows. Filled and open circles indicate methylated and unmethylated CpG sites, respectively, and each row represents one sequenced allele. Four separate epithelial ovarian cancer (EOC) samples with patient identifiers are shown. A mixture of normal ovary samples was analyzed as a control.
Figure 2—figure supplement 2
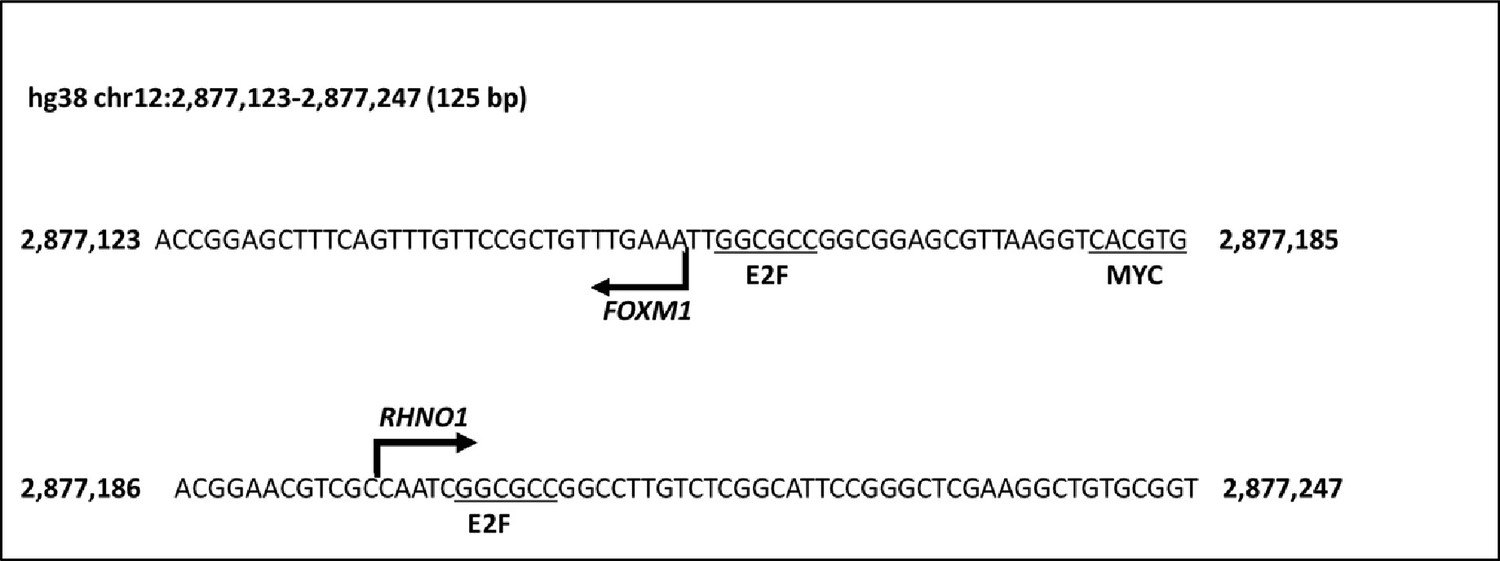
DNA sequence of the FOXM1/RHNO1 bidirectional promoter (F/R-BDP).
Transcriptional start sites predicted by NCBI are shown with broken arrows. E2F and MYC sites, known to regulate BDPs and FOXM1, are indicated.
Figure 3
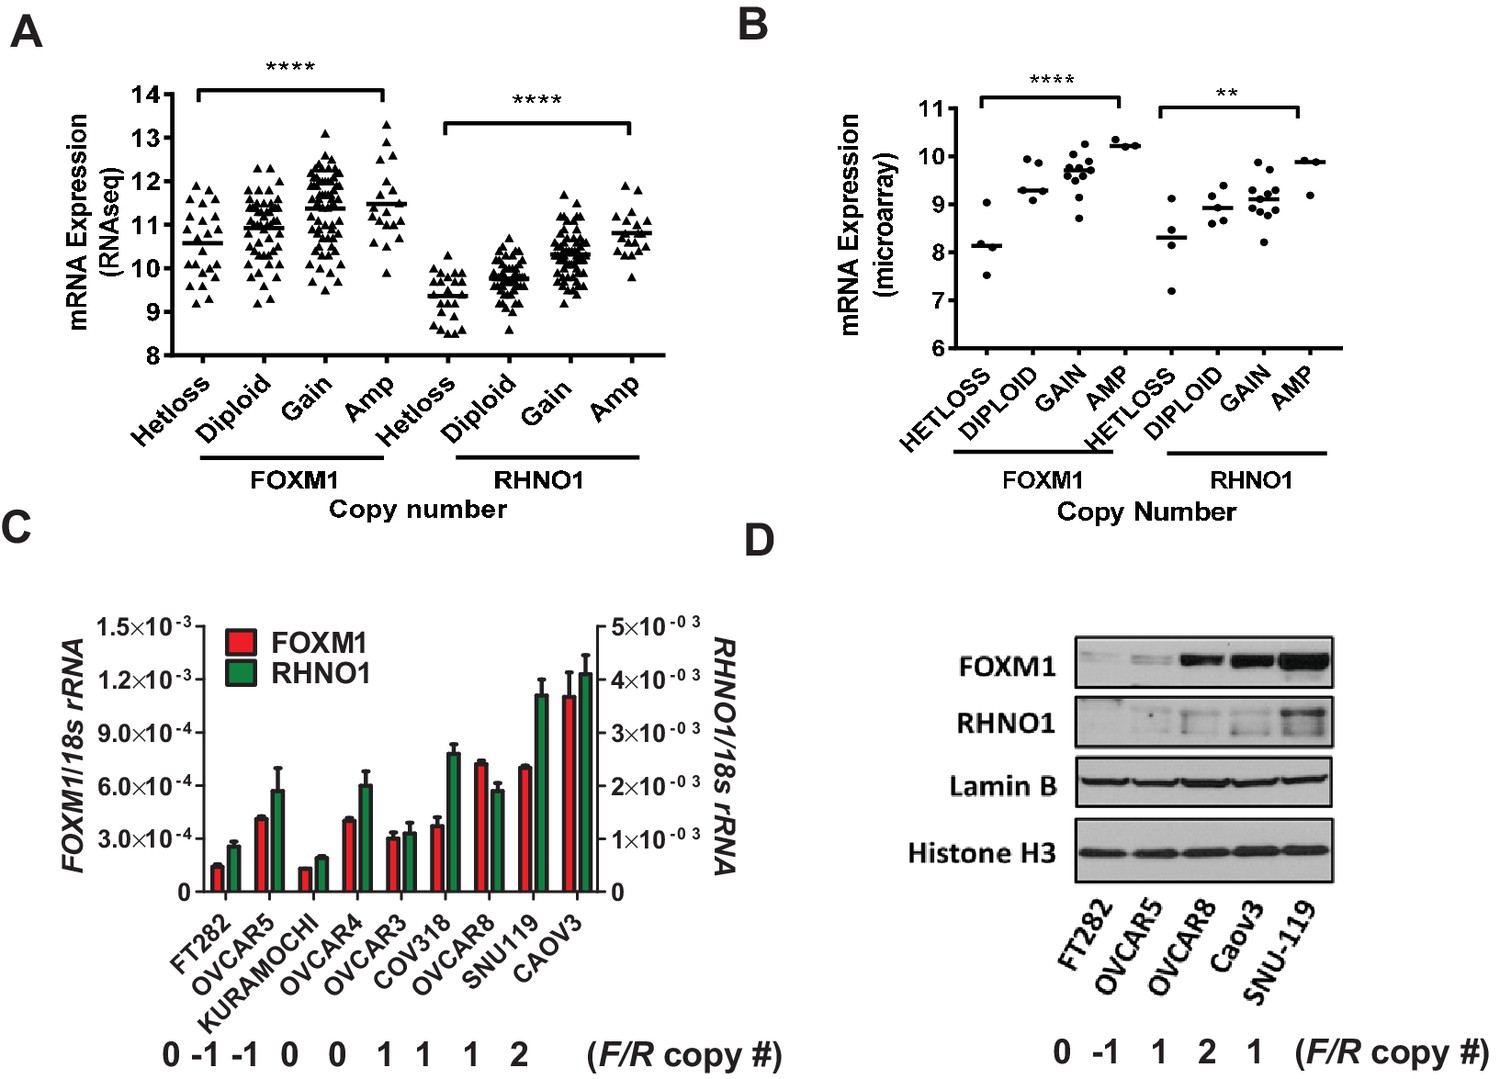
FOXM1 and RHNO1 expression correlates with genomic copy number in high-grade serous carcinoma (HGSC).
(A) FOXM1 and RHNO1 mRNA expression (RNA-seq) vs. GISTIC copy number in The Cancer Genome Atlas HGSC data (N = 157). (B) FOXM1 and RHNO1 mRNA expression (microarray) vs. copy number (GISTIC) in Cancer Cell Line Encyclopedia HGSC cell lines (N = 23). p-values for ANOVA with post-test for linear trend are shown, and lines represent group medians. p-value designation: **p<0.01, ****p<0.0001. (C) FOXM1 and RHNO1 mRNA expression in FT282 immortalized Fallopian tube epithelium cells and HGSC cell lines (RT-qPCR). (D) FOXM1 and RHNO1 nuclear protein levels (western blot). Two nuclear protein loading controls are shown. FOXM1/RHNO1 GISTIC copy number values for the cell lines are shown (−1: het loss; 0: diploid; 1: gain; 2: amp).
Figure 4
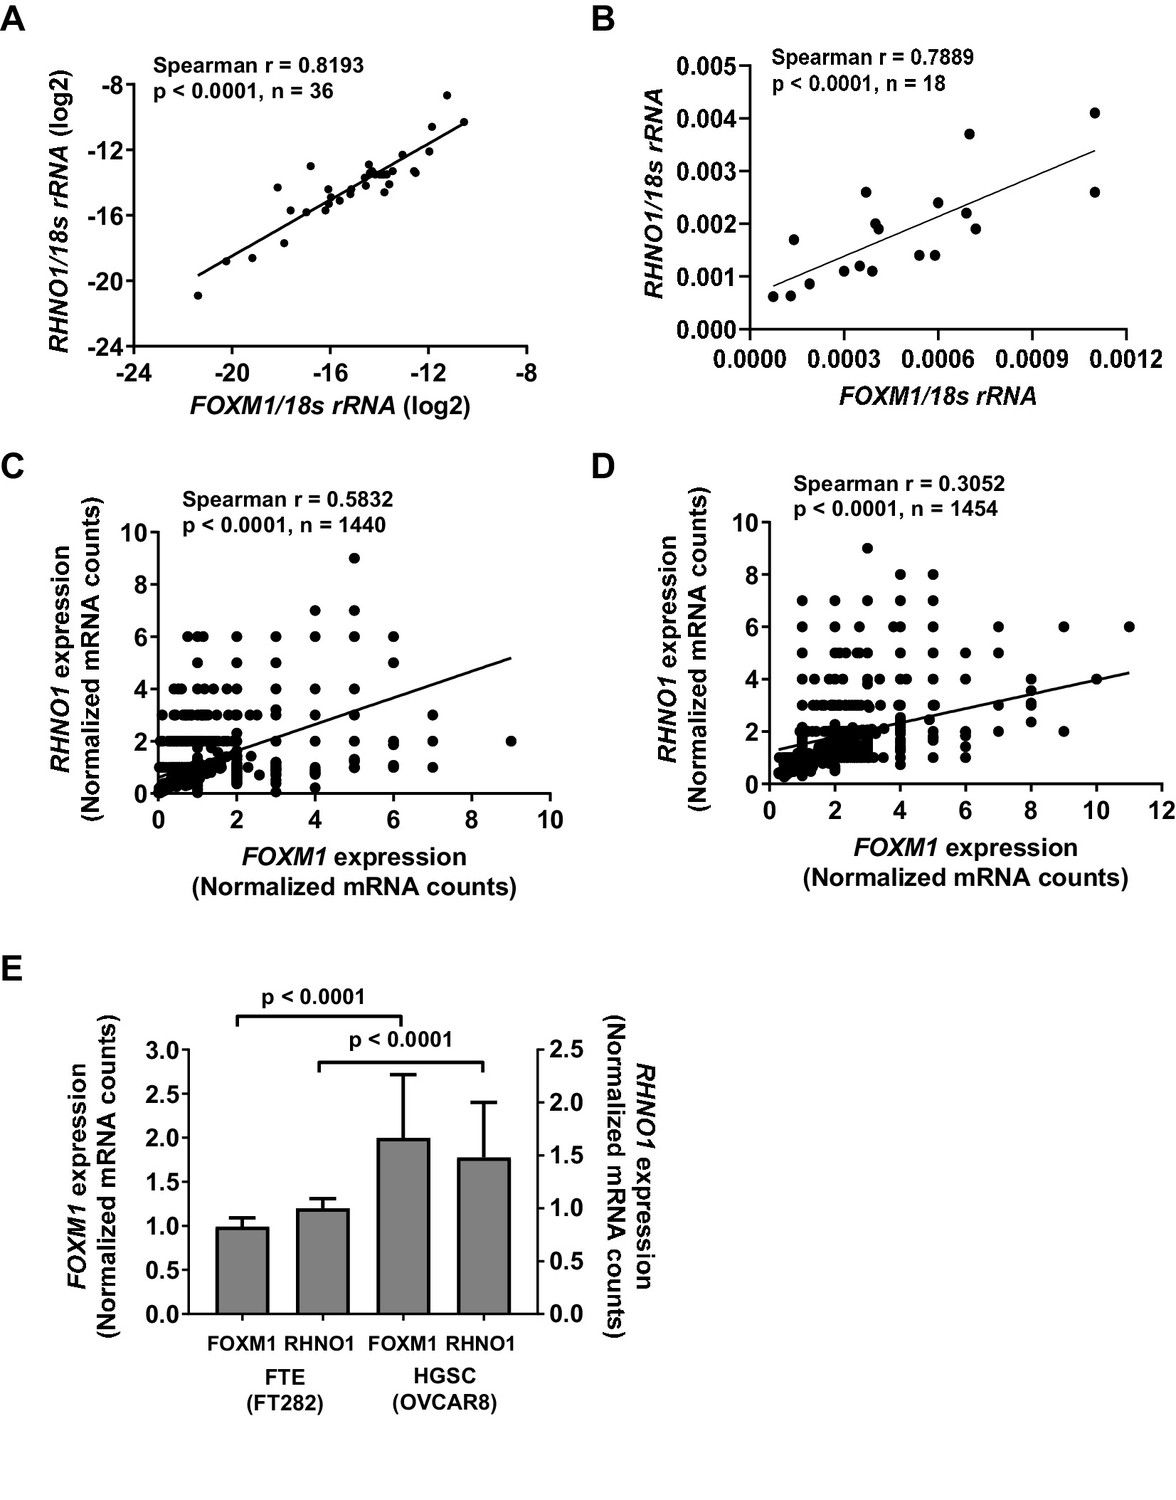
FOXM1 and RHNO1 expression correlates in high-grade serous carcinoma (HGSC) and in HGSC precursor cells.
(A) FOXM1 vs. RHNO1 expression in primary HGSC tumors, as determined by RT-qPCR. (B) FOXM1 vs. RHNO1 expression in Fallopian tube epithelium (N = 5), ovarian surface epithelium (N = 3), and HGSC (N = 10) cell lines, as determined by RT-qPCR. (C) FOXM1 vs. RHNO1 expression in FT282 cells, as determined by scRNA-seq. (D) FOXM1 vs. RHNO1 expression in OVCAR8 HGSC cells, as determined by scRNA-seq. (A–D) show the Spearman r value, p-value, and the number of samples analyzed. (E) FOXM1 and RHNO1 expression in FT282 and OVCAR8 cells, plotting the median values from scRNA-seq data. Mann–Whitney p-values are shown.
Figure 5 with 1 supplement
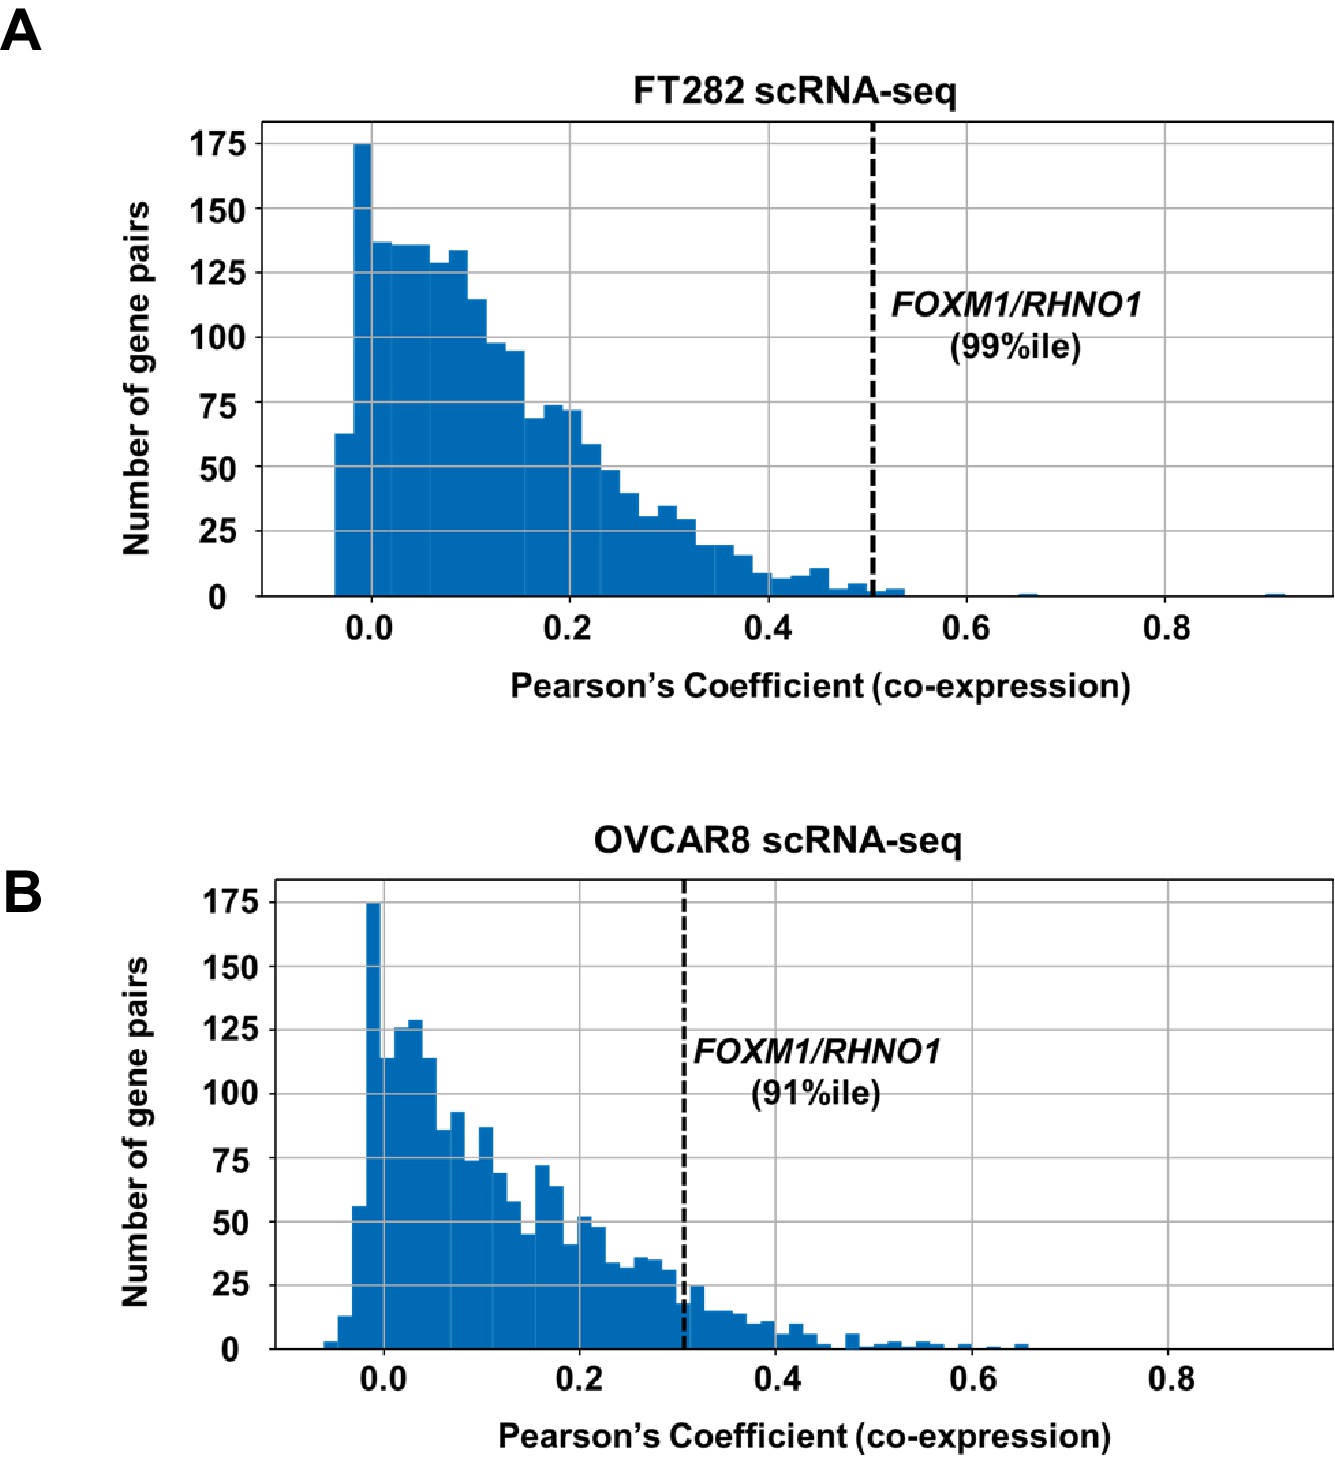
Distribution of correlation coefficients for bidirectional gene pairs (n = 2172) from scRNA-seq data.
Data are shown for (A) FT282 and (B) OVCAR8 cell lines. The x-axis plots the degree of co-expression (Pearson's coefficient) between bidirectional gene pairs, and y-axis plots the frequency of bidirectional pairs. The rank percentile of the FOXM1/RHNO1 correlation in each cell type is shown and is indicated by the dashed vertical line.
Figure 5—figure supplement 1
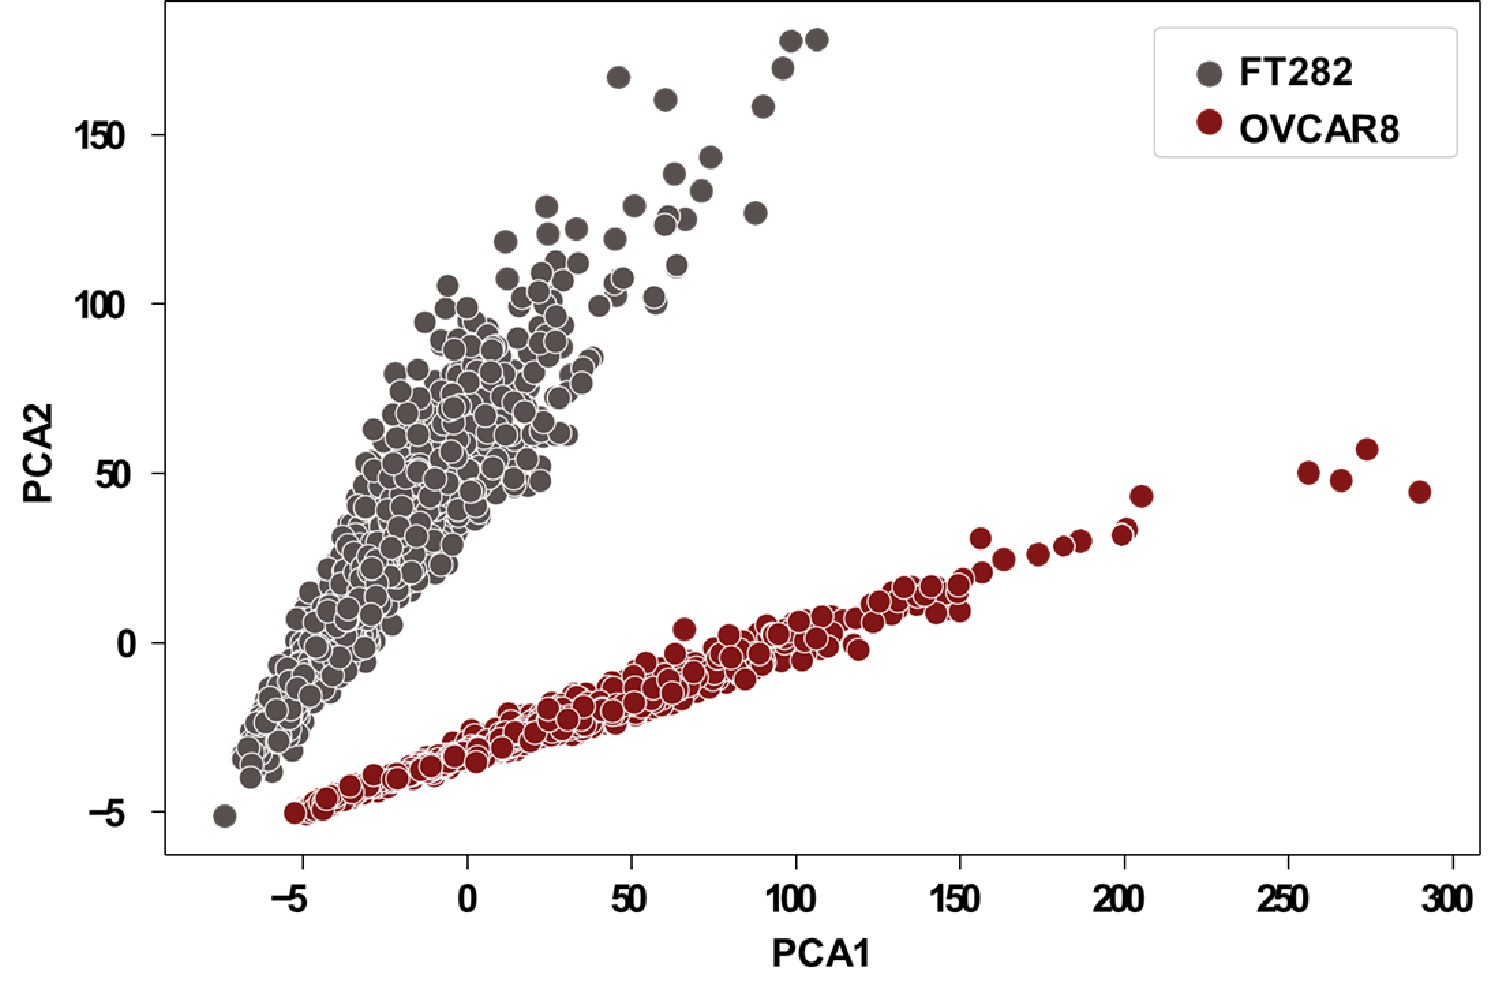
Principal component analyses (PCA) of FT282 (n = 1440) and OVCAR8 (n = 1454) single cells, using scRNA-seq data.
PCA analyses were performed using Python.
Figure 6
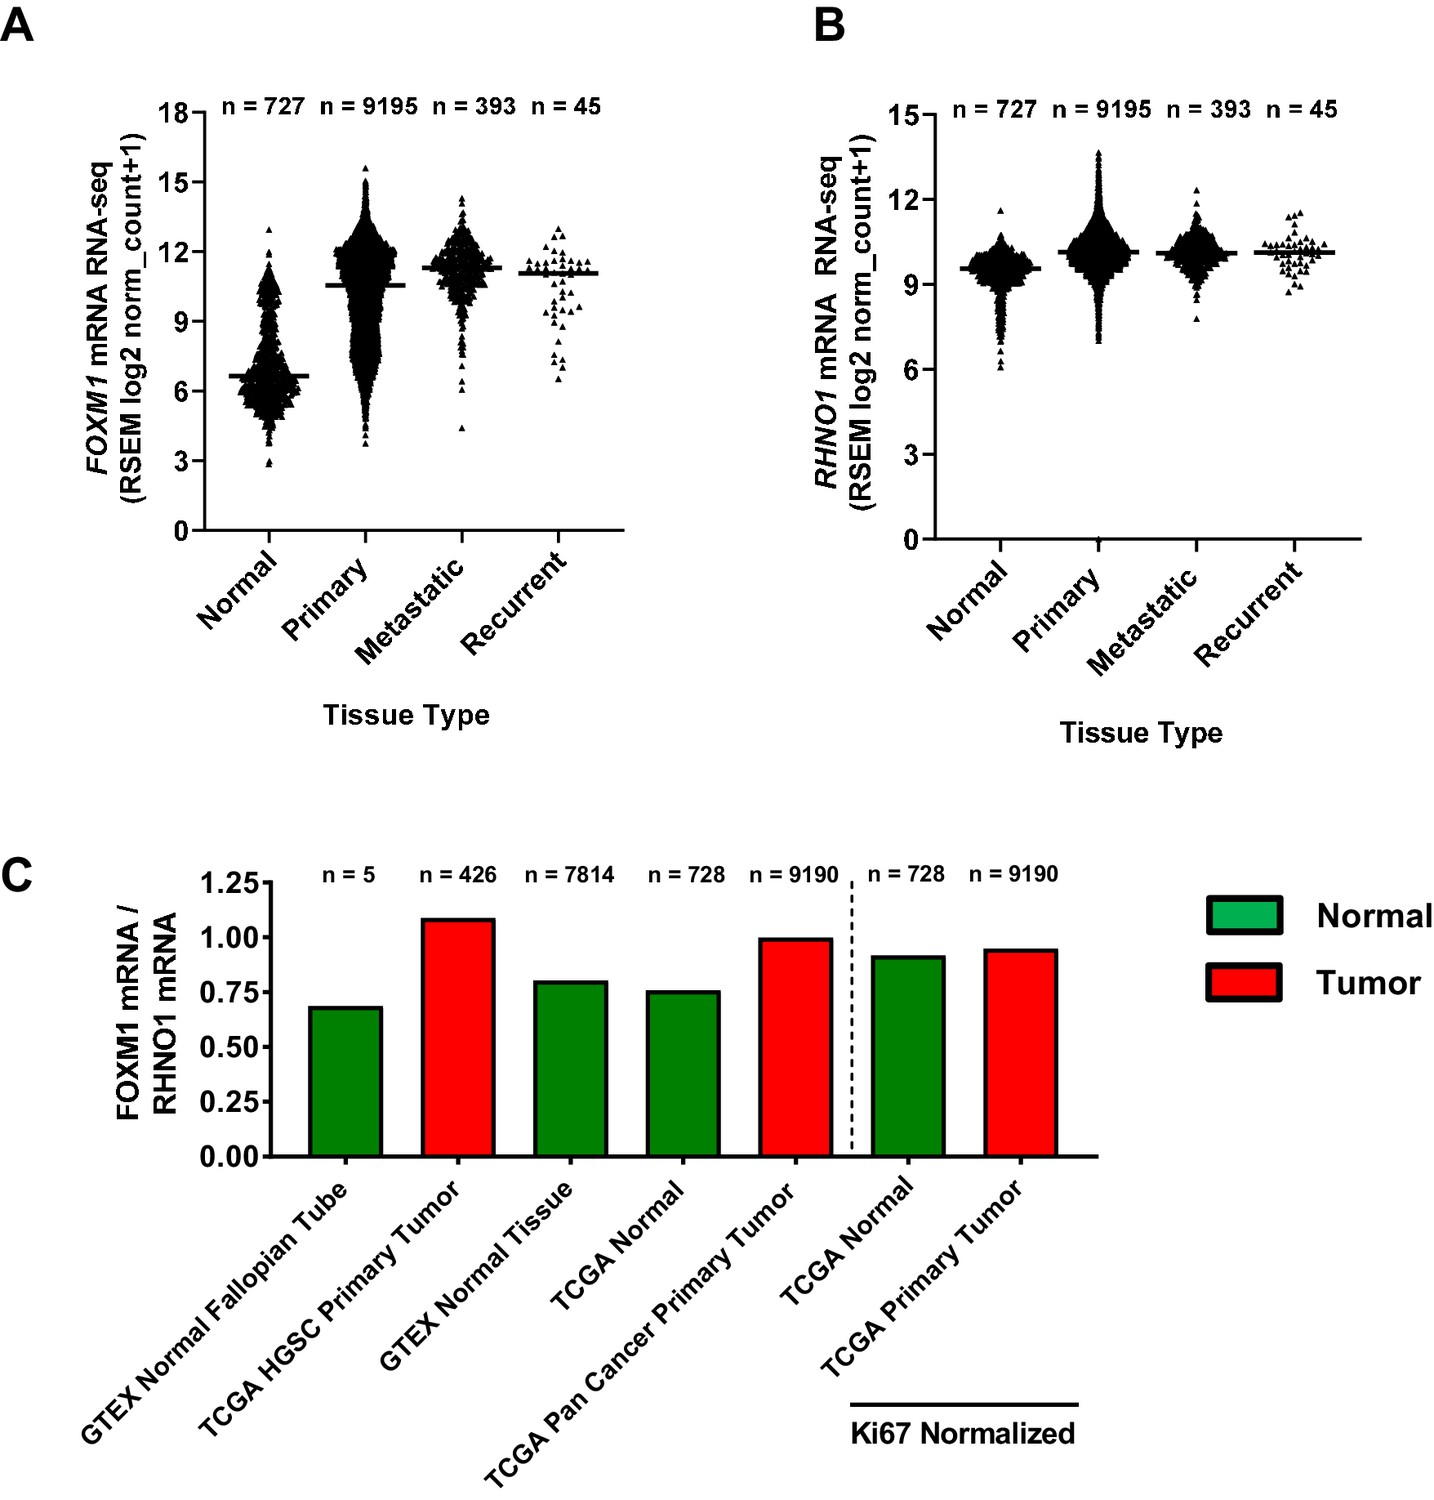
FOXM1 and RHNO1 mRNA expression and expression ratio in normal and cancer tissues.
(A) FOXM1 and (B) RHNO1 expression (RNA-seq) in normal tissues (from Genotype-Tissue Expression and The Cancer Genome Atlas [TCGA]) vs. different types of TCGA tumor tissues (i.e., primary, metastatic, and recurrent). The number of samples in each group is shown. All comparisons of normal vs. tumor samples were highly significant (p<0.0001, t-tests). (C) FOXM1/RHNO1 mRNA expression ratio in normal and cancer tissues, for the data shown in (A, B). The FOXM1/RHNO1 ratio for the samples to the right of the dashed line was normalized to MKI67 (a.k.a. Ki67), the canonical proliferation marker.
Figure 7
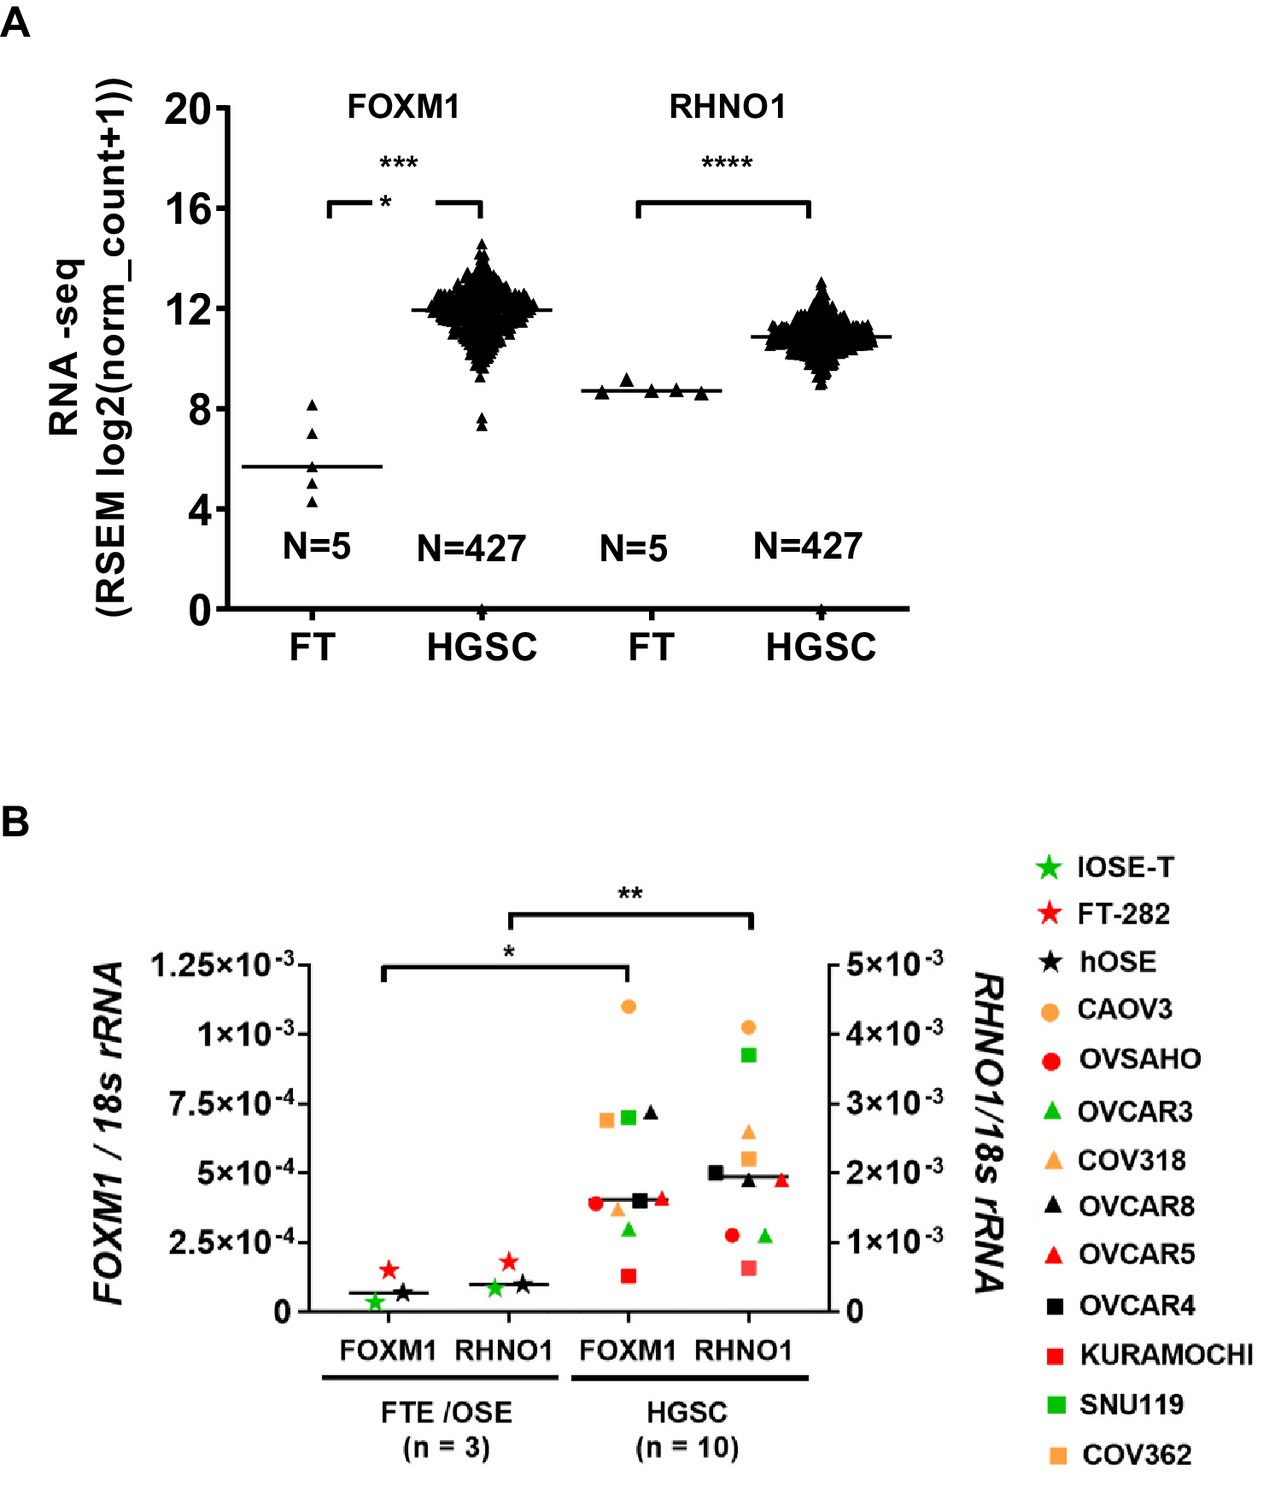
FOXM1 and RHNO1 are overexpressed in high-grade serous carcinoma (HGSC).
(A) FOXM1 and RHNO1 expression in Genotype-Tissue Expression normal Fallopian tube (FT; N = 5) vs. The Cancer Genome Atlas HGSC tissues (RNA-seq) (N = 427). (B) FOXM1 and RHNO1 mRNA expression in Fallopian tube epithelium/ovarian surface epithelium cells vs. HGSC cell lines (RT-qPCR). t-test p-values are shown. p-value designation: ****<0.0001, ***<0.001, **<0.01, *<0.05. The key shown at right indicates the cell types for each data point.
Figure 8
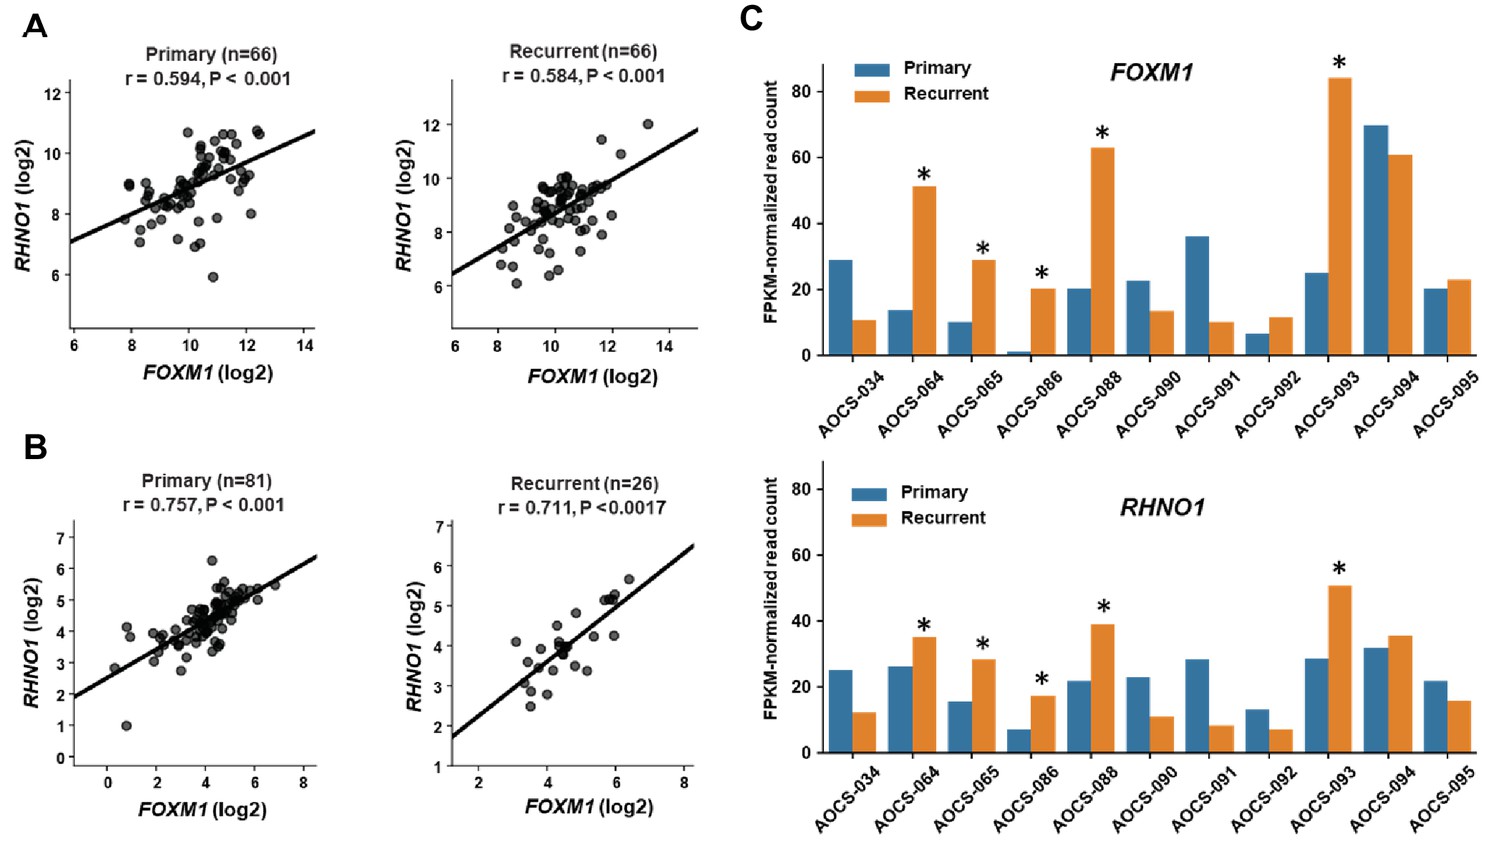
FOXM1 and RHNO1 expression in primary and recurrent high-grade serous carcinoma (HGSC).
(A) FOXM1 vs. RHNO1 expression (RNA-seq data) in primary (left) and recurrent (right) HGSC samples from Kreuzinger et al., 2017. (B) FOXM1 vs. RHNO1 expression (RNA-seq data) in primary (left) and recurrent (right) HGSC samples from Patch et al., 2015. For (A, B) , the number of samples (n), Spearman r value, and p-value are shown. (C) FOXM1 (top) and RHNO1 (bottom) expression (RNA-seq) in patient-matched primary vs. recurrent HGSC samples from Patch et al., 2015. Asterisks indicate patients showing coordinately increased expression of both FOXM1 and RHNO1 in recurrent tumors (5/11 = 45% of patients).
Figure 9 with 2 supplements
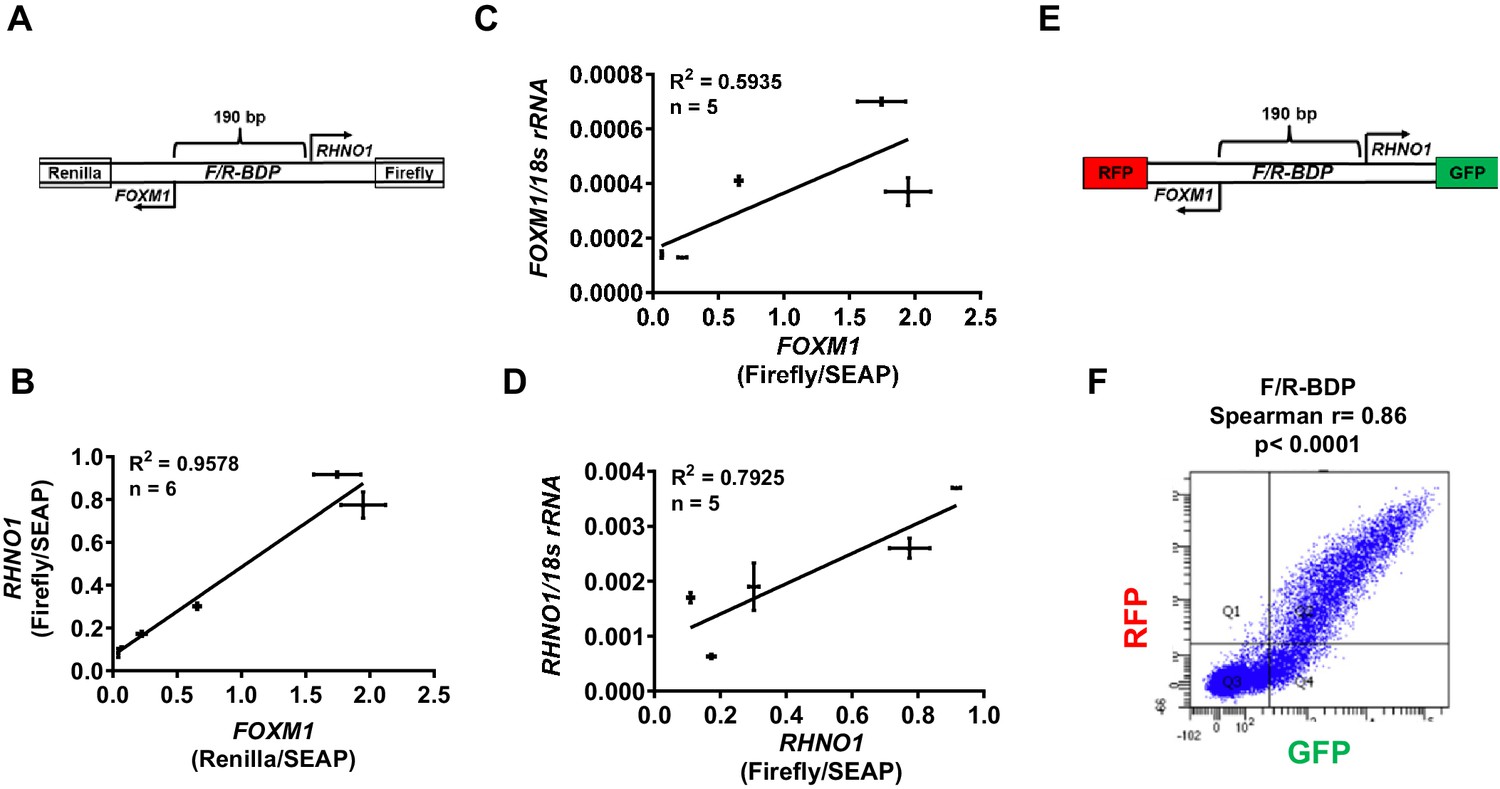
F/R-BDP promoter activity assays.
(A) Schematic of the F/R-BDP dual luciferase reporter construct. The FOXM1 promoter direction drives Renilla luciferase, and the RHNO1 promoter direction drives firefly luciferase. Secreted embryonic alkaline phosphatase (SEAP) was used as a normalization control for transfection efficiency. (B) Correlation of FOXM1 and RHNO1 promoter activity in Fallopian tube epithelium (FTE) (FT282) and high-grade serous carcinoma (HGSC) cell lines (OVCAR5, COV318, OVCAR4, Kuramochi, SNU119). (C, D) Correlation of FOXM1 or RHNO1 promoter activity vs. endogenous expression of the cognate gene in FTE (FT282) and HGSC (OVCAR5, COV318, Kuramochi, SNU119) cell lines, as measured by RT-qPCR. In (B–D), error bars represent standard deviations. (E) Schematic of the F/R-BDP dual fluorescence reporter construct. The FOXM1 promoter direction drives red fluorescent protein (RFP) expression, and the RHNO1 promoter direction drives green fluorescent protein (GFP) expression. (F) Fluorescence-activated cell sorting analysis of GFP and RFP fluorescence in 293T cells transfected with the F/R-BDP reporter shown in (E). Quadrant 2 (RFP + GFP + cell population) correlation statistics are shown.
Figure 9—figure supplement 1
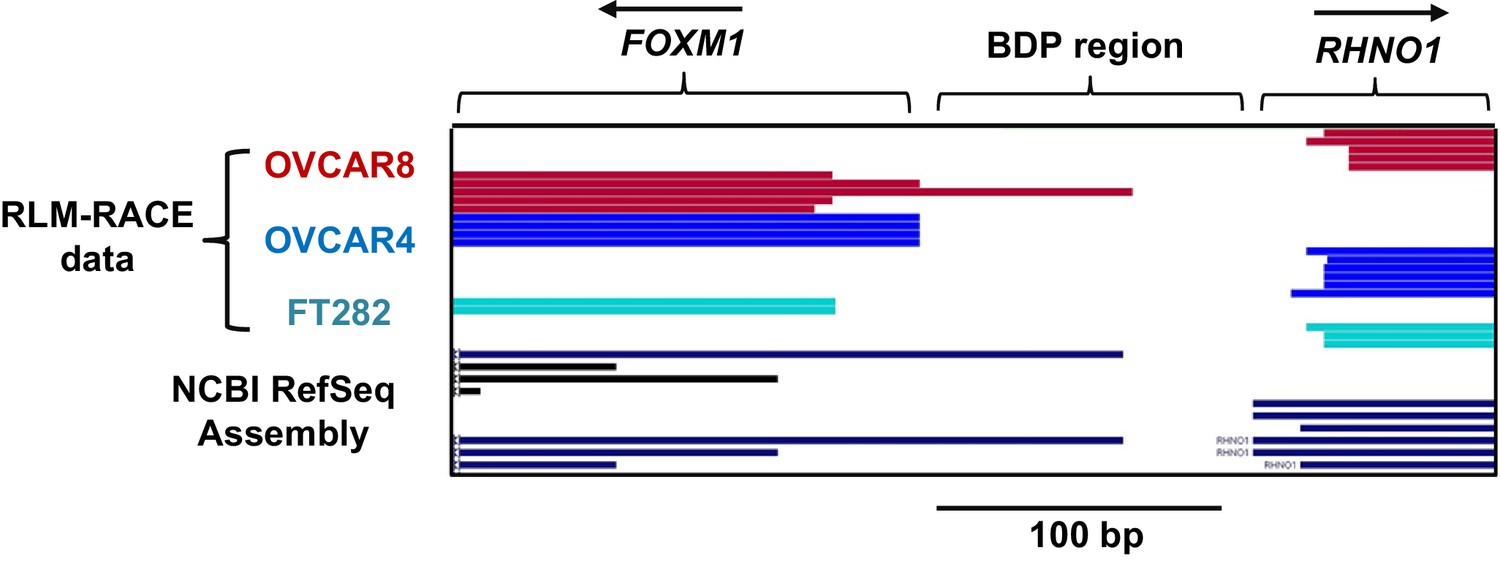
FOXM1 and RHNO1 transcriptional start sites.
5′ RNA ligase-mediated rapid amplification of cDNA ends (RLM-RACE) mapping data of the 5′ ends of FOXM1 and RHNO1 mRNA. The arrows indicate the orientation of each gene 5′ to 3′. The bars indicate the sequenced 5′ ends of each transcript, with the names of the individual cell line samples (color coded) at left. NCBI RefSeq transcript assembly data is shown at bottom.
Figure 9—figure supplement 2
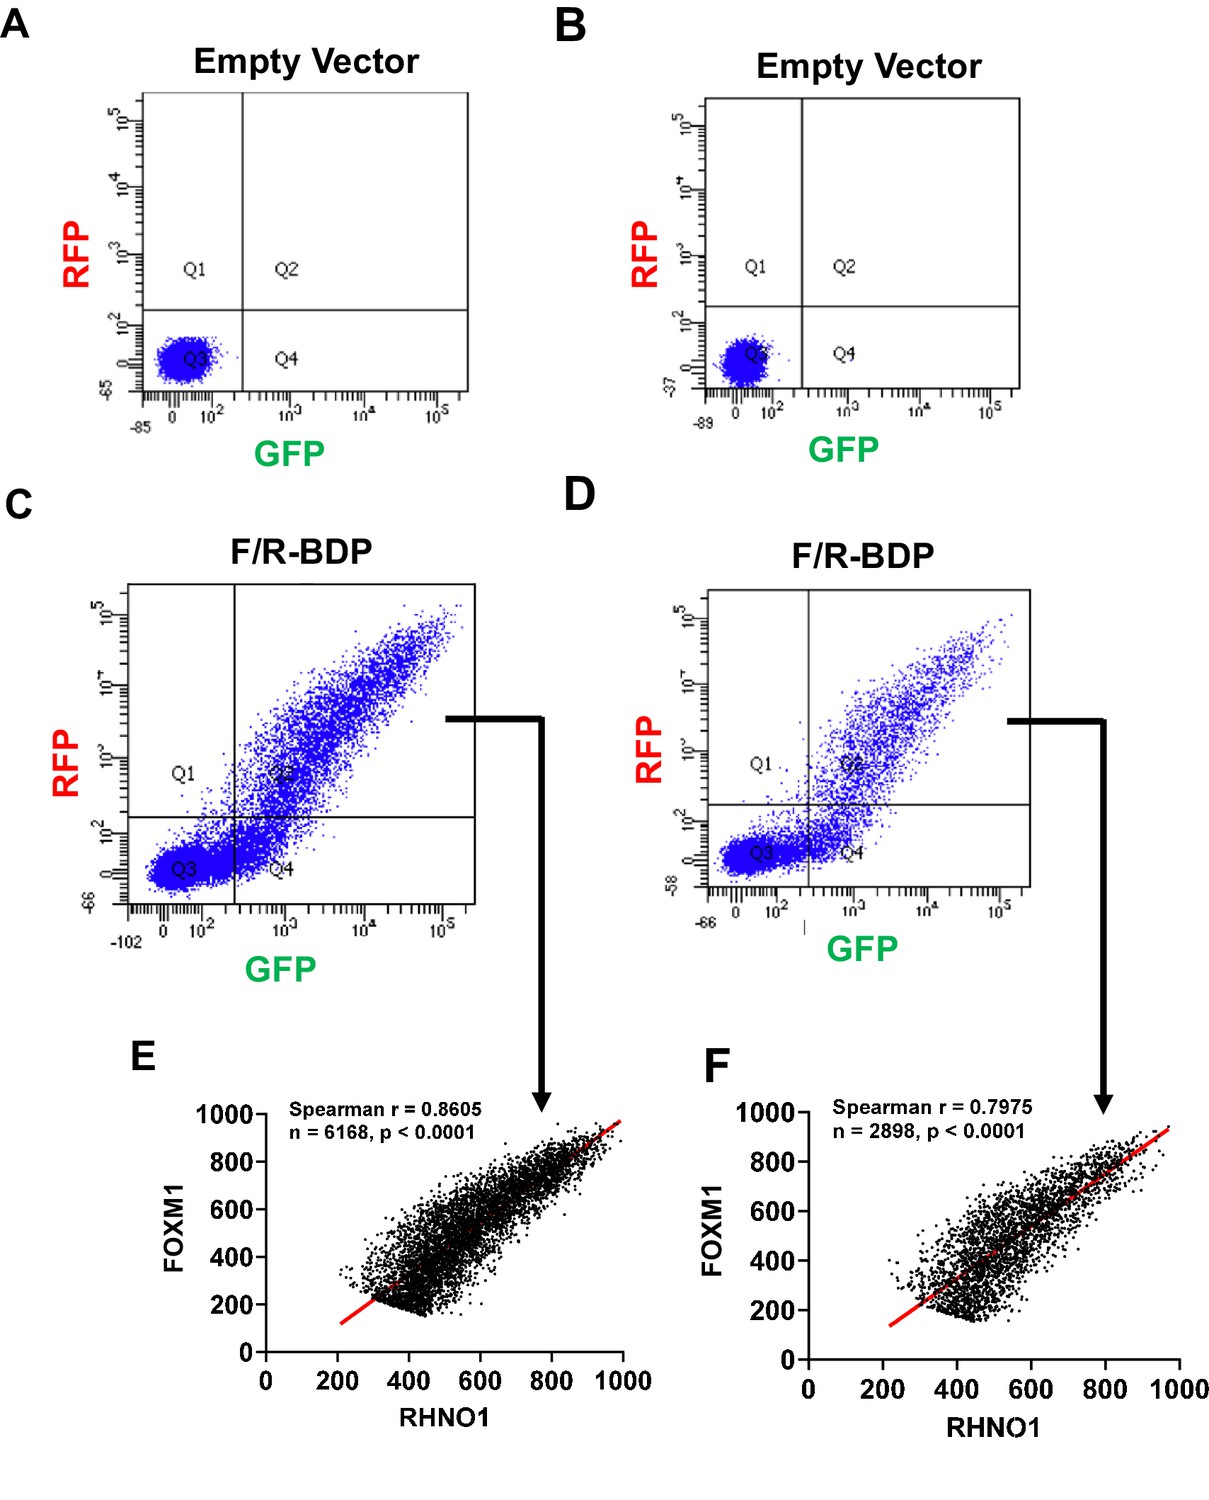
Fluorescence-activated cell sorting analyses of red fluorescent protein (RFP) and green fluorescent protein (GFP) expression in 293T cells.
(A, B) Empty vector transfections. (C, D) F/R-BPD dual reporter transfections. The reporter schematic is shown in Figure 9E. (E, F) Spearman correlation analyses of Quadrant 2 (i.e., RFP + GFP + cells) from (C, D) as indicated.
Figure 10
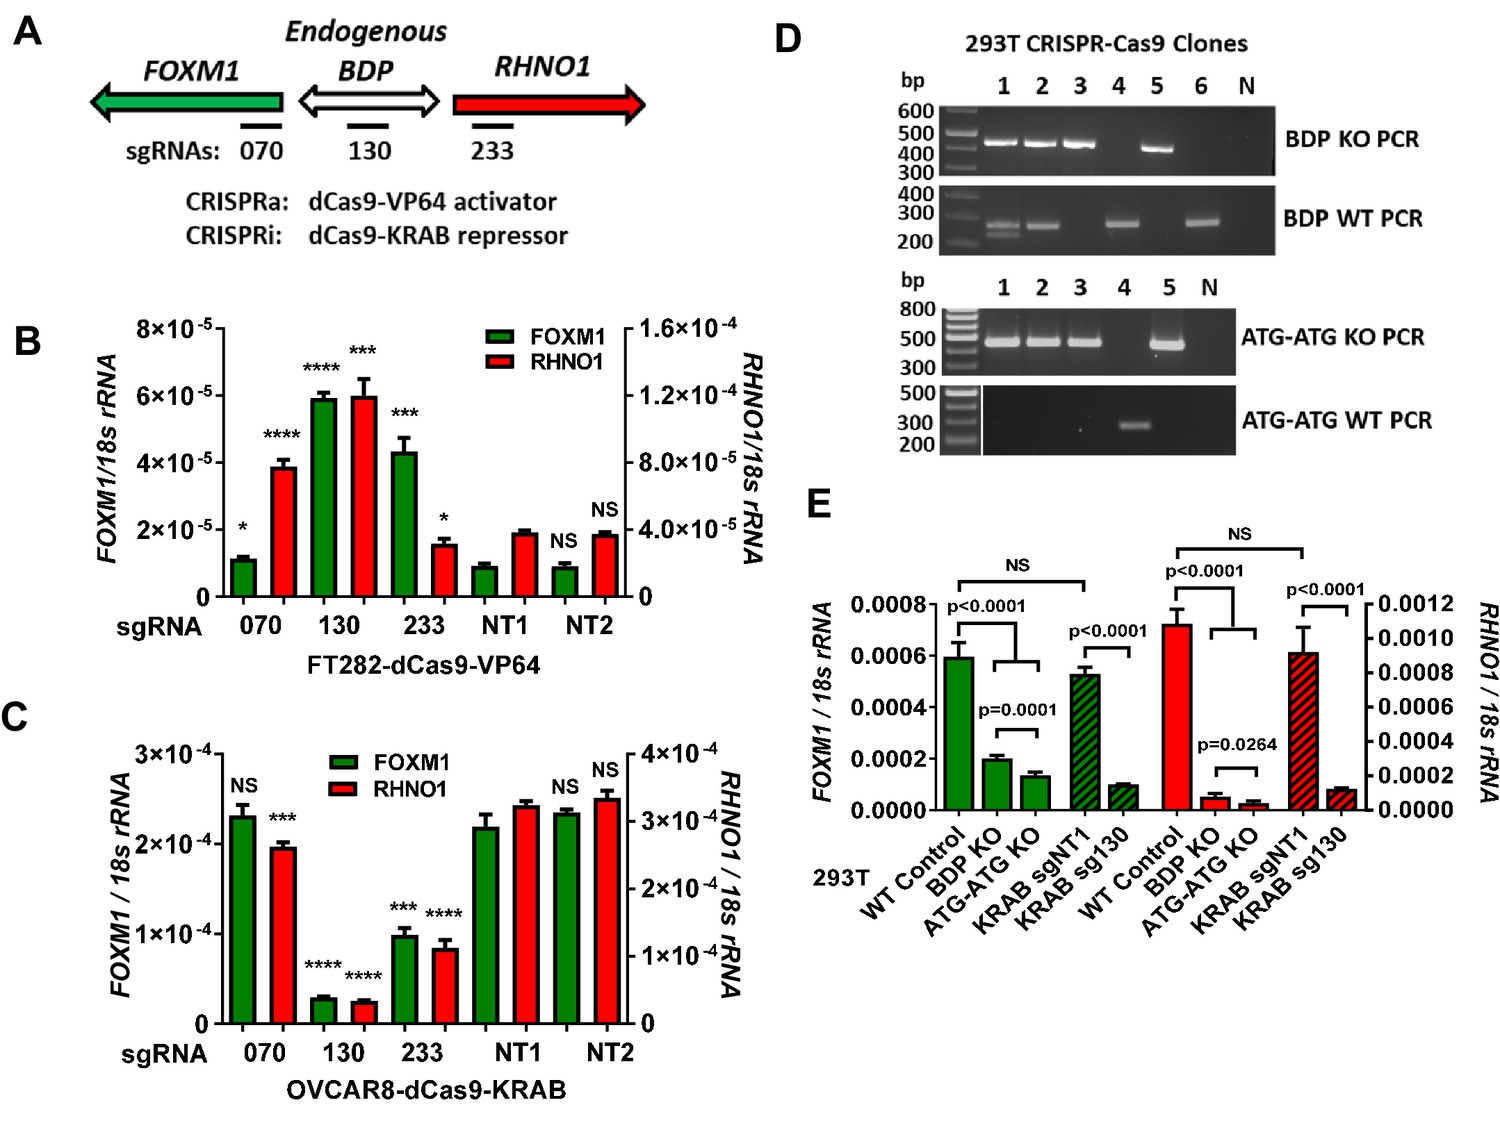
Endogenous FOXM1 and RHNO1 are co-regulated by their bidirectional promoter (F/R-BDP).
(A) Schematic of the experimental approach used in (B, C). The position of the CRISPR guide RNAs is indicated with black rectangles. (B) CRISPRa experiment in FT282 cells. Endogenous FOXM1 and RHNO1 expression was measured by RT-qPCR. (C) CRISPRi experiment in OVCAR8 cells. Endogenous FOXM1 and RHNO1 mRNA expression was measured by RT-qPCR. In (B, C), NT1 and NT2 indicate non-targeting control guide RNAs, and t-test p-values are shown for the comparison with NT1 control for either FOXM1 or RHNO1. p-values: ****<0.0001, ***<0.001, **<0.01, *<0.05. (D) Genotyping data for 293T cells with knockout (KO) of the 200 bp F/R-BDP (BDP KO) or, as a control, the entire upstream regions (5′ of the translational start sites) of both FOXM1 and RHNO1 (ATG-ATG KO). N: no template control. (E) Endogenous FOXM1 and RHNO1 expression in 293T cells with the indicated genetic configurations. BDP KO and ATG-ATG KO correspond to cells described in (D). KRAB data for 293T cells (i.e., CRISPRi), using the strategy shown in (A), are shown for comparison on the right.
Figure 11 with 2 supplements

FOXM1 and RHNO1 each promote high-grade serous carcinoma cell clonogenic growth.
(A) OVCAR8 and CAOV3 cells engineered for doxycycline (dox)-inducible FOXM1 or RHNO1 shRNA knockdown. Cells were grown in the presence of dox for 72 hr, and protein was extracted for western blot analyses. (B) Cells were seeded into 6-well dishes, in triplicate. Dox was added at the time of seeding, and media containing dox was replenished every 48 hr. Clonogenic growth was measured at 12–14 days, and the number of colonies (>50 cells) was counted. NS: nontargeting shRNA. (C) OVCAR8 and CAOV3 cells were engineered for FOXM1 or RHNO1 CRISPR knockout. Western blot analysis of polyclonal cell populations was performed 72 hr post-lentivirus infection. CTL: control guide RNA. (D) Clonogenic growth was measured as described in (B). t-test p-values vs. control: ****<0.0001, ***<0.001, **<0.01, *<0.05.
Figure 11—figure supplement 1
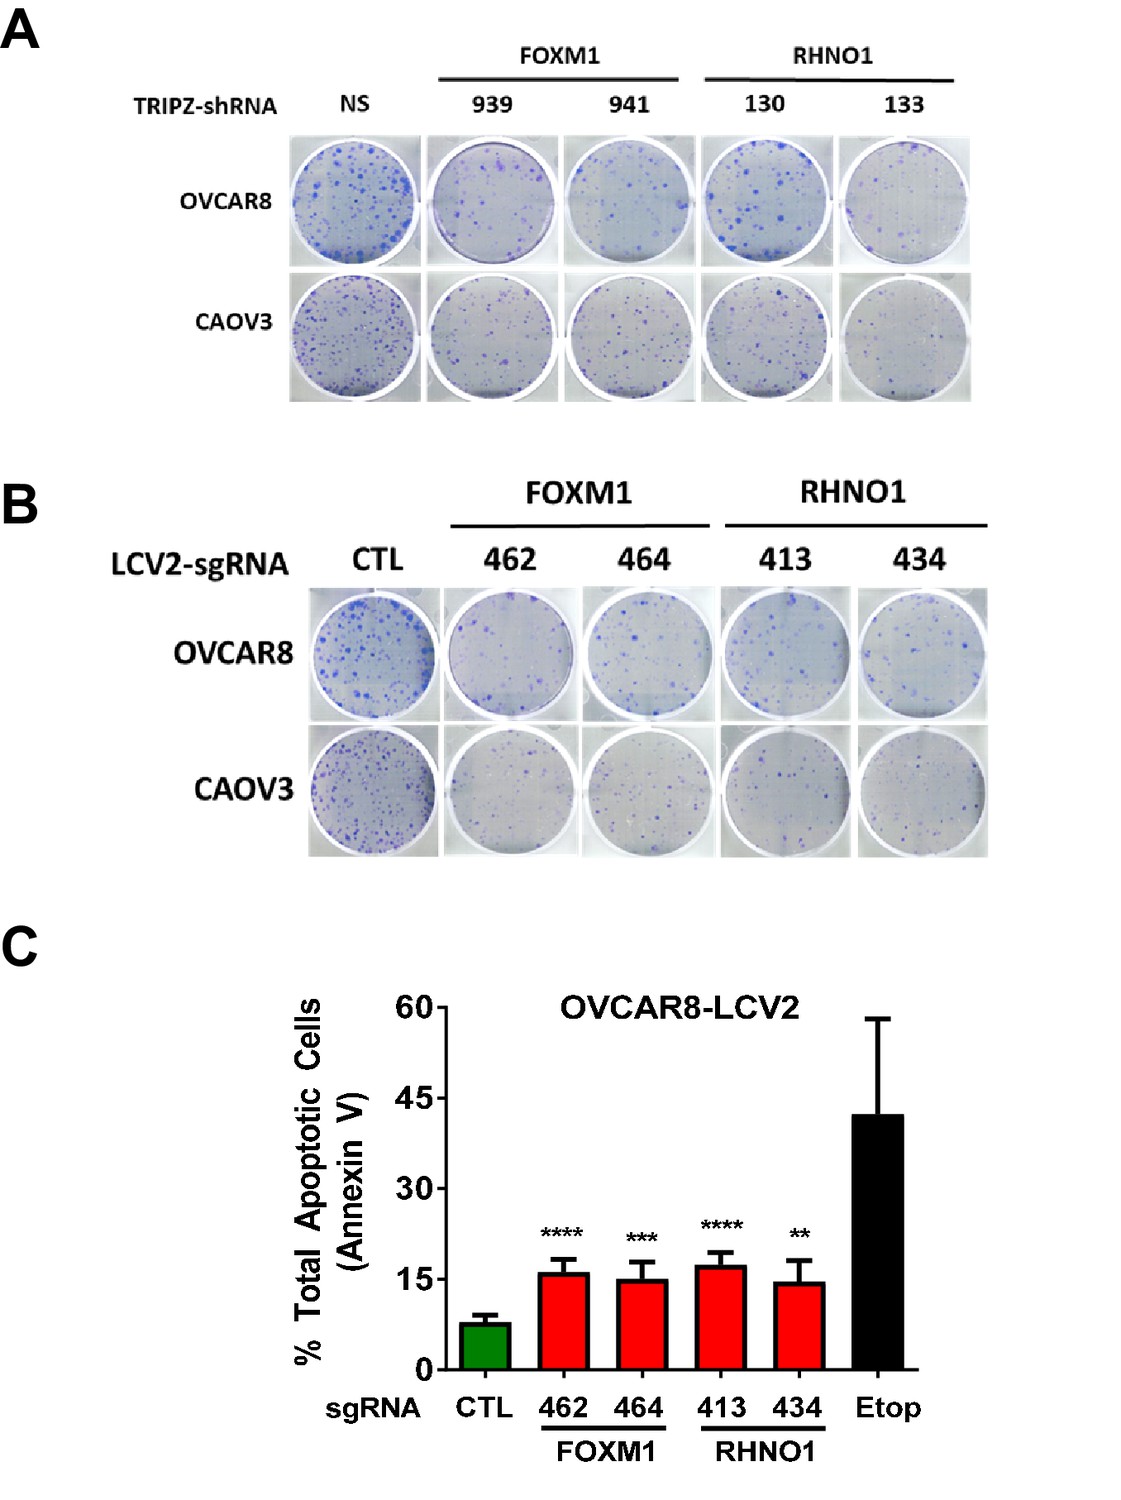
FOXM1 and RHNO1 each promote high-grade serous carcinoma cell clonogenic growth.
(A) Representative colony formation data for OVCAR8 and CAOV3 cells sustaining FOXM1 or RHNO1 knockdown. NS: nontargeting shRNA. (B) Representative colony formation data for OVCAR8 and CAOV3 cells sustaining FOXM1 or RHNO1 CRISPR knockout. CTL: control guide RNA. (C) Annexin V apoptosis assay results for OVCAR8 cells sustaining FOXM1 or RHNO1 CRISPR knockout. Etoposide-treated cells served as the positive control for apoptosis. t-test p-values: ****<0.0001, ***<0.001, **<0.01, *<0.05.
Figure 11—figure supplement 2

Representative TIDE analyses data for high-grade serous carcinoma cells sustaining FOXM1 or RHNO1 CRISPR gene knockout.
OVCAR8 and CAOV3 cells engineered for FOXM1 or RHNO1 CRISPR knockout were assessed for indel frequency among a mixed pool of cells. (A–D) Indel spectra for (A) OVCAR8 LCV2 FOXM1 462 cells; (B) CAOV3 LVC2 FOXM1 462 cells; (C) OVCAR8 LCV2 RHNO1 413 cells; (D) CAOV3 LCV2 RHNO1 413 cells.
Figure 12 with 1 supplement

OVCAR8 cells with dual FOXM1 and RHNO1 shRNA knockdown have diminished clonogenic growth.
OVCAR8 high-grade serous carcinoma cells were engineered for doxycycline (dox)-inducible FOXM1 and/or RHNO1 shRNA knockdown. (A) OVCAR8 cells treated with dox for 72 hr followed by western blot analysis. (B) Representative clonogenic growth data. Cells were seeded into a 6-well dish, in triplicate, at a density of 500 cells. Dox was added at the time of seeding, and media containing dox was replenished every 48 hr. Clonogenic survival was measured at 12 days, and cells were fixed with methanol and stained with crystal violet. (C) Quantification of clonogenic growth data. Colonies containing more than 50 cells were counted, and clonogenic survival was quantified as an average of the replicates. NS: nontargeting shRNA. The ANOVA linear trend p-value is shown.
Figure 12—figure supplement 1

CAOV3 cells with dual FOXM1 and RHNO1 shRNA knockdown have diminished clonogenic growth.
CAOV3 high-grade serous carcinoma cells were engineered for doxycycline (dox)-inducible FOXM1 and/or RHNO1 shRNA knockdown. CAOV3 cells treated with dox for 72 hr followed by (A) western blot confirmation of FOXM1 knockdown or (B) RT-qPCR confirmation of RHNO1 knockdown. (C) Representative clonogenic growth data. Cells were seeded into a 6-well dish, in triplicate, at a density of 500 cells. Dox was added at the time of seeding, and media containing dox was replenished every 48 hr. Clonogenic survival was measured at 12 days, and cells were fixed with methanol and stained with crystal violet. (D) Quantification of clonogenic growth data. Colonies containing more than 50 cells were counted, and clonogenic survival was quantified as an average of the replicates. NS: nontargeting shRNA. The ANOVA linear trend p-value is shown.
Figure 13
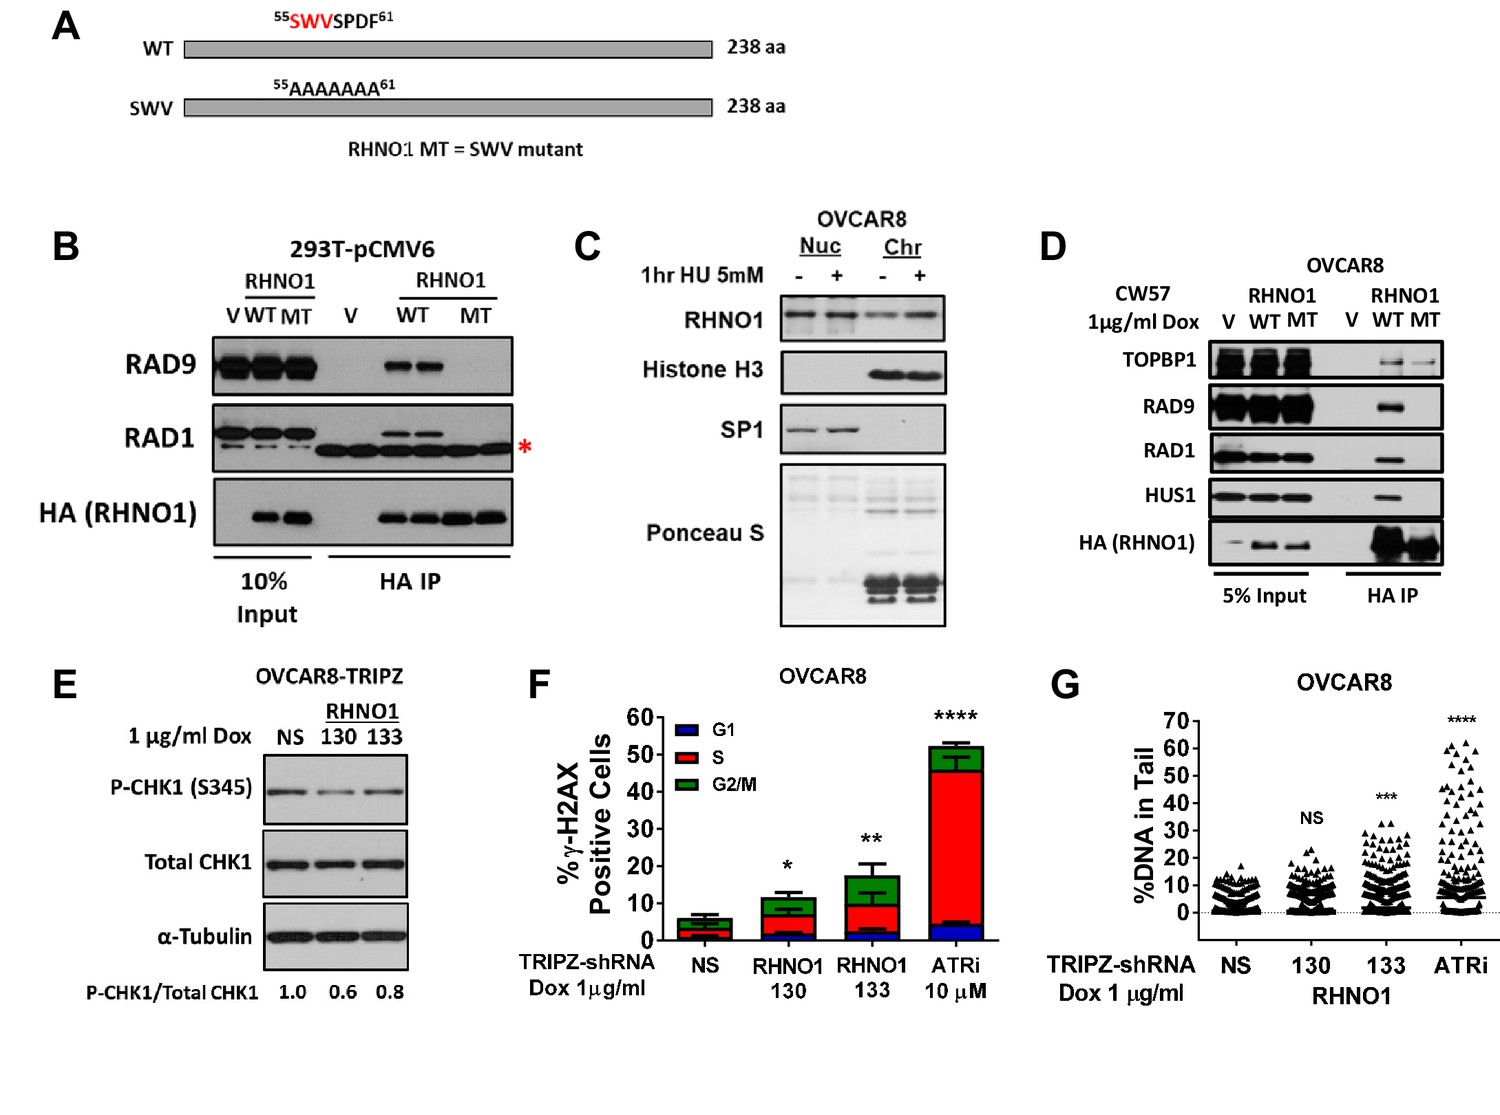
RHNO1 functions in the replication stress response in high-grade serous carcinoma cells.
(A) Schematic of RHNO1 wild-type and SWV mutant. The proteins are the same molecular weight but residues 55–61 are converted to alanine in the SWV mutant, disrupting its ability to interact with 9-1-1 proteins. (B) 293T cells were transfected with empty vector, vector expressing HA-RHNO1-WT or SWV mutant. Protein was harvested 24 hr post transfection for Co-IP and western blot analyses. The red asterisk indicates a non-specific band. (C) OVCAR8 cells were seeded for 24 hr, then treated with vehicle or 5 mM hydroxyurea (HU) for 1 hr, and cells were harvested for subcellular fraction into soluble nuclear and chromatin bound proteins and western blot analysis. Histone H3 was used as the chromatin control and Sp1 as the soluble nuclear control. (D) OVCAR8-inducible RHNO1 knockdown cells were engineered for inducible expression of HA-tagged RHNO1-WT or SWV mutant, grown in the presence of doxycycline (dox) for 72 hr, and then protein was harvested for Co-IP/western blot analyses. (E) OVCAR8 western blot measurement of P-Chk1 sustaining RHNO1 shRNA knockdown. (F) OVCAR8 cells were treated with the ATR inhibitor VE-822 or dox to induce RHNO1 shRNA knockdown, and gH2AX-positive cells in different cell cycle phases were quantified by fluorescence-activated cell sorting. (G) COMET analysis of DNA strand breakage in OVCAR8 cells following the treatments described in (F).
Figure 14

Binding to the 9-1-1 complex is required for RHNO1 function in OVCAR8 cell clonogenic growth.
OVCAR8 cells were engineered for doxycycline (dox)-inducible RHNO1 knockdown and simultaneous dox-inducible expression of HA-RHNO1 WT or SWV mutant. (A, B) Cells were seeded in the presence of dox and grown for 72 hr to harvest RNA and protein extracts, followed by (A) RT-qPCR or (B) western blot to confirm knockdown efficiency. (B) also shows HA-RHNO1 protein ectopic expression efficiency. (C) Cells were seeded into 6-well dishes in triplicate, in the presence of dox and at a density of 500 cells. Media containing dox was replenished every 48 hr. Clonogenic survival was measured 12 days later. A representative data set is shown. (D) For the experiment described in (C), colonies containing more than 50 cells were counted and clonogenic survival was quantified as an average of the replicates. V: vector control; NS: nontargeting shRNA. t-test p-values are shown. p-value designation: ****<0.0001, ***<0.001, **<0.01, *<0.05.
Figure 15
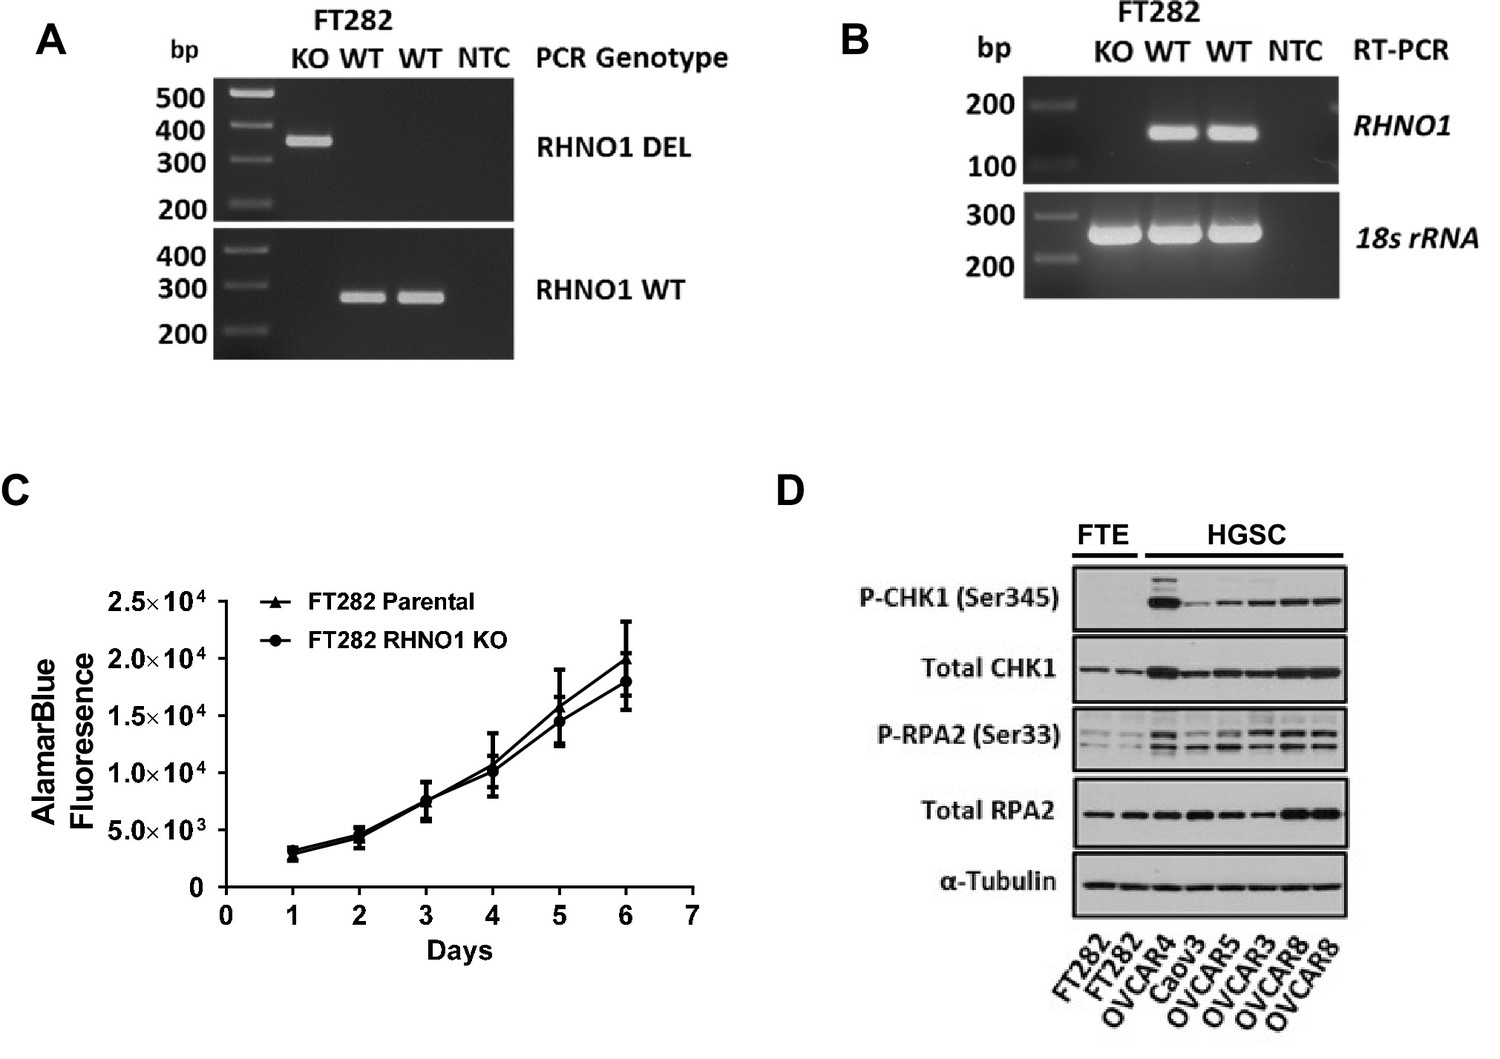
Homozygous knockout of RHNO1 in FT282 cells does not impact cell proliferation, and high-grade serous carcinoma (HGSC) cells show elevated expression of replication stress (RS) biomarkers compared to Fallopian tube epithelium (FTE) cells.
RHNO1 knockout was achieved using CRISPR-Cas9 with guide RNAs that targeted near the start and stop codon of RHNO1. (A, B) RHNO1 homozygous knockout was confirmed by (A) genomic DNA PCR and (B) RHNO1 mRNA expression measured by end-point RT-PCR. NTC: no template control. (C) FT282 parental and RHNO1 clonal knockout cells were seeded in quadruplicate and grown in culture for a period of 1 week. Cell growth/viability was measured by the AlamarBlue assay every 24 hr. (D) Western blot analyses of two canonical phosphoprotein biomarkers of RS in FTE and HGSC cell lines. Cell line sample names are shown below.
Figure 16
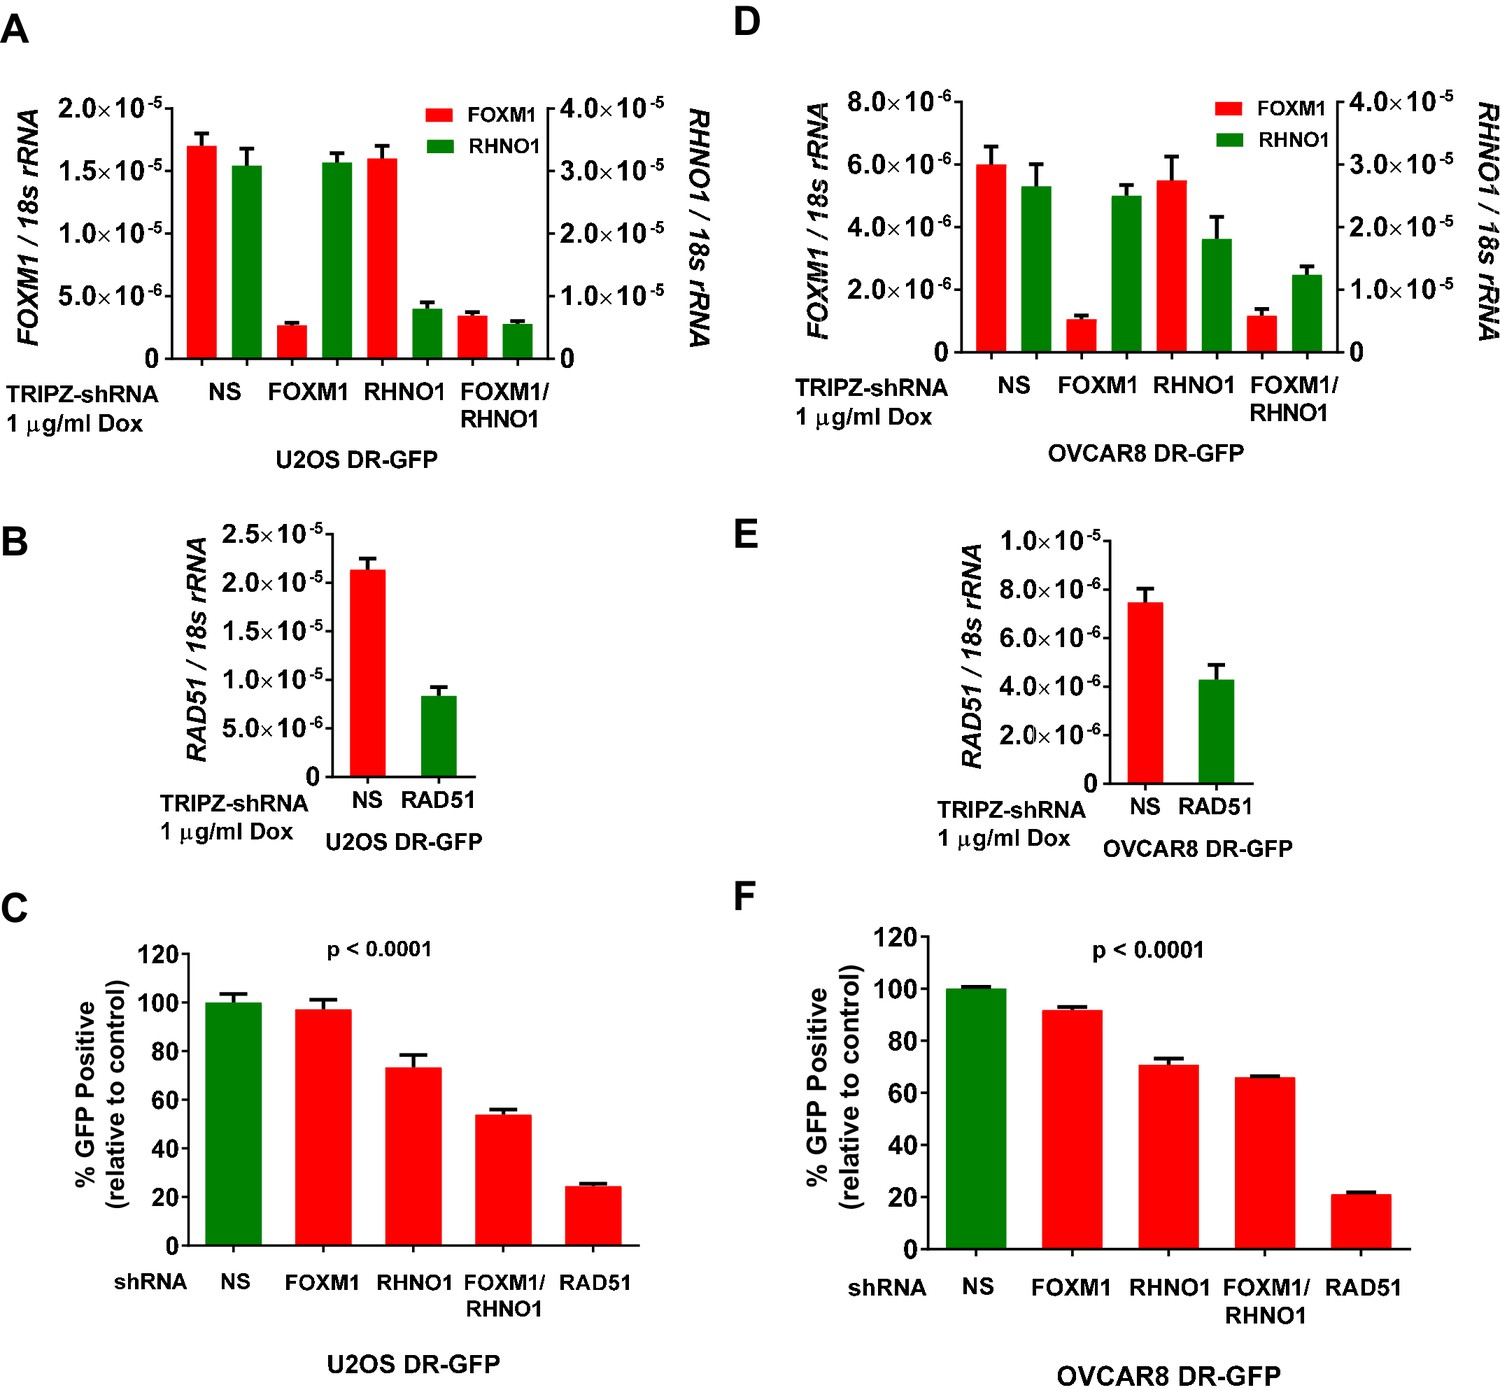
FOXM1 and RHNO1 promote homologous recombination (HR).
DR-GFP cell lines were treated with doxycycline (dox) to induce shRNA expression, and mRNA knockdowns were measured by RT-qPCR. (A, B) FOXM1, RHNO1, and RAD51 mRNA expression in U2OS-DR-GFP cells sustaining mRNA knockdown. (C) HR repair of I-SceI-induced DSBs in U2OS cells after the indicated mRNA knockdowns. Values are expressed relative to the percentage of green fluorescent protein (GFP)+ cells in I-SceI-transfected control cells. RAD51 knockdown was used as a robust positive control for HR impairment. (D, E) FOXM1, RHNO1, and RAD51 mRNA expression in OVCAR8-DR-GFP cells. (F) HR repair of I-SceI-induced DSBs in OVCAR8 cells after the indicated mRNA knockdowns. Values are expressed relative to the percentage of GFP+ cells in I-SceI-transduced control cells. RAD51 knockdown was used as a robust positive control for HR impairment. All results are shown as mean ± SE from three independent replicates. (C) and (F) show p-values for the linear trend (excluding the RAD51 control).
Figure 17 with 1 supplement
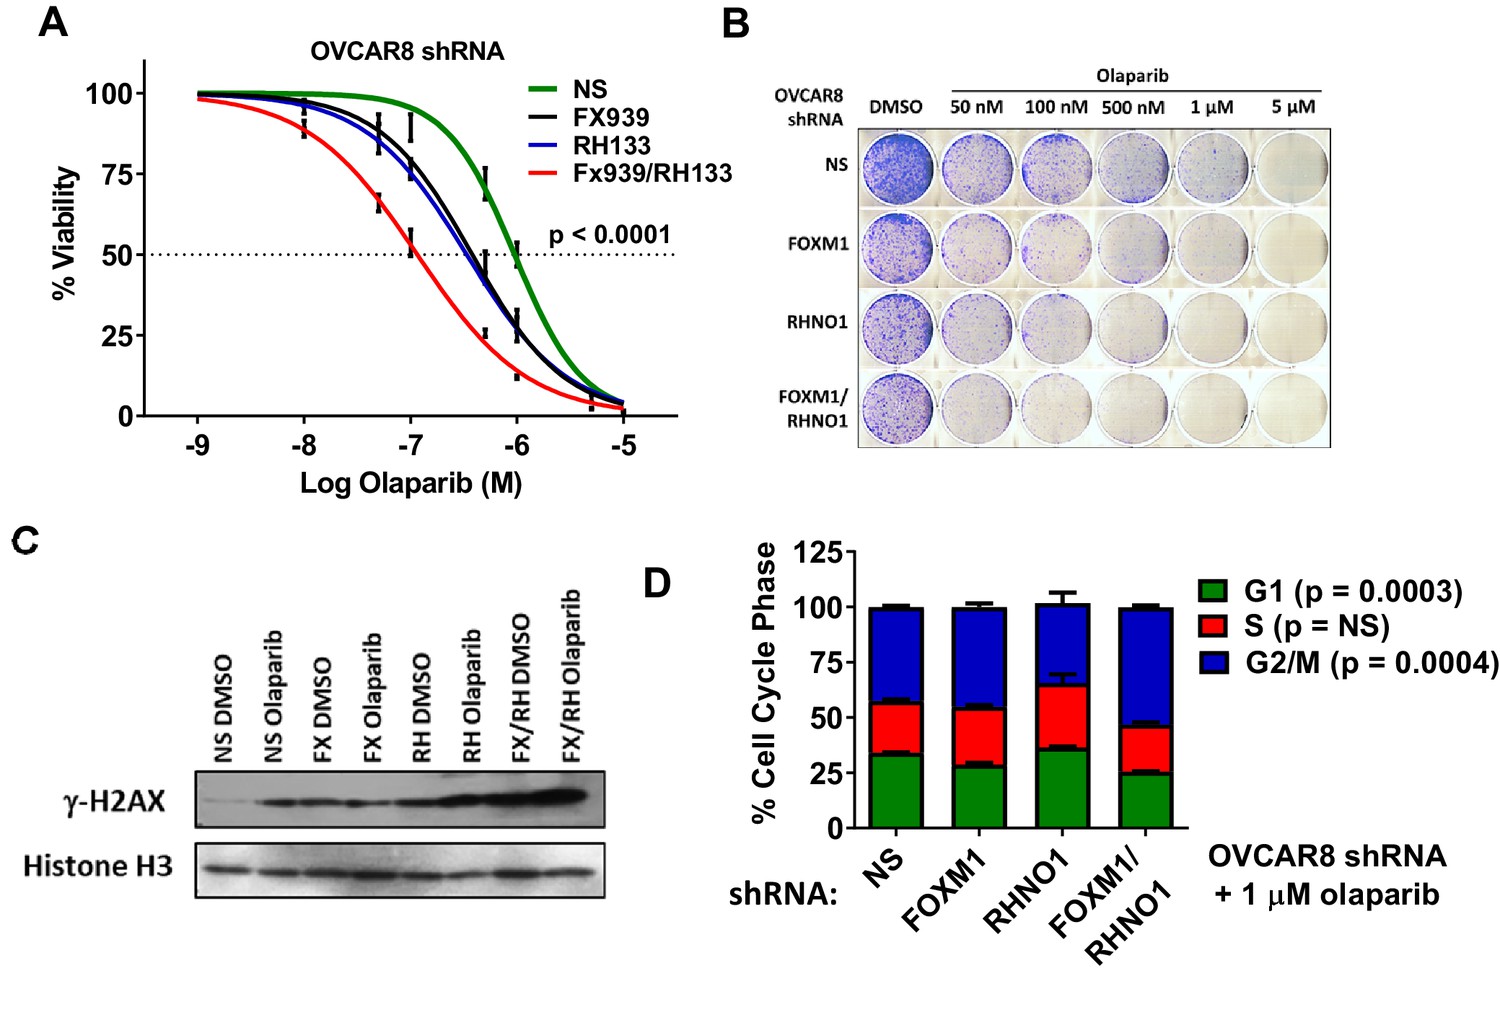
FOXM1 and RHNO1 knockdown-sensitize OVCAR8 cells to olaparib.
OVCAR8 cells engineered for doxycycline (dox)-inducible FOXM1 and/or RHNO1 shRNA knockdown were grown in dox for 72 hr prior to seeding cells for experiments. (A) Cells were seeded in 96-well plates in quadruplicate in the presence of dox at a density of 500 cells per well. 24 hr later, cells received media containing dox + vehicle control or olaparib, and this was repeated every 48 hr. Cell viability was measured at 8 days post-olaparib treatment using AlamarBlue assays. The ANOVA linear trend p-value is shown. (B) Cells were seeded into 6-well dishes in triplicate in the presence of dox at a density of 5000 cells per well. 24 hr later, cells received media containing dox and vehicle or olaparib, and this was repeated every 48 hr. After 8 days of growth, cells were fixed with methanol and stained with crystal violet for clonogenic assays. A representative result is shown. NS/CTL: nontargeting shRNA. (C) Western blot analysis of γ-H2AX in chromatin extracts from cells with dox-inducible control shRNA (NS), FOXM1 shRNA (FX), RHNO1 shRNA (RH), or both (FX/RH). After 48 hr in dox, cells were treated with vehicle control dimethyl sulfoxide (DMSO) or 1 µM olaparib for 24 hr, and protein extracts were harvested. Histone H3 served as a loading control. (D) Cells were treated as in (C), and cell cycle analyses were conducted 24 hr post-olaparib treatment.
Figure 17—figure supplement 1
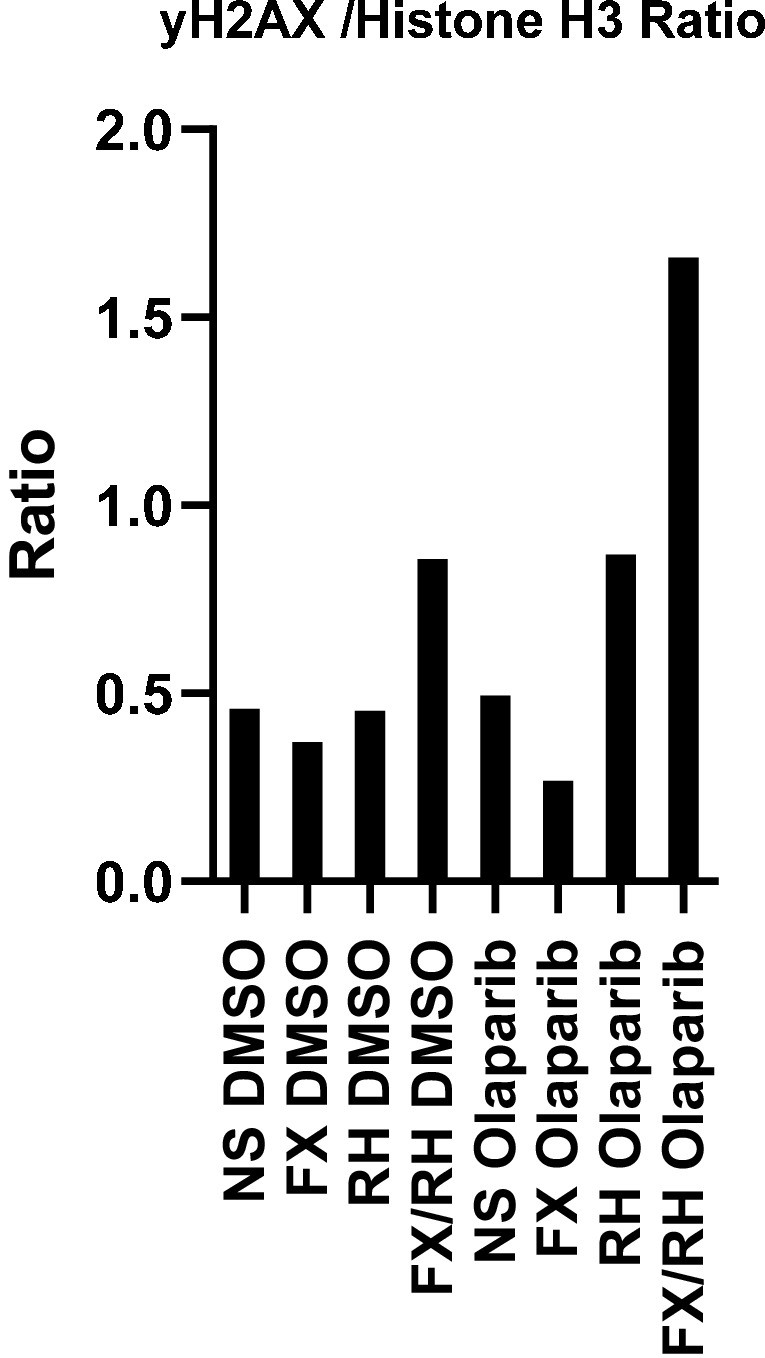
Quantification of γ-H2AX in OVCAR8 chromatin extracts following FOXM1 and/or RHNO1 knockdown and DMSO or olaparib treatment.
Western blots are shown in Figure 17C.
Figure 18

CRISPRi repression of the F/R-BDP sensitizes OVCAR8 cells to olaparib.
(A) OVCAR8 cells expressing the KRAB transcriptional repressor and a guide RNA targeting the F/R-BDP, and the corresponding changes in mRNA expression as measured by RT-qPCR. NT: nontargeting guide RNA. (B) Cells were seeded in 96-well plates in quadruplicate at a density of 500 cells per well. 24 hr later, cells received media containing vehicle or olaparib, and this was repeated every 48 hr. Cell viability was measured at 8 days using AlamarBlue, and the IC50 for olaparib was determined. An F-test was used to compare IC50 values. (C) Cells were seeded into a 6-well dish, in triplicate, at a density of 5000 cells per well. 24 hr later, cells received media containing vehicle or olaparib, and this was repeated every 48 hr. After 8 days of growth, cells were fixed with methanol and stained with crystal violet to visualize colonies. (D) The indicated cells were treated with olaparib for 48 hr, and apoptosis was measured using Annexin V staining/fluorescence-activated cell sorting (FACS) analysis. (E) Cell cycle profiles were measured using propidium iodide staining/FACS analysis. ANOVA linear trend p-values are shown.
Figure 19

CRISPRi repression of the F/R-BDP in olaparib-resistant cells increases olaparib sensitivity.
Parental and olaparib-resistant UWB1 cells were engineered to express the KRAB transcriptional repressor and a control guide RNA or guide RNA targeting the F/R-BDP (sg130). (A) Cells were seeded and grown for 72 hr, and RNA was harvested for RT-qPCR to measure CRISPRi efficiency. (B, C) UWB1 parental KRAB and (B) SyR12 KRAB or (C) SyR13 KRAB cells were seeded in 96-well plates in quadruplicate at a density of 750 cells per well. 24 hr later, cells received media containing vehicle or olaparib, and this was repeated every 48 hr. Cell viability was measured at 8 days post-treatment using AlamarBlue assays, and the IC50 for olaparib was determined. NT1: nontargeting control guide RNA. FOXM1/RHNO1: sg130 targeting the F/R-BDP. In (B, C), ANOVA linear trend statistics for the IC50 values are shown. Linear trends were ordered – SyR12/13 NT, SyR12/13 FOXM1/RHNO1 sg130, parental NT.
Figure 20
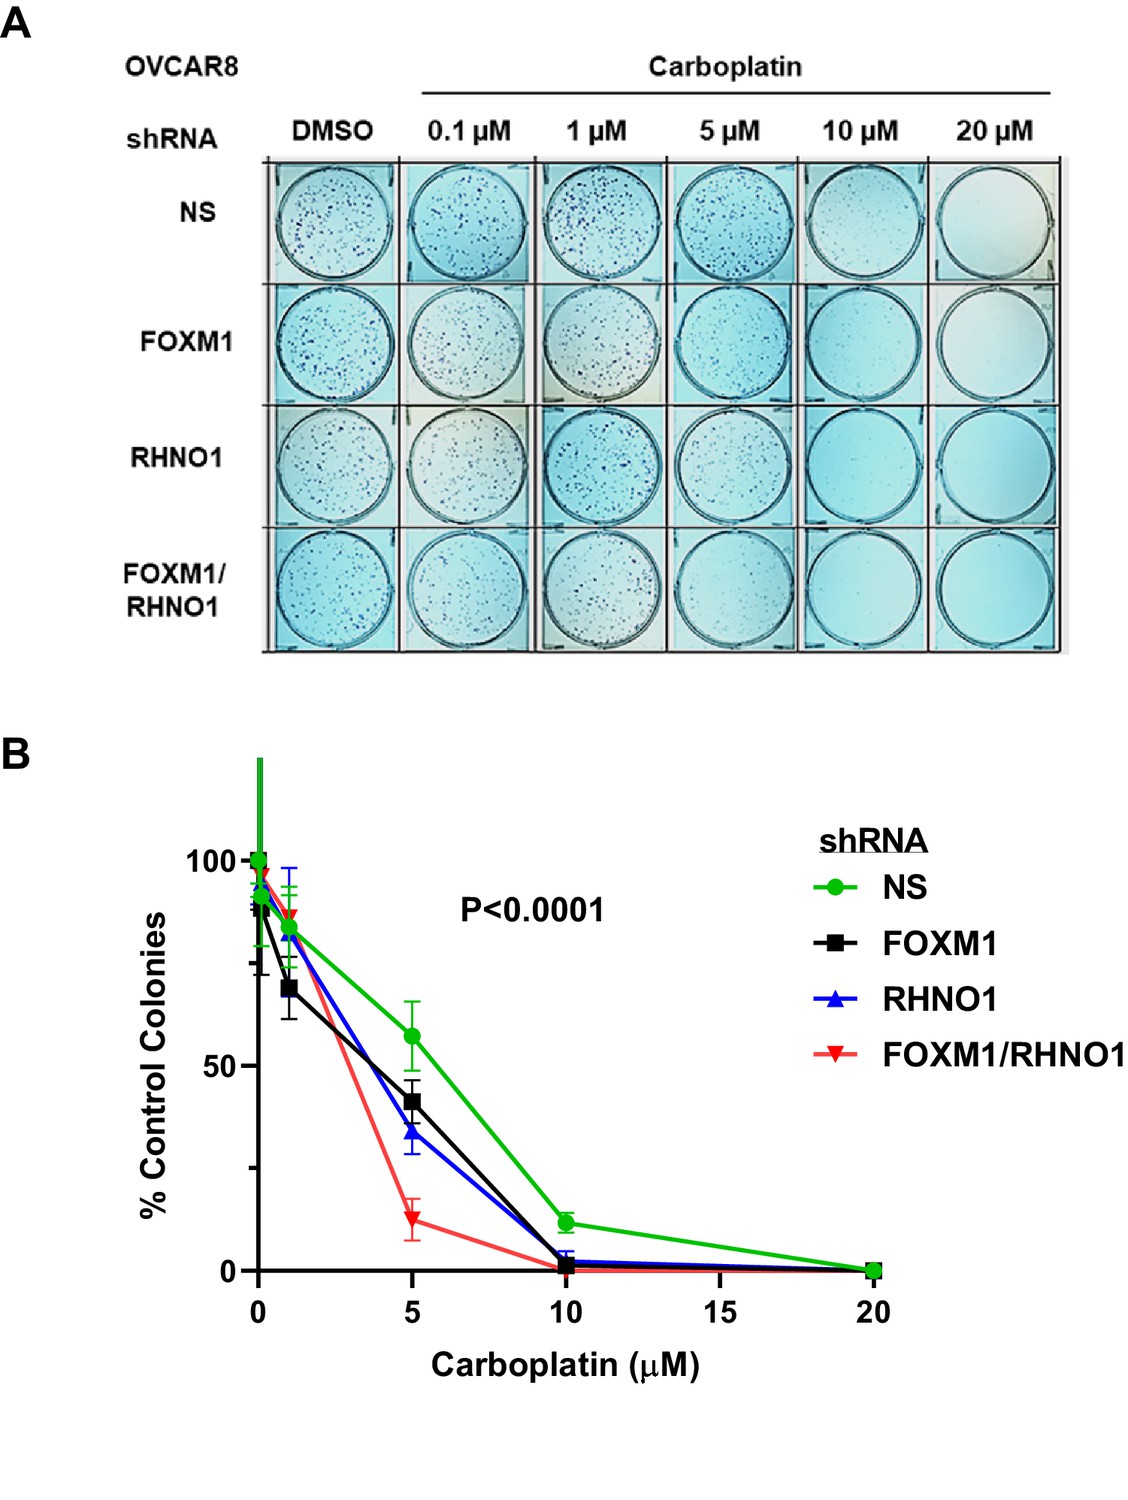
FOXM1 and RHNO1 knockdown enhances OVCAR8 cell sensitivity to carboplatin.
OVCAR8 cells were treated with doxycycline (dox) for 48 hr and seeded into triplicate wells of 6-well dishes in single-cell suspension. Cells were treated with carboplatin and dox the day after seeding and every 48 hr thereafter, and allowed to form colonies for 7–21 days. After incubation, cells were fixed in methanol and stained using 0.5% crystal violet; colonies containing >~50 cells were counted. (A) Representative clonogenic growth data. (B) Quantified data for experimental groups. Each data set was normalized to the DMSO-only treatment data point. The ANOVA p-value for the group comparison is shown.
Figure 21
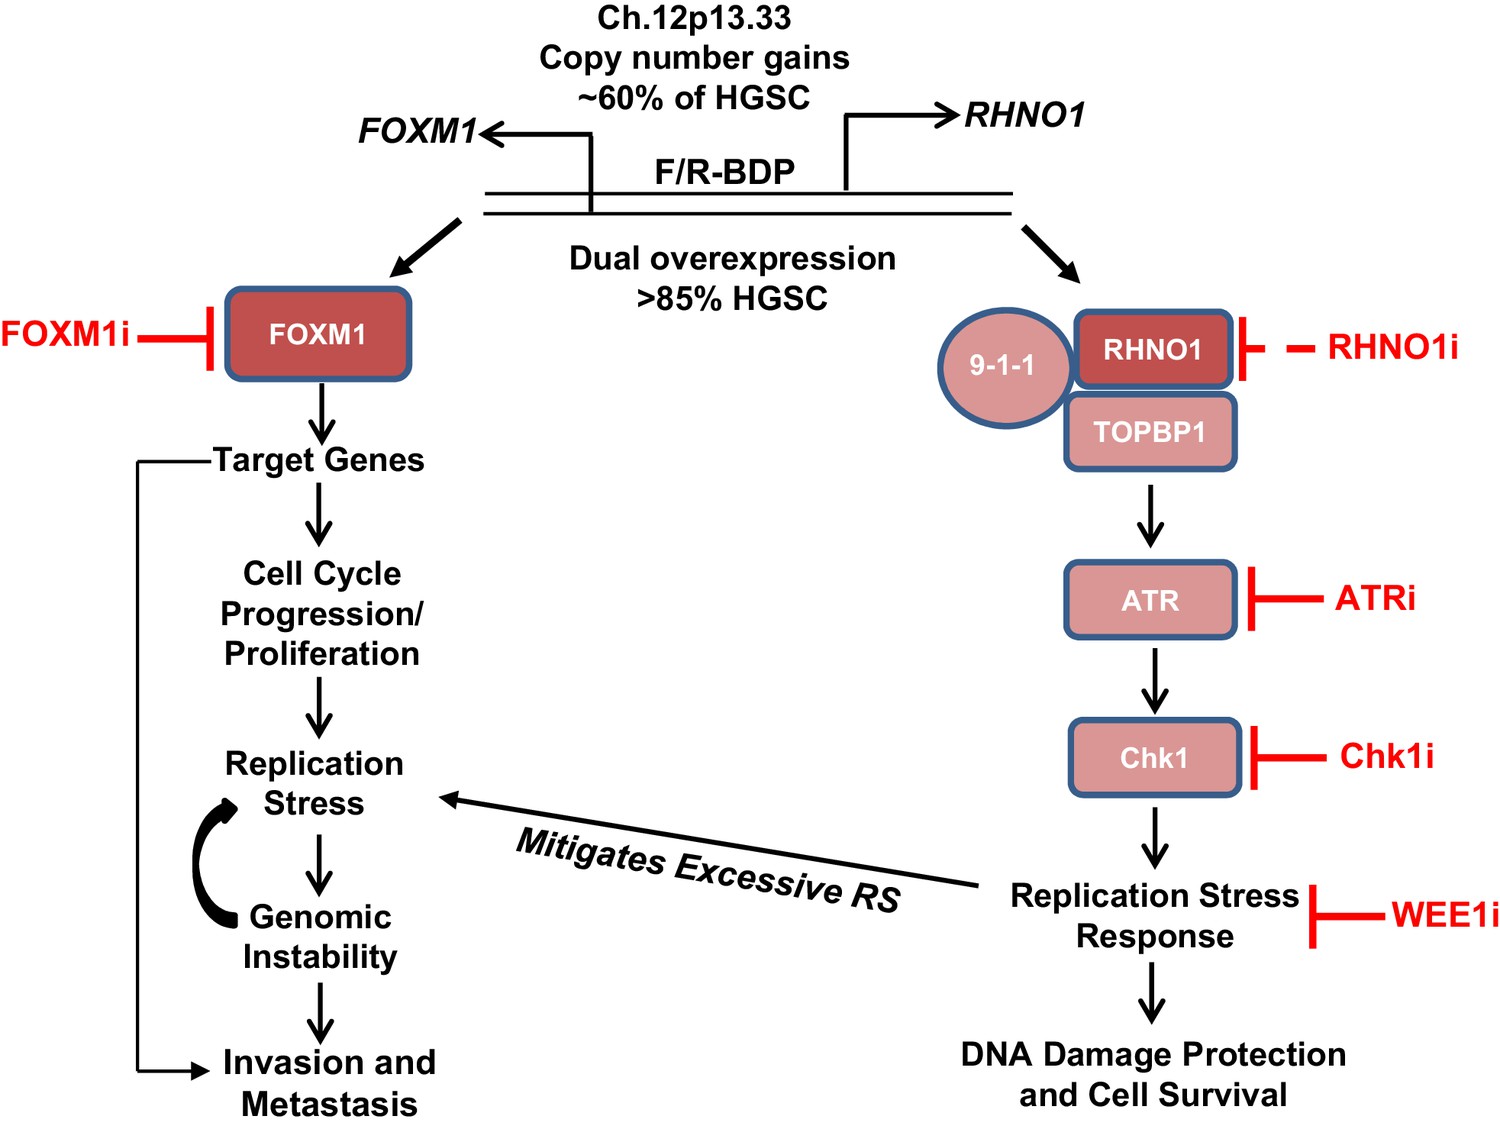
Model for FOXM1/RHNO1 bidirectional gene (BDG) function and cooperativity.
FOXM1 and RHNO1 are BDGs regulated by a bidirectional promoter (BDP) and are co-amplified and co-expressed in high-grade serous carcinoma (HGSC), including single cells. Both genes are overexpressed in HGSC and other cancers. FOXM1, via the activation of specific gene targets, promotes oncogenic phenotypes, including cell cycle progression, proliferation, replication stress (RS), genomic instability, and metastatic progression; the latter phenotype may reflect activation of a distinct set of transcriptional targets later in tumor progression. In contrast, RHNO1 promotes ATR-Chk1 signaling via its binding to 9-1-1 and TOPBP1 and promotes the RS response. This protects HGSC cells from excessive RS and DNA damage and enhances cell survival. RHNO1 co-expression may help to mitigate excessive FOXM1-induced RS and thus facilitate other FOXM1 oncogenic functions. FOXM1 and RHNO1 co-expression may increase tumor resiliency by allowing tumor cells to gain a fitness advantage of increased growth and proliferation without accumulating excessive DNA damage. Consistently, FOXM1-expressing tumors are highly enriched for biomarkers of RS (Li et al., 2020). Therapeutic targeting of the FOXM1/RHNO1 bidirectional gene unit may be accomplished using inhibitors of FOXM1 and/or ATR/Chk1/WEE1. RHNO1 inhibitors have not been reported (dashed line).
Tables
Appendix 1—key resources table
| Reagent type (species) or resource | Designation | Source or reference | Identifiers | Additional information |
|---|---|---|---|---|
| Gene (Homo sapiens) | FOXM1 | GenBank | Gene ID: 2305 | |
| Gene (Homo sapiens) | RHNO1 | GenBank | Gene ID: 83695 | |
| Antibody | FOXM1 (rabbit monoclonal) | Cell Signaling Technology | 5436 | (1:1000) |
| Antibody | β-Actin (mouse monoclonal) | Santa Cruz | sc-47778 | (1:200) |
| Antibody | α-Tubulin (rabbit polyclonal) | Cell Signaling Technology | 2144 | (1:1000) |
| Antibody | Lamin B (goat polyclonal) | Santa Cruz | sc-6217 | Discontinued |
| Antibody | Histone H3 (goat polyclonal) | Santa Cruz | sc-8654 | Discontinued |
| Antibody | CHEK1 (mouse monoclonal) | Santa Cruz | sc-8408 | (1:200) |
| Antibody | P-CHEK1 S345 (rabbit monoclonal) | Cell Signaling Technology | 2348 | (1:1000) |
| Antibody | P-CHEK1 S317 (rabbit monoclonal) | Cell Signaling Technology | 12302 | (1:1000) |
| Antibody | RPA32/RPA2 (rabbit monoclonal) | Abcam | ab76420 | (1:1000) |
| Antibody | RPA32 (S33) (rabbit polyclonal) | Bethyl | A300-246A-M | (1:1000) |
| Antibody | H2AX (goat polyclonal) | Bethyl | A303-837A | (1:2000) |
| Antibody | P-H2AX S139 (rabbit monoclonal) | Cell Signaling Technology | 9718 | (1:1000) |
| Antibody | Flag (rabbit monoclonal) | Cell Signaling Technology | 14793 | (1:1000) |
| Antibody | HA (rabbit monoclonal) | Cell Signaling Technology | 3724 | (1:1000) |
| Antibody | RHNO1 (rabbit polyclonal) | Novus | NBP1-93694 | Discontinued |
| Antibody | RHNO1 (rabbit polyclonal) | Sigma | HPA038682 | Discontinued |
| Antibody | TOPBP1 (rabbit monoclonal) | Cell Signaling Technology | 14342 | (1:1000) |
| Antibody | RAD9 (rabbit polyclonal) | Santa Cruz | sc-8324 | Discontinued |
| Antibody | RAD1 (rabbit monoclonal) | Invitrogen | 702149 | (1–2 µg/mL) |
| Antibody | HUS1 (rabbit monoclonal) | Cell Signaling Technology | 16416 | (1:1000) |
| Antibody | Anti-HA magnetic beads (mouse monoclonal) | Pierce | 88837 | |
| Cell line (Homo sapiens) | COV362 | Sigma | 7071904 | |
| Cell line (Homo sapiens) | COV318 | Sigma | 7071903 | |
| Cell line (Homo sapiens) | KURAMOCHI | JCRB | JCRB0098 | |
| Cell line (Homo sapiens) | OVSAHO | JCRB | JCRB1046 | |
| Cell line (Homo sapiens) | SNU-119 | Korean Cell Line Bank | 00119 | |
| Cell line (Homo sapiens) | OVCAR4 | NCI | ||
| Cell line (Homo sapiens) | OVCAR8 | NCI | ||
| Cell line (Homo sapiens) | OVCAR3 | ATCC | HTB-161 | |
| Cell line (Homo sapiens) | CAOV3 | Anirban Mitra | ||
| Cell line (Homo sapiens) | OVCAR5 | Anirban Mitra | ||
| Cell line (Homo sapiens) | UWB1.289 | Lee Zou | ||
| Cell line (Homo sapiens) | UWB1-SyR12 | Lee Zou | ||
| Cell line (Homo sapiens) | UWB1-SyR13 | Lee Zou | ||
| Cell line (Homo sapiens) | hOSE | ScienCell | 7310 | |
| Cell line (Homo sapiens) | FT190 | Ronny Drapkin | ||
| Cell line (Homo sapiens) | FT282-E1 | Ronny Drapkin | ||
| Cell line (Homo sapiens) | FT282 | Ronny Drapkin | ||
| Cell line (Homo sapiens) | IOSE-21 | Francis Balkwill | ||
| Cell line (Homo sapiens) | IOSE-121 | Nelly Auersperg | ||
| Cell line (Homo sapiens) | 283T | ATCC | CRL-3216 | |
| Cell line (Homo sapiens) | U2OS-DR-GFP (282C) | Jeremy Stark | ||
| Cell line (Homo sapiens) | OVCAR8-DR-GFP | Larry Karnitz and Scott Kaufmann | ||
| Chemical compound, drug | Berzosertib | SelleckChem | VE-822 | |
| Chemical compound, drug | Olaparib | SelleckChem | ABT-888 | |
| Chemical compound, drug | Hydroxyurea | Sigma | H8627 | |
| Chemical compound, drug | Carboplatin | Sigma | C2538 | |
| Chemical compound, drug | Etoposide | Sigma | E1383 | |
| Chemical compound, drug | Doxycycline | Sigma | D9891 | |
| Commercial assay or kit | Direct-zol RNA Purification Kit | Zymo Research | R2072 | |
| Commercial assay or kit | Comet Assay Kit | Trevigen | 4250-050-K | |
| Commercial assay or kit | iScript cDNA Synthesis Kit | Bio-Rad | 1708890 | |
| Commercial assay or kit | DNA-free kit | Ambion | AM1906 | |
| Commercial assay or kit | NE-PER Nuclear and Cytoplasmic Extraction Kit | Pierce | 78833 | |
| Commercial assay or kit | BCA protein assay | Pierce | 23225 | |
| Commercial assay or kit | Enhanced chemiluminescence | Pierce | 32106 | |
| Commercial assay or kit | Puregene Tissue Kit | QIAGEN | 158667 | |
| Commercial assay or kit | EZ DNA Methylation Kit | Zymo Research | D5001 | |
| Commercial assay or kit | QIAquick Gel Extraction Kit | QIAGEN | 28704 | |
| Commercial assay or kit | TOPO TA Cloning Kit | Invirogen | K457501 | |
| Commercial assay or kit | FirstChoice RLM-RACE Kit | Ambion | AM1700 | |
| Commercial assay or kit | Dual-Luciferase Reporter Assay System | Promega | E1910 | |
| Commercial assay or kit | Phospha-Light SEAP Reporter Gene Assay System | Thermo Scientific | T1015 | |
| Commercial assay or kit | TRIzol reagent | Thermo Scientific | 15596026 | |
| Commercial assay or kit | Lipofectamine 2000 reagent | Life Technologies | 11668019 | |
| Commercial assay or kit | QuickExtract | Lucigen | QE09050 | |
| Commercial assay or kit | M-PER | Pierce | 78501 | |
| Commercial assay or kit | Halt Protease and Phosphatase Cocktail | Pierce | 78440 | |
| Commercial assay or kit | Turbo Nuclease | Sigma | T4330-50KU | |
| Commercial assay or kit | AlamarBlue | Bio-Rad | BUF012A | |
| Commercial assay or kit | Vectashield with DAPI | Vector Laboratories | H-1200-10 | |
| Genetic reagent (Homo sapiens) | pCBASceI | Addgene | 26477 | Plasmid |
| Genetic reagent (Homo sapiens) | pCW57-GFP-P2A-MCS | Addgene | 71783 | Plasmid |
| Genetic reagent (Homo sapiens) | pCW57-GFP-P2A-MCS-(Neo) | Addgene | 89181 | Plasmid |
| Genetic reagent (Homo sapiens) | pCW57-MCS1-P2A-MCS2-(Hygro) | Addgene | 80922 | Plasmid |
| Genetic reagent (Homo sapiens) | pCW57-MCS1-P2A-MCS2-(Blast) | Addgene | 80921 | Plasmid |
| Genetic reagent (Homo sapiens) | pCW57-RFP-P2A-MCS | Addgene | 78933 | Plasmid |
| Genetic reagent (Homo sapiens) | pCW57-RFP-P2A-MCS-(Neo) | Addgene | 89182 | Plasmid |
| Genetic reagent (Homo sapiens) | pTRIPZ Non-silencing | Dharmacon | NC0257175 | Plasmid |
| Genetic reagent (Homo sapiens) | pGL4 Luc Rluc Empty | Addgene | 64034 | Plasmid |
| Genetic reagent (Homo sapiens) | pCMV6-SEAP | Addgene | 24595 | Plasmid |
| Genetic reagent (Homo sapiens) | pTurbo-GFP-RFP-empty | Custom | Plasmid | |
| Genetic reagent (Homo sapiens) | pTurbo-GFP-PGK | Custom | Plasmid | |
| Genetic reagent (Homo sapiens) | pTurbo-RFP-PGK | Custom | Plasmid | |
| Genetic reagent (Homo sapiens) | pTurboGFP-RFP-FOXM1-RHNO1 | Custom | Plasmid | |
| Genetic reagent (Homo sapiens) | pLentiCRISPRv2 | Addgene | 52961 | Plasmid |
| Genetic reagent (Homo sapiens) | PX458-WT-Cas9-empty | Addgene | 48138 | Plasmid |
| Genetic reagent (Homo sapiens) | lenti-SAMv2-Puro | Addgene | 92062 | Plasmid |
| Genetic reagent (Homo sapiens) | lenti-MPHv2-Neo | Addgene | 92065 | Plasmid |
| Genetic reagent (Homo sapiens) | pLV hU6-sgRNA hUbC-dCas9-KRAB-T2A-Puro (KRAB) | Addgene | 71236 | Plasmid |
| Genetic reagent (Homo sapiens) | psPAX2 | Addgene | 12260 | Plasmid |
| Genetic reagent (Homo sapiens) | pMD2.G | Addgene | 12259 | Plasmid |
| Genetic reagent (Homo sapiens) | pOTB7-RHNO1 | Harvard PlasmID Repository | HsCD00326310 | Plasmid |
| Genetic reagent (Homo sapiens) | pENTR-MGC RHNO1 siR | Stephen Elledge | Plasmid | |
| Genetic reagent (Homo sapiens) | pENTR-MGC RHNO1 SWV | Stephen Elledge | Plasmid | |
| Genetic reagent (Homo sapiens) | pCMV6 AN-HA empty | Origene | PS100013 | Plasmid |
| Genetic reagent (Homo sapiens) | AdNGUS24i | Frank Graham and Phillip Ng | Adenovirus | |
| Software, algorithm | Prism 8 statistical software | GraphPad | ||
| Software, algorithm | Lasergene SeqMan Pro | DNASTAR | ||
| Software, algorithm | Comet Analysis Software | Trevigen | ||
| Software, algorithm | R package | R Project | ||
| Software, algorithm | Cell Ranger Single Cell Software | 10X Genomics | ||
| Software, algorithm | GSEA software version 3 | Broad Institute | ||
| Software, algorithm | Cufflinks (v2.1.1) | https://doi.org/10.1038/nbt.1621 | ||
| Software, algorithm | Trim Galore software package | The Babraham Institute | ||
| Software, algorithm | TopHat (v2.0.8) | https://doi.org/10.1186/gb-2013-14-4-r36 | ||
| Software, algorithm | Cuffdiff (v2.1.1) | https://doi.org/10.1038/nbt.2450 | ||
| Software, algorithm | Perl | The Perl Foundation | ||
| Software, algorithm | scImpute | https://doi.org/10.1038/s41467-018-03405-7 |
Additional files
-
Supplementary file 1
FOXM1 vs. RHNO1 mRNA expression correlations.
- https://cdn.elifesciences.org/articles/55070/elife-55070-supp1-v2.docx
-
Supplementary file 2
Oligonucleotide sequences.
- https://cdn.elifesciences.org/articles/55070/elife-55070-supp2-v2.xlsx
-
Supplementary file 3
List of bidirectional gene pairs to support Figure 5 (Excel file).
- https://cdn.elifesciences.org/articles/55070/elife-55070-supp3-v2.xlsx
-
Transparent reporting form
- https://cdn.elifesciences.org/articles/55070/elife-55070-transrepform-v2.docx
Download links
A two-part list of links to download the article, or parts of the article, in various formats.
Downloads (link to download the article as PDF)
Open citations (links to open the citations from this article in various online reference manager services)
Cite this article (links to download the citations from this article in formats compatible with various reference manager tools)
Co-regulation and function of FOXM1/RHNO1 bidirectional genes in cancer
eLife 10:e55070.
https://doi.org/10.7554/eLife.55070


