Cardiac endothelial cells maintain open chromatin and expression of cardiomyocyte myofibrillar genes
- Perelman School of Medicine, University of Pennsylvania, United States
Figures
Figure 1
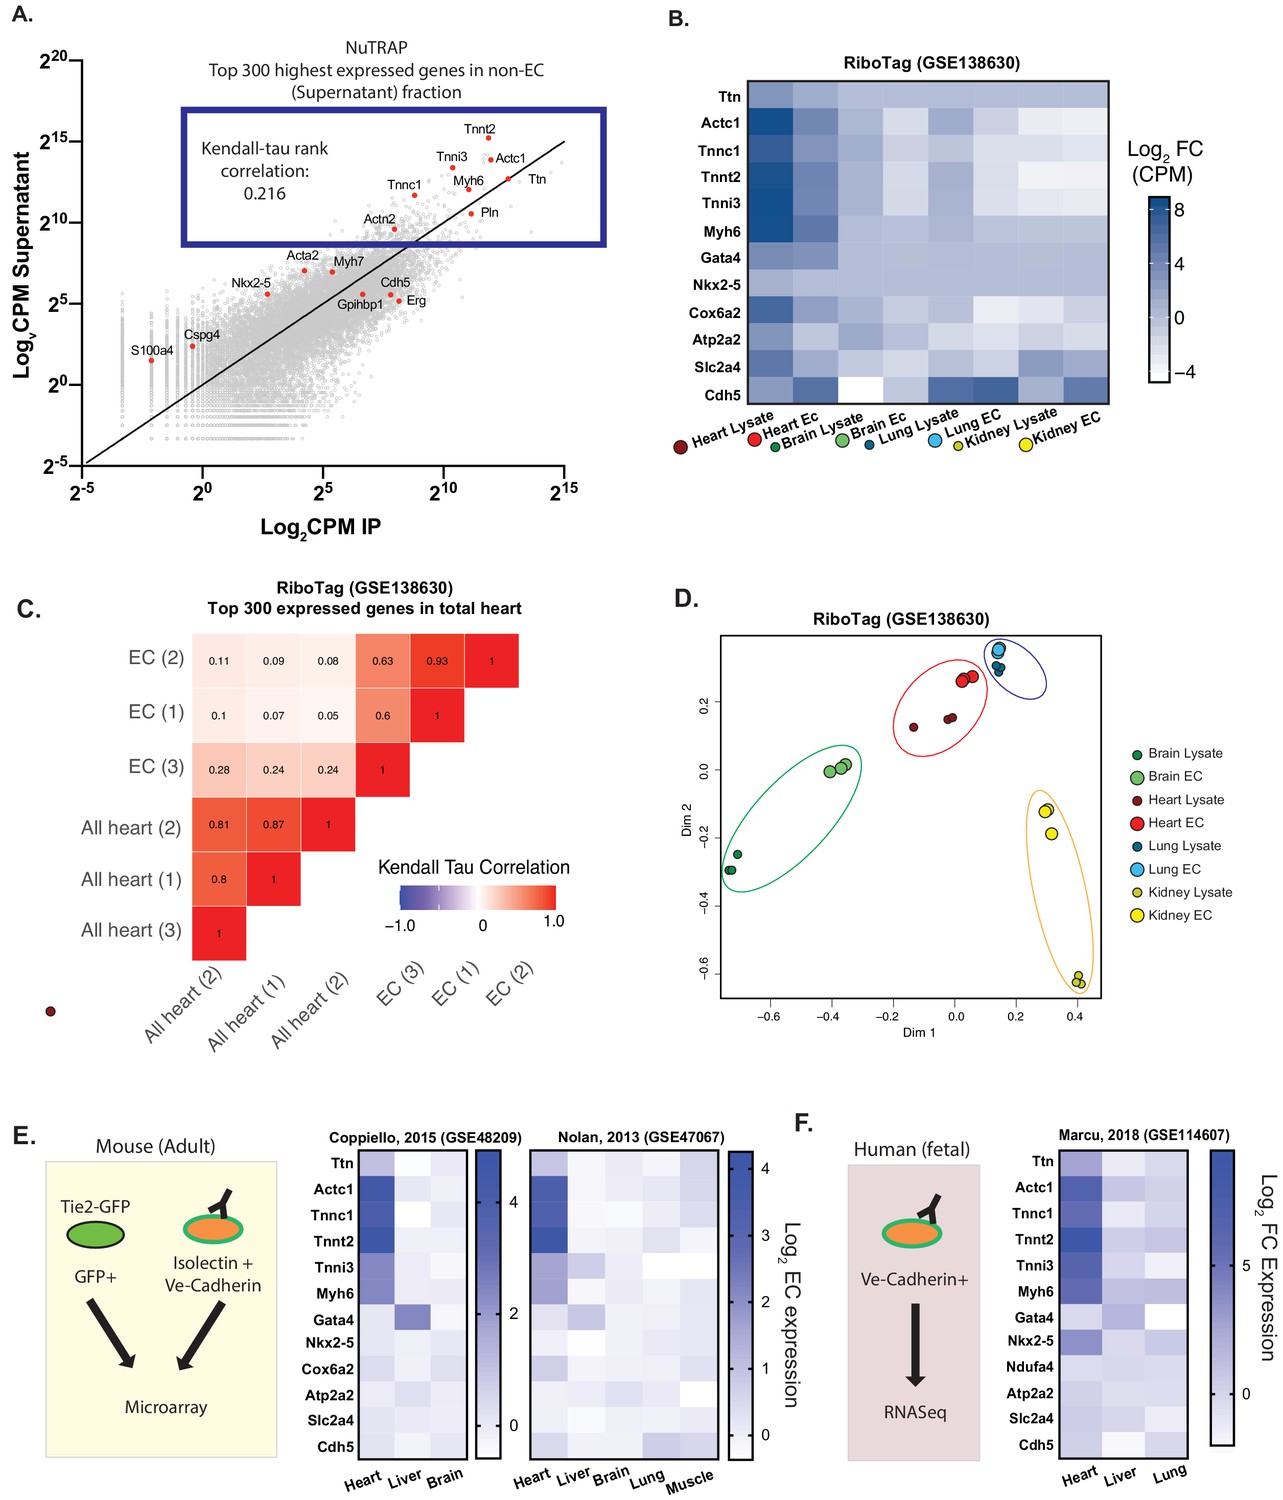
Cardiac endothelial cells express myofibrillar genes normally associated with cardiomyocytes.
(A) RNASeq of Translating Ribosome Affinity Purification (TRAP) endothelial RNA freshly isolated from hearts of Cdh5-NuTRAP animals. Expression (Log2CPM) of immunoprecipitated endothelial RNA (IP) versus non-endothelial RNA from the remaining fraction after IP (supernatant). Shown in the blue box are the top 300 expressed genes, with CMF genes highlighted in red. Kendall-Tau rank analyses performed on these top 300 expressed genes. (B) Relative expression of selected genes from freshly isolated tissue-specific adult endothelial cell TRAP, collected from (Rpl22fl/fl, Tek2-Cre+)/animals (Cleuren, et al, GSE138630) vs total tissue TRAP RNA (Rpl22fl/fl, EIIa-Cre+/0). (C) Kendall-Tau analysis of TRAP vs total tissue of heart tissue from Cleuren, et al. Analyses performed on the highest 300 expressed genes in the total heart tissue (D) Multidimensional scaling (MDS) clustering of the top 1000 variably expressed genes in the tissues analyzed in (B). (E) Relative expression of the indicated genes in tissue-specific adult murine endothelial cells in data sets from Coppiello et al., 2015 (GSE48209) and Nolan et al., 2013 (GSE47067) (F) Relative expression of tissue-specific fetal human endothelial RNASeq from Marcu et al., 2018 (GSE114607).
Figure 2
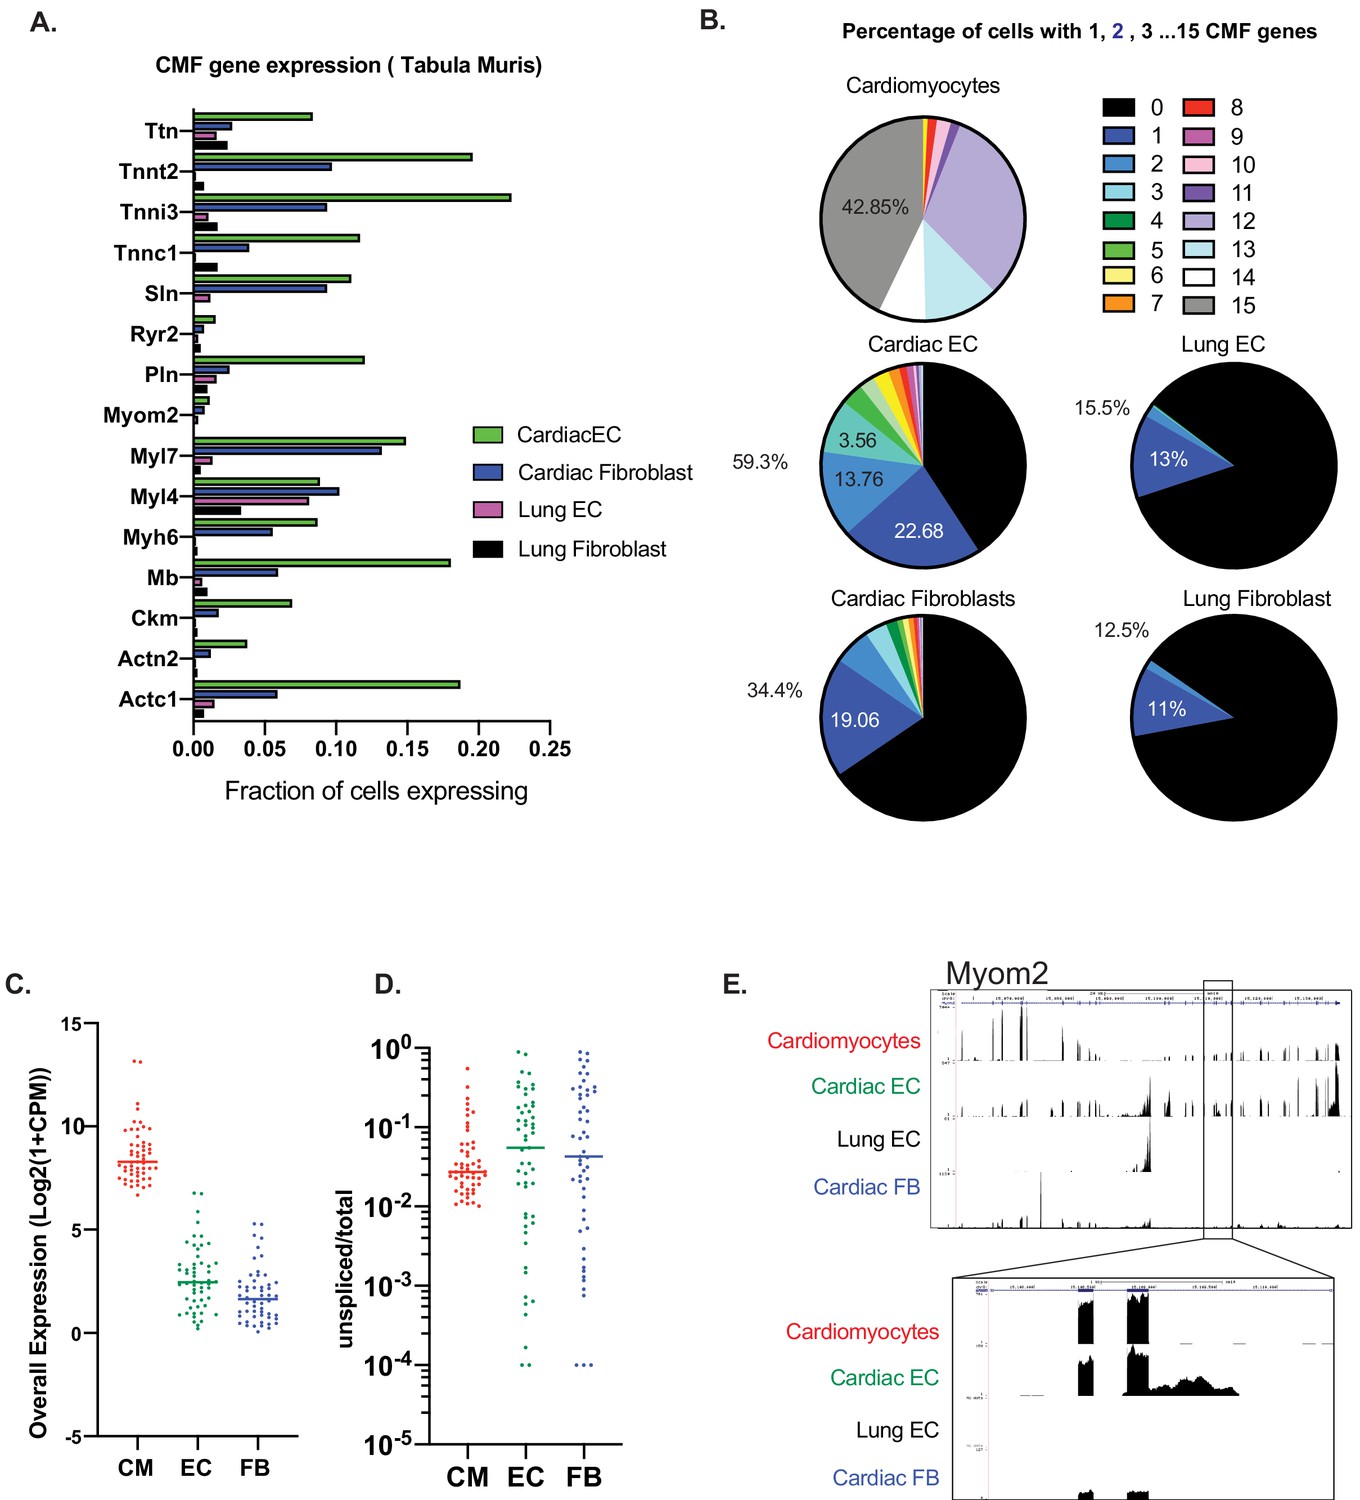
Expression of at least one CMF gene is seen in ~59% of cardiac ECs.
(A): Analysis of mouse heart and lung single cell data from Tabula Muris in Schaum, et al (Nature, 2018). Fifteen cardiac myofibrillar (CMF) genes were chosen based on high, unique expression in the cardiomyocyte cell subsets. Positive expression was determined as a normalized count (ln(1+Counts-per-million)) greater than or equal to one. (B): Percentage of cardiomyocytes vs endothelial cells or fibroblasts within the heart and lung that express 1–15 of the selected CMF genes. (C–E). Analysis of unspliced vs spliced transcripts in Tabula Muris data. Data shown are merged counts for all cells within the cardiomyocyte (CM), endothelial cell (EC), or fibroblast (FB) cell subsets, as annotated in Tabula Muris. Shown are CMF genes with a unspliced percentage >= 1% in cardiomyocytes. Marker genes for cell-subsets are shown in Supplementary file 1, and unspliced/total ratios can be found in Supplementary file 2 (C) Overall expression shown as log2(1+CPM) for selected CMF genes (D) Unspliced/total fraction for selected CMF genes in cardiomyocyte, endothelial cells or fibroblast cell subsets within the heart. (E) Genome track for aligned Tabula Muris RNA-Seq data for cardiomyocyte, cardiac EC, lung EC or cardiac fibroblast populations. In upper panel is the full track for CMF gene Myom2, with inset showing a regions with intronic reads specific to cardiac ECs.
Figure 3 with 2 supplements
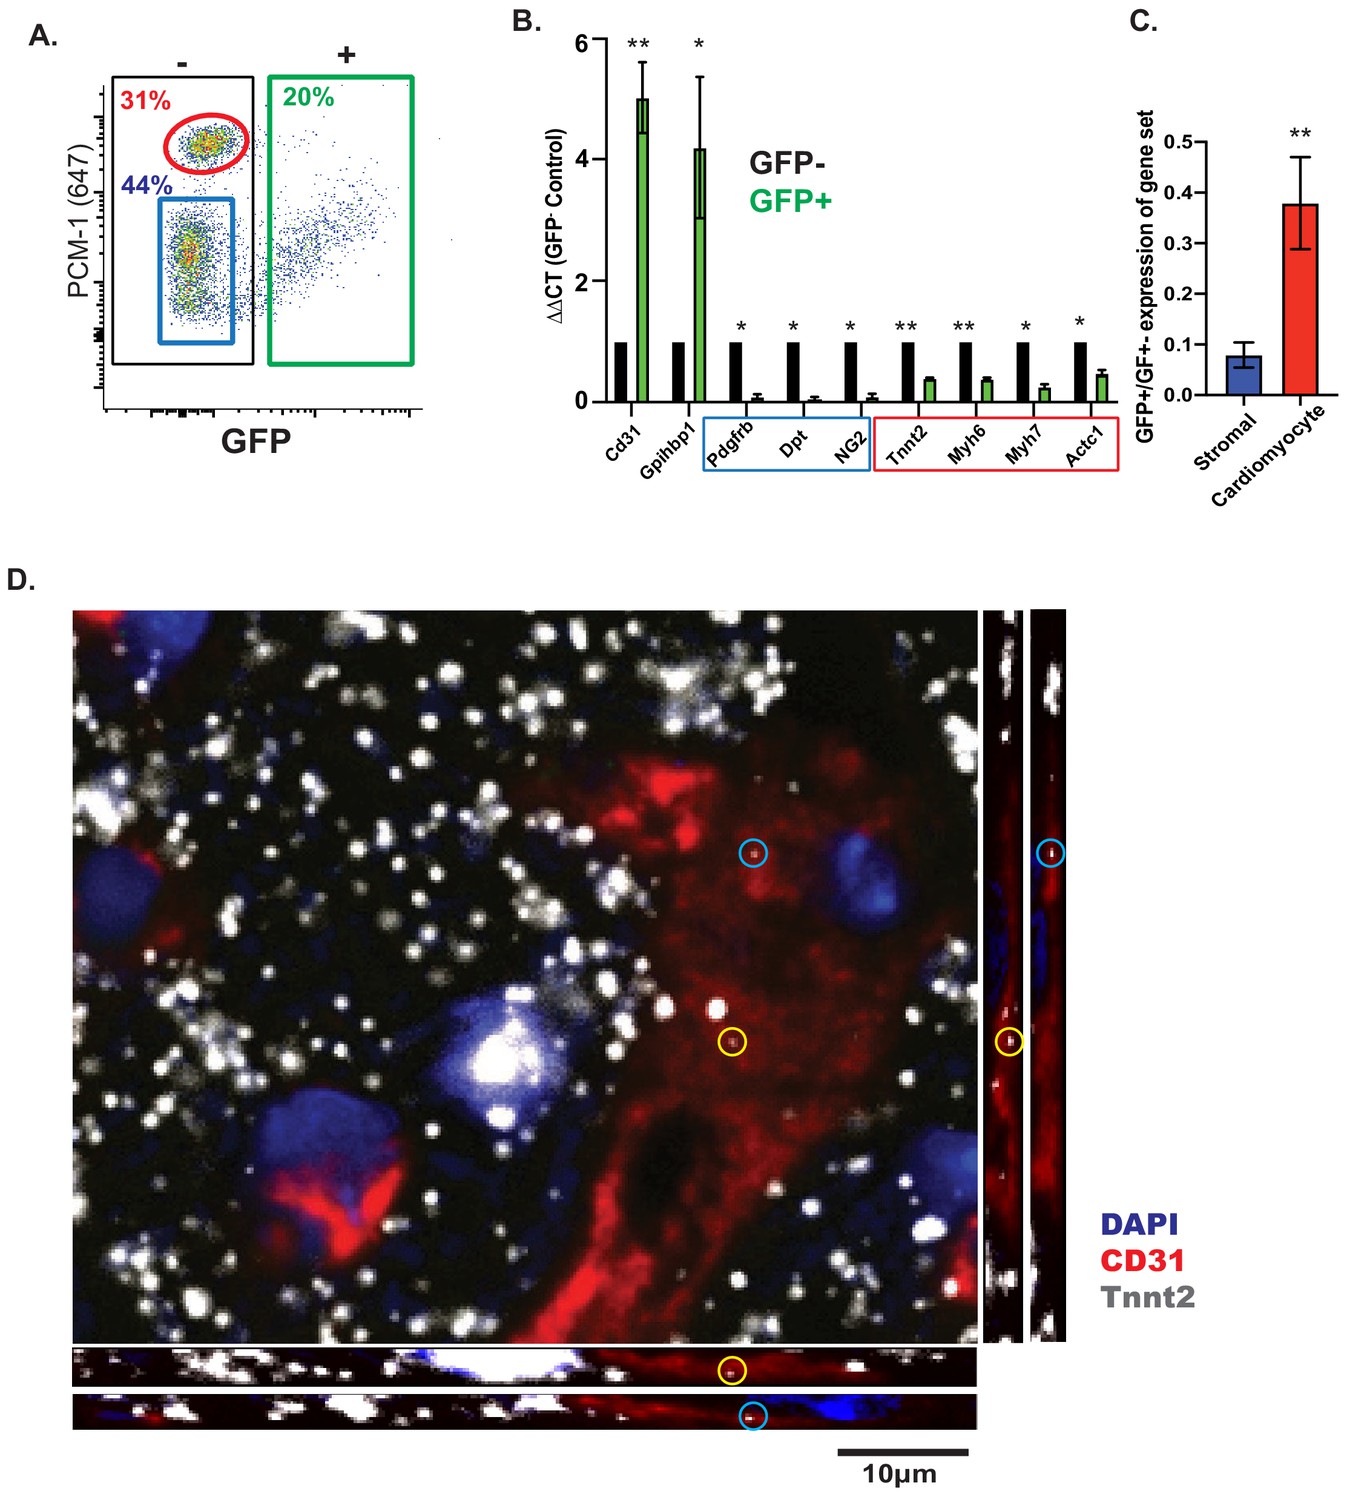
CMF mRNAs are detectable in EC nuclei ex vivo and in situ in vivo.
(A) Representative flow cytometry plot of GFP expression from isolated nuclei from Cdh5/NuTRAP mice. About 20% of nuclei are GFP+ (endothelial), with no co-staining with the cardiomyocyte-specific nuclear marker PCM1. Gating scheme for identification of single nuclei shown in Figure 3—figure supplement 1 (B) Relative expression (by qPCR) of nuclear RNA from isolated GFP+ (endothelial) or GFP- (non-endothelial) nuclei. Blue box: stromal genes; red box: CMF genes. (C) Average fold change of expression (GFP+/GFP-) in (B) for fibroblast or CMF genes. (D) Confocal images of heart sections. RNAScope probes for Cdh5 (endothelial) and CMF (Tnnt2) mRNA were co-stained with Pecam1 antibody. Shown are confocal slices of 0.96 μm thickness. Additional images are available Figure 3—figure supplement 2.
Figure 3—figure supplement 1
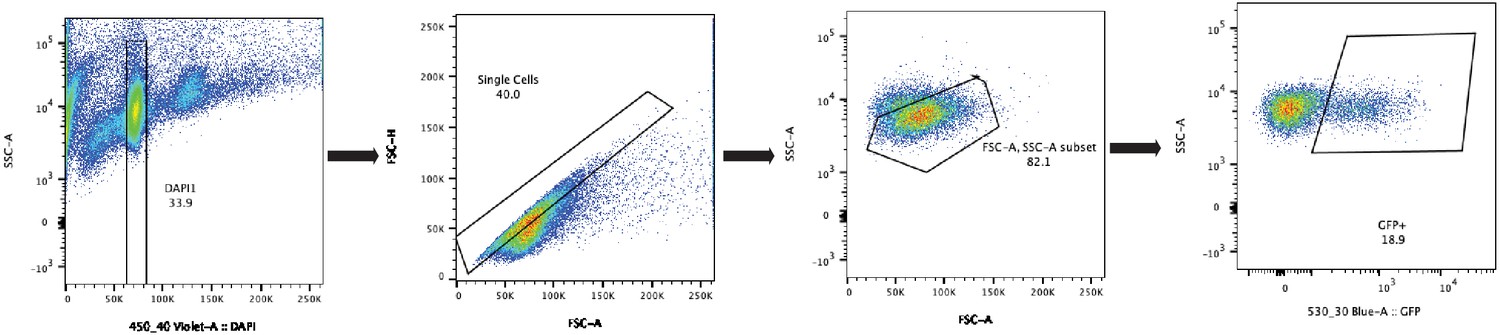
Cdh5-Cre/NuTRAP nuclei sorting scheme.
Nuclei from NuTRAP animals were isolated from whole adult hearts as described in Methods, and isolated by florescence-activated cell sorted (FACS). Gating for single, GFP+ nuclei is shown as left to right. Nuclei were first identified on the basis of DAPI staining to remove debris and 4 n nuclei, and doublets removed by FSC-A/FSC-H gating. FSC-A/SSC-A used to remove any remaining debris, and GFP+ gate used to identify endothelial nuclei.
Figure 3—figure supplement 2
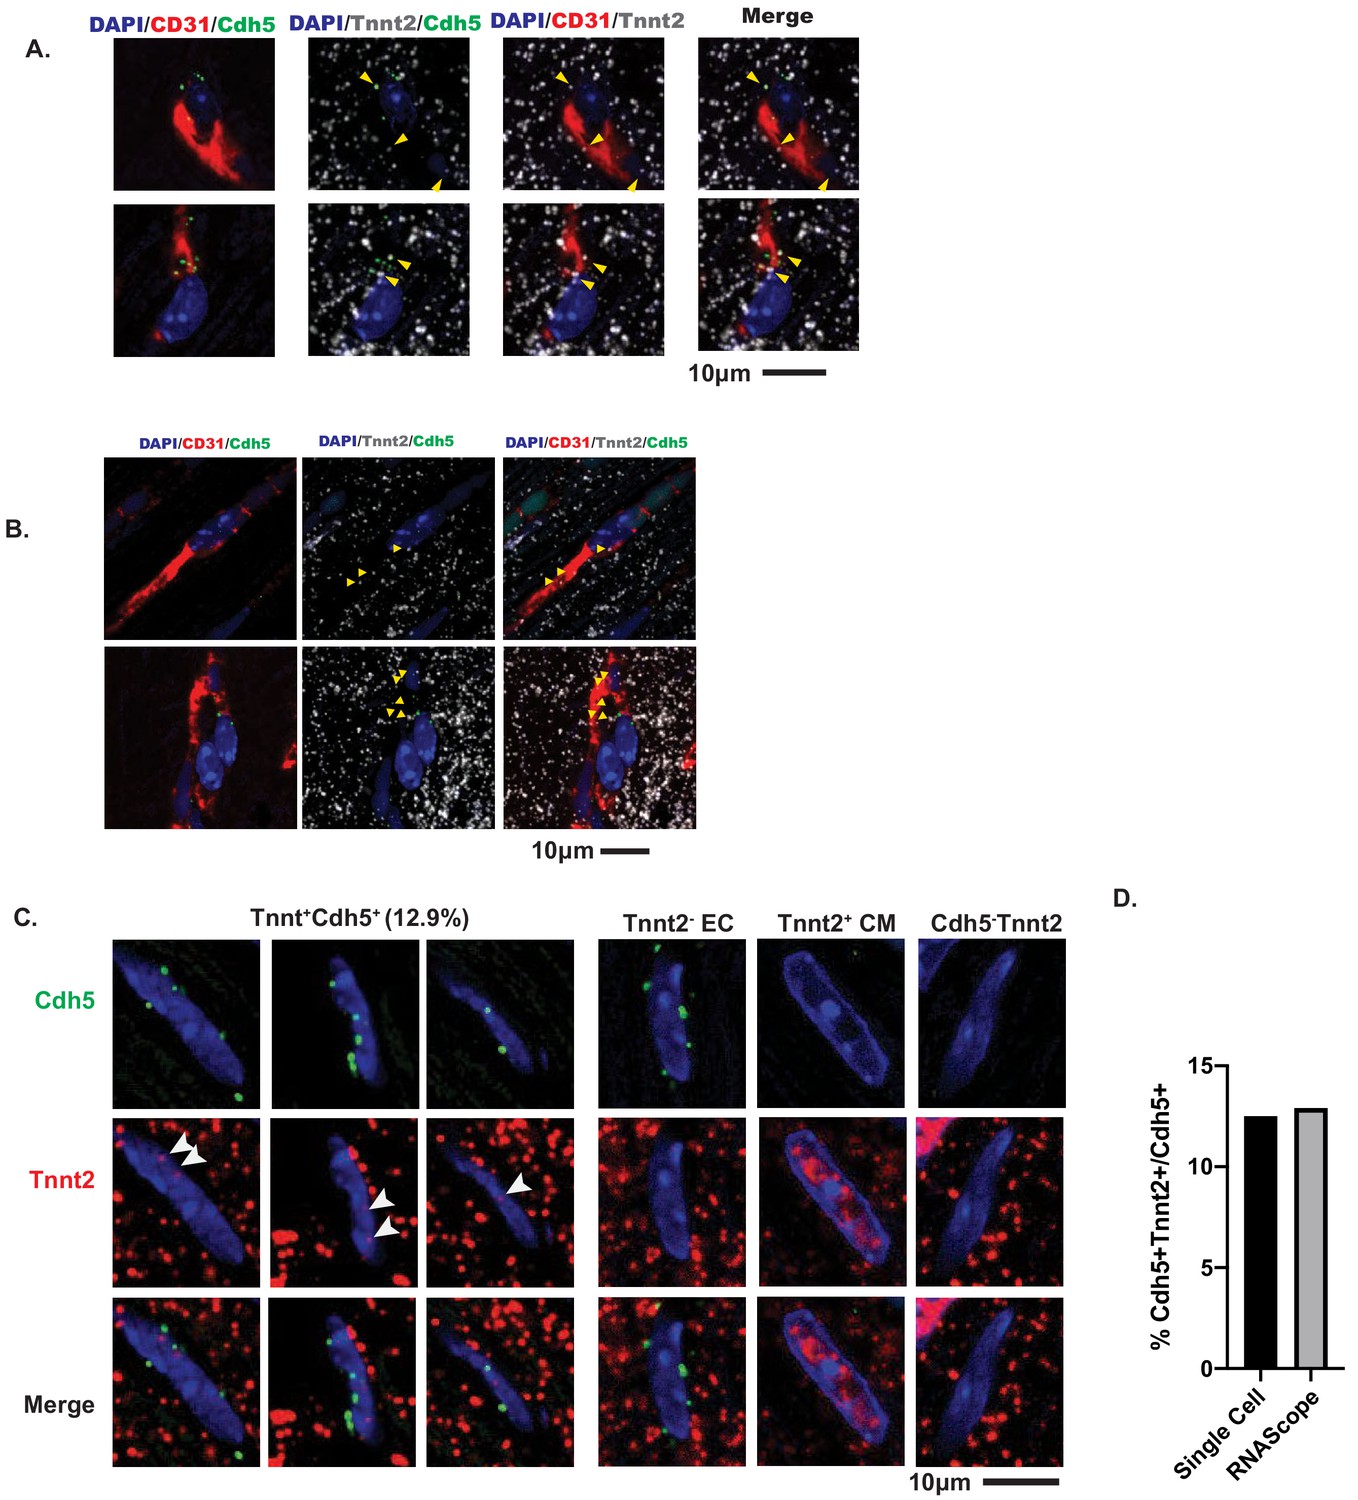
Confocal imaging of Tnnt2 mRNA by RNAScope in heart sections.
(A–B) Adult mouse cardiac sections were co-stained for Pecam1 (CD31) protein, as well as Tnnt2 and Cdh5 RNAScope probes. DAPI used as a nuclear counterstain. Shown are 0.96µm-thick slices of a confocal z-stack (A). Co-localization of Cdh5 (green) and Tnnt2 (white mRNA). (B) Cytoplasmic Tnnt2 within a vessel marked by CD31 (red). (C) Nuclear localization of Tnnt2 (red) in endothelial nuclei identified by Cdh5 (green). Right panel shows Tnnt2- endothelial cells and cardiomyocytes (CM) for comparison, as well as Tnnt2-Cdh5- cells. (D) Quantification of percent of Cdh5+ nuclei with Tnnt2. Comparison to Tabula Muris single-cell RNASeq.
Figure 4 with 1 supplement
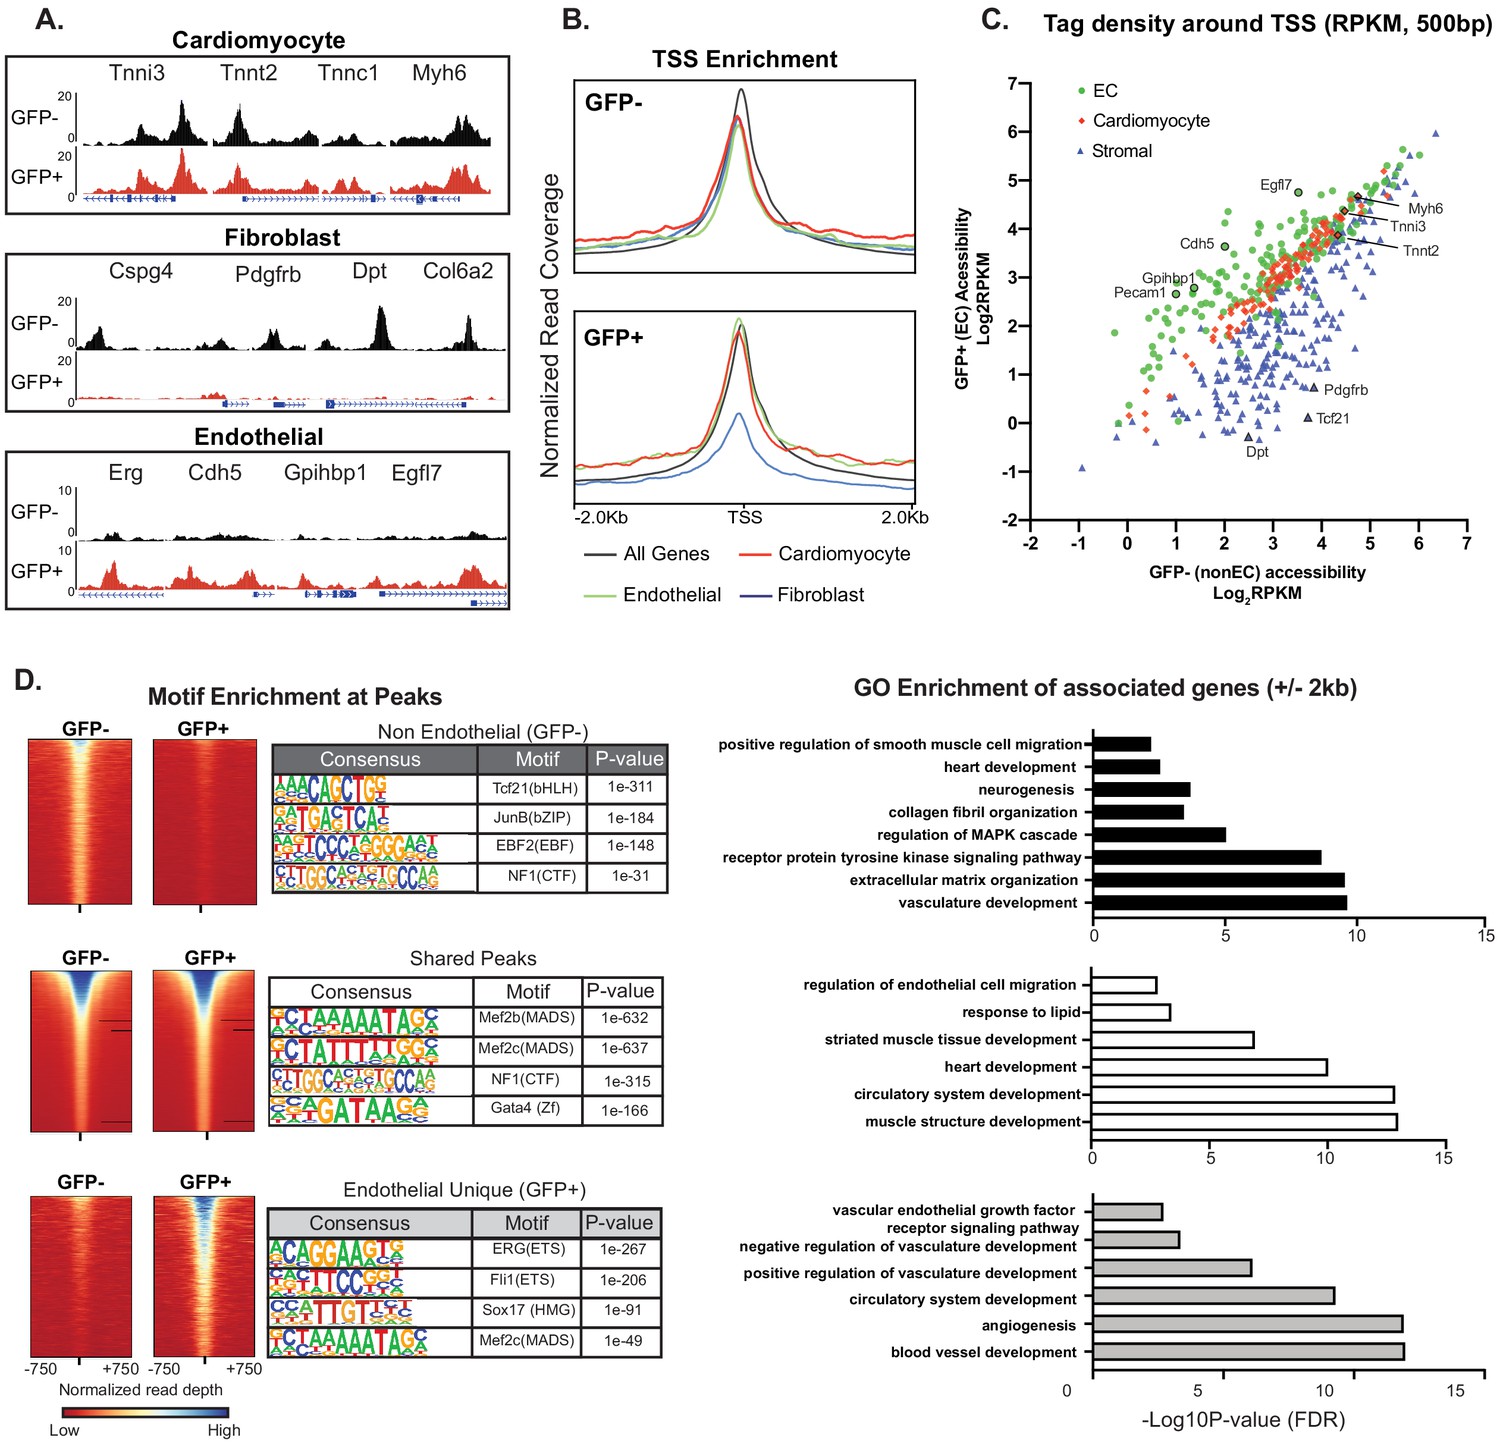
Cardiac ECs maintain open chromatin at CMF genes.
(A) Representative ATACSeq gene tracks for cardiomyocyte, fibroblast, or endothelial cell genes in isolated GFP+ (endothelial, in red) or GFP- (non-endothelial, in black) nuclei. (B) Genome-wide open chromatin at the transcriptional start sites (TSSs) of cardiomyocyte, stromal, or endothelial cell genes in GFP- (non-endothelial) and GFP+ (endothelial) nuclei. Note chromatin of cardiomyocyte genes (red) is as open in ECs (GFP+) as non-ECs (GFP-). (C) Comparison of accessibility in GFP- vs GFP+ nuclei at TSS peaks (+/- 250 bp) for EC genes (green), cardiomyocyte genes (red), and stromal genes (blue). Note again that chromatin of cardiomyocyte genes is as open in EC as non-EC nuclei. (D) Motif enrichment analysis of ATACSeq peaks unique to non-endothelial (GFP-) nuclei (top), unique to endothelial (GFP+) nuclei (bottom), and shared peaks (middle). Right panels: gene ontology (GO) analysis of genes within 2 kb of each peak set. Full statistics and GO annotations for peak regions shown in Supplementary file 3. Additional analyses shown in Figure 4—figure supplement 1.
Figure 4—figure supplement 1
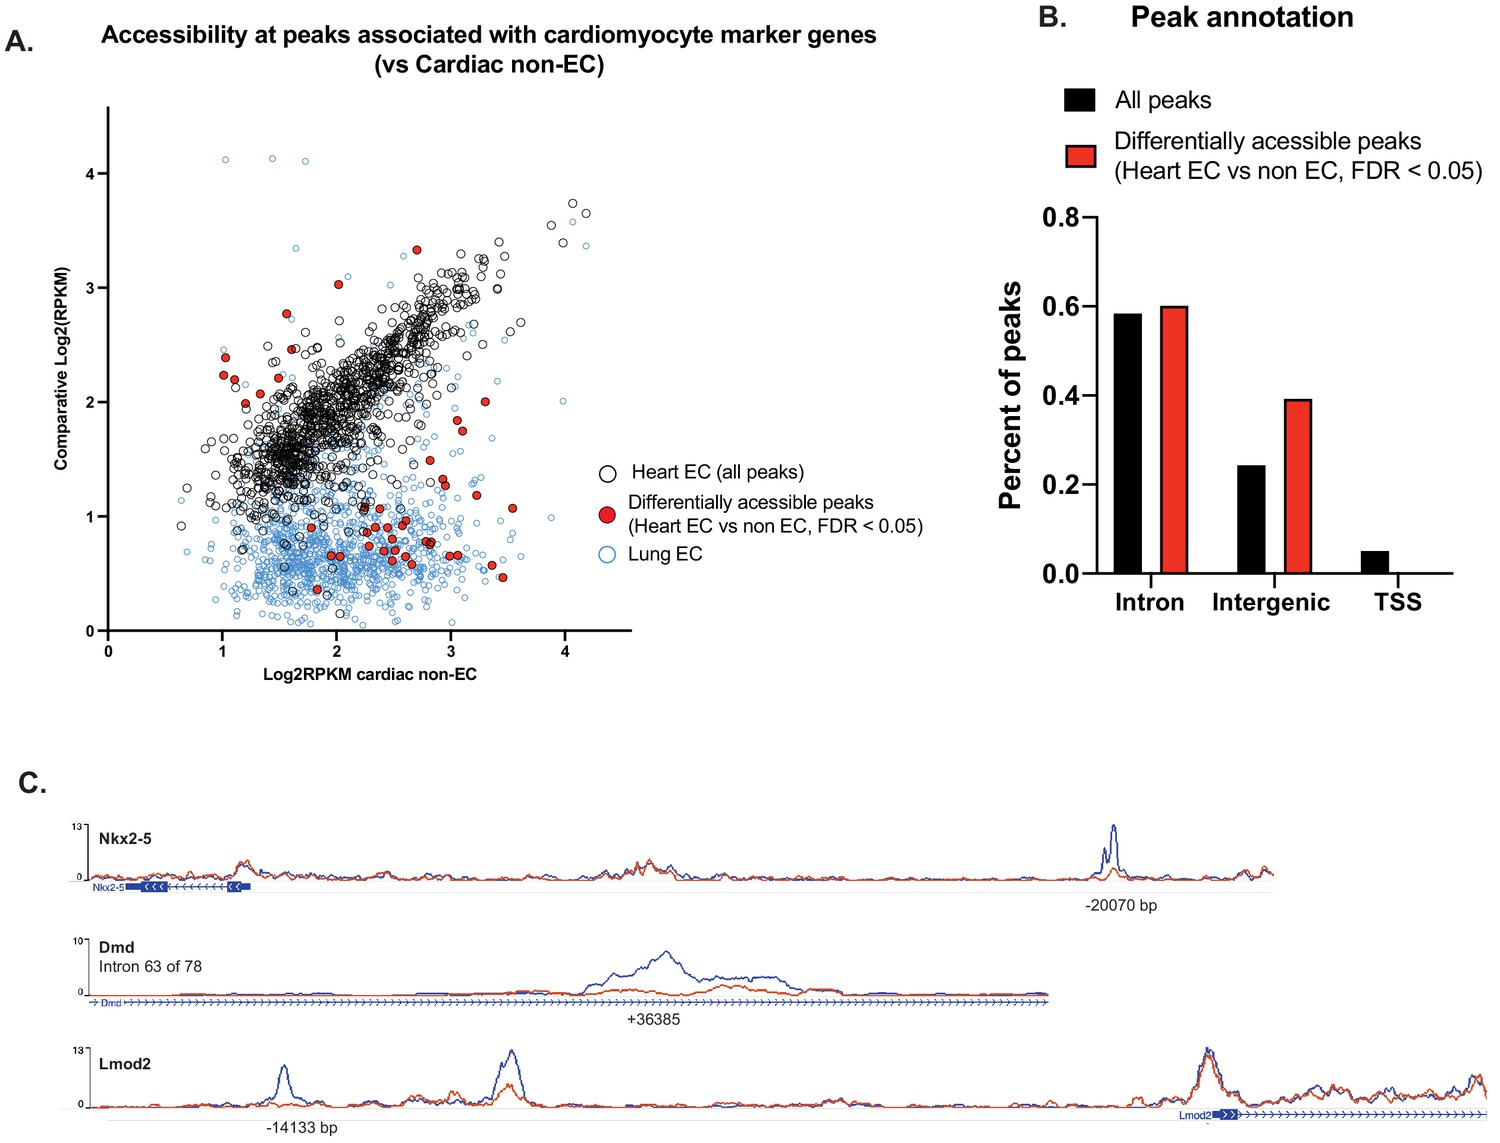
Differential accessibility at all peaks associated with CMF genes.
(A) Comparative accessibility (Log2RPKM) of all peaks associated with CMF genes in the non-EC (GFP-) nuclei of NuTRAP hearts vs cardiac and lung endothelial cells (GFP+). All peaks highlighted in red are differentially accessible between GFP- and GFP+ nuclei from heart, as calculated by DiffBind (DESeq2). (B) Annotation of all cardiac endothelial cell peaks vs those that are differentially accessible between GFP- and GFP+. Differentially accessible regions are primarily in enhancer (intergenic and intronic) regions rather than transcriptional start sites. (C) Representative tracks of peaks with differential accessibility between GFP- and GFP+ nuclei from heart. As shown in (B), differential peaks are found in enhancer regions of CMF genes.
Figure 5
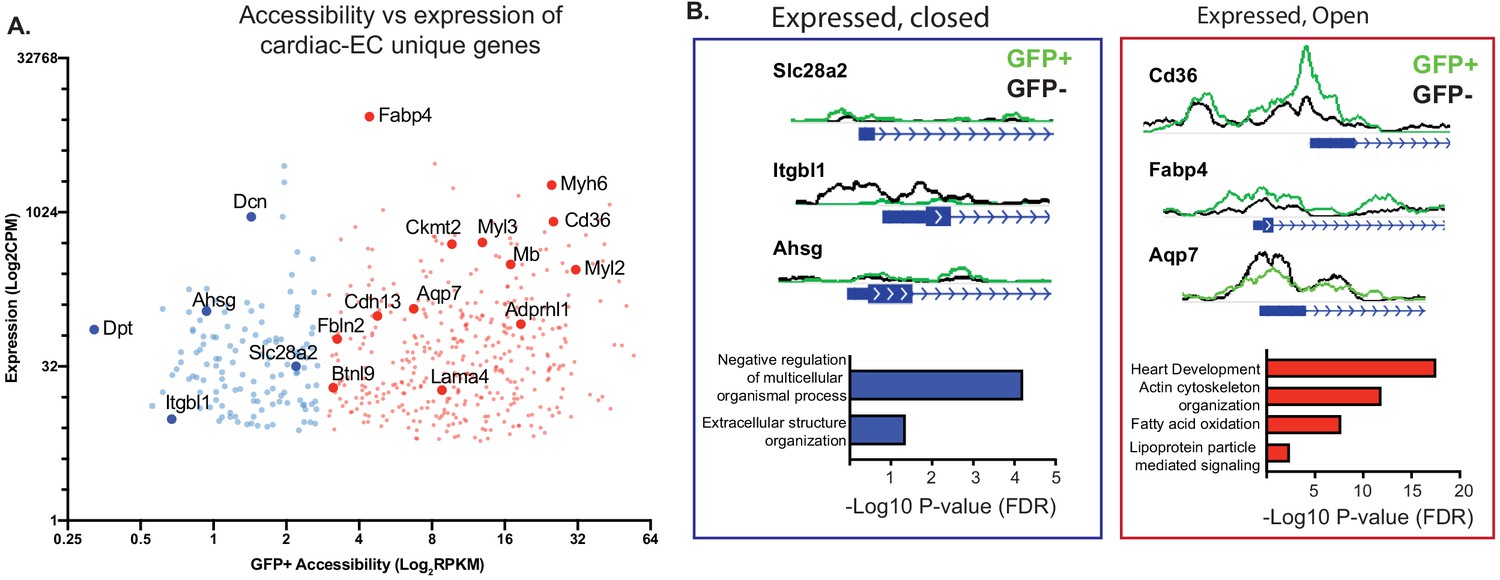
Not all genes expressed in endothelial cells (ECs) have open chromatin.
(A) Gene expression (data from Cleuren et al.; GSE138630) and gene accessibility of cardiac EC-enriched genes (with expression of at least 10 CPM, and twofold or higher expression compared with brain or lung endothelial cells) in cardiac endothelial (GFP+) nuclei. Blue: relatively close chromatin (Log2RPKM +/- 250 bp at TSS peaks <3); red: relatively open chromatin (>3). (B) Representative tracks and gene ontology (GO) analysis of cardiac EC-enriched genes with closed (blue) or open (red) chromatin.
Figure 6
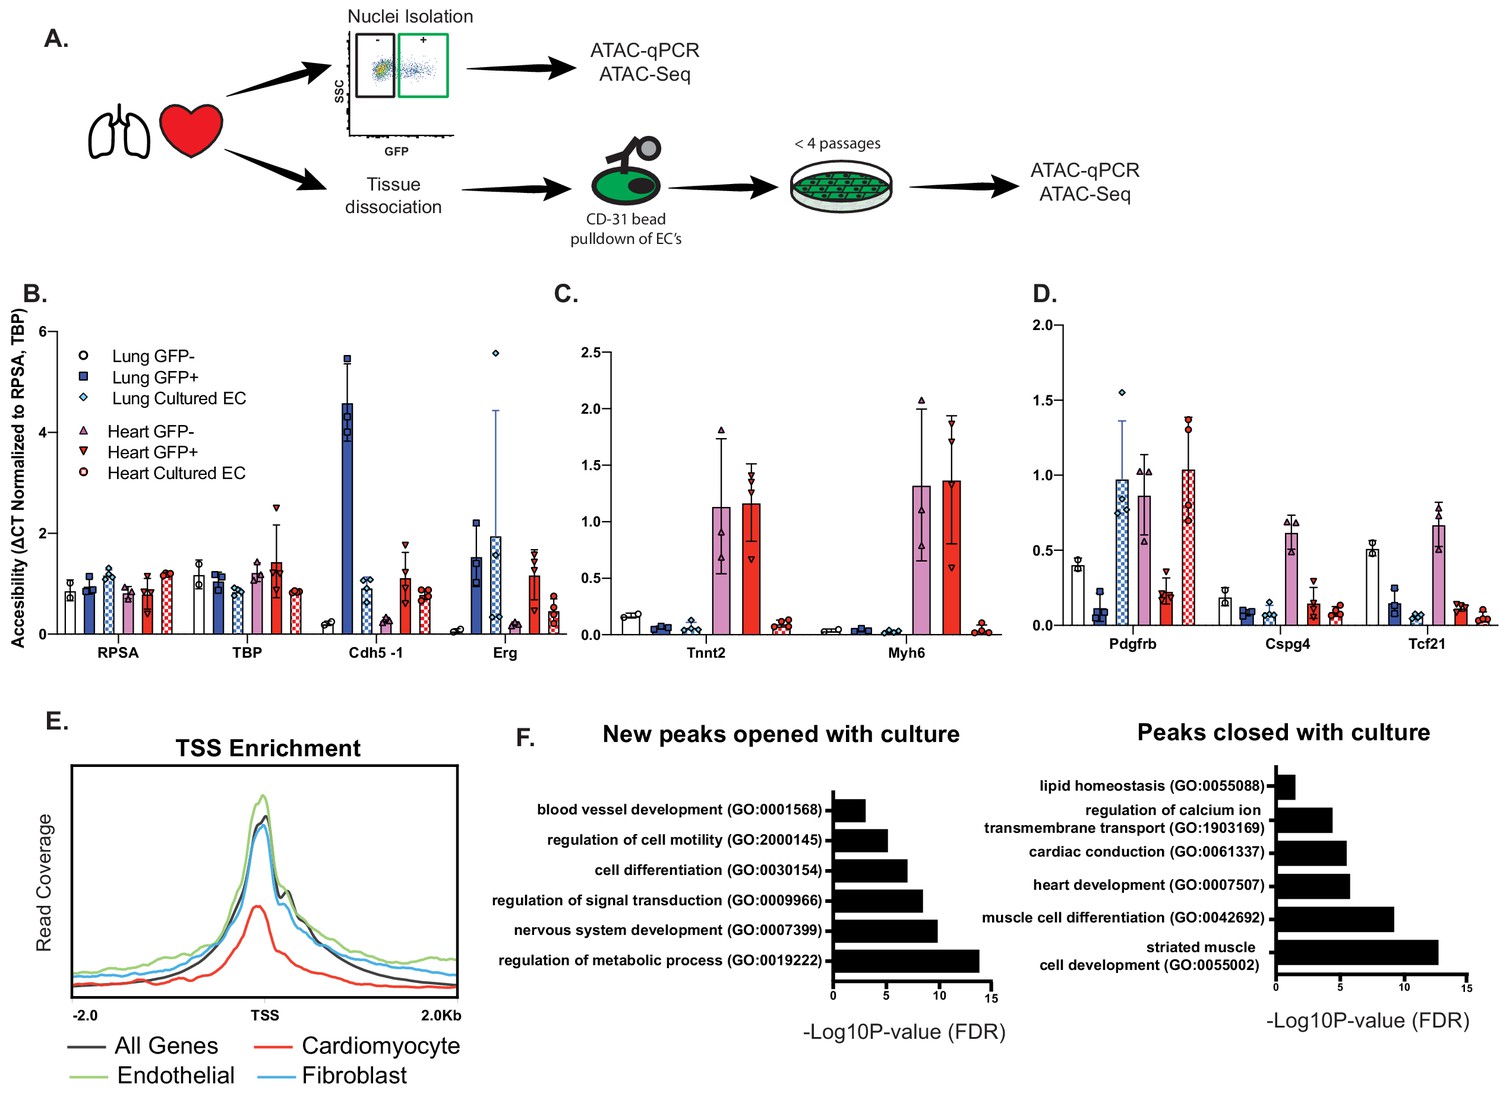
Open chromatin and expression of CMF genes in ECs requires in vivo cues.
(A) Experimental scheme. N = 2–4 biological replicates. ATAC-qPCR and ATAC-Seq was performed on freshly isolated endothelial nuclei, or cultured endothelial cells from heart or lung. qPCR regions were identified based on peaks identified in sequencing data. (B) Relative accessibility (compared to housekeeping genes, Rpsa and Tbp of endothelial cell genes, Cdh5 and Erg). (C) Relative accessibility of cardiomyocyte genes (Tnnt2, Myh6). (D) Relative accessibility of fibroblast-signature genes (Pdgfrb, Cspg4, Tcf21) (E) Representative TSS enrichment plot of cultured cardiac endothelial cells. Enrichment shown for cardiomyocyte-specific, endothelial or fibroblast specific gene sets (gene sets previously identified in Supplementary file 1). (F) GO enrichment for peaks that open (left) or close (right) in cultured cardiac endothelial cells vs freshly isolated. Complete statistical analyses by DESEQ2 and GO annotations shown in Supplementary file 4.
Tables
Key resources table
| Reagent type (species) or resource | Designation | Source or reference | Identifiers | Additional information |
|---|---|---|---|---|
| Strain, strain background (Mus musculus) | B6;129S6-Gt(ROSA)26Sortm2(CAG-NuTRAP)Evdr/J | Cell Rep. 2017 Jan 24; 18(4): 1048–1061. | NuTRAP | https://www.jax.org/strain/029899 |
| Strain, strain background (Mus musculus) | B6;129-Tg(Cdh5-cre)1Spe/J | JAX strain 017968 | Cdh5-Cre, VE-Cadherin-CRE | |
| Antibody | Pecam1 antibody; Rat monclonal | BD Pharmigen | Cat# 558736 | (1:500) |
| Antibody | Pcm1; Rabbit polyclonal | Sigma | Cat# HPA023370 | (1:250) |
| Software, algorithm | fastp | Chen et al., 2018 | ||
| Software, algorithm | Bowtie2 | Langmead and Salzberg, 2012 | ||
| Software, algorithm | Genrich | https://github.com/jsh58/Genrich | ||
| Software, algorithm | Picard Tools | http://broadinstitute.github.io/picard/ | ||
| Software, algorithm | samtools | Li et al., 2009 | ||
| Software, algorithm | STAR | Dobin, 2013 | ||
| Software, algorithm | Seurat | Stuart et al., 2019 | ||
| Software, algorithm | R | https://www.r-project.org/ | ||
| Software, algorithm | DiffBind | Ross-Innes et al., 2012 | ||
| Software, algorithm | Deeptools | Ramírez et al., 2016 | ||
| Software, algorithm | Homer | Heinz et al., 2010 | ||
| Software, algorithm | Velocyto | La Manno et al., 2018 | ||
| Other | DAPI stain | Molecular Probes | (1:1000) | |
| Other | RNAscope Probe- Mm-Tnnt2-C3 | ACD Bio | Cat# 418681-C3 | |
| Other | RNAscope Probe- Mm-Cdh5-C2 | ACDBio | Cat# 312531-C2 | |
| Commercial assay or kit | RNAscope Multiplex Fluorescent v2 Assay | ACD Bio | Cat# 323136 | |
| Commercial assay or kit | Illumina Tagment DNA Enzyme and Buffer | Illumina | Cat#:20034197 | 1.25 uL of enzyme used per 50,000 nuclei for transposition |
Additional files
-
Supplementary file 1
Markers of cardiomyocyte, endothelial cell, and fibroblast cell subsets in Tabula Muris heart data.
- https://cdn.elifesciences.org/articles/55730/elife-55730-supp1-v2.xlsx
-
Supplementary file 2
Velocyto splicing analysis of cardiomyocyte, endothelial cell, and fibroblast cell subsets in Tabula Muris heart expression data.
- https://cdn.elifesciences.org/articles/55730/elife-55730-supp2-v2.xlsx
-
Supplementary file 3
Diffbind analysis and annotation of ATACSeq data from GFP- and GFP+ nuclei subsets of NuTRAP hearts.
- https://cdn.elifesciences.org/articles/55730/elife-55730-supp3-v2.xlsx
-
Supplementary file 4
Diffbind analysis and annotation of ATACSeq data from freshly isolated GFP+ endothelial cell nuclei vs isolated and cultured cardiac endothelial cells.
- https://cdn.elifesciences.org/articles/55730/elife-55730-supp4-v2.xlsx
-
Transparent reporting form
- https://cdn.elifesciences.org/articles/55730/elife-55730-transrepform-v2.docx
Download links
A two-part list of links to download the article, or parts of the article, in various formats.
Downloads (link to download the article as PDF)
Open citations (links to open the citations from this article in various online reference manager services)
Cite this article (links to download the citations from this article in formats compatible with various reference manager tools)
Cardiac endothelial cells maintain open chromatin and expression of cardiomyocyte myofibrillar genes
eLife 9:e55730.
https://doi.org/10.7554/eLife.55730


